Embed Size (px)
Citation preview

THE GRID: Big 4 North American Sports League Operating Rules Fall 2016 League NFL MLB NBA NHL
Size/Season Playoffs
Roster size
32 teams, 8 divisions, 16 games. 4 rounds, 12 teams 4 wild cards 1- game knockouts with 4 1st round byes45 active / 53 total
30 teams, 6 divisions, 162 games. 4 rounds, 10 teams 4 wild cards (2012) WC play in, best of 5, best of 7, best of 7 25 active / 40 total
30 teams, 6 divisions, 82 games. 4 rounds, 16 teams, no reseeding All rounds best of 7(2003) 12 active / 15 total
30 teams, 4 divisions, 82 games. 4 rounds, 16 teams, top 3 in division + 4 wild cards; all rounds best of 7; no reseed 20 active / 23 total
Bargaining Agreement
Ten years. 2011-20. NFLPA is weak: decertified before 1993 free agency.
Five years: 2012-16. MLBPA is strong: 2002 CBA was first without stoppage
Ten years: 2011-20: Mutual option year in 2017. Work stoppages 1998-99; 2011-12.
Ten years: 2013-22, Double option. Lock-out in 2004-05 and 2012-13seasons
Free Agency Conditions
Unrestricted free agency after 4 years. Restricted after 3 years
Unrestricted free agency after 6 years. Arbitration 3-5 yrs.. Reserve 0-2 yrs.
Unrestricted after 1st contract with first refusal rights to team.
Unrestricted age 27after 4 years NHL. Restricted under age 27.
Mean Salary $2.11M in 2014 from $395K in 1990. $3.82M in 2014 from $579K in 1990. $4.9M in 2014 from $717K in 1990. $2.58M in 2014 from $221K in 1990.
Payroll Cap/ Luxury Tax
Hard cap since 1994: 47-48.5% of AR after 2013; $155.27M in 2015. Minimum payroll 89% of cap.
Luxury tax: 17.5% of payroll over $189M (2014-16); 30% - 40% for 2nd & 3rd breach and 50% for 4th breach
Soft cap since 1984: 49-51% of BRI. 2016 cap $70M, min 90% of cap. Lux tax 53.5% of BRI, 2016 threshold $84.74M.
Hard cap since 2005: 50% of hockey related revenue HRR. Cap $71.4 in 2016 Max/min payroll +15%/-15% of midpoint
Local Revenue
Gate 20% of total and shared 66/34. Venue 20% unshared.
Gate 30%, venue 28%, local media 22% of total revenue. 34% of local revenue shared.
Gate 27%, venue 15%, local media 13% of total revenue.50% of local revenue shared.
Gate 40%, venue 25%, media 20% of total. 5% of local revenue is shared.
Central Revenue
National media 60% of total, equal shares. 9 years, 2014-22 FOX, ESPN, CBS, DirecTV: $205M annually per club.
National media 20% of total, equal shares. Eight-years 2014-21 FOX, TBS and ESPN: $51.7M annually per club.
National media 27% of total, equal shares. Nine-year 2016-25 TNT and ABC/ESPN: $90.3M annually per club.
National media 20% of total, equal shares. 10-year 2012-21 NBC; 12 years Rogers Sportsnet 2014-26: $21M annual per club.
Forbes’ Mean Team Value Revenue share
V/R = $1,966M / $347M = 5.67 2014 league revenue $11.1 billion Local/National split 33%/67%
V/R = $1,200M / $262M = 4.58 2014 league revenue $7.8 billion Local/National split 50%/50%
V/R = $1,106M / $160M = 6.93 2015 league revenue $4.8 billion. Local/National split 60%/40%
V/R = $505M / $133M = 3.81 2015 league revenue $4 billion Local/National split 80%/20%
Source: John Vrooman, Vanderbilt University
Rank Designated Market Area (DMA) TV Homes NFL MLB NBA NHL MLS TOT
1 New York 7,368,320 2 2 2 3 2 11
2 Los Angeles 5,489,810 1 2 2 2 2 9
3 Chicago 3,475,220 1 2 1 1 1 6
4 Toronto 2,957,000 0 1 1 1 1 4
5 Philadelphia 2,917,920 1 1 1 1 1 5
6 Dallas‐Ft. Worth 2,646,370 1 1 1 1 1 5
7 San Francisco‐Oakland‐San Jose 2,484,690 2 2 1 1 1 7
8 Washington, DC 2,443,640 1 1 1 1 1 5
9 Boston 2,411,250 1 1 1 1 1 5
10 Atlanta 2,385,730 1 1 1 0 1 4
11 Houston 2,373,700 1 1 1 0 1 4
12 Tampa‐St. Pete 1,859,820 1 1 0 1 0 3
13 Phoenix 1,848,850 1 1 1 1 0 4
14 Detroit 1,828,230 1 1 1 1 0 4
15 Seattle‐Tacoma 1,766,070 1 1 0 0 1 3
16 Minneapolis‐St. Paul 1,723,210 1 1 1 1 1 5
17 Miami‐Ft. Lauderdale 1,660,020 1 1 1 1 1 5
18 Denver 1,576,090 1 1 1 1 1 5
19 Montreal 1,526,000 0 0 0 1 1 2
20 Cleveland‐Akron 1,493,160 1 1 1 0 0 3
21 Orlando‐Daytona Beach 1,489,710 0 0 1 0 1 2
22 Sacramento 1,349,990 0 0 1 0 0 1
23 Vancouver 1,329,000 0 0 0 1 1 2
24 Milwaukee +Green Bay (433,970) 1,316,180 1 1 1 0 0 3
25 St. Louis 1,217,370 0 1 0 1 0 2
26 Charlotte 1,168,610 1 0 1 0 0 2
27 Pittsburgh 1,154,550 1 1 0 1 0 3
28 Portland, OR 1,136,320 0 0 1 0 1 2
29 Raleigh‐Durham 1,131,460 0 0 0 1 0 1
30 Baltimore 1,099,890 1 1 0 0 0 2
31 Indianapolis 1,073,090 1 0 1 0 0 2
32 San Diego 1,055,030 1 1 0 0 0 2
33 Nashville 990,150 1 0 0 1 0 2
34 Hartford & New Haven 945,250 0 0 0 0 0 0
35 Columbus, OH 907,530 0 0 0 1 1 2
36 San Antonio 907,320 0 0 1 0 0 1
37 Kansas City 899,020 1 1 0 0 1 3
38 Salt Lake City 884,900 0 0 1 0 1 2
39 Cincinnati 868,900 1 1 0 0 0 2
40 Greenvll‐Spart‐Ashevll‐And 833,910 0 0 0 0 0 0
41 West Palm Beach‐Ft. Pierce 791,090 0 0 0 0 0 0
42 Austin 745,640 0 0 0 0 0 0
43 Las Vegas 736,700 0 0 0 0 0 0
44 Grand Rapids‐Kalmzoo‐B.Crk 717,990 0 0 0 0 0 0
45 Norfolk 706,270 0 0 0 0 0 0
46 Oklahoma City 701,070 0 0 1 0 0 1
47 Harrisburg 693,370 0 0 0 0 0 0
48 Birmingham 686,080 0 0 0 0 0 0
49 Greensboro 679,970 0 0 0 0 0 0
50 Jacksonville 665,330 1 0 0 0 0 1
51 Albuquerque‐Santa Fe 662,570 0 0 0 0 0 0
52 Louisville 653,710 0 0 0 0 0 0
53 Memphis 636,140 0 0 1 0 0 1
54 New Orleans 633,140 1 0 1 0 0 2
55 Providence‐New Bedford 603,420 0 0 0 0 0 0
56 Ottawa 592,000 0 0 0 1 0 1
57 Edmonton 592,000 0 0 0 1 0 1
58 Calgary 592,000 0 0 0 1 0 1
59 Winnipeg 592,000 0 0 0 1 0 1
60 Buffalo 585,350 1 0 0 1 0 2
TOTALS 32 30 30 30 24 146
North American TV Market Size 2016
Source: John Vrooman and Nielsen Media

Rank Team Value Revenue Gate Gate % V/R
1 Dallas Cowboys $4,000 $620 $94 15.2% 6.45
2 New England Patriots $3,200 $494 $100 20.2% 6.48
3 Washington Redskins $2,850 $439 $85 19.4% 6.49
4 New York Giants $2,800 $400 $92 23.0% 7.00
5 San Francisco 49ers $2,700 $427 $77 18.0% 6.32
6 New York Jets $2,600 $383 $77 20.1% 6.79
7 Houston Texans $2,500 $383 $65 17.0% 6.53
8 Chicago Bears $2,450 $352 $67 19.0% 6.96
9 Philadelphia Eagles $2,400 $370 $69 18.6% 6.49
10 Green Bay Packers $1,950 $347 $65 18.7% 5.62
11 Denver Broncos $1,940 $346 $70 20.2% 5.61
12 Baltimore Ravens $1,930 $345 $68 19.7% 5.59
13 Pittsburgh Steelers $1,900 $334 $61 18.3% 5.69
14 Indianapolis Colts $1,880 $321 $58 18.1% 5.86
15 Seattle Seahawks $1,870 $334 $58 17.4% 5.60
16 Miami Dolphins $1,850 $322 $57 17.7% 5.75
17 Atlanta Falcons $1,670 $303 $57 18.8% 5.51
18 Minnesota Vikings $1,590 $281 $47 16.7% 5.66
19 Carolina Panthers $1,560 $325 $65 20.0% 4.80
20 Arizona Cardinals $1,540 $308 $55 17.9% 5.00
21 Kansas City Chiefs $1,530 $307 $55 17.9% 4.98
22 San Diego Chargers $1,530 $304 $55 18.1% 5.03
23 New Orleans Saints $1,520 $322 $63 19.6% 4.72
24 Tampa Bay Buccaneers $1,510 $313 $48 15.3% 4.82
25 Cleveland Browns $1,500 $313 $50 16.0% 4.79
26 Tennessee Titans $1,490 $318 $52 16.4% 4.69
27 Jacksonville Jaguars $1,480 $315 $54 17.1% 4.70
28 St Louis Rams $1,450 $290 $45 15.5% 5.00
29 Cincinnati Bengals $1,450 $296 $49 16.6% 4.90
30 Detroit Lions $1,440 $298 $52 17.4% 4.83
31 Oakland Raiders $1,430 $285 $40 14.0% 5.02
32 Buffalo Bills $1,400 $296 $49 16.6% 4.73
NFL Averages $1,966 $347 $62 18.0% 5.67
National Football League Team Values 2015
Source: John Vrooman and Forbes

Carolina Panthers Bank of America Stadium (1996) Seating Capacity Lower Bowl: 22,714 Club Level: 11,209. Suites: 2,717 Total Lower Bowl/Suite Seating: 36,640 Upper Bowl: 37,138 Total Stadium: 73,778 Cost $248 million. Private share 76.3%
Los Angeles Rams/Raiders L.A. Memorial Coliseum (1923)Seating Capacity 91,000


Ed Jones Riverfront LA RelocationLocal revenue (Venue revenue+home gate) $100 $150 $300National revenue (Media+Visitor gate) $200 $200 $200Total Revenue $300 $350 $500Total Operating expenses $225 $240 $278Operating Profit $75 $110 $222Present Value of Net Cash Flow 30 years @3% $1,470 $2,150 $4,350Stadium Funding Rams ($150 million PSLs + $250 million Kroenke) $0 $400 $1,800NFL G-4 loan (LA relocation not eligible for G-4) $0 $200 $0Private Share Rams + NFL): 55% in St. Louis and 100% in LA $0 $600 $1,800Public Share: 45% in St. Louis and 0% in LA $0 $500 $0Franchise value = PV of cash flow - club share of venue cost $1,470 $1,750 $2,550Value/Revenue multiple 4.90 5.00 5.10Net value gain from relocation to LA over new venue in St. Louis $0 $0 $800NFL relocation indemnity fee (50/50 split of $800m LA relocation gain) $0 $0 $400Net Franchise Value $1,470 $1,750 $2,150
Alternative Futures for St. Louis Rams ($millions)
Stadium Cost: LA $1.8 billion; St. Louis $1.1 billion Source: John Vrooman, Vanderbilt University
Sands ‐Majestic Alternative
Stadium $1,300 $1,300
Practice Facility $100 $100
Land $50
Total cost $1,400 $1,450
Hotel Tax .5%/.7% increase $750 $550
Sands‐Majestic $240 $400
Raiders $410 $500
Private Funding $650 $900
Pecent Public Subsidy 53.6% 37.9%
Source: John Vrooman
Las Vegas Raiders Proposals
Stadium $1,000
Convention Center $600
Land $200
Total Cost $1,800
Hotel tax 4% increase $1,150
Chargers $350
NFL $300
Private Funding $650
Percent Public Subsidy 63.9%
Source: John Vrooman
San Diego Chargers Deal

Year Total Luxury Club PSL G‐3/4 PSL Total Private Public Private Public
Open Seats Suites Seats Seats Loan Fees Cost Cost Cost Share ShareRelocation‐ExtortionJacksonville Jaguars EverBank Field† 1995 73.0 85 11.2 … … … $141 $20 $121 14.2% 85.8%St. Louis Rams Edward Jones Dome 1995 65.3 124 6.2 53.5 … $78 $299 $0 $299 0.0% 100.0%Oakland Raiders McAfee Coliseum† 1995 63.1 143 6.3 39.0 … $68 $128 $0 $128 0.0% 100.0%Carolina Panthers Bank of America Stadium 1996 73.4 158 11.4 62.5 … $122 $248 $187 $61 76.3% 24.6%San Diego Chargers Qualcomm Stadium† 1997 71.5 113 7.8 … … … $78 $18 $60 23.1% 76.9%Washington Redskins FedEx Stadium 1997 91.7 284 15.0 … … … $251 $180 $71 72.0% 28.3%Baltimore Ravens M&T Bank Stadium 1998 69.3 108 7.9 60.2 … $65 $229 $29 $200 12.7% 87.3%Tampa Bay Bucs Raymond James Stadium 1998 66.3 195 12.3 … … … $169 $15 $154 8.9% 91.1%Tennessee Titans LP Field 1999 67.7 143 9.6 58.2 … $71 $292 $71 $221 24.3% 75.7%Cleveland Browns First Energy Stadium 1999 73.2 147 8.8 57.0 … $25 $314 $79 $235 25.2% 74.8%Cincinnati Bengals Paul Brown Stadium 2000 65.6 114 7.6 58.0 … $26 $458 $44 $414 9.6% 90.4%Pittsburgh Steelers Heinz Field 2001 64.5 129 6.6 45.0 … $37 $284 $113 $171 39.8% 60.2%Houston Texans NRG Stadium 2002 69.5 191 8.3 44.0 … $50 $449 $132 $317 33.1% 70.6%
Extortion Totals 13 Venues 70.3 149 9.2 53.0 $0 $542 $3,340 $888 $2,452 26.6% 73.4%
G‐3/4 Loan ProgramDenver Broncos Sports Authority Field 2001 76.2 124 8.2 … $48 … $401 $100 $301 24.9% 75.1%New England Patriots Gillette Stadium 2002 68.8 80 6.0 … $141 … $412 $340 $72 82.5% 17.5%Detroit Lions Ford Field 2002 64.4 132 8.6 … $100 … $500 $375 $125 75.0% 25.0%Seattle Seahawks CenturyLink Field 2002 67.0 82 7.7 8.3 $63 $17 $430 $130 $300 30.2% 69.8%Philadelphia Eagles Lincoln Financial Field 2003 67.6 172 10.8 29.0 $125 $70 $518 $330 $188 63.7% 36.3%Chicago Bears New Soldier Field 2003 61.5 133 8.6 27.5 $100 $70 $632 $200 $432 31.6% 68.4%Green Bay Packers Lambeau Field† 2003 71.0 167 6.3 58.0 $13 $93 $295 $126 $169 42.7% 57.3%Arizona Cardinals University of Phoenix 2006 63.4 88 7.5 … $42 … $455 $147 $308 32.3% 67.7%Indianapolis Colts Lucas Oil Stadium 2008 63.0 142 7.1 … $33 … $675 $100 $575 14.8% 85.2%Dallas Cowboys AT&T Stadium 2009 80.0 320 15.0 66.0 $76 470 $1,200 $850 $350 70.8% 29.2%Kansas City Chiefs Arrowhead Stadium† 2010 77.1 133 10.0 … $43 … $375 $125 $250 33.3% 66.7%New York Giants/Jets MetLife Stadium 2010 82.5 217 10.0 55.5 $300 $800 $1,600 $1,600 $0 100.0% 0.0%San Francisco 49ers Levis Stadium (G‐4) 2014 68.5 170 9.0 68.5 $200 $312 $1,310 $1,196 $114 91.3% 8.7%Minnesota Vikings US Bank Stadium (G‐4) 2016 65.4 131 8.0 49.0 $200 $151 $1,027 $529 $498 51.5% 48.5%Atlanta Falcons Mercedes Benz Stadium (G‐4) 2017 71.0 180 7.5 71.0 $200 $200 $1,400 $600 $800 42.9% 57.1%
G‐3/4 Totals 15 Venues 69.8 151.4 8.7 48.1 $1,684 $2,183 $11,230 $6,748 $4,482 60.1% 39.9%
Grand Total 28 Venues 70.1 150.2 8.9 50.6 $1,684 $2,725 $14,570 $7,636 $6,934 52.4% 47.6%
Source: John Vrooman/Vanderbilt University*Private cost includes G‐3/4 League loans and PSL fees as the present value of season cket discounts over me. †Stadium renova ons
NFL Venue Revolution since 1995 Expansion
Franchise Stadium
Following the aborted move of New England Patriots to Hartford Connecticut in 1999, the League established the G‐3 loan program for venue construction (Amendment 1999 G‐3
NFL Bylaws). Using a debt facility backed by TV revenues, the NFL loaned up to 50 percent of private stadium contribution for top six TV markets ($150 million maximum) and up to
34 percent of the private share for smaller markets ($100 million maximum). G‐3 loans are repaid from visiting team share of club‐seat premiums. The G‐3 program ended in 2007

League Expansion, Relocation and Venue Extortion /John Vrooman
Year X/R League/Club Fee a League DMAb Venuea Public%
National Football League 1995 X Carolina Panthers (NFC) 140 29 1.09 248 24.6
X Jacksonville Jaguars (AFC) 140 29 .66 c 141 85.8 R Los Angeles Raiders back to Oakland … 30 2.42 c 128 100.0 R Los Angeles Rams to St. Louis f 29 30 1.24 299 100.0
1996 R Cleveland Browns to Baltimore Ravens f 29 30 1.10 229 87.3 R Houston Oilers to Nashville f 29 30 .97 292 75.7
1999 X Cleveland Browns (AFC) 530 31 1.53 314 74.8 2002 X Houston Texans (AFC) e 700 32 2.05 449 70.6 2016 R St. Louis Rams back to Los Angeles 500 32 7.46 1,800 0.0
Major League Baseball 1993 X Colorado Rockies (NL) 95 27 1.48 231 82.3
X Florida Marlins (NL) 95 28 1.54 c … … 1998 X Arizona Diamondbacks (NL) 130 29 1.80 354 66.9
X Tampa Bay Devil Rays (AL) 130 30 1.78 218 100.0 2005 R Montreal Expos to Washington Nationals (NL) 450 30 2.31 611 100.0
National Basketball Association g 1995 X Toronto Raptors 125 28 2.60 180 d 0.0
X Vancouver Grizzlies 125 29 1.33 120 d 0.0 2001 R Vancouver Grizzlies to Memphis 30 30 .67 250 93.6 2002 R Charlotte Hornets to New Orleans 30 30 .60 c 122 100.0 2004 X Charlotte Bobcats 300 30 1.09 265 91.3 2008 R Seattle Super Sonics to OKC Thunder 30 30 .73 121 100.0
National Hockey League 1991 X San Jose Sharks 50 22 2.42 133 82.1 1992 X Ottawa Senators 50 23 .60 160 21.3
50 24 1.78 153 62.1 … 24 2.44 420 d 29.8 50 25 5.65 120 100.0 50 25 1.54 212 87.3 … 26 1.48 170 d 0.0 … 26 1.80 220 81.8 … 26 1.04 158 87.3 80 27 .97 144 100.0 80 28 2.31 213 d 20.2 80 29 .91 179 19.2 80 30 1.71 190 74.7
X Tampa Bay Lightning 1993 R Minnesota North Stars to Dallas Stars
X Anaheim Mighty Ducks X Florida Panthers
1995 R Quebec Nordiques to Colorado Avalanche 1996 R Winnipeg Jets to Phoenix Coyotes 1997 R Hartford Whalers to Carolina Hurricanes 1998 X Nashville Predators 1999 X Atlanta Thrashers 2000 X Columbus Blue Jackets X Minnesota Wild 2017 X Las Vegas Expansion Club 500 31 .73
X= Expansion R= Relocation a Venue cost and expansion/relocation fees in $millions b DMA 2007-08 Nielsen Media Designated Market Area in million households c Renovations; d Joint NBA-NHL arenas e Seattle Seahawks switched from AFC to NFC in 2002 realignment of eight divisions of 4 teams. f Relocation fee is share of PSL payments to Ravens ($65 million), Titans ($71 million) and Rams ($78 million). g NBA added Charlotte Hornets, Miami Heat (1988); Minnesota T-Wolves, Orlando Magic (1989) fee of $37.5 million.

The Cost of NHL Southern Expansion Strategy
In 1993-94 the league spent 57 percent of league revenues for player salaries. That year the player’s salaries took up $414 million of the league's $732 million in revenues. Player costs approached 76 percent of revenues at the time of the lockout in 2004-05. Beginning in 2005-06 the NHL salary cap sets the player cost limit at 57 percent of “Hockey Related Revenue.”
NHL Cost Squeeze before the 2004-05 Lockout
1993-94 2002-03
Average Player Salary $558,000 $1,790,000Total NHL Revenues $732 million $1.93 billionTotal Player Salaries $414 million $1.46 billionPlayer Cost Squeeze 56.6% 75.6%
Source: John Vrooman and NHL
NHL Player Salaries “Southern Strategy”
Season Avg. Salary
1990-91 $276,0001991-92 $368,0001992-93 $465,0001993-94 $558,0001994-95 $733,0001995-96 $892,0001996-97 $981,0001997-98 $1,167,7131998-99 $1,288,9741999-00 $1,356,3802000-01 $1,434,8852001-02 $1,642,5902002-03 $1,790,2092003-04 $1,830,1262004-05 Lockout2005-06 $1,460,000
Source: John Vrooman and NHL

RNK Designated Market Area (DMA) TVHH NFL MLB NBA NHL TOT X/R5 Toronto/GTA 2.957 0 1 1 1 3 X1
14 Seattle-Tacoma 1.848 1 1 0 0 2 X213 Phoenix 1.855 1 1 1 1 4 R119 Montreal/Quebec City 1.526 0 0 0 1 1 R117 Miami-Ft. Lauderdale 1.663 1 1 1 1 4 R225 Portland, OR 1.185 0 0 1 0 1 R227 Raleigh-Durham 1.165 0 0 0 1 1 R333 Hartford & New Haven 1.000 0 0 0 0 0 R345 Las Vegas 0.726 0 0 0 0 0 R4
Source: John Vrooman
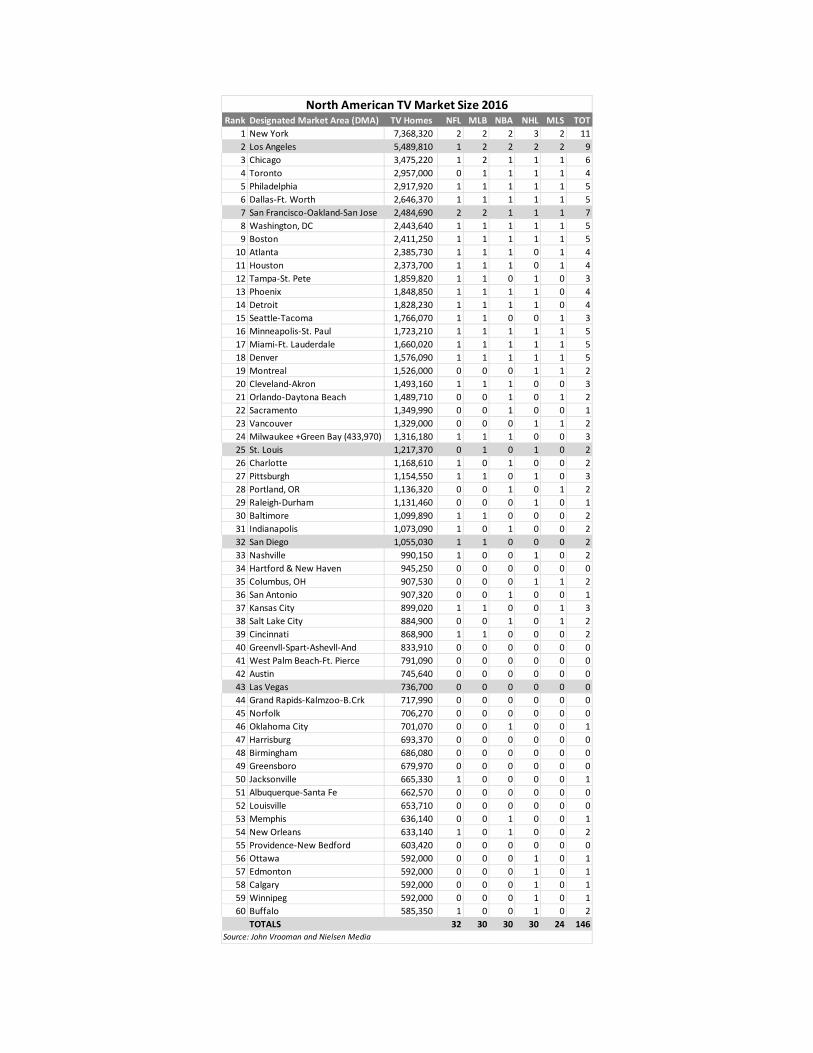
Proposed NHL Expansion/Relocation 32 Teams
Expansion (X) and relocation (R) markets
Rank Team 2015 Value Change D/V Revenue Earnings P/E V/R1 New York Rangers $1,200 9% 0% $229 $83.10 14.4 5.242 Montreal Canadiens $1,175 18% 20% $219 $91.30 12.9 5.373 Toronto Maple Leafs $1,150 -12% 11% $192 $70 16.4 5.994 Chicago Blackhawks $925 12% 0% $182 $44.80 20.6 5.085 Boston Bruins $750 0% 0% $158 $26.60 28.2 4.756 Vancouver Canucks $745 -7% 11% $152 $35.50 21.0 4.907 Philadelphia Flyers $660 6% 9% $146 $13.60 48.5 4.528 Detroit Red Wings $600 5% 33% $135 $3.70 162.2 4.449 Los Angeles Kings $580 0% 16% $132 $2.20 263.6 4.39
10 Washington Capitals $565 13% 23% $132 $5.80 97.4 4.2811 Pittsburgh Penguins $560 -1% 20% $151 $20.20 27.7 3.7112 Edmonton Oilers $455 -4% 18% $119 $17.20 26.5 3.8213 Dallas Stars $450 7% 33% $132 $17.50 25.7 3.4114 San Jose Sharks $445 5% 11% $126 $8.20 54.3 3.5315 Calgary Flames $435 -4% 6% $130 $25.90 16.8 3.3516 Anaheim Ducks $400 10% 16% $122 ($0.80) -500.0 3.2817 Minnesota Wild $380 3% 30% $125 $1.10 345.5 3.0418 Ottawa Senators $370 -7% 34% $119 $18.50 20.0 3.1119 Colorado Avalanche $360 0% 0% $106 ($3.70) -97.3 3.4020 Winnipeg Jets $350 -2% 37% $116 $10.90 32.1 3.0221 New Jersey Devils $330 0% 79% $125 $4.50 73.3 2.6422 New York Islanders $325 8% 31% $93 ($14) -23.2 3.4923 Buffalo Sabres $300 4% 27% $113 $2.80 107.1 2.6524 St Louis Blues $270 15% 24% $111 ($7.10) -38.0 2.4325 Tampa Bay Lightning $260 13% 17% $121 ($1.40) -185.7 2.1526 Nashville Predators $255 2% 33% $110 $2 127.5 2.3227 Columbus Blue Jackets $226 13% 33% $99 $4.50 50.2 2.2828 Carolina Hurricanes $225 2% 53% $99 ($11.70) -19.2 2.2729 Arizona Coyotes $220 -2% 63% $92 ($4.50) -48.9 2.3930 Florida Panthers $186 -2% 62% $93 ($20.20) -9.2 2.00
NHL Averages $505.07 3% 25% $132.63 $14.88 33.94 3.81Source: Forbes and John Vrooman
National Hockey League Values 2015

RK TEAM GMS AVG Capacity RK TEAM GMS 2015-16 Capacity1 Chicago 41 21,769 110.4% 1 Chicago 27 21,761 110.4%2 Montreal 41 21,286 100.1% 2 Montreal 23 21,288 100.1%3 Detroit 41 20,027 100.0% 3 Detroit 26 20,027 100.0%4 Philadelphia 41 19,270 98.6% 4 Boston 25 19,552 116.0%5 Washington 41 19,099 105.8% 5 Toronto 22 19,314 102.6%6 Calgary 41 19,097 99.0% 6 Calgary 23 19,135 99.2%7 Toronto 41 19,062 101.3% 7 Philadelphia 22 19,121 97.9%8 Minnesota 41 19,023 106.0% 8 Tampa Bay 24 19,092 100.0%9 Tampa Bay 41 18,823 98.0% 9 Minnesota 24 19,040 106.0%
10 Vancouver 41 18,710 98.9% 10 Pittsburgh 24 18,557 100.9%11 San Jose 41 18,707 109.2% 11 Washington 22 18,510 100.0%12 Pittsburgh 41 18,617 101.3% 12 Buffalo 26 18,415 96.6%13 Buffalo 41 18,580 97.4% 13 Vancouver 21 18,411 97.4%14 St. Louis 41 18,545 96.8% 14 Dallas 24 18,295 98.7%15 Los Angeles 41 18,265 100.2% 15 Los Angeles 24 18,259 100.2%16 Ottawa 41 18,246 95.3% 16 St. Louis 27 18,139 94.7%17 NY Rangers 41 18,006 100.0% 17 NY Rangers 24 18,006 100.0%18 Boston 41 17,565 100.0% 18 Ottawa 23 17,932 93.6%19 Dallas 41 17,350 93.6% 19 Nashville 23 16,910 98.8%20 Anaheim 41 16,874 98.3% 20 Edmonton 24 16,839 100.0%21 Nashville 41 16,854 98.5% 21 San Jose 23 16,771 95.5%22 Edmonton 41 16,839 100.0% 22 Anaheim 26 16,237 94.5%23 Colorado 41 16,176 89.8% 23 Colorado 25 16,160 89.7%24 Columbus 41 15,511 85.5% 24 Winnipeg 23 15,294 101.9%25 NY Islanders 41 15,334 94.8% 25 Florida 24 14,523 85.2%26 New Jersey 41 15,189 86.2% 26 New Jersey 24 14,512 82.3%27 Winnipeg 41 15,037 100.2% 27 Columbus 23 13,721 75.6%28 Arizona 41 13,345 77.9% 28 NY Islanders 25 13,259 83.9%29 Carolina 41 12,594 67.4% 29 Arizona 25 13,066 76.3%30 Florida 41 11,265 66.1% 30 Carolina 25 11,440 61.2%Full season As of 1/23/2016
NHL Attendance Report - 2014-15 NHL Attendance Report - 2015-16
Eastern Conference WIN% GP W L OTL PTS Western Conference WIN% GP W L OTL PTSATLANTIC CENTRALFlorida .583 48 28 15 5 61 Chicago .635 52 33 15 4 70Tampa Bay .542 48 26 18 4 56 Dallas .612 49 30 14 5 65Detroit .500 48 24 16 8 56 St. Louis .538 52 28 16 8 64Boston .532 47 25 17 5 55 Colorado .520 50 26 21 3 55Montreal .500 48 24 20 4 52 Minnesota .479 48 23 17 8 54Ottawa .469 49 23 20 6 52 Nashville .458 48 22 18 8 52Toronto .370 46 17 20 9 43 Winnipeg .438 48 21 24 3 45Buffalo .396 48 19 25 4 42METROPOLITAN PACIFICWashington .761 46 35 8 3 73 Los Angeles .625 48 30 15 3 63NY Rangers .542 48 26 17 5 57 San Jose .532 47 25 18 4 54NY Islanders .543 46 25 15 6 56 Arizona .489 47 23 19 5 51New Jersey .510 49 25 19 5 55 Vancouver .408 49 20 18 11 51Pittsburgh .489 47 23 17 7 53 Anaheim .457 46 21 18 7 49Carolina .440 50 22 20 8 52 Calgary .457 46 21 22 3 45Philadelphia .444 45 20 17 8 48 Edmonton .380 50 19 26 5 43Columbus .347 49 17 27 5 39
NHL Standings January 2016
Eastern Conference Western Conference Eastern Conference Western Conference
ATLANTIC CENTRAL Orr Division Hull DivisionBoston Bruins Chicago Blackhawks Northeast MidwestMontreal Canadiens St. Louis Blues Boston Bruins Chicago BlackhawksFlorida Panthers Minnesota Wild Montreal Canadiens St. Louis BluesDetroit Red Wings Dallas Stars Hartford Whalers (Florida) Minnesota WildOttawa Senators Winnipeg Jets Quebec City (Expansion) Columbus (New Conference)Toronto Maple Leafs Nashville PredatorsBuffalo Sabres Colorado Avalanche Great Lakes Mid-SouthTampa Bay Lightning Detroit Red Wings Dallas Stars
Ottawa Senators Winnipeg JetsMETROPOLITAN PACIFIC Toronto Maple Leafs Nashville PredatorsNY Rangers Los Angeles Kings Buffalo Sabres Colorado AvalancheNY Islanders San Jose SharksNew Jersey Devils Anaheim Ducks Lemieux Division Gretzky Division Pittsburgh Penguins Arizona Coyotes Metropolitan SouthwestPhiladelphia Fyers Vancouver Canucks NY Rangers Los Angeles KingsWashington Capitals Calgary Flames NY Islanders San Jose SharksCarolina Hurricanes Edmonton Oilers New Jersey Devils Anaheim DucksColumbus Blue Jackets Tampa Bay (New Division) Las Vegas (Arizona)
Mid-Atlantic NorthwestRelocation Pittsburgh Penguins Vancouver CanucksRealignment Philadelphia Fyers Calgary FlamesExpansion Washington Capitals Edmonton Oilers
Carolina Hurricanes Seattle (Expansion)John Vrooman, Vanderbilt University
Proposed NHL Expansion 32 ClubsCurrent 30 Club Alignment National Hockey League Expansion: Plan B

MLB Franchise Ballpark Open Seats Suites Club Cost $M Team $M Public $M Subsidy
Toronto Blue Jays Rogers Centre 1989 50.5 161 5.7 $510 $180 $330 64.7%
Chicago White Sox US Cellular Field 1991 40.6 103 1.8 $199 $0 $199 100.0%
Baltimore Orioles Camden Yards 1992 48.2 72 4.6 $234 $24 $210 89.7%
Cleveland Indians Progressive Field 1994 43.4 126 2.1 $230 $70 $160 69.6%
Texas Rangers Globe Life Park in Arlington 1994 48.9 126 5.7 $192 $48 $144 75.0%
Colorado Rockies Coors Field 1995 50.4 62 4.4 $231 $41 $190 82.3%
Atlanta Braves Turner Field 1997 50.1 64 5.4 $260 $51 $209 80.4%
Anaheim Angels Angel Stadium of Anaheim* 1997 45.1 68 5.1 $118 $88 $30 25.4%
Arizona Diamondbacks Chase Field 1998 49.0 69 4.4 $354 $117 $237 66.9%
Tampa Bay Devil Rays Tropicana Field 1998 41.3 70 2.8 $218 $0 $218 100.0%
Seattle Mariners Safeco Field 1999 47.4 69 4.3 $517 $139 $378 73.1%
Detroit Tigers Comerica Park 2000 41.1 102 3.0 $360 $225 $135 37.5%
Houston Astros Minute Maid Park 2000 41.0 63 4.8 $299 $70 $229 76.6%
San Francisco Giants AT&T Park 2000 41.6 65 5.3 $319 $304 $15 4.7%
Milwaukee Brewers Miller Park 2001 42.4 75 3.4 $414 $90 $324 78.3%
Pittsburgh Pirates PNC Park 2001 38.4 72 3.4 $262 $40 $222 84.7%
Cincinnati Reds Great American Ball Park 2003 42.1 57 4.2 $330 $60 $270 81.8%
Philadelphia Phillies Citizens Bank Park 2004 43.5 72 6.6 $346 $172 $174 50.3%
San Diego Padres Petco Park 2004 42.5 55 5.0 $449 $146 $303 67.5%
St. Louis Cardinals Busch Stadium III 2006 44.0 62 5.0 $388 $300 $88 22.7%
Washington Nationals Nationals Park 2008 41.0 66 2.5 $686 $85 $601 87.6%
New York Mets Citi Field 2009 45.0 54 7.8 $771 $324 $447 58.0%
New York Yankees New Yankee Stadium 2009 51.8 67 4.3 $1,005 $524 $481 47.9%
Minnesota Twins Target Field 2010 42.0 60 4.0 $522 $130 $392 75.1%
Kansas City Royals Kauffman Stadium* 2010 37.9 40 2.5 $250 $25 $225 90.0%
Florida Marlins Marlins Park 2011 37.0 47 3.0 $640 $155 $485 75.8%
Atlanta Braves SunTrust Park 2017 41.5 4.0 $672 $280 $392 58.3%
MLB Average 27 Clubs 44.1 75 4.3 $399 $137 $263 65.8%
MLB Totals 27 Clubs $10,776 $3,688 $7,088 65.8%
MLB Parks since Camden Yards
Source: John Vrooman, Vanderbilt University


NFL 2015 MLB 2015 NBA 2016 NHL 2016
Carolina Panthers .938 St. Louis Cardinals .617 Golden State Warriors .890 Washington Capitals .683
Arizona Cardinals .813 Pittsburgh Pirates .605 San Antonio Spurs .817 Dallas Stars .610
Cincinnati Bengals .750 Chicago Cubs .599 Cleveland Cavaliers .695 St. Louis Blues .598
Denver Broncos .750 Kansas City Royals .586 Toronto Raptors .683 Los Angeles Kings .585
New England Patriots .750 Toronto Blue Jays .574 Oklahoma City Thunder .671 Pittsburgh Penguins .585
Kansas City Chiefs .688 Los Angeles Dodgers .568 Los Angeles Clippers .646 Chicago Blackhawks .573
Minnesota Vikings .688 N.Y. Mets .556 Atlanta Hawks .585 Florida Panthers .573
Green Bay Packers .625 Texas Rangers .543 Boston Celtics .585 Anaheim Ducks .561
New York Jets .625 N.Y. Yankees .537 Charlotte Bobcats .585 New York Rangers .561
Pittsburgh Steelers .625 Houston Astros .531 Miami Heat .585 San Jose Sharks .561
Seattle Seahawks .625 Los Angeles Angels .525 Indiana Pacers .549 Tampa Bay Lightning .561
Houston Texans .563 San Francisco Giants .519 Detroit Pistons .537 New York Islanders .549
Washington Redskins .563 Minnesota Twins .512 Portland Trail Blazers .537 Boston Bruins .512
Atlanta Falcons .500 Washington Nationals .512 Chicago Bulls .512 Detroit Red Wings .500
Buffalo Bills .500 Cleveland Indians .503 Dallas Mavericks .512 Nashville Predators .500
Indianapolis Colts .500 Baltimore Orioles .500 Memphis Grizzlies .512 Philadelphia Flyers .500
Detroit Lions .438 Tampa Bay D‐Rays .494 Houston Rockets .500 Colorado Avalanche .476
New Orleans Saints .438 Arizona D‐Backs .488 Washington Wizards .500 Minnesota Wild .463
Oakland Raiders .438 Boston Red Sox .481 Utah Jazz .488 Montreal Canadiens .463
Philadelphia Eagles .438 Chicago White Sox .469 Orlando Magic .427 New Jersey Devils .463
St. Louis Rams .438 Seattle Mariners .469 Denver Nuggets .402 Ottawa Senators .463
Chicago Bears .375 Detroit Tigers .460 Milwaukee Bucks .402 Arizona Coyotes .427
Miami Dolpins .375 San Diego Padres .457 Sacramento Kings .402 Buffalo Sabres .427
New York Giants .375 Miami Marlins .438 New York Knicks .390 Calgary Flames .427
Tampa Buccaneers .375 Colorado Rockies .420 New Orleans Hornets .366 Carolina Hurricanes .427
Baltimore Ravens .313 Milwaukee Brewers .420 Minnesota T‐Wolves .354 Winnipeg Jets .427
Jacksonville Jaguars .313 Oakland Athletics .420 Phoenix Suns .280 Columbus Blue Jackets .415
San Francisco 49ers .313 Atlanta Braves .414 Brooklyn Nets .256 Edmonton Oilers .378
Dallas Cowboys .250 Cincinnati Reds .395 Los Angeles Lakers .207 Vancouver Canucks .378
San Diego Chargers .250 Philadelphia Phillies .389 Philadelphia 76ers .122 Toronto Maple Leafs .354
Cleveland Browns .188
Tennessee Titans .188
Standard Deviation .190 Standard Deviation .064 Standard Deviation .169 Standard Deviation .081
ideal for n=16 .125 ideal for n=162 .039 ideal for n=82 .055 *‐ideal for n=82 .055
balance index .656 balance index .610 balance index .326 balance index .684
Big 4 Win Distributions for 2015‐16


Rank Team Conf WIN% W L Gamma Luck Logit Luck Kenpom Luck OFF/100 DEF/100 NET/100 TEMP1 Kansas B12 .882 30 4 .840 .043 .853 .030 .950 .062 118.9 92.0 26.9 69.72 Virginia ACC .788 26 7 .836 (.048) .849 (.061) .948 (.043) 118.3 91.9 26.4 61.43 Michigan St. B10 .853 29 5 .831 .022 .850 .003 .945 (.004) 121.3 94.8 26.5 67.44 North Carolina ACC .818 27 6 .825 (.007) .842 (.023) .941 (.043) 119.5 94.0 25.5 72.05 Villanova BE .853 29 5 .816 .036 .831 .022 .935 .012 117.2 93.0 24.2 67.46 West Virginia B12 .765 26 8 .802 (.038) .814 (.050) .924 .008 114.8 92.4 22.4 70.57 Oklahoma B12 .781 25 7 .798 (.016) .811 (.030) .920 .008 115.4 93.3 22.1 70.88 Kentucky SEC .765 26 8 .797 (.033) .823 (.059) .920 (.035) 122.3 98.9 23.4 67.69 Oregon P12 .824 28 6 .788 .035 .810 .013 .912 .035 119.4 97.4 22.0 68.7
10 Purdue B10 .765 26 8 .783 (.018) .799 (.034) .908 (.031) 115.3 94.5 20.8 68.311 Louisville ACC .742 23 8 .776 (.034) .782 (.040) .902 (.024) 109.7 90.5 19.2 66.912 Wichita St. MVC .750 24 8 .775 (.025) .780 (.030) .901 (.080) 108.9 89.9 19.0 67.013 Miami FL ACC .781 25 7 .771 .010 .792 (.010) .897 .054 117.2 97.1 20.1 66.814 Indiana B10 .781 25 7 .770 .011 .794 (.012) .896 (.003) 119.0 98.7 20.3 68.815 Xavier BE .844 27 5 .768 .076 .787 .057 .895 .067 115.8 96.2 19.6 72.916 Arizona P12 .758 25 8 .767 (.010) .787 (.029) .893 (.033) 116.1 96.5 19.6 69.217 Texas A&M SEC .765 26 8 .766 (.001) .779 (.014) .892 .002 112.6 93.7 18.9 67.518 Iowa St. B12 .656 21 11 .766 (.109) .793 (.136) .892 (.070) 120.5 100.3 20.2 71.819 SMU Amer .833 25 5 .764 .069 .784 .049 .891 .015 116.4 97.0 19.4 66.620 Iowa B10 .677 21 10 .757 (.080) .775 (.097) .883 (.099) 114.4 95.9 18.5 69.921 California P12 .697 23 10 .751 (.054) .764 (.067) .877 (.051) 111.3 93.8 17.5 68.822 Duke ACC .697 23 10 .749 (.052) .776 (.079) .875 (.039) 119.3 100.7 18.6 68.523 Maryland B10 .758 25 8 .746 .012 .764 (.006) .873 .006 113.8 96.3 17.5 68.024 Baylor B12 .667 22 11 .745 (.078) .768 (.102) .871 .002 116.9 99.0 17.9 67.325 Connecticut Amer .706 24 10 .742 (.036) .755 (.049) .868 (.040) 110.4 93.7 16.7 66.326 Seton Hall BE .758 25 8 .742 .016 .755 .003 .867 .008 110.7 94.0 16.7 70.327 Vanderbilt SEC .594 19 13 .739 (.145) .756 (.162) .864 (.110) 112.9 96.1 16.8 68.628 Gonzaga WCC .788 26 7 .736 .052 .756 .032 .861 (.025) 114.6 97.8 16.8 68.029 Utah P12 .765 26 8 .729 .035 .749 .016 .855 .110 113.7 97.5 16.2 66.530 Texas B12 .625 20 12 .724 (.099) .741 (.116) .849 .037 111.5 96.0 15.5 66.3
Vroomdaddy NCAA Men's Basketball Projections 2015-16
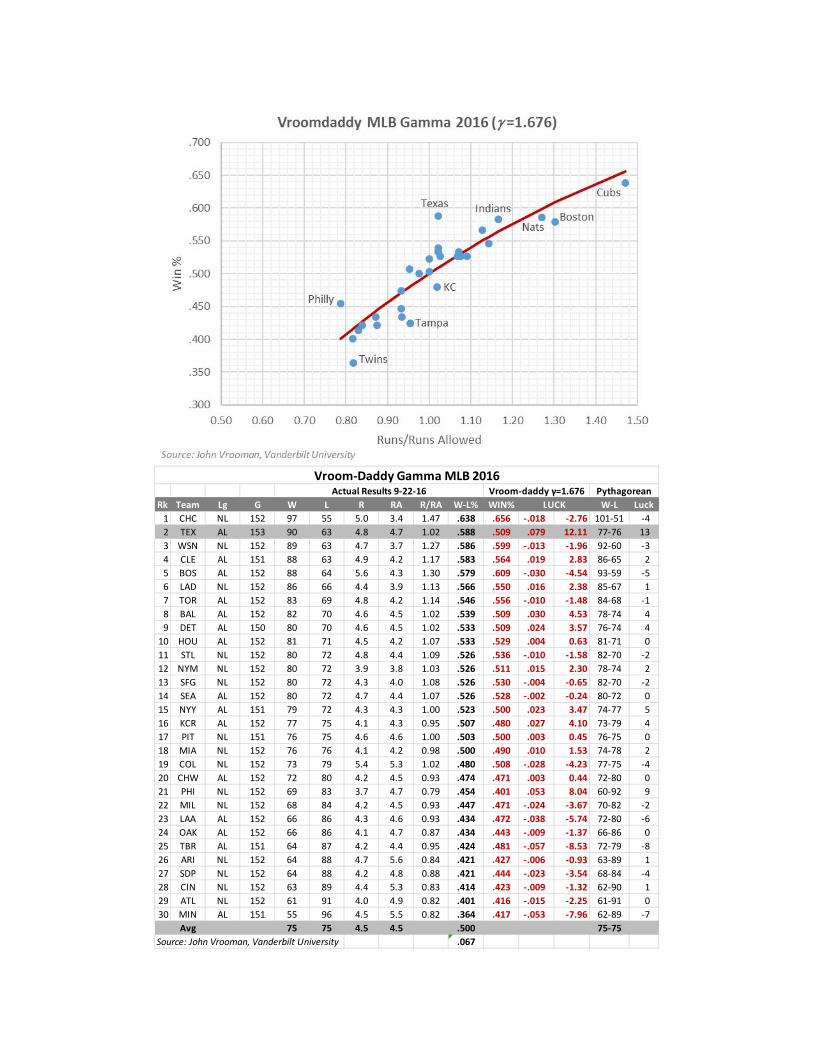
Rk Team Lg G W L R RA R/RA W-L% WIN% W-L Luck1 CHC NL 152 97 55 5.0 3.4 1.47 .638 .656 -.018 -2.76 101-51 -42 TEX AL 153 90 63 4.8 4.7 1.02 .588 .509 .079 12.11 77-76 133 WSN NL 152 89 63 4.7 3.7 1.27 .586 .599 -.013 -1.96 92-60 -34 CLE AL 151 88 63 4.9 4.2 1.17 .583 .564 .019 2.83 86-65 25 BOS AL 152 88 64 5.6 4.3 1.30 .579 .609 -.030 -4.54 93-59 -56 LAD NL 152 86 66 4.4 3.9 1.13 .566 .550 .016 2.38 85-67 17 TOR AL 152 83 69 4.8 4.2 1.14 .546 .556 -.010 -1.48 84-68 -18 BAL AL 152 82 70 4.6 4.5 1.02 .539 .509 .030 4.53 78-74 49 DET AL 150 80 70 4.6 4.5 1.02 .533 .509 .024 3.57 76-74 4
10 HOU AL 152 81 71 4.5 4.2 1.07 .533 .529 .004 0.63 81-71 011 STL NL 152 80 72 4.8 4.4 1.09 .526 .536 -.010 -1.58 82-70 -212 NYM NL 152 80 72 3.9 3.8 1.03 .526 .511 .015 2.30 78-74 213 SFG NL 152 80 72 4.3 4.0 1.08 .526 .530 -.004 -0.65 82-70 -214 SEA AL 152 80 72 4.7 4.4 1.07 .526 .528 -.002 -0.24 80-72 015 NYY AL 151 79 72 4.3 4.3 1.00 .523 .500 .023 3.47 74-77 516 KCR AL 152 77 75 4.1 4.3 0.95 .507 .480 .027 4.10 73-79 417 PIT NL 151 76 75 4.6 4.6 1.00 .503 .500 .003 0.45 76-75 018 MIA NL 152 76 76 4.1 4.2 0.98 .500 .490 .010 1.53 74-78 219 COL NL 152 73 79 5.4 5.3 1.02 .480 .508 -.028 -4.23 77-75 -420 CHW AL 152 72 80 4.2 4.5 0.93 .474 .471 .003 0.44 72-80 021 PHI NL 152 69 83 3.7 4.7 0.79 .454 .401 .053 8.04 60-92 922 MIL NL 152 68 84 4.2 4.5 0.93 .447 .471 -.024 -3.67 70-82 -223 LAA AL 152 66 86 4.3 4.6 0.93 .434 .472 -.038 -5.74 72-80 -624 OAK AL 152 66 86 4.1 4.7 0.87 .434 .443 -.009 -1.37 66-86 025 TBR AL 151 64 87 4.2 4.4 0.95 .424 .481 -.057 -8.53 72-79 -826 ARI NL 152 64 88 4.7 5.6 0.84 .421 .427 -.006 -0.93 63-89 127 SDP NL 152 64 88 4.2 4.8 0.88 .421 .444 -.023 -3.54 68-84 -428 CIN NL 152 63 89 4.4 5.3 0.83 .414 .423 -.009 -1.32 62-90 129 ATL NL 152 61 91 4.0 4.9 0.82 .401 .416 -.015 -2.25 61-91 030 MIN AL 151 55 96 4.5 5.5 0.82 .364 .417 -.053 -7.96 62-89 -7
Avg 75 75 4.5 4.5 .500 75-75Source: John Vrooman, Vanderbilt University .067
Vroom-Daddy Gamma MLB 2016Actual Results 9-22-16 Vroom-daddy γ=1.676 Pythagorean
LUCK


Year Age Team G Salary WAR $M/WAR Year Age Team G Salary WAR $M/WAR2007 26 Cincinnati Reds 90 $380,000 2.5 $0.15 2011 19 Los Angeles Angels 40 $414,000 0.7 $0.592008 27 Texas Rangers 156 $396,830 5.4 $0.07 2012 20 Los Angeles Angels 139 $480,000 10.8 $0.042009 28 Texas Rangers 89 $555,000 0.6 $0.93 2013 21 Los Angeles Angels 157 $510,000 8.9 $0.062010 29 Texas Rangers 133 $3,250,000 8.7 $0.37 2014 22 Los Angeles Angels 157 $1,000,000 7.9 $0.132011 30 Texas Rangers 121 $8,750,000 3.7 $2.36 2015 23 Los Angeles Angels $5,250,000 9.4 $0.562012 31 Texas Rangers 148 $13,750,000 3.9 $3.53 2016 24 Los Angeles Angels $15,250,0002013 32 Los Angeles Angels 151 $17,000,000 1.5 $11.33 2017 25 Los Angeles Angels $19,250,0002014 33 Los Angeles Angels 89 $17,000,000 1.4 $12.14 2018 26 Los Angeles Angels $33,250,0002015 34 Los Angeles Angels 39 $25,400,000 2019 27 Los Angeles Angels $33,250,0002016 35 Texas Rangers $28,410,000 2020 28 Los Angeles Angels $33,250,0002017 36 Texas Rangers $28,410,000
Year Age Team G Salary WAR $M/WAR Year Age Team G Salary WAR $M/WAR1998 21 Kansas City Royals 14 $170,000 0.3 $0.57 2001 20 Cleveland Indians 33 $200,000 2.9 $0.071999 22 Kansas City Royals 156 $200,000 4.7 $0.04 2002 21 Cleveland Indians 33 $700,000 3.2 $0.222000 23 Kansas City Royals 98 $350,000 0.8 $0.44 2003 22 Cleveland Indians 30 $1,100,000 3.7 $0.302001 24 Kansas City Royals 155 $425,000 6.4 $0.07 2004 23 Cleveland Indians 30 $2,700,000 3 $0.902002 25 Kansas City Royals 162 $3,500,000 4.3 $0.81 2005 24 Cleveland Indians 31 $5,250,000 1.8 $2.922003 26 Kansas City Royals 141 $6,000,000 5.8 $1.03 2006 25 Cleveland Indians 28 $7,000,000 4.6 $1.522004 27 Kansas City Royals 69 $9,000,000 2.3 $1.32 2007 26 Cleveland Indians 34 $8,750,000 6.3 $1.392004 HOU:Trade 90 4.5 $1.32 2008 27 Cleveland Indians 18 $11,000,000 1.9 $1.622005 28 New York Mets 151 $11,571,429 2.9 $3.99 2008 MIL:Trade 17 4.9 $1.622006 29 New York Mets 140 $13,571,428 8.2 $1.66 2009 28 New York Yankees 34 $15,285,714 6.2 $2.472007 30 New York Mets 144 $13,571,429 5.4 $2.51 2010 29 New York Yankees 34 $24,285,714 4.6 $5.282008 31 New York Mets 161 $18,622,809 6.9 $2.70 2011 30 New York Yankees 33 $24,285,714 7.5 $3.242009 32 New York Mets 81 $19,243,682 3.6 $5.35 2012 31 New York Yankees 28 $23,000,000 3.5 $6.572010 33 New York Mets 64 $19,401,569 0.7 $27.72 2013 32 New York Yankees 32 $23,000,000 0.3 $76.672011 34 New York Mets 98 $19,325,436 3.6 $4.20 2014 33 New York Yankees 8 $23,000,000 -0.6 -$38.332011 SFG:Trade 44 1.0 $4.20 2015 34 New York Yankees $23,000,000 0.3 $76.672012 35 St. Louis Cardinals 151 $13,000,000 3.9 $3.33 2016 35 New York Yankees $25,000,0002013 36 St. Louis Cardinals 145 $13,000,000 2.4 $5.42 2017 36 New York Yankees $25,000,0002014 37 New York Yankees 109 $15,000,000 -0.2 -$75.002015 38 New York Yankees $15,000,000 0.8 $18.752016 39 New York Yankees $15,000,000
Year Age Team G Salary WAR $M/WARYear Age Team G Salary WAR $M/WAR 2009 22 San Francisco Giants 7 $400,000 -0.1 -$4.002008 20 Los Angeles Dodgers 22 $390,000 1.4 $0.28 2010 23 San Francisco Giants 108 $400,000 3.9 $0.102009 21 Los Angeles Dodgers 31 $404,000 4.7 $0.09 2011 24 San Francisco Giants 45 $575,000 1.4 $0.412010 22 Los Angeles Dodgers 32 $440,000 5.5 $0.08 2012 25 San Francisco Giants 148 $615,000 7.3 $0.082011 23 Los Angeles Dodgers 33 $500,000 6.5 $0.08 2013 26 San Francisco Giants 148 $8,000,000 4.9 $1.632012 24 Los Angeles Dodgers 33 $8,000,000 6.2 $1.29 2014 27 San Francisco Giants 147 $12,500,000 5.3 $2.362013 25 Los Angeles Dodgers 33 $11,000,000 7.8 $1.41 2015 28 San Francisco Giants $16,500,000 5.4 $3.062014 26 Los Angeles Dodgers 27 $22,000,000 7.5 $2.93 2016 29 San Francisco Giants $20,000,0002015 27 Los Angeles Dodgers $30,000,000 6.3 $3.49 2017 30 San Francisco Giants $21,400,0002016 28 Los Angeles Dodgers $32,000,000 2018 31 San Francisco Giants $21,400,0002017 29 Los Angeles Dodgers $33,000,000 2019 32 San Francisco Giants $21,400,0002018 30 Los Angeles Dodgers $33,000,000 Player option 2020 33 San Francisco Giants $21,400,0002019 31 Los Angeles Dodgers $32,000,000 2021 34 San Francisco Giants $21,400,0002020 32 Los Angeles Dodgers $33,000,000 2022 35 San Francisco Giants $22,000,000 Team option ($3M)
CARLOS BELTRAN: 3 years/$45M (2014-16) CC SABATHIA: 5 years/$122M (2012-16), plus 2017 option
BUSTER POSEY: 9 years/$167M (2013-21), plus 2022 team optionCLAYTON KERSHAW: 7 years/$215M (2014-20)
MAJOR LEAGUE BASEBALL SELECTED PLAYER CONTRACTSJOSH HAMILTON: 5 years/$125M (2013-17) MIKE TROUT: 6 years/$144.5M (2015-20)
$20,710,000$26,410,000$26,410,000

MLB Player Salaries Indexed to National Average Wage 1964-84


RNK Designated Market Area TVHH NFL MLB NBA NHL TOT1 New York 7.461 2 2 2 3 92 Los Angeles 5.666 0 2 2 2 63 Chicago 3.534 1 2 1 1 54 Philadelphia 2.964 1 1 1 1 45 Toronto 2.957 0 1 1 1 36 Dallas-Ft. Worth 2.655 1 1 1 1 47 San Francisco-Oakland-San Jose 2.519 2 2 1 1 68 Boston 2.433 1 1 1 1 49 Washington, DC 2.412 1 1 1 1 4
10 Atlanta 2.375 1 1 1 0 311 Houston 2.289 1 1 1 0 312 Detroit 1.856 1 1 1 1 413 Phoenix 1.855 1 1 1 1 414 Seattle-Tacoma 1.848 1 1 0 0 215 Tampa-St. Pete 1.828 1 1 0 1 316 Minneapolis-St. Paul 1.748 1 1 1 1 417 Miami-Ft. Lauderdale 1.663 1 1 1 1 418 Denver 1.575 1 1 1 1 419 Montreal/Quebec City 1.526 0 0 0 1 120 Orlando-Daytona Beach 1.490 0 0 1 0 121 Cleveland-Akron 1.485 1 1 1 0 322 Sacramento 1.388 0 0 1 0 123 Vancouver 1.329 0 0 0 1 124 St. Louis 1.255 1 1 0 1 325 Portland, OR 1.185 0 0 1 0 126 Pittsburgh 1.182 1 1 0 1 327 Raleigh-Durham 1.165 0 0 0 1 128 Charlotte 1.158 1 0 1 0 229 Indianapolis 1.097 1 0 1 0 230 Baltimore 1.095 1 1 0 0 231 San Diego 1.081 1 1 0 0 232 Nashville 1.043 1 0 0 1 2
North American TV Market Size (million TV households)

Rank Team Value Revenue Gate Gate% Income V/R
1 Dallas Cowboys $4,200 $700 $98 14.0% $300 6.00
2 New England Patriots $3,400 $523 $99 18.9% $212 6.50
3 New York Giants $3,100 $444 $96 21.6% $133 6.98
4 San Francisco 49ers $3,000 $446 $76 17.0% $154 6.73
5 Washington Redskins $2,950 $447 $80 17.9% $115 6.60
6 Los Angeles Rams $2,900 $317 $43 13.6% $67 9.15
7 New York Jets $2,750 $423 $77 18.2% $102 6.50
8 Chicago Bears $2,700 $385 $67 17.4% $104 7.01
9 Houston Texans $2,600 $416 $64 15.4% $129 6.25
10 Philadelphia Eagles $2,500 $407 $69 17.0% $105 6.14
11 Denver Broncos $2,400 $387 $71 18.3% $82 6.20
12 Miami Dolphins $2,375 $359 $58 16.2% $58 6.62
13 Green Bay Packers $2,350 $391 $65 16.6% $101 6.01
14 Baltimore Ravens $2,300 $378 $68 18.0% $103 6.08
15 Pittsburgh Steelers $2,250 $376 $63 16.8% $68 5.98
16 Seattle Seahawks $2,225 $377 $62 16.4% $67 5.90
17 Minnesota Vikings $2,200 $306 $46 15.0% $51 7.19
18 Indianapolis Colts $2,175 $336 $54 16.1% $68 6.47
19 Atlanta Falcons $2,125 $336 $56 16.7% $69 6.32
20 Oakland Raiders $2,100 $301 $40 13.3% $46 6.98
21 San Diego Chargers $2,080 $344 $54 15.7% $59 6.05
22 Carolina Panthers $2,075 $362 $67 18.5% $53 5.73
23 Arizona Cardinals $2,025 $348 $56 16.1% $95 5.82
24 Tennessee Titans $2,000 $342 $48 14.0% $73 5.85
25 Jacksonville Jaguars $1,950 $344 $54 15.7% $92 5.67
26 Kansas City Chiefs $1,875 $340 $55 16.2% $62 5.51
27 Cleveland Browns $1,850 $347 $54 15.6% $53 5.33
28 Tampa Bay Buccaneers $1,800 $341 $49 14.4% $75 5.28
29 New Orleans Saints $1,750 $358 $62 17.3% $77 4.89
30 Cincinnati Bengals $1,675 $329 $48 14.6% $60 5.09
31 Detroit Lions $1,650 $321 $51 15.9% $64 5.14
32 Buffalo Bills $1,500 $326 $50 15.3% $26 4.60
NFL Average $2,338 $380 $63 16.5% $91 6.16
NFL Franchise Values 2016
Sources: Forbes and Vrooman

Rank Team Value D/V Revenue Income V/R1 Dallas Cowboys $4,000 5% $620 $270.0 6.452 New England Patriots $3,200 7% $494 $195.0 6.483 Washington Redskins $2,850 8% $439 $124.9 6.494 New York Giants $2,800 18% $400 $105.2 7.005 San Francisco 49ers $2,700 21% $427 $123.7 6.326 New York Jets $2,600 23% $383 $118.4 6.797 Houston Texans $2,500 7% $383 $114.6 6.538 Chicago Bears $2,450 4% $352 $85.7 6.969 Philadelphia Eagles $2,400 8% $370 $88.7 6.49
10 Green Bay Packers $1,950 6% $347 $63.3 5.6211 Denver Broncos $1,940 6% $346 $65.8 5.6112 Baltimore Ravens $1,930 14% $345 $59.8 5.5913 Pittsburgh Steelers $1,900 11% $334 $54.0 5.6914 Indianapolis Colts $1,880 3% $321 $90.1 5.8615 Seattle Seahawks $1,870 6% $334 $43.6 5.6016 Miami Dolphins $1,850 19% $322 $41.5 5.7517 Atlanta Falcons $1,670 51% $303 $25.4 5.5118 Minnesota Vikings $1,590 31% $281 $34.5 5.6619 Carolina Panthers $1,560 4% $325 $77.8 4.8020 Arizona Cardinals $1,540 10% $308 $57.2 5.0021 Kansas City Chiefs $1,530 5% $307 $48.6 4.9822 San Diego Chargers $1,530 7% $304 $64.8 5.0323 New Orleans Saints $1,520 5% $322 $70.0 4.7224 Tampa Bay Buccaneers $1,510 12% $313 $55.2 4.8225 Cleveland Browns $1,500 13% $313 $34.7 4.7926 Tennessee Titans $1,490 10% $318 $50.5 4.6927 Jacksonville Jaguars $1,480 7% $315 $67.0 4.7028 St Louis Rams $1,450 8% $290 $34.0 5.0029 Cincinnati Bengals $1,450 7% $296 $55.5 4.9030 Detroit Lions $1,440 19% $298 $36.1 4.8331 Oakland Raiders $1,430 14% $285 $39.0 5.0232 Buffalo Bills $1,400 14% $296 $44.2 4.73
32 Team Average $1,966 12% $347 $76.2 5.67
National Football League Franchise Values 2015
Source: John Vrooman and Forbes

Rank Team Value D/V Revenue Income V/R1 New York Yankees $3,200 0% $508 $8.1 6.302 Los Angeles Dodgers $2,400 17% $403 ($12.2) 5.963 Boston Red Sox $2,100 0% $370 $49.2 5.684 San Francisco Giants $2,000 4% $387 $68.4 5.175 Chicago Cubs $1,800 24% $302 $73.3 5.966 St Louis Cardinals $1,400 21% $294 $73.6 4.767 New York Mets $1,350 26% $263 $25.0 5.138 Los Angeles Angels $1,300 0% $304 $16.7 4.289 Washington Nationals $1,280 27% $287 $41.4 4.46
10 Philadelphia Phillies $1,250 8% $265 ($39.0) 4.7211 Texas Rangers $1,220 13% $266 $3.5 4.5912 Atlanta Braves $1,150 0% $267 $33.2 4.3113 Detroit Tigers $1,125 15% $254 ($20.7) 4.4314 Seattle Mariners $1,100 0% $250 $26.4 4.4015 Baltimore Orioles $1,000 15% $245 $31.4 4.0816 Chicago White Sox $975 5% $227 $31.9 4.3017 Pittsburgh Pirates $900 10% $229 $43.6 3.9318 Minnesota Twins $895 25% $223 $21.3 4.0119 San Diego Padres $890 22% $224 $35.0 3.9720 Cincinnati Reds $885 6% $227 $2.2 3.9021 Milwaukee Brewers $875 6% $226 $11.3 3.8722 Toronto Blue Jays $870 0% $227 ($17.9) 3.8323 Colorado Rockies $855 7% $214 $12.6 4.0024 Arizona Diamondbacks $840 17% $211 ($2.2) 3.9825 Cleveland Indians $825 9% $207 $8.9 3.9926 Houston Astros $800 34% $175 $21.6 4.5727 Oakland Athletics $725 8% $202 $20.8 3.5928 Kansas City Royals $700 8% $231 $26.6 3.0329 Miami Marlins $650 34% $188 $15.4 3.4630 Tampa Bay Rays $625 22% $188 $7.9 3.32
30-Team Averages $1,200 13% $262 $20.6 4.58Source: John Vrooman and Forbes
Major League Baseball Franchise Values 2015

Rank Team Value D/V Revenue Income V/R1 Los Angeles Lakers $2,600 2% $293 $104.1 8.872 New York Knicks $2,500 0% $278 $53.4 8.993 Chicago Bulls $2,000 3% $201 $65.3 9.954 Boston Celtics $1,700 9% $173 $54.9 9.835 Los Angeles Clippers $1,600 0% $146 $20.1 10.966 Brooklyn Nets $1,500 19% $212 ($99.4) 7.087 Golden State Warriors $1,300 12% $168 $44.9 7.748 Houston Rockets $1,250 8% $175 $38.0 7.149 Miami Heat $1,175 8% $188 $12.6 6.25
10 Dallas Mavericks $1,150 17% $168 $30.4 6.8511 San Antonio Spurs $1,000 8% $172 $40.9 5.8112 Portland Trail Blazers $940 11% $153 $11.7 6.1413 Oklahoma City Thunder $930 15% $152 $30.8 6.1214 Toronto Raptors $920 16% $151 $17.9 6.0915 Cleveland Cavaliers $915 22% $149 $20.6 6.1416 Phoenix Suns $910 20% $145 $28.2 6.2817 Washington Wizards $900 14% $143 $10.1 6.2918 Orlando Magic $875 17% $143 $20.9 6.1219 Denver Nuggets $855 1% $136 $14.0 6.2920 Utah Jazz $850 6% $142 $32.7 5.9921 Indiana Pacers $830 18% $139 $25.0 5.9722 Atlanta Hawks $825 21% $133 $14.8 6.2023 Detroit Pistons $810 23% $144 $17.6 5.6324 Sacramento Kings $800 29% $125 $8.9 6.4025 Memphis Grizzlies $750 23% $135 $10.5 5.5626 Charlotte Bobcats $725 21% $130 $1.2 5.5827 Philadelphia 76ers $700 21% $125 $24.4 5.6028 New Orleans Pelicans $650 19% $131 $19.0 4.9629 Minnesota Timberwolves $625 16% $128 $6.9 4.8830 Milwaukee Bucks $600 29% $110 $11.5 5.45
30-Team Averages $1,106 14% $159.6 $23.1 6.93
National Basketball Association Franchise Values 2015
Source: John Vrooman and Forbes

Rank Team 2015 Value D/V Revenue Income V/R1 New York Rangers $1,200 0% $229 $83.1 5.242 Montreal Canadiens $1,175 20% $219 $91.3 5.373 Toronto Maple Leafs $1,150 11% $192 $70.0 5.994 Chicago Blackhawks $925 0% $182 $44.8 5.085 Boston Bruins $750 0% $158 $26.6 4.756 Vancouver Canucks $745 11% $152 $35.5 4.907 Philadelphia Flyers $660 9% $146 $13.6 4.528 Detroit Red Wings $600 33% $135 $3.7 4.449 Los Angeles Kings $580 16% $132 $2.2 4.39
10 Washington Capitals $565 23% $132 $5.8 4.2811 Pittsburgh Penguins $560 20% $151 $20.2 3.7112 Edmonton Oilers $455 18% $119 $17.2 3.8213 Dallas Stars $450 33% $132 $17.5 3.4114 San Jose Sharks $445 11% $126 $8.2 3.5315 Calgary Flames $435 6% $130 $25.9 3.3516 Anaheim Ducks $400 16% $122 ($0.8) 3.2817 Minnesota Wild $380 30% $125 $1.1 3.0418 Ottawa Senators $370 34% $119 $18.5 3.1119 Colorado Avalanche $360 0% $106 ($3.7) 3.4020 Winnipeg Jets $350 37% $116 $10.9 3.0221 New Jersey Devils $330 79% $125 $4.5 2.6422 New York Islanders $325 31% $93 ($14.0) 3.4923 Buffalo Sabres $300 27% $113 $2.8 2.6524 St Louis Blues $270 24% $111 ($7.1) 2.4325 Tampa Bay Lightning $260 17% $121 ($1.4) 2.1526 Nashville Predators $255 33% $110 $2.0 2.3227 Columbus Blue Jackets $226 33% $99 $4.5 2.2828 Carolina Hurricanes $225 53% $99 ($11.7) 2.2729 Arizona Coyotes $220 63% $92 ($4.5) 2.3930 Florida Panthers $186 62% $93 ($20.2) 2.00
30-Team Averages $505 25% $132.6 $14.9 3.81
National Hockey League Franchise Values 2015
Source: John Vrooman and Forbes

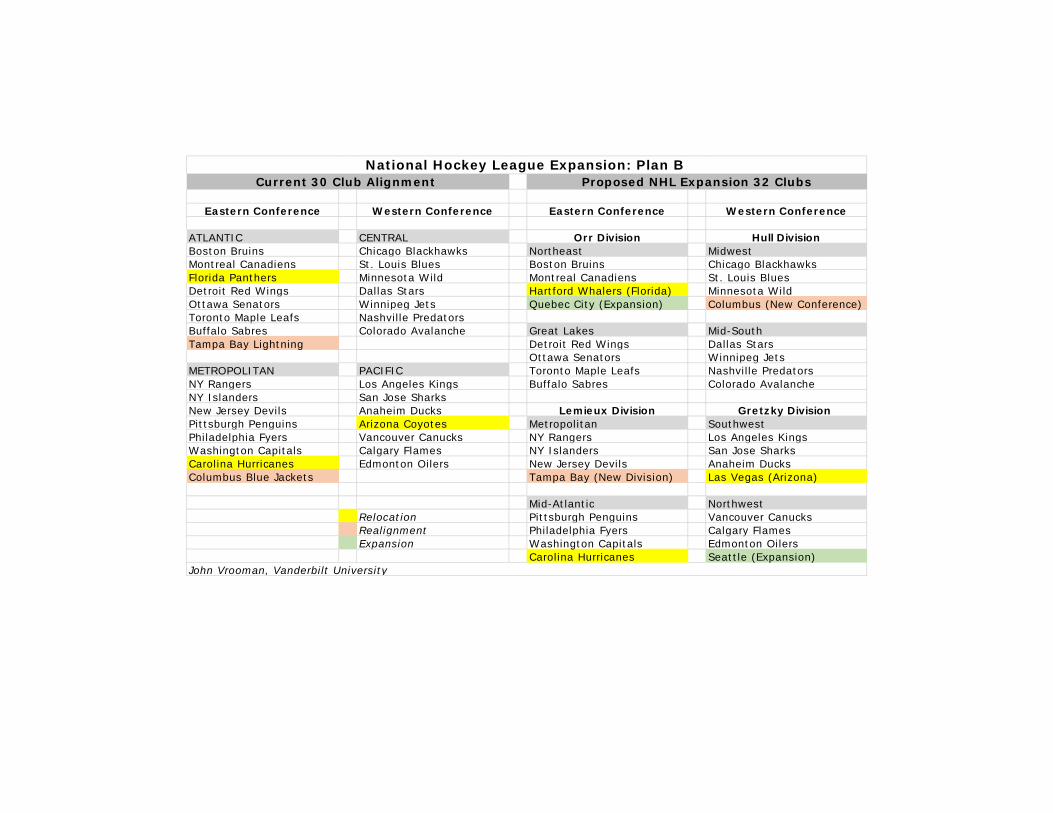
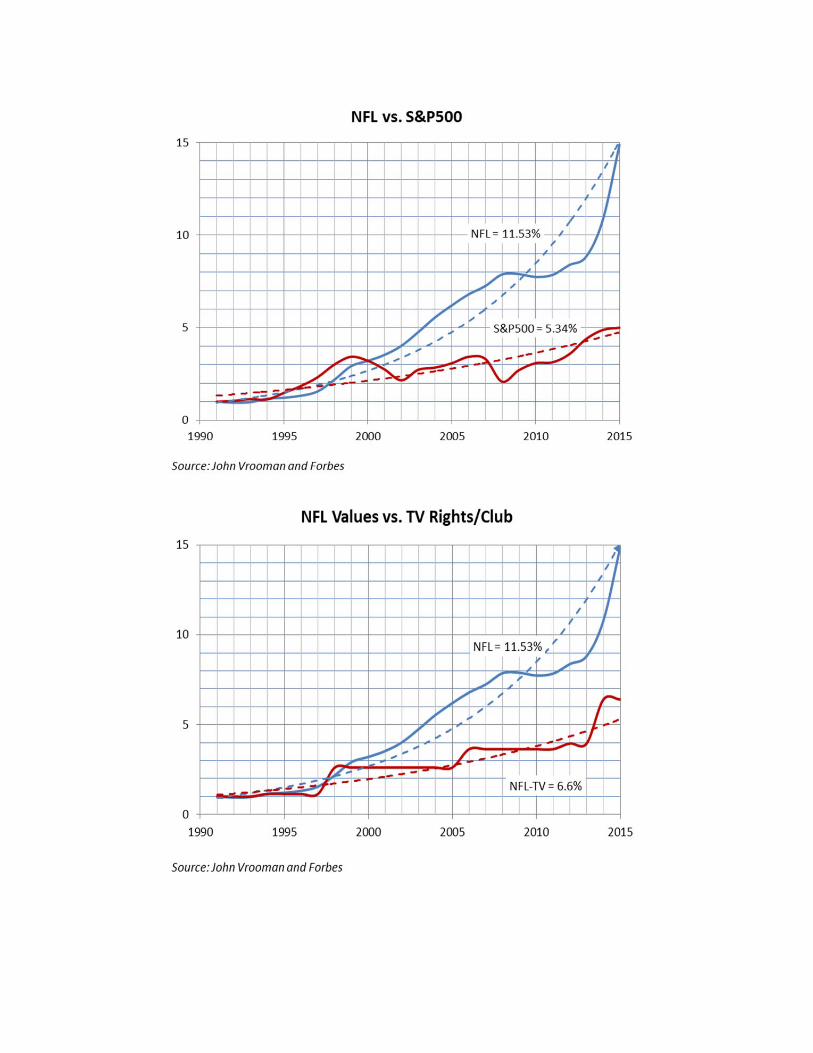
Years Win% Period Win% TVHH Base1 2015 -$225.9 $470.3 $1,268.65 2011-2015 $1,307.5 $474.9 $493.6
10 2006-2015 $1,919.6 $446.0 $237.315 2001-2015 $1,972.4 $452.1 $200.620 1996-2015 $2,549.6 $465.4 -$106.6
Does it pay to win in the NFL? ($M)
2015 averages: NFL Values=$1965.9; Win%=.500; TVHH=1.723Source: John Vrooman, Vanderbilt University
Value = Base + b (Win%) + c (TVHH) coefficients significant @ .01

Years Term Total Annual ABC CBS NBC FOX ESPN TBS Other DirecTV CBC/TSN
1970-73 4 26 188 47 8 22 17 … … … … …1974-77 4 28 218 55 13 24 18 … … … … …1978-81 4 646 162 60 54 48 … … … … … …1982-86 5 2,100 420 115 120 107 … … … … … …1987-89 3 1,428 476 125 165 135 … 51 … … … …1990-93 4 3,600 900 225 265 188 … 111 111 … … …1994-97 4 4,388 1,097 230 … 217 395 131 124 … … …1998-05 8 19,600 2,600 550 500 … 550 600 … … 400 …2006-11 6 22,410 3,735 … 623 600 713 1,100 … … 700 …2011-13 2 8,130 4,065 … 620 603 743 1,100 … … 1,1002014-22 9 58,220 6,680 … 1,080 1,050 1,150 1,900 … … 1,500 …
1980-83 4 190 48 25 ... 23 ... ... ... … ... …1984-89 6 1,125 188 96 ... 92 ... ... ... … ... …1990-93 4 1,460 365 ... 265 ... ... 100 ... … ... …1994-95 2 415 208 83 ... 83 ... 42 ... … ... …1996-00 5 1,625 325 ... ... 80 115 87 ... … ... …2001-06 6 3,351 559 ... ... ... 417 142 ... … ... …2007-13 7 5,622 803 ... ... ... 257 296 150 … 100 …2014-21 8 12,400 1,550 … … … 525 700 325 … x …
1982-86 4 123 31 … 23 … … 3 5 … … …1986-90 4 248 62 ... 43 ... ... ... 19 ... ... ...1990-94 4 875 219 ... ... 150 ... ... 69 ... ... ...1994-98 4 1,100 275 ... ... 188 ... ... 88 ... ... ...1998-02 4 2,640 660 ... ... 438 ... ... 223 ... ... ...2002-08 6 4,600 767 ... ... ... ... 400 367 ... ... ...2008-16 8 7,440 945 ... ... ... ... 575 370 ... ... ...2016-25 9 23,400 2,600 … … … … 1,400 1,200 … … …
1985-88 3 36 12 … … … … 8 … … 41988-92 4 152 38 … … … … … … 17 … 211992-94 2 185 37 ... ... ... ... 16 … … … 211994-99 5 500 100 ... ... ... 31 16 … … … 531999-04 5 878 176 … ... ... … 120 … … … 562005-08 3 361 120 ... ... … ... ... … 69 … 512008-11 3 443 148 ... ... ... ... ... … 75 … 732012-21 10 7,200 633 ... ... ... ... ... … 200 433
Major League Soccer: $90 million per year 2015-22 (8 years $720 million) with Fox Sports 1, ESPN and Univision
North American Big 4 TV Rights Fees ($M)
Source: John Vrooman, Vanderbilt University
National Football League
Major League Baseball
National Basketball Association
National Hockey League

$0
$1,000
$2,000
$3,000
$4,000
$5,000
$6,000
$7,000
NFL NBA MLB NHL NCAAB CFP/BCS
$6,580
$2,600
$1,550
$633 $771 $608
$4,065
$930 $803$148
$545 $175
TV Rights Fees
Annual rights Previous fees
$0.0$10.0$20.0$30.0$40.0$50.0$60.0$70.0$80.0$90.0
SEC ACC PAC12 BIG10 BIG12 POWER 5
$87.5 $83.5
$60.0 $60.0 $58.0$69.8
$30.2 $30.2$23.9
$30.2 $30.2 $28.9
CFP Payouts
CFP 2015 BCS 2014
League Annual rights fees Years Term Previous fees Growth National Football League (season) $6,580,000,000 9 2014-22 $4,065,000,000 1.62National Basketball Association (season) $2,600,000,000 9 2016-25 $930,000,000 2.80Major League Baseball (season) $1,550,000,000 8 2014-21 $803,000,000 1.93National Hockey League (season) $633,000,000 10 2012-21 $148,000,000 4.28NCAAB Tournament (67 games) $771,000,000 24 2011-34 $545,000,000 1.41BCS/College Football Playoff (7 games) $608,000,000 12 2015-27 $175,000,000 3.47Source: Vanderbilt Sports Economics
TV RIGHTS FEES EXPLOSION

Conference Schools FBS Bowl (CFP) Basketball Fund TV Deals Total Total / SchoolSEC 14 $89,402,730 $65,598,710 $15,067,390 $347,000,000 $451,470,120 $32,247,866Big Ten 14 $81,868,377 $63,978,927 $24,516,431 $279,000,000 $385,384,808 $27,527,486Pac-12 12 $81,415,388 $69,328,611 $13,535,113 $215,000,000 $309,950,501 $25,829,208Big 12 10 $77,625,801 $64,700,801 $20,174,980 $162,000,000 $259,800,781 $25,980,078ACC 15 $72,708,032 $58,260,649 $18,387,323 $212,000,000 $303,095,355 $20,206,357Total Power 5 13 $403,020,328 $321,867,698 $91,681,237 $1,215,000,000 $1,709,701,565 $131,515,505Big East/AAC 12 $19,064,320 $15,214,320 $29,368,641 $19,000,000 $67,432,961 $5,619,413Mountain West 12 $26,880,080 $23,465,188 $7,916,764 $15,000,000 $49,796,844 $4,149,737C-USA 14 $18,689,754 $16,339,754 $3,064,554 $15,000,000 $36,754,308 $2,625,308Mid-American 12 $15,838,886 $14,088,886 $2,298,415 $8,000,000 $26,137,301 $2,178,108Sun Belt 11 $13,313,453 $11,963,453 $2,298,415 $1,200,000 $16,811,868 $1,528,352Total Group of 5 12.5 $93,786,493 $81,071,601 $44,946,789 $58,200,000 $196,933,282 $15,754,663
Top 10 NCAA Conference Revenues 2014-15
Source: John Vrooman, NCAA and Forbes TV estimates. Bowl includes CFP.

FBS BUDGET 2013-14 CONF REVENUE EXPENSE PROFIT 5%-REV SALARY RATIO HEAD COACH FBS BUDGET 2013-14 CONF REVENUE EXPENSE PROFIT 5%-REV SALARY RATIO HEAD COACHTexas Big 12 $112.51 $38.43 $74.08 $5.63 $5.00 4.4% Charlie Strong Cincinnati AAC $14.56 $14.56 $0.00 $0.73 $2.20 15.1% Tommy Tuberville Alabama SEC $94.99 $41.72 $53.27 $4.75 $7.16 7.5% Nick Saban South Florida AAC $13.89 $12.13 $1.76 $0.69 $1.18 8.5% Willie Taggart Michigan Big Ten $91.38 $26.76 $64.63 $4.57 $2.86 3.1% Brady Hoke Southern Methodist AAC $12.94 $12.94 $0.00 $0.65 $2.02 15.6% June Jones LSU SEC $87.87 $37.86 $50.01 $4.39 $4.37 5.0% Les Miles Temple AAC $12.89 $12.89 $0.00 $0.64 $1.30 10.1% Matt Rhule Notre Dame Ind. $80.56 $32.76 $47.80 $4.03 $1.46 1.8% Brian Kelly Colorado State Mt. West $12.04 $12.04 $0.00 $0.60 $1.50 12.5% Jim McElwain Georgia SEC $77.16 $27.25 $49.91 $3.86 $3.31 4.3% Mark Richt Memphis AAC $11.94 $11.94 $0.00 $0.60 $1.01 8.4% Justin Fuente Oklahoma Big 12 $71.37 $28.11 $43.26 $3.57 $5.06 7.1% Bob Stoops San Diego State Mt. West $11.83 $12.39 -$0.56 $0.59 $0.80 6.8% Rocky Long Tennessee SEC $70.48 $21.67 $48.81 $3.52 $2.96 4.2% Butch Jones Texas-El Paso CUSA $11.76 $8.66 $3.10 $0.59 $0.51 4.3% Sean Kugler Florida SEC $69.25 $23.04 $46.21 $3.46 $2.73 3.9% Will Muschamp Rice CUSA $11.54 $11.54 $0.00 $0.58 $0.78 6.8% David Bailiff Penn State Big Ten $68.02 $31.49 $36.53 $3.40 $4.30 6.3% James Franklin Fresno State Mt. West $11.15 $10.32 $0.83 $0.56 $1.44 12.9% Tim DeRuyter Washington PAC-12 $67.73 $29.10 $38.63 $3.39 $3.68 5.4% Chris Petersen Connecticut AAC $10.63 $14.38 -$3.75 $0.53 $1.50 14.1% Bob Diaco Ohio State Big Ten $65.77 $23.38 $42.39 $3.29 $4.54 6.9% Urban Meyer Tulsa AAC $10.01 $10.01 $0.00 $0.50 $0.76 7.6% Bill Blankenship Nebraska Big Ten $60.16 $23.84 $36.32 $3.01 $3.08 5.1% Bo Pelini East Carolina AAC $9.96 $9.88 $0.08 $0.50 $1.25 12.6% Ruffin McNeill Texas A&M SEC $57.72 $23.73 $34.00 $2.89 $5.01 8.7% Kevin Sumlin Hawaii Mt. West $9.82 $9.82 $0.00 $0.49 $0.62 6.3% Norm Chow Florida State ACC $57.39 $32.86 $24.53 $2.87 $3.59 6.3% Jimbo Fisher Wyoming Mt. West $9.63 $7.51 $2.11 $0.48 $0.83 8.6% Craig Bohl Arkansas SEC $57.06 $28.07 $28.98 $2.85 $3.21 5.6% Bret Bielema Houston AAC $9.38 $9.38 $0.00 $0.47 $1.03 10.9% Tony Levine Oregon PAC-12 $55.98 $18.23 $37.75 $2.80 $2.00 3.6% Mark Helfrich North Texas CUSA $9.13 $7.33 $1.80 $0.46 $0.71 7.8% Dan McCarney South Carolina SEC $55.62 $26.10 $29.51 $2.78 $4.02 7.2% Steve Spurrier Middle Tennessee State CUSA $9.04 $9.04 $0.00 $0.45 $0.80 8.9% Rick Stockstill Iowa Big Ten $53.62 $24.13 $29.49 $2.68 $4.08 7.6% Kirk Ferentz Alabama at Birmingham CUSA $8.98 $8.96 $0.02 $0.45 $0.50 5.6% Bill Clark Michigan State Big Ten $52.79 $26.68 $26.12 $2.64 $5.64 10.7% Mark Dantonio Marshall CUSA $8.64 $8.25 $0.39 $0.43 $0.61 7.1% Doc Holliday Auburn SEC $49.64 $49.64 $0.00 $2.48 $3.85 7.8% Gus Malzahn Florida Atlantic CUSA $8.44 $8.44 $0.00 $0.42 $0.50 5.9% Charlie Partridge Arizona State PAC-12 $48.98 $27.12 $21.86 $2.45 $2.70 5.5% Todd Graham Ohio MAC $8.42 $7.70 $0.71 $0.42 $0.55 6.6% Frank Solich Oklahoma State Big 12 $48.64 $22.23 $26.41 $2.43 $3.50 7.2% Mike Gundy Nevada-Las Vegas Mt. West $8.34 $8.34 $0.00 $0.42 $0.85 10.2% Bobby Hauck Wisconsin Big Ten $47.28 $31.28 $16.00 $2.36 $2.29 4.8% Gary Andersen Northern Illinois MAC $8.31 $8.31 $0.00 $0.42 $0.40 4.8% Rod Carey Southern California PAC-12 $44.84 $30.28 $14.57 $2.24 $4.25 9.5% Steve Sarkisian New Mexico Mt. West $8.03 $8.03 $0.00 $0.40 $0.78 9.8% Bob Davie Mississippi SEC $43.99 $24.17 $19.83 $2.20 $3.02 6.9% Hugh Freeze Massachusetts MAC $7.82 $7.82 $0.00 $0.39 $0.45 5.8% Mark Whipple Virginia Tech ACC $43.37 $22.39 $20.98 $2.17 $2.66 6.1% Frank Beamer Western Kentucky CUSA $7.79 $7.79 $0.00 $0.39 $0.60 7.7% Jeff Brohm Clemson ACC $42.43 $24.75 $17.68 $2.12 $3.18 7.5% Dabo Swinney Louisiana-Lafayette Sun Belt $7.75 $7.75 $0.00 $0.39 $1.00 13.0% Mark Hudspeth Texas Christian Big 12 $40.45 $34.65 $5.80 $2.02 $4.01 9.9% Gary Patterson Southern Mississippi CUSA $7.40 $7.40 $0.00 $0.37 $0.70 9.5% Todd Monken Minnesota Big Ten $39.82 $27.76 $12.06 $1.99 $2.10 5.3% Jerry Kill Toledo MAC $7.39 $7.39 $0.00 $0.37 $0.48 6.5% Matt Campbell Syracuse ACC $38.53 $23.62 $14.91 $1.93 $1.40 3.6% Scott Shafer Western Michigan MAC $7.34 $7.34 $0.00 $0.37 $0.39 5.4% P.J. Fleck Texas Tech Big 12 $38.26 $16.00 $22.26 $1.91 $2.61 6.8% Kliff Kingsbury Texas-San Antonio CUSA $7.26 $7.26 $0.00 $0.36 $0.40 5.5% Larry Coker North Carolina State ACC $38.02 $17.99 $20.03 $1.90 $1.80 4.7% Dave Doeren Miami (Ohio) MAC $7.19 $7.19 $0.00 $0.36 $0.45 6.3% Chuck Martin Utah PAC-12 $36.85 $16.14 $20.71 $1.84 $2.20 6.0% Kyle Whittingham South Alabama Sun Belt $7.16 $7.48 -$0.32 $0.36 $0.47 6.6% Joey Jones Stanford PAC-12 $36.75 $20.86 $15.88 $1.84 $2.01 5.5% David Shaw Florida International CUSA $7.16 $7.16 $0.00 $0.36 $0.55 7.7% Ron Turner Georgia Tech ACC $34.31 $18.99 $15.31 $1.72 $2.59 7.6% Paul Johnson New Mexico State Sun Belt $7.01 $7.01 $0.00 $0.35 $0.38 5.4% Doug Martin Kentucky SEC $34.08 $17.21 $16.87 $1.70 $2.70 7.9% Mark Stoops Akron MAC $6.76 $6.76 $0.00 $0.34 $0.41 6.0% Terry Bowden Missouri SEC $34.06 $21.42 $12.64 $1.70 $3.40 10.0% Gary Pinkel Buffalo MAC $6.69 $6.69 $0.00 $0.33 $0.38 5.7% Jeff Quinn Miami ACC $33.53 $27.92 $5.61 $1.68 $2.25 6.7% Al Golden Tulane AAC $6.59 $10.50 -$3.91 $0.33 $0.87 13.2% Curtis Johnson California PAC-12 $33.27 $22.18 $11.09 $1.66 $1.81 5.4% Sonny Dykes Ball State MAC $6.51 $6.51 $0.00 $0.33 $0.50 7.7% Pete Lembo North Carolina ACC $33.26 $17.98 $15.28 $1.66 $1.83 5.5% Larry Fedora Bowling Green MAC $6.41 $6.41 $0.00 $0.32 $0.41 6.3% Dino Babers Kansas State Big 12 $32.73 $16.64 $16.09 $1.64 $2.90 8.9% Bill Snyder Nevada Mt. West $6.39 $6.30 $0.09 $0.32 $0.58 9.0% Brian Polian Northwestern Big Ten $31.48 $22.64 $8.84 $1.57 $2.48 7.9% Pat Fitzgerald Utah State Mt. West $6.27 $6.27 $0.00 $0.31 $0.58 9.2% Matt Wells Iowa State Big 12 $30.97 $14.46 $16.51 $1.55 $1.81 5.8% Paul Rhoads Louisiana Tech CUSA $6.23 $6.02 $0.21 $0.31 $0.51 8.2% Skip Holtz UCLA PAC-12 $30.35 $24.09 $6.26 $1.52 $3.25 10.7% Jim Mora Georgia State Sun Belt $6.13 $6.13 $0.00 $0.31 $0.51 8.3% Trent Miles Illinois Big Ten $30.32 $16.56 $13.76 $1.52 $1.95 6.4% Tim Beckman Texas State Sun Belt $6.05 $6.05 $0.00 $0.30 $0.40 6.6% Dennis Franchione Arizona PAC-12 $29.26 $28.20 $1.06 $1.46 $3.30 11.3% Rich Rodriguez Arkansas State Sun Belt $5.94 $5.94 $0.00 $0.30 $0.70 11.8% Blake Anderson Colorado PAC-12 $28.43 $17.35 $11.08 $1.42 $2.01 7.1% Mike MacIntyre Idaho Sun Belt $5.89 $5.89 $0.00 $0.29 $0.40 6.8% Paul Petrino Oregon State PAC-12 $28.33 $14.37 $13.96 $1.42 $1.51 5.3% Mike Riley Troy Sun Belt $5.80 $5.13 $0.66 $0.29 $0.52 9.0% Larry Blakeney Baylor Big 12 $28.32 $24.57 $3.74 $1.42 $3.14 11.1% Art Briles Kent State MAC $5.76 $5.18 $0.58 $0.29 $0.38 6.7% Paul Haynes Pittsburgh ACC $28.23 $20.20 $8.03 $1.41 $1.58 5.6% Paul Chryst Eastern Michigan MAC $5.55 $6.30 -$0.75 $0.28 $0.43 7.7% Chris Creighton Virginia ACC $28.23 $20.19 $8.03 $1.41 $2.30 8.2% Mike London Georgia Southern Sun Belt $4.57 $4.35 $0.22 $0.23 $0.40 8.7% Willie Fritz Mississippi State SEC $27.14 $15.30 $11.84 $1.36 $3.00 11.1% Dan Mullen San Jose State Mt. West $4.39 $6.67 -$2.28 $0.22 $0.53 12.0% Ron Caragher Washington State PAC-12 $26.99 $15.71 $11.28 $1.35 $2.75 10.2% Mike Leach Appalachian State Sun Belt $4.30 $4.30 $0.00 $0.22 $0.23 5.2% Scott Satterfield Louisville ACC $26.52 $21.57 $4.95 $1.33 $3.00 11.3% Bobby Petrino Louisiana-Monroe Sun Belt $4.11 $4.11 $0.00 $0.21 $0.36 8.7% Todd Berry Indiana Big Ten $26.24 $17.65 $8.59 $1.31 $1.30 5.0% Kevin Wilson Central Michigan MAC $3.90 $5.87 -$1.97 $0.19 $0.36 9.2% Dan Enos Duke ACC $25.24 $20.58 $4.66 $1.26 $1.84 7.3% David Cutcliffe Vanderbilt SEC $24.98 $21.50 $3.47 $1.25 $2.25 9.0% Derek Mason Boston College ACC $23.99 $19.92 $4.07 $1.20 $1.75 7.3% Steve Addazio Kansas Big 12 $23.18 $14.84 $8.33 $1.16 $2.50 10.8% Charlie Weis Brigham Young Ind. $22.21 $15.24 $6.98 $1.11 $2.00 9.0% Bronco Mendenhall Maryland Big Ten $21.72 $15.40 $6.32 $1.09 $2.03 9.4% Randy Edsall Central Florida AAC $21.27 $19.64 $1.63 $1.06 $1.80 8.5% George O'Leary Rutgers Big Ten $20.81 $19.22 $1.59 $1.04 $0.99 4.7% Kyle Flood Purdue Big Ten $19.79 $15.33 $4.46 $0.99 $2.09 10.6% Darrell Hazell Boise State Mt. West $18.98 $11.52 $7.45 $0.95 $1.00 5.3% Bryan Harsin Wake Forest ACC $18.69 $18.69 $0.00 $0.93 $2.25 12.0% Dave Clawson West Virginia Big 12 $18.61 $16.98 $1.63 $0.93 $3.08 16.6% Dana Holgorsen

Team (22 February 2016) Cap Space 2016 Cap 2015 Carryover 2016 Team Cap 2016 Spending Dead MoneyJacksonville Jaguars $79,803,211 $155,000,000 $32,837,428 $187,837,428 $107,745,479 $288,738Oakland Raiders $74,275,436 $155,000,000 $13,404,867 $168,404,867 $93,709,095 $420,336Chicago Bears $60,453,041 $155,000,000 $1,064,464 $156,064,464 $89,124,626 $6,486,797New York Giants $58,623,872 $155,000,000 $11,240,106 $166,240,106 $97,910,603 $9,705,631St. Louis Rams $58,346,856 $155,000,000 $933,521 $155,933,521 $91,126,940 $6,459,725San Francisco 49ers $55,239,714 $155,000,000 $12,644,186 $167,644,186 $105,788,006 $6,616,466Tennessee Titans $50,694,155 $155,000,000 $20,830,676 $175,830,676 $118,801,271 $6,335,250Tampa Bay Buccaneers $49,392,453 $155,000,000 $8,268,998 $163,268,998 $113,486,308 $390,237Cleveland Browns $42,098,128 $155,000,000 $21,359,144 $176,359,144 $132,647,188 $1,613,828Cincinnati Bengals $38,723,157 $155,000,000 $7,712,902 $162,712,902 $123,796,474 $193,271Kansas City Chiefs $32,733,632 $155,000,000 $2,847,838 $157,847,838 $124,880,558 $233,648Houston Texans $32,094,427 $155,000,000 $3,099,555 $158,099,555 $125,610,546 $394,582San Diego Chargers $31,774,386 $155,000,000 $2,343,426 $157,343,426 $123,146,867 $2,422,173NFL Averages $30,138,361 $155,000,000 $6,442,954 $161,442,954 $127,759,949 $3,544,643Atlanta Falcons $27,489,014 $155,000,000 $3,905,771 $158,905,771 $116,377,511 $15,039,246Detroit Lions $26,226,314 $155,000,000 $880,941 $155,880,941 $128,294,333 $1,360,294Philadelphia Eagles $25,998,040 $155,000,000 $7,280,362 $162,280,362 $132,010,114 $4,272,208Indianapolis Colts $24,559,614 $155,000,000 $4,997,504 $159,997,504 $129,042,916 $6,394,974Minnesota Vikings $24,534,868 $155,000,000 $2,384,159 $157,384,159 $132,363,905 $485,386Seattle Seahawks $23,029,279 $155,000,000 $199,087 $155,199,087 $128,891,764 $3,278,044Carolina Panthers $22,365,540 $155,000,000 $3,749,950 $158,749,950 $132,513,407 $3,871,003Green Bay Packers $21,865,614 $155,000,000 $7,452,597 $162,452,597 $139,908,390 $678,593Arizona Cardinals $19,542,095 $155,000,000 $3,084,788 $158,084,788 $138,290,644 $252,049New York Jets $14,043,256 $155,000,000 $2,484,216 $157,484,216 $142,872,226 $568,734Washington Redskins $13,372,122 $155,000,000 $6,112,784 $161,112,784 $147,167,498 $573,164Dallas Cowboys $11,831,119 $155,000,000 $3,852,589 $158,852,589 $146,120,394 $901,076Miami Dolphins $8,661,763 $155,000,000 $9,137,544 $164,137,544 $150,156,354 $5,319,427Pittsburgh Steelers $8,445,842 $155,000,000 $3,000,327 $158,000,327 $148,789,297 $765,188Denver Broncos $8,161,005 $155,000,000 ($700,000) $154,300,000 $145,212,357 $926,638New Orleans Saints $7,441,957 $155,000,000 $1,400,000 $156,400,000 $126,686,198 $22,271,845Baltimore Ravens $6,310,966 $155,000,000 $1,633,944 $156,633,944 $150,121,620 $201,358New England Patriots $6,086,955 $155,000,000 $2,263,507 $157,263,507 $150,778,152 $398,400Buffalo Bills $209,715 $155,000,000 $4,467,331 $159,467,331 $154,947,341 $4,310,275NFL Totals $964,427,546 $4,960,000,000 $206,174,512 $5,166,174,512 $4,088,318,382 $113,428,584
Estimated NFL Salary Cap Space 2016 Season
Source: John Vooman and http://overthecap.com/2016 Players Share = 48.5% of $11.62B Revenues = $5.64B -12% Player Benefits ($676M)= $4.96B/32 clubs = $155M per club
Year Base Salary Prorated Bonus Cap Number Actual Payroll Dead Money 2014 $420,000 $479,867 $899,867 $2,339,4682015 $644,967 $479,867 $1,124,834 $644,9672016 $869,934 $479,867 $1,349,801 $869,934 $479,8672017 $1,094,901 $479,867 $1,574,768 $1,094,901 $479,867Total $3,029,802 $1,919,468 $4,949,270 $4,949,270 $959,734
Average $757,451 $479,867 $1,237,318 $1,237,318
Jordan Matthews 2014 NFL Draft Round 2, Pick 42 (Eagles)

NBA Franchise 2015-16 Payroll Over Tax Tax/Cap
Room
Oklahoma City Thunder $97,157,411 $12,417,411 $22,293,527 Lower Upper Tax rate Incremental maximum Tax rate Incremental
maximumLos Angeles Clippers $95,505,710 $10,765,710 $18,162,500 $0 $4,999,999 $1.50 $7.5 million $2.50 $12.50 millionGolden State Warriors $95,487,927 $10,747,927 $18,119,818 $5,000,000 $9,999,999 $1.75 $8.75 million $2.75 $13.75 millionCleveland Cavaliers $95,408,795 $10,668,795 $17,921,988 $10,000,000 $14,999,999 $2.50 $12.5 million $3.50 $17.50 millionMiami Heat $93,243,897 $8,503,897 $13,631,820 $15,000,000 $19,999,999 $3.25 $16.25 million $4.25 $21.25 millionChicago Bulls $89,024,375 $4,284,375 $6,426,563 $20,000,000 N/A N/A N/ASan Antonio Spurs $87,071,718 $2,331,718 $3,497,577 Houston Rockets $86,180,389 $1,440,389 $2,160,584 Luxury Tax Threshold $84,740,000 $0 $0Brooklyn Nets $84,685,972 Washington Wizards $81,485,782 Memphis Grizzlies $80,870,591 Boston Celtics $79,579,576 New Orleans Pelicans $79,179,865 Charlotte Hornets $77,633,447 Detroit Pistons $77,439,853 Phoenix Suns $76,027,682 Minnesota Timberwolves $74,492,809 New York Knicks $74,030,697 Dallas Mavericks $73,457,818 Toronto Raptors $73,292,772 Milwaukee Bucks $73,168,795 Atlanta Hawks $72,944,738 Sacramento Kings $72,616,296 Indiana Pacers $72,487,358 Denver Nuggets $72,410,868 Los Angeles Lakers $72,193,306 Soft Payroll Cap $70,000,000 $14,740,000Orlando Magic $68,635,095 $1,364,905 Utah Jazz $64,734,304 $5,265,696 Minimum 90% of Cap $63,100,000 $21,640,000Philadelphia 76ers $56,092,788 $13,907,212 Portland Trail Blazers $50,522,394 $19,477,606
$3.75, increasing $.50 for each $5 million.
$4.75, increasing $.50 for each $5 million.
NBA Payroll Cap for 2015-16 NBA Luxury Tax Rates 2015-16Payroll above tax level Non-repeater Repeater Rate (3 of 4 prior
seasons)

Season Team KD‐Salary Win‐share Team Wins % Wins %Rev Team Rev $MRP %Exploit
2007‐08 SEA $4.17 2.3 20 11.5% 5.8% $82.0 $4.72 11.5%
2008‐09 OKC $4.48 7.9 23 34.3% 17.2% $111.0 $19.06 76.5%
2009‐10 OKC $4.80 16.1 50 24.0% 12.0% $118.0 $14.16 66.1%
2010‐11 OKC $6.05 12.0 55 22.2% 11.1% $126.0 $13.97 56.7%
2011‐12 OKC $15.51 12.2 47 34.3% 17.1% $127.0 $21.75 28.7%
2012‐13 OKC $16.67 18.9 60 31.5% 15.8% $144.0 $22.68 26.5%
2013‐14 OKC $17.83 19.2 59 32.5% 16.3% $152.0 $24.73 27.9%
2014‐15 OKC $19.00 4.8 45 10.7% 5.3% $157.0 $8.37 ‐126.9%
2015‐16 OKC $20.16 14.5 55 26.4% 13.2% $170.0 $22.41 10.0%
2016‐17 GSW $26.54 14.0 65 21.5% 10.8% $240.0 $25.85 ‐2.7%
2017‐18 GSW $27.73 14.0 65 21.5% 10.8% $250.0 $26.92 ‐3.0%
Exploitation of Kevin Durant
Source: John Vrooman projection; players share = 50% of revenue
Pick 1st Year 2nd Year 3rd Year 4th Year
1 3,885.00 4,176.40 4,467.70 26.10%
2 3,476.00 3,736.70 3,997.40 26.20%
3 3,121.50 3,355.60 3,589.70 26.40%
4 2,814.30 3,025.40 3,236.50 26.50%
5 2,548.50 2,739.70 2,930.80 26.70%
6 2,314.80 2,488.40 2,662.00 26.80%
7 2,113.10 2,271.60 2,430.10 27.00%
8 1,935.90 2,081.10 2,226.20 27.20%
9 1,779.50 1,912.90 2,046.40 27.40%
10 1,690.50 1,817.30 1,944.00 27.50%
Source: NBA CBA Exhibit B
2007‐08 NBA Rookie Scale +/‐ 20%
Years CAP 0 ‐ 6 7 ‐ 9 10+
Max Salary 44.74% BRI 25% of cap 30% of cap 35% of cap
2011‐12 $58,044,000 $12,922,194 $15,506,632 $18,091,071
2012‐13 $58,044,000 $13,668,750 $16,402,500 $19,136,250
2013‐14 $58,679,000 $13,701,250 $16,441,500 $19,181,750
2014‐15 $63,065,000 $14,746,000 $17,695,200 $20,644,400
2015‐16 $70,000,000 $16,407,500 $19,689,000 $22,970,500
2016‐17 $94,143,000 $22,116,750 $26,540,100 $30,963,450
2017‐18 $102,000,000 $23,970,000 $27,734,405 $33,558,000
Source: John Vrooman projection 23.5% 28.2% 32.9%
*Cap used to determine the max salaries is 42.14% of projected BRI rather than 44.74%.
Bird exception raise 7.5%; non‐Bird exception raise 4.5%
Derek Rose 5th year 30% Rule:
Named to the All‐NBA First, Second or Third team at least twice
Voted as a starter in the All‐Star game at least twice
Named the NBA Most Valuable Player at least once
NBA Maximum Salary

NHL Team Cap Hits Cap Space MLB Team 2015 Payroll1 Tampa Bay Lightning $72,037,098 ($637,098) 1 Los Angeles Dodgers $272,789,040
Salary Cap (Midpoint + 15%) $71,400,000 $0 2 New York Yankees $219,282,196 2 Chicago Blackhawks $71,168,460 $231,540 CBT (luxury tax) threshold $189,000,000 3 Detroit Red Wings $71,024,543 $375,457 Cap: 66% HTS of average MLB revenue $286.4M $189,000,000 4 Washington Capitals $70,930,959 $469,041 3 Boston Red Sox $187,407,202 5 Philadelphia Flyers $70,816,666 $583,334 4 Detroit Tigers $173,813,750 6 New York Rangers $70,574,000 $826,000 5 San Francisco Giants $172,672,111 7 San Jose Sharks $70,394,996 $1,005,004 6 Washington Nationals $164,920,505 8 Vancouver Canucks $70,126,666 $1,273,334 7 7Los Angeles Angels of Anaheim $150,933,083 9 St. Louis Blues $69,678,332 $1,721,668 8 Texas Rangers $142,140,873
10 Minnesota Wild $69,496,335 $1,903,665 9 Philadelphia Phillies $135,827,500 11 Pittsburgh Penguins $69,392,916 $2,007,084 Average MLB payroll $124,707,037 12 Calgary Flames $69,205,066 $2,194,934 10 Toronto Blue Jays $122,506,600 13 Dallas Stars $69,099,166 $2,300,834 11 St. Louis Cardinals $120,869,458 14 Toronto Maple Leafs $68,889,999 $2,510,001 12 Seattle Mariners $119,798,060 15 Edmonton Oilers $68,511,249 $2,888,751 13 Chicago Cubs $119,006,885 16 Montreal Canadiens $68,508,333 $2,891,667 14 Cincinnati Reds $117,197,072 17 Columbus Blue Jackets $67,671,307 $3,728,693 15 Chicago White Sox $115,238,678 18 Boston Bruins $66,635,667 $4,764,333 16 Kansas City Royals $113,618,650 19 Los Angeles Kings $66,555,227 $4,844,773 17 Baltimore Orioles $110,146,097 20 Anaheim Ducks $63,964,164 $7,435,836 18 Minnesota Twins $108,945,000 21 Ottawa Senators $63,500,832 $7,899,168 19 Milwaukee Brewers $105,002,536 22 Colorado Avalanche $63,184,760 $8,215,240 20 Colorado Rockies $102,006,130 23 New York Islanders $62,799,642 $8,600,358 21 New York Mets $101,409,244
Adjusted Midpoint $62,100,000 $9,300,000 22 San Diego Padres $100,675,896 24 Florida Panthers $59,894,183 $11,505,817 23 Atlanta Braves $97,578,565 25 Buffalo Sabres $59,382,855 $12,017,145 24 Arizona Diamondbacks $91,518,833 26 Carolina Hurricanes $59,161,665 $12,238,335 25 Pittsburgh Pirates $88,278,500 27 Nashville Predators $59,044,223 $12,355,777 26 Cleveland Indians $86,091,175 28 Winnipeg Jets $58,864,998 $12,535,002 27 Oakland A's $86,086,667 29 Arizona Coyotes $57,574,704 $13,825,296 Floor: 34% VTS of average revenue-$20M PDX $77,400,000 30 New Jersey Devils $57,383,331 $14,016,669 28 Tampa Bay Rays $76,061,707
Salary Floor (Midpoint - 15%) $52,800,000 $18,600,000 29 Houston Astros $70,910,100 30 Miami Marlins $68,479,000
Hypothetical MLB Salary Cap 2015NHL Hard Salary Cap Space 2015-16
Team can exceed the salary cap due to performance bonusesM aximum player salary 20% of cap $14,280,000Source: http://www.generalfanager.com/teams

MLB TEAM 2005 2003 2002
N.Y. Yankees ($76,000,000) ($52,650,000) ($26,640,289)
Boston Red Sox ($52,000,000) ($38,692,000) ($17,896,820)
Chicago Cubs ($32,000,000) ($16,731,000) ($8,280,260)
Seattle Mariners ($25,000,000) ($31,023,000) ($19,877,788)
N.Y. Mets ($24,000,000) ($21,473,000) ($17,366,067)
Los Angeles Dodgers ($20,000,000) ($9,490,000) ($9,278,555)
St. Louis Cardinals ($19,000,000) ($9,202,000) ($8,385,888)
Chicago White Sox ($18,000,000) ($4,833,000) ($3,823,142)
San Francisco Giants ($14,000,000) ($12,959,000) ($9,638,790)
Los Angeles Angels ($11,000,000) $1,874,000 ($1,303,070)
Houston Astros ($11,000,000) $1,182,000 ($4,326,392)
Atlanta Braves ($10,000,000) ($11,291,000) ($9,753,575)
Texas Rangers ($35,000) ($7,162,000) ($8,205,165)
Baltimore Orioles $2,000,000 $252,000 ($5,337,479)
Washington Nationals $3,900,000 $29,517,000 $28,493,994
San Diego Padres $5,700,000 $13,250,000 $6,283,572
Philadelphia Phil l ies $5,800,000 $9,013,000 $9,834,124
Cleveland Indians $6,000,000 ($4,828,000) ($10,612,923)
Arizona D‐Backs $13,000,000 $1,456,000 ($3,255,682)
Colorado Rockies $16,000,000 $2,469,000 ($5,127,222)
Cincinnati Reds $16,000,000 $6,469,000 $9,807,244
Oakland Athletics $19,000,000 $11,756,000 $9,201,545
Minnesota Twins $22,000,000 $17,249,000 $12,977,421
Milwaukee Brewers $24,000,000 $16,555,000 $8,502,007
Pittsburgh Pirates $25,000,000 $13,299,000 $6,400,652
Detroit Tigers $25,000,000 $16,738,000 $11,615,688
Kansas City Royals $30,000,000 $19,042,000 $16,629,872
Toronto Blue Jays $31,000,000 $18,735,000 $13,691,953
Miami Marlins $31,000,000 $21,030,000 $20,946,573
Tampa Bay D‐Rays $33,000,000 $20,464,000 $14,724,463
Transfer $308,400,000 $220,350,000 $169,109,108
Source: John Vrooman & Maury Brown
MLB Pooled Revenue‐Sharing Transfers
Club 40‐man Payroll Over Threshold Tax Rate Luxury Tax
LA Dodgers $298,320,297 $109,320,297 40.0% $43,728,119
NY Yankees $241,150,787 $52,150,787 50.0% $26,075,394
Boston Red Sox $199,732,694 $10,732,694 17.5% $1,878,221
SF Giants $196,631,618 $7,631,618 17.5% $1,335,533
CBT Threshold $189,000,000 … … …
MLB Luxury Tax in 2015
Year CBT Threshold NY Yankees LA Dodgers Boston Red Sox LA Angels Detroit Tigers SF Giants
2003 $117,000,000 $11,798,357
2004 $120,500,000 $25,964,060 $3,148,962 $927,057
2005 $128,000,000 $34,053,787 $4,148,981
2006 $136,500,000 $26,009,039 $497,549
2007 $148,000,000 $23,881,386 $6,064,287
2008 $155,000,000 $26,862,702 $1,305,220
2009 $162,000,000 $25,689,173
2010 $170,000,000 $18,029,654 $1,487,149
2011 $178,000,000 $13,896,069 $3,430,810
2012 $178,000,000 $18,917,994
2013 $178,000,000 $28,113,945 $11,415,959
2014 $189,000,000 $18,300,000 $26,621,125
2015 $189,000,000 $26,075,394 $43,728,119 $1,878,222 $1,335,533
2016 $189,000,000
TOTALS $297,591,560 $81,765,203 $20,655,960 $927,057 $1,305,220 $1,335,533
Luxury Tax rates: 1st time 17.5%, 2nd time 30%, 3rd time 40%, 4th time or more 50% of amount over payroll threshold.
Source: John Vrooman
MLB Luxury Tax (CBT) since 2002 CBA

Year Age IP MLST Team Salary WAR $/WAR Awards
2008 22 14.0 Tampa Bay Rays $650,000 0.4 $1,625,0002009 23 128.1 0.164 Tampa Bay Rays $750,000 0.9 $833,3332010 24 208.2 1.164 Tampa Bay Rays $1,834,671 4.8 $382,223 AS,CYA-22011 25 224.1 2.164 Tampa Bay Rays $2,084,671 2.8 $744,525 AS
2012 26 211.0 3.164 Tampa Bay Rays $4,350,000 6.9 $630,435 AS,CYA-1,MVP-122013 27 186.2 4.164 Tampa Bay Rays $10,112,500 2.8 $3,611,6072014 28 170.2 Tampa Bay Rays ($14,000,000) $8,950,820 2.7 $3,315,119 AS,CYA-6
77.2 5.164 Detroit Tigers $5,049,180 1.9 $2,657,463 AS,CYA-62015 29 146.0 Detroit Tigers ($19,750,000) $12,627,050 3.6 $3,507,514 AS,CYA-2,MVP-9
74.1 6.164 Toronto Blue Jays $7,122,950 2.4 $2,967,896 AS,CYA-2,MVP-9Contract Salary WAR* PV/WAR* PV@10%
2016 30 Boston Red Sox $30,000,000 4.9 $6,122,449 $30,000,0002017 31 Boston Red Sox $30,000,000 4.2 $6,548,074 $27,272,7272018 32 Boston Red Sox $30,000,000 3.5 $7,003,287 $24,793,3882019 33 Boston Red Sox $31,000,000 3.0 $7,739,819 $23,290,7592020 34 Boston Red Sox $32,000,000 2.6 $8,544,909 $21,856,4312021 35 Boston Red Sox $32,000,000 2.2 $9,138,940 $19,869,4822022 36 Boston Red Sox $32,000,000 1.7 $10,385,160 $18,063,166
$217,000,000 22.1 $7,477,481 $165,145,953
Source: John Vrooman, Baseball Reference and FanGraphs*WAR decays at 90% of prior year through age 30, 85% for ages 31-35, and 80% for ages 36 and up.
David Price LHP: 7 years/$217M (2016-22)
Total Contract 7 years (2016-22)
Salary Arbitration Tier 2
Modified Reserve Tier 1
Vrooman Projections for Free Agent Tier 3
player option

P W D L GF GA PTS Win%1 Chelsea (London) 38 26 9 3 73 32 87 .8032 Manchester City 38 24 7 7 83 38 79 .7243 Arsenal (London) 38 22 9 7 71 36 75 .6974 Manchester United 38 20 10 8 62 37 70 .6585 Tottenham Hotspur (London) 38 19 7 12 58 53 64 .5926 Liverpool 38 18 8 12 52 48 62 .5797 Southampton 38 18 6 14 54 33 60 .5538 Swansea City 38 16 8 14 46 49 56 .5269 Stoke City 38 15 9 14 48 45 54 .513
10 Crystal Palace (London) 38 13 9 16 47 51 48 .46111 Everton (Liverpool) 38 12 11 15 48 50 47 .46112 West Ham United (London)*FP 38 12 11 15 44 47 47 .46113 West Bromwich Albion 38 11 11 16 38 51 44 .43414 Leicester City 38 11 8 19 46 55 41 .39515 Newcastle United 38 10 9 19 40 63 39 .38216 Sunderland 38 7 17 14 31 53 38 .40817 Aston Villa 38 10 8 20 31 57 38 .36818 Hull City 38 8 11 19 33 51 35 .35519 Burnley 38 7 12 19 28 53 33 .34220 Queens Park Rangers (London) 38 8 6 24 42 73 30 .289
P W D L GF GA PTS Win%1 AFC Bournemouth 46 26 12 8 98 45 90 .6962 Watford 46 27 8 11 91 50 89 .6743 Norwich City 46 25 11 10 88 48 86 .6634 Middlesbrough 46 25 10 11 68 37 85 .6525 Brentford (London) 46 23 9 14 78 59 78 .5986 Ipswich Town 46 22 12 12 72 54 78 .6097 Wolverhampton Wanderers 46 22 12 12 70 56 78 .6098 Derby County 46 21 14 11 85 56 77 .6099 Blackburn Rovers 46 17 16 13 66 59 67 .543
10 Birmingham City 46 16 15 15 54 64 63 .51111 Cardiff City 46 16 14 16 57 61 62 .50012 Charlton Athletic (London) 46 14 18 14 54 60 60 .50013 Sheffield Wednesday 46 14 18 14 43 49 60 .50014 Nottingham Forest 46 15 14 17 71 69 59 .47815 Leeds United 46 15 11 20 50 61 56 .44616 Huddersfield Town 45 13 15 17 58 75 54 .45617 Fulham (London) 46 14 10 22 62 83 52 .41318 Bolton Wanderers 46 13 12 21 54 67 51 .41319 Reading 46 13 11 22 48 69 50 .40220 Brighton & Hove Albion 46 10 17 19 44 54 47 .40221 Rotherham United 46 11 16 19 46 67 46 .41322 Millwall (London) 46 9 14 23 42 76 41 .34823 Wigan Athletic 46 9 12 25 39 64 39 .32624 Blackpool 45 4 13 28 36 91 25 .233
P W D L GF GA PTS Win%1 FC Barcelona 38 30 4 4 110 21 94 .8422 Real Madrid CF 38 30 2 6 118 38 92 .8163 Atletico de Madrid 38 23 9 6 67 29 78 .7244 Valencia CF 38 22 11 5 70 32 77 .7245 Sevilla FC* (Europa Champion) 38 23 7 8 71 45 76 .6976 Villarreal CF 38 16 12 10 48 37 60 .5797 Athletic de Bilbao 38 15 10 13 42 41 55 .5268 RC Celta (Vigo) 38 13 12 13 47 44 51 .5009 Malaga CF 38 14 8 16 42 48 50 .474
10 RCD Espanyol (Barcelona) 38 13 10 15 47 51 49 .47411 Rayo Vallecano 38 15 4 19 46 68 49 .44712 Real Sociedad (San Sebastian) 38 11 13 14 44 51 46 .46113 Elche CF 38 11 8 19 35 62 41 .39514 Levante UD (Valencia) 38 9 10 19 34 67 37 .36815 Getafe CF 38 10 5 21 33 64 37 .32916 RC Deportivo (La Coruna) 38 7 14 17 35 60 35 .36817 Granada CF 38 7 14 17 29 64 35 .36818 SD Eibar 38 9 8 21 34 55 35 .34219 UD Almeria 38 8 8 22 35 64 32 .31620 Cordoba CF 38 3 11 24 22 68 20 .224
ENGLISH PREMIER LEAGUE
SPANISH LA LIGA
EFL CHAMPIONSHIP (D2)

P W D L GF GA PTS Win%1 Juventus FC (Torino) 38 26 9 3 72 24 87 .8032 AS Roma 38 19 13 6 54 31 70 .6713 SS Lazio (Roma) 38 21 6 11 71 38 69 .6324 AC Fiorentina 38 18 10 10 61 46 64 .6055 SSC Napoli 38 18 9 11 70 54 63 .5926 Genoa CFC 38 16 11 11 62 47 59 .5667 UC Sampdoria 38 13 17 8 48 42 56 .5668 FC Internazionale (Milan) 38 14 13 11 59 48 55 .5399 Torino FC 38 14 12 12 48 45 54 .526
10 Milan AC 38 13 13 12 56 50 52 .51311 US Città di Palermo 38 12 13 13 53 55 49 .48712 US Sassuolo 38 12 13 13 49 57 49 .48713 Hellas Verona FC 38 11 13 14 49 65 46 .46114 AC Chievo Verona 38 10 13 15 28 41 43 .43415 Empoli FC 38 8 18 12 46 52 42 .44716 Udinese Calcio 38 10 11 17 43 56 41 .40817 Atalanta BC 38 7 16 15 38 57 37 .39518 Cagliari Calcio 38 8 10 20 48 68 34 .34219 AC Cesena 38 4 12 22 36 73 24 .26320 Parma FC 38 6 8 24 33 75 19 .263
P W D L GF GA PTS Win%1 Paris-Saint-Germain FC 38 24 11 3 83 36 83 .7762 Olympique Lyonnais 38 22 9 7 72 33 75 .6973 AS Monaco 38 20 11 7 51 26 71 .6714 Olympique de Marseille 38 21 6 11 76 42 69 .6325 AS Saint-Etienne 38 19 12 7 51 30 68 .6586 FC Girondins Bordeaux 38 17 12 9 47 44 63 .6057 Montpellier-Herault 38 16 8 14 46 39 56 .5268 Lille OSC 38 16 8 14 43 42 56 .5269 Stade Rennais FC 38 13 11 14 35 42 50 .487
10 En Avant Guingamp 38 15 4 19 41 55 49 .44711 OGC Nice 38 13 9 16 44 53 48 .46112 SC Bastia 38 12 11 15 37 46 47 .46113 SM Caen 38 12 10 16 54 55 46 .44714 FC Nantes 38 11 12 15 29 40 45 .44715 Stade de Reims 38 12 8 18 47 66 44 .42116 FC Lorient 38 12 7 19 44 50 43 .40817 Toulouse FC 38 12 6 20 43 64 42 .39518 Evian-Thonon Gaillard FC 38 11 4 23 41 62 37 .34219 FC Metz 38 7 9 22 31 61 30 .30320 RC Lens 38 7 8 23 32 61 29 .289
P W D L GF GA PTS Win%1 FC Bayern Munchen 34 25 4 5 80 18 79 .7942 VfL Wolfsburg 34 20 9 5 72 38 69 .7213 Borussia Monchengladbach 34 19 9 6 53 26 66 .6914 Bayer 04 Leverkusen 34 17 10 7 62 37 61 .6475 FC Augsburg 34 15 4 15 43 43 49 .5006 FC Schalke 04 34 13 9 12 42 40 48 .5157 Borussia Dortmund 34 13 7 14 47 42 46 .4858 TSG 1899 Hoffenheim 34 12 8 14 49 55 44 .4719 Eintracht Frankfurt 34 11 10 13 56 62 43 .471
10 SV Werder Bremen 34 11 10 13 50 65 43 .47111 FSV Mainz 05 34 9 13 12 45 47 40 .45612 FC Koln 34 9 13 12 34 40 40 .45613 Hannover 96 34 9 10 15 40 56 37 .41214 VfB Stuttgart 34 9 9 16 42 60 36 .39715 Hertha BSC Berlin 34 9 8 17 36 52 35 .38216 Hamburger SV 34 9 8 17 25 50 35 .38217 SC Freiburg 34 7 13 14 36 47 34 .39718 SC Paderborn 07 34 7 10 17 31 65 31 .353
ITALIAN SERIE A
FRENCH LIGUE 1
GERMAN BUNDESLIGA

Rank League/Club Coef. Seed Rank League/Club Coef. Seed Rank League/Club Coef. Seed1 Spain 97.7 5 Portugal 62.3 9 Ukraine 41.0
CL1 FC Barcelona 165.0 CL/GS CL1 Benfica 118.3 CL/GS CL1 Dinamo Kiev 65.0 CL/GSCL2 Real Madrid 172.0 CL/GS CL2 FC Porto 111.3 CL/GS CL2 Shakhtar Donetsk 86.0 CL/Q3CL3 Atletico Madrid 121.0 CL/GS CL3 Sporting CP Lisbon 56.3 CL/Q4 EL1 Dnipro Dnipropetrovsk 52.0 EL/GSEL* Sevilla 80.5 CL/GS EL1 Sporting Braga 51.8 EL/GS EL2 Zorya Luhansk 10.5 EL/Q3CL4 Valencia 100.0 CL/Q4 EL2 Vitoria Guimaraes 17.8 EL/Q3 EL3 Vorskla Poltava 11.0 EL/Q3EL1 Villarreal 59.0 EL/GS EL3 CF Os Belenenses 12.3 EL/Q3 10 Belgium 36.3EL2 Athletic Bilbao 57.0 EL/Q3 6 France 56.5 CL1 AA Gent 13.4 CL/GS
2 England 84.7 CL1 Paris Saint-Germain 100.5 CL/GS CL2 Club Brugge 41.4 CL/Q3CL1 Chelsea 142.1 CL/GS CL2 Olympique Lyon 73.0 CL/GS EL1 Anderlecht 47.4 EL/GSCL2 Manchester City 87.1 CL/GS CL3 AS Monaco 31.5 CL/Q3 EL2 Standard Liege 25.4 EL/Q3CL3 Arsenal 110.1 CL/GS EL1 Olympique Marseille 55.5 EL/GS EL3 Charleroi 7.4 EL/Q2CL4 Manchester United 103.1 CL/Q4 EL2 AS Saint-Etienne 17.0 EL/Q3 11 Turkey 34.2EL1 Tottenham Hotspur 84.1 EL/GS EL3 Girondins Bordeaux 24.5 EL/Q3 CL1 Galatasaray 50.0 CL/GSEL2 Liverpool 47.1 EL/GS 7 Russia 47.0 CL2 Fenerbahce 30.0 CL/Q3EL3 Southampton FC 16.1 EL/Q3 CL1 Zenit St. Petersburg 90.1 CL/GS EL1 Besiktas 36.5 EL/GSFP West Ham United 16.1 EL/Q1 CL2 CSKA Moscow 55.6 CL/Q3 EL2 Istanbul Basaksehir 6.5 EL/Q33 Germany 81.6 CW Lokomotiv Moscow 23.1 EL/GS EL3 Trabzonspor 36.5 EL/Q2
CL1 Bayern Munchen 154.9 CL/GS EL2 FK Krasnodar 15.1 EL/Q3 12 Greece 33.6CL2 VfL Wolfsburg 31.9 CL/GS EL3 Rubin Kazan 57.1 EL/Q3 CL1 Olympiakos Piraeus 62.4 CL/GSCL3 Borussia Mönchengladbach 33.9 CL/GS 8 Netherlands 44.3 CL2 Panathinaikos 19.9 CL/Q3CL4 Bayer Leverkusen 87.9 CL/Q4 CL1 PSV Eindhoven 58.2 CL/GS EL1 Asteras Tripolis 13.4 EL/GSEL1 FC Augsburg 15.9 EL/GS CL2 Ajax 66.2 CL/Q3 EL2 Atromitos FC 10.4 EL/Q3EL2 Schalke 04 111.9 EL/GS CW FC Groningen 8.7 EL/GS EL3 PAOK Thessaloniki 40.9 EL/Q2EL3 Borussia Dortmund 99.9 EL/Q3 EL2 AZ Alkmaar 46.7 EL/Q3
4 Italy 66.9 EL3 Vitesse Arnhem 10.2 EL/Q3 CL UEFA Champions LeagueCL1 Juventus 95.1 CL/GS FP Go Ahead Eagles 8.2 EL/Q1 EL UEFA Europa LeagueCL2 AS Roma 43.6 CL/GS GS Group StageCL3 Lazio 49.1 CL/Q4 Q Qualifying RoundEL1 Fiorentina 49.1 EL/GS FP Fair playspot in ELEL2 Napoli 84.1 EL/GSEL3 Sampdoria 18.1 EL/Q3
UEFA Seeding Coefficients for Champions and Europa Leagues Top 12 Domestic Leagues 2015-16
The Group Stage involves 8 groups of 4 teams each with 10 winners from 4th qualifying round; 12 champions from countries ranked 1-12; 6 2nd-placed teams from countries ranked 1-6; 3 3rd-placed teams from countries ranked 1-3; and defending UCL or Europa Champion. Knockout phase: From the last 16 until semi-finals, clubs play two home-and-away games with the same rules as the qualifying and play-off rounds. The side that scores the greater aggregate of goals qualifies for the next round. The third-placed finishers in every group enter the UEFA Europa League round of 32. In the last 16, group winners play runners-up rather than teams from own pool or nation, from quarter-finals onwards the draw is free.
Playoff round 4 involves 20 teams split in two sections: Champions section with 10 teams 10 winners from 3rd qualifying round Non-Champions section with 10 teams, 5 winners from 3rd qualifying round, 2 third-placed teams from countries ranked 4-5, 3 fourth-placed teams from countries ranked 1-3.
The Champions League has 32 teams in a group stagethat is preceded by four qualifying stages. The last qualifying round is also called the play-off round. The champions of all countries enter the Champions League, but high ranked countries can send up to 5 teams. Some teams of high ranked countries are directly qualified for the group stage, while others have to play qualifying rounds. The Group Stage is followed by 16 teams in 4 knockout rounds.