Embed Size (px)
Citation preview
What Are the Benefits of Hostinga Major League Sports Franchise?
By Jordan Rappaport and Chad Wilkerson
Over the last few decades the number of U.S. metropolitan areaslarge enough to host a franchise from one of the four majorprofessional sports leagues has soared. Even as the National
Football League, Major League Baseball, the National Basketball Asso-ciation, and the National Hockey League have expanded to includemore franchises, demand by metro areas continues to exceed supply. Asa result, metro areas have been forced to compete with each other toretain and attract franchises.
Large public expenditures on the construction of new sports facilitieshave been the main form of this competition. Sports stadiums and are-nas are extremely expensive. A new football or baseball stadium costsapproximately $325 million; a new basketball or hockey arena costsapproximately $200 million. The public’s share of these costs has aver-aged $200 million and $100 million, respectively. During the 1990smore than $6 billion in public funds was spent on construction of sportsstadiums and arenas. Almost $4 billion has already been allocatedtoward new facilities scheduled to open by the end of 2004.
The large public spending on sports facilities has been controversial.Usually these costly projects are justified by claims that hosting a sportsfranchise spurs local economic development by creating numerous newjobs and boosting local tax revenue. However, independent economicstudies suggest that taxpayers may not be getting such a good deal. In
Jordan Rappaport is an economist at the Federal Reserve Bank of Kansas City. Chad Wilkersonis an associate economist at the bank. This article is on the bank’s web site at www.kc.frb.org.
55
Rappaport/Wilkerson.qxd 4/25/01 3:14 PM Page 55
seeking to quantify the job creation and tax revenue benefits producedby a sports franchise, these studies overwhelmingly find that the bene-fits are much smaller than the outlay of public funds.
Does this mean that public funding of sports franchises is not justi-fied? Perhaps not. An important element missing in the debate is theimpact of a sports franchise on a metro area’s quality of life. While diffi-cult to measure, the contribution of a sports franchise to quality of lifemay exceed more traditional job creation and tax revenue benefits. If so,when quality-of-life benefits are included in the calculation, public spend-ing may not appear to be such a bad investment for some metro areas.
The first section of this article reviews the current rush by metroareas to build sports facilities and lays out the arguments both in favorof and against using public funds to do so. The second section showswhy the job creation and tax revenue benefits from hosting a majorleague franchise fall far short of typical public outlays on constructing anew sports facility. The third section argues that the large quality-of-lifebenefits associated with hosting a major league team may justify thepublic outlays.
I. THE DEBATE ON PUBLIC FINANCINGFOR SPORTS STADIUMS
More than half the U.S. population lives in one of the 38 metroareas that host one or more teams from the four major professionalsports leagues. And millions more live in rapidly growing metro areaswith populations large enough to make them a potentially attractiveplace to locate a team. With demand for hosting major league teamsexceeding supply, both current and potential host metro areas have beenforced to compete to retain and attract franchises. Doing so almostalways requires allocating large public expenditures to the constructionof sports stadiums and arenas.
This section documents the scope and magnitude of public spend-ing on professional sports franchises. It then summarizes the claimsmade to justify such spending as well as the critique of these claims byindependent economists.
56 FEDERAL RESERVE BANK OF KANSAS CITY
Rappaport/Wilkerson.qxd 4/25/01 3:14 PM Page 56
The scope and magnitude of public financing for sports stadiums
The National Football League (NFL), Major League Baseball(MLB), the National Basketball Association (NBA), and the NationalHockey League (NHL) are the four most widely followed professionalsports leagues in the United States. Of the 121 teams in these fourleagues, 111 play in 92 stadiums and arenas in 38 U.S. metro areas(Appendix 1). The remaining ten teams play in eight stadiums in sixdifferent Canadian metro areas.
Since 1994, more than $8 billion has been spent constructing newstadiums to host major league teams. Another $1 billion has been spenton major renovations of existing stadiums. While a few of the stadiumswere financed privately, most received large contributions from localand state governments. Public spending on these new and renovatedstadiums has totaled $5.4 billion. An additional $3.7 billion in publicfunds has already been allocated toward the construction of stadiumsand arenas scheduled to open by the end of 2004. As a result of all thisspending, by 2004 more than two-thirds of the 111 major league teamsin the United States will be playing in venues that either opened orwere heavily renovated in the previous ten years.
Sports stadiums and arenas are expensive. For the 17 football andbaseball stadiums built since 1994, the average public contribution has
ECONOMIC REVIEW • FIRST QUARTER 2001 57
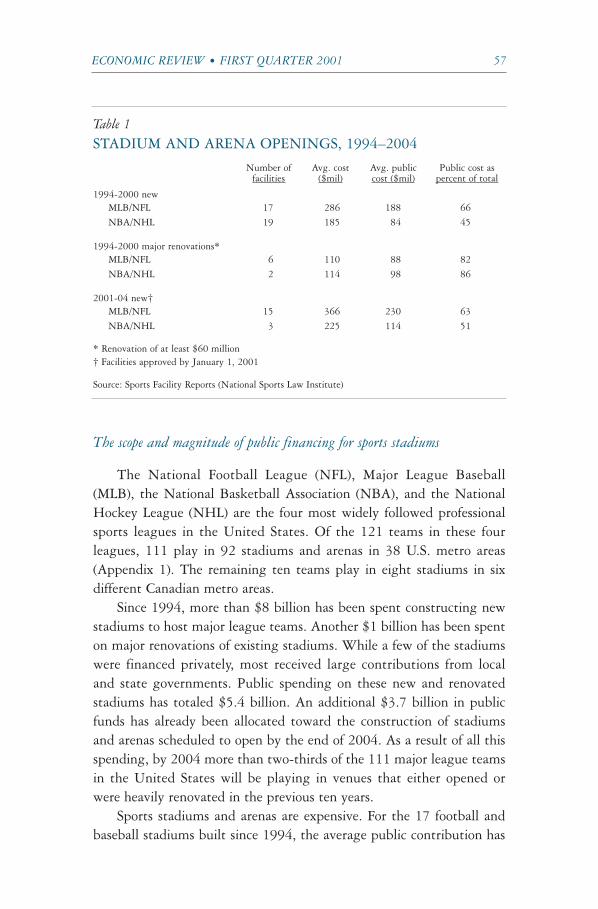
Table 1STADIUM AND ARENA OPENINGS, 1994–2004
Number of Avg. cost Avg. public Public cost asfacilities ($mil) cost ($mil) percent of total
1994-2000 newMLB/NFL 17 286 188 66NBA/NHL 19 185 84 45
1994-2000 major renovations*MLB/NFL 6 110 88 82NBA/NHL 2 114 98 86
2001-04 new†MLB/NFL 15 366 230 63NBA/NHL 3 225 114 51
* Renovation of at least $60 million† Facilities approved by January 1, 2001
Source: Sports Facility Reports (National Sports Law Institute)
Rappaport/Wilkerson.qxd 4/25/01 3:14 PM Page 57
58 FEDERAL RESERVE BANK OF KANSAS CITY
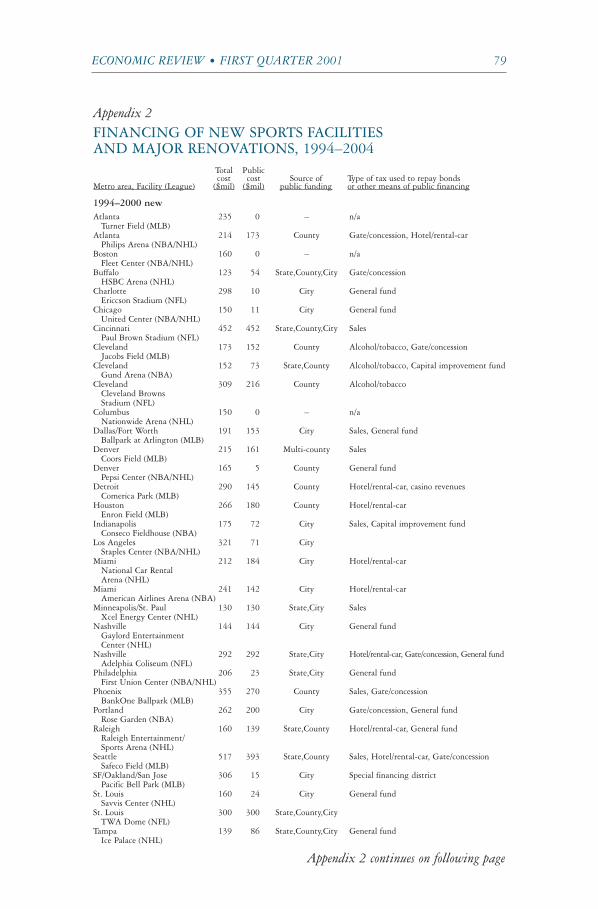
been $188 million, or 66 percent of the total cost (Table 1). For the 19basketball and hockey arenas built during the same period, the averagepublic share has been $84 million, or 45 percent of the total. The aver-age public contribution toward stadiums and arenas currently underconstruction is even higher: $230 million for baseball and football stadi-ums (63 percent of the total), and $114 million for basketball andhockey arenas (51 percent of the total). Appendix 2 shows public con-tributions for individual stadium and arena projects.
To finance their contributions toward stadium and arena projects,local and state governments issue bonds. Such bonds are usually paid offthrough various sorts of taxes enacted especially for this purpose. Salestaxes directed at tourists (for example, on hotel rooms, rental cars, andconvention space) have been an especially popular method used to repaystadium bonds. Also common are general sales taxes that can applyacross multiple counties or only in the county or municipality where thestadium is located. Other means of repaying stadium bonds in recentyears have included gate taxes (surcharges on tickets to events at thesports facilities), state lottery proceeds, taxes on businesses in speciallydesignated districts, and local and state government general funds.
Justifying public spending on sports facilities
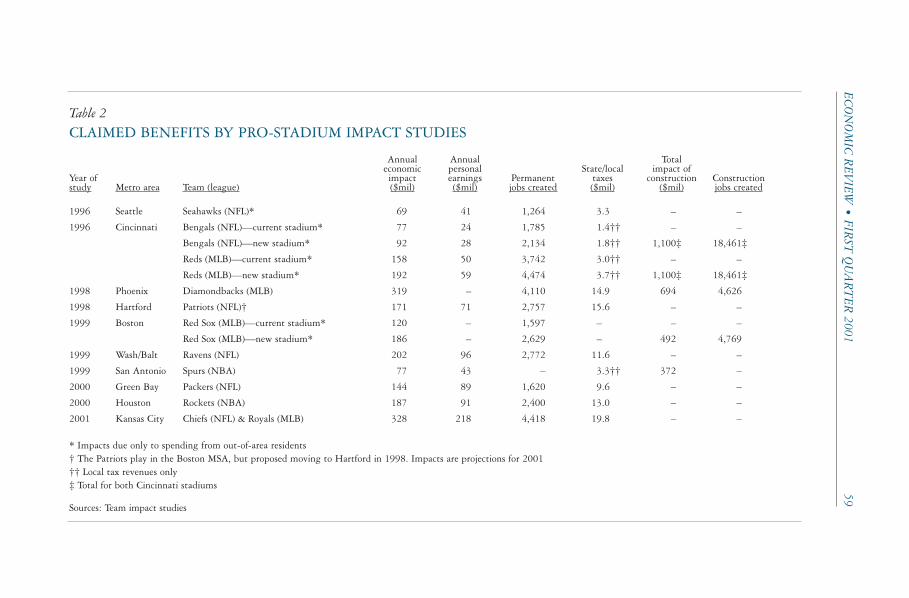
Supporters of using public expenditures to finance the constructionof sports facilities argue that hosting a major league franchise helps spureconomic development. Impact studies commissioned by stadium pro-ponents attempt to quantify how hosting a team affects a variety oflocal economic indicators such as output, personal income, jobs, and taxrevenue. Stadium advocates suggest that increases in these indicatorsjustify the large public outlays on sports facilities.
Table 2 contains a representative sample of benefit claims made inrecent stadium impact studies. A 1996 study, for instance, argued thatthe NFL Seahawks in their former stadium increased total Seattleannual output by $69 million, increased total Seattle annual personalincome by $41 million, created 1,264 Seattle jobs, and raised $3.3 mil-lion in state and local taxes per year. Impact studies also often label theexpenditures and jobs associated with the construction phase of stadiumprojects as economic benefits. For instance, a 1996 study supporting thepublic financing of separate new sports stadiums for Cincinnati’s NFLBengals and MLB Reds suggests that the construction of these two sta-
Rappaport/Wilkerson.qxd 4/25/01 3:14 PM Page 58
ECON
OM
IC REV
IEW •
FIRST
QU
AR
TER
200159
Table 2CLAIMED BENEFITS BY PRO-STADIUM IMPACT STUDIES
Annual Annual Totaleconomic personal State/local impact of
Year of impact earnings Permanent taxes construction Constructionstudy Metro area Team (league) ($mil) ($mil) jobs created ($mil) ($mil) jobs created
1996 Seattle Seahawks (NFL)* 69 41 1,264 3.3 – –
1996 Cincinnati Bengals (NFL)—current stadium* 77 24 1,785 1.4†† – –
Bengals (NFL)—new stadium* 92 28 2,134 1.8†† 1,100‡ 18,461‡
Reds (MLB)—current stadium* 158 50 3,742 3.0†† – –
Reds (MLB)—new stadium* 192 59 4,474 3.7†† 1,100‡ 18,461‡
1998 Phoenix Diamondbacks (MLB) 319 – 4,110 14.9 694 4,626
1998 Hartford Patriots (NFL)† 171 71 2,757 15.6 – –
1999 Boston Red Sox (MLB)—current stadium* 120 – 1,597 – – –
Red Sox (MLB)—new stadium* 186 – 2,629 – 492 4,769
1999 Wash/Balt Ravens (NFL) 202 96 2,772 11.6 – –
1999 San Antonio Spurs (NBA) 77 43 – 3.3†† 372 –
2000 Green Bay Packers (NFL) 144 89 1,620 9.6 – –
2000 Houston Rockets (NBA) 187 91 2,400 13.0 – –
2001 Kansas City Chiefs (NFL) & Royals (MLB) 328 218 4,418 19.8 – –
* Impacts due only to spending from out-of-area residents† The Patriots play in the Boston MSA, but proposed moving to Hartford in 1998. Impacts are projections for 2001†† Local tax revenues only‡ Total for both Cincinnati stadiums
Sources: Team impact studies
Rappaport/Wilkerson.qxd 4/25/01 3:14 PM Page 59
60 FEDERAL RESERVE BANK OF KANSAS CITY
diums would generate $1.1 billion in economic activity for the Cincin-nati metro area and create 18,461 temporary jobs.
These impact studies that justify stadium projects can be subject to anumber of criticisms. Many of the studies look at only the positive effectsof hosting a major league franchise. Taking account of negative effectssuch as offsetting job losses, however, would produce much lower esti-mates of the net impact on local economic development. Moreover, theimpact studies almost always fail to measure benefits in a form that canbe compared with public outlays. While increases in output, increases inpersonal income, and job creation all measure increases in underlyingeconomic activity, how should a metro area value these increases?
In response to the shortcomings of such impact studies, independ-ent economists have attempted to measure the effect of professionalsports teams on metro areas in a number of ways. One method is tocompare growth rates of metro areas with and without professionalteams, after controlling for other variables. For example, in a study ofthe growth of per capita personal income in 48 metro areas from 1958to 1987, Baade (1994) found no significant difference between metroareas with major league teams and those without. In a study of 46metro areas from 1990 to 1994, Walden actually found a negative rela-tionship between economic activity and the presence of a sports team.
A second way of measuring the impact of teams is to examine thesubsequent growth of cities that acquire new teams. Baade and Sander-son did this for ten metro areas that obtained new franchises between1958 and 1993 and found no significant increases in employment oroutput. Results from Coates and Humphreys showed that per capitaincome fell when metro areas added teams.
Still another approach to measuring the impact of professionalsports teams is to analyze the specific economic activity generated byspecific teams in specific locations. For example, Hamilton and Kahnmeasured the annual returns to Maryland residents from Baltimore’sNFL Ravens at approximately $1 million, compared to a $14 millionannual public cost for their new stadium. Similarly, Baade (1997) meas-ured the annual returns to Washington state residents from Seattle’sMLB Mariners at between $3.8 and $5.1 million, compared to a $28million annual public cost for their new stadium.
Regardless of method, none of the academic studies has so far beenable to find significant economic development benefits sufficient to jus-
Rappaport/Wilkerson.qxd 4/25/01 3:14 PM Page 60
ECONOMIC REVIEW • FIRST QUARTER 2001 61
tify the large public outlays. As Siegfried and Zimbalist concluded in arecent survey of the economics of sports facilities,
Few fields of empirical economic research offer virtual unanimity of findings. Yet,independent work on the economic impact of stadiums and arenas has uniformlyfound that there is no statistically significant positive correlation between sportsfacility construction and economic development.
Similarly, Noll and Zimbalist introduced a collection of 14 essays onthe economics of sports stadiums by stating, “The overriding conclusionof this discussion is that the economic case for publicly financed stadi-ums cannot credibly rest on the benefits to local business, as measuredby jobs, income, and investment.”
So which view is correct? Do sports teams promote economic devel-opment as claimed by the impact studies? Or are such economic devel-opment benefits illusory as suggested by the independent economists?The next section examines whether the economic development benefitsfrom hosting a major league franchise justify typical public outlays onsports stadiums and arenas.
II. MEASURING JOB CREATIONAND TAX REVENUE BENEFITS
To measure the benefits associated with hosting a professionalsports team, both stadium proponents and their critics focus on theincreased economic activity and additional tax revenue that may begenerated by a team’s presence. The most common measure of eco-nomic activity is the creation of new jobs. Correctly measuring the ben-efit from job creation requires both accurately accounting for the netnumber of new jobs associated with a team’s presence along with valu-ing the benefit of these jobs to the host metro area. Increased tax rev-enue resulting from the presence of the professional sports team arisesfrom sales taxes and income taxes. Estimates of the combined benefitsfrom net job creation and increased tax revenue fall considerably shortof typical public outlays on new sports stadiums and arenas.
Measuring job creation benefits
Net job creation is a relatively good measure of the possible increasein economic activity associated with hosting a professional sports team.Estimated net job creation can be explicitly valued in terms of its bene-
Rappaport/Wilkerson.qxd 4/25/01 3:14 PM Page 61
62 FEDERAL RESERVE BANK OF KANSAS CITY
fit to a metro area’s existing residents. Such an approach provides anestimate of benefits that can be directly compared with the public out-lay costs while avoiding double counting that may arise from othermethods. A possible limitation of this approach is that an increase ineconomic activity may benefit a metro area’s existing residents evenwithout any net job creation—for instance, if hosting a team causeseveryone’s wages to increase. However, the findings in numerous inde-pendent studies suggest that using net job creation to measure eco-nomic activity does not miss any large benefits.
Estimating net job creation. To estimate the number of jobs createdfrom hosting a professional sports team, it is necessary to distinguishbetween gross and net job creation. Gross job creation is the number ofjobs that can be observably linked to the presence of a sports team. Suchobservable jobs are created mainly within the stadium itself and atnearby businesses catering to people who attend sports events. But thepresence of a professional sports team also creates job losses, becauseindividuals who spend money to attend sports events have less to spendat businesses elsewhere in the host metro area. Less spending results injob losses. And benefits generally arise only from a net increase in jobs.1
Gross jobs created at a sports stadium include the players and otherteam employees; stadium management, maintenance, and supportstaff; and the various vendors selling goods at stadium events. Grossjobs created at nearby stadium businesses arise from the before-gameand after-game spending of people attending sports events. Dependingon the specific design and location of a sports stadium, such spendingmay support a number of local businesses, such as parking lots, restau-rants, nightclubs, and souvenir shops. Some additional tourism-relatedjobs that can be linked to the presence of a sports team may also be cre-ated further away from stadiums. These arise from the spending of peo-ple who visit a host metro area to attend a sports event—for instance, athotels and restaurants located throughout the metro area.2
Both stadium and nearby-stadium job creation may be offset by joblosses throughout a host metro area. Such job losses must be subtractedfrom the above job gains to obtain an estimate of net job creation. Inparticular, economic research shows that people’s total spending onentertainment is not affected by the presence of a professional sportsteam. For example, the more people spend on attending sports events,the less they may spend on movies and restaurants (Baade and Sander-son). Similarly, the more people spend at restaurants and nightclubs
Rappaport/Wilkerson.qxd 4/25/01 3:14 PM Page 62
ECONOMIC REVIEW • FIRST QUARTER 2001 63
located near a stadium, the less they may spend at restaurants andnightclubs located elsewhere. Because the job losses from lower spend-ing are spread across a large number of businesses and a wide geo-graphic area, they usually cannot be observably linked to the presenceof a sports team.
In addition to observable gross jobs, hosting a professional sportsteam also creates unobservable “local multiplier” jobs. These jobs arisefrom changes in local spending due to gross job creation and the offset-ting job losses. For example, local spending by team players supportsjobs across a range of local service industries, including at restaurants,nightclubs, and retail stores. Hence the total number of jobs created ina host metro area is some multiple of the observable number of jobs cre-ated. Similarly, the reduced local spending of people who lose jobscauses additional, again unobservable, job losses. Hence the total num-ber of jobs lost is some multiple of the “initial” (also unobservable) num-ber of jobs lost.3
Because local multiplier jobs cannot be easily linked to a sportsteam’s presence, the size of the local multiplier is controversial. Esti-mates of total job creation in the stadium impact studies use local mul-tipliers as high as 2.5. In other words, these studies assume that 2.5total jobs are created for each initial observable job created from hostinga sports team. In contrast, the independent economic studies suggestthat the appropriate local multiplier to apply to the gross jobs createdfrom hosting a sports team is probably no more than 1.25 (Hamiltonand Kahn; Siegfried and Zimbalist). The lower local multipliers used bythe independent studies appear more reasonable because a large portionof local spending goes to purchase goods and services produced outsidethe host metro area. In addition, many professional sports players resideoutside the metro area in which they play, either during the off-seasonor following retirement.
Taking explicit account of job losses and using estimates of the localmultiplier from independent studies suggest that the net number ofjobs created from hosting a professional sports team is quite low. It isalmost certainly less than 1,000 and likely to be much closer to zero.For example, the methodology and numbers reported in Hamilton andKahn suggest that Baltimore’s hosting of the Orioles baseball team hascreated just 770 jobs in the Baltimore metro area. Statistical analysisreported in Baade and Sanderson found evidence of positive net job cre-ation in only three of ten metro areas examined; their highest estimate
Rappaport/Wilkerson.qxd 4/25/01 3:14 PM Page 63
64 FEDERAL RESERVE BANK OF KANSAS CITY
of the number of net jobs created from hosting a sports team was 356(associated with the Kansas City Royals). Surveying the economics liter-ature, Siegfried and Zimbalist concluded that hosting a sports teammight actually be associated with net job destruction rather than netjob creation.4
Valuing the benefits from net job creation. To measure the benefit fromincreased economic activity, it is not enough just to estimate the netnumber of jobs created. It is also necessary to value explicitly the bene-fit of these jobs to the metro area.
It is important to realize that a metro area’s existing residents maynot benefit at all from net job creation. Consider the case of metro arearesidents who already have high paying jobs which they enjoy. How dothey benefit from more jobs in a metro area? On the positive side, prop-erty prices are likely to rise and local governments may be able to raiserevenues from a larger tax base, in turn allowing for lower tax rates. Onthe negative side, a rise in property prices could make housing lessaffordable, and traffic and other sorts of congestion may increase. Forsome existing residents, the net result may be that they are hurt ratherthan helped by net job creation.5
Whether and how much a metro area benefits from net job creationis an empirical question that a number of economists have attempted toanswer. In particular, statistical techniques have been used to look at thecorrelations across metro areas among population, employment, wages,and house values. For a given increase in population and employment,benefits accrue through associated rises in wages or house values. Forpeople who do not own their homes, net benefits are likely be negligibleas any rise in wages is offset by the higher cost of housing. But for resi-dents who already own a home, there is no offset and so benefits may bepositive.
Using such techniques, economists have estimated metro area ben-efits to range from $0 to $1,500 per net job created (Rosen; Roback;Gyourko and Tracy; and Hamilton and Kahn).6 At one extreme, if thebenefit per net job created is indeed zero, metro areas will not benefit atall from any possible net job creation from hosting a professional sportsteam. At the other extreme, even if the benefit per net job created is atits upper bound estimate of $1,500, the total benefit to a metro areafrom any net jobs created will be far smaller than the total of the associ-ated salaries.
Rappaport/Wilkerson.qxd 4/25/01 3:14 PM Page 64
ECONOMIC REVIEW • FIRST QUARTER 2001 65
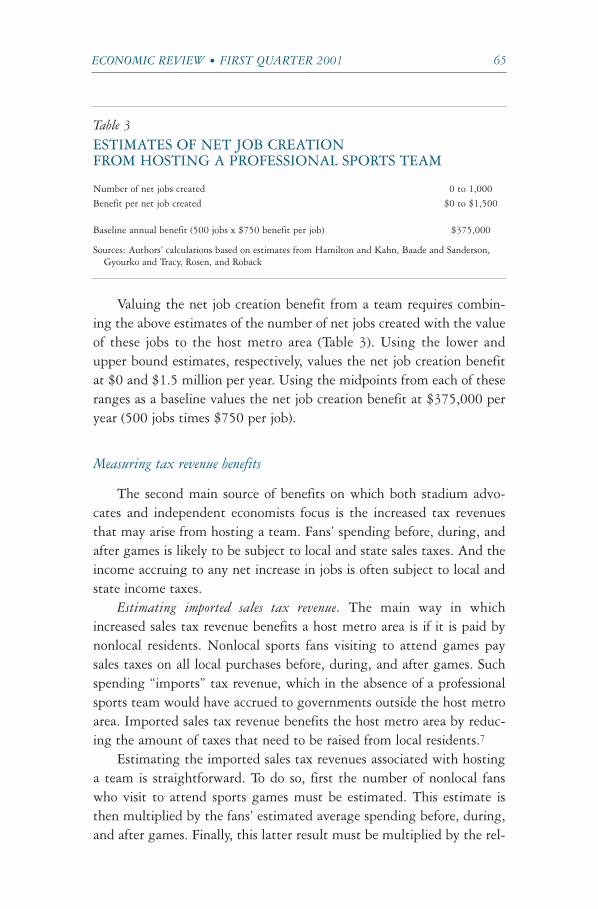
Valuing the net job creation benefit from a team requires combin-ing the above estimates of the number of net jobs created with the valueof these jobs to the host metro area (Table 3). Using the lower andupper bound estimates, respectively, values the net job creation benefitat $0 and $1.5 million per year. Using the midpoints from each of theseranges as a baseline values the net job creation benefit at $375,000 peryear (500 jobs times $750 per job).
Measuring tax revenue benefits
The second main source of benefits on which both stadium advo-cates and independent economists focus is the increased tax revenuesthat may arise from hosting a team. Fans’ spending before, during, andafter games is likely to be subject to local and state sales taxes. And theincome accruing to any net increase in jobs is often subject to local andstate income taxes.
Estimating imported sales tax revenue. The main way in whichincreased sales tax revenue benefits a host metro area is if it is paid bynonlocal residents. Nonlocal sports fans visiting to attend games paysales taxes on all local purchases before, during, and after games. Suchspending “imports” tax revenue, which in the absence of a professionalsports team would have accrued to governments outside the host metroarea. Imported sales tax revenue benefits the host metro area by reduc-ing the amount of taxes that need to be raised from local residents.7
Estimating the imported sales tax revenues associated with hostinga team is straightforward. To do so, first the number of nonlocal fanswho visit to attend sports games must be estimated. This estimate isthen multiplied by the fans’ estimated average spending before, during,and after games. Finally, this latter result must be multiplied by the rel-
Table 3ESTIMATES OF NET JOB CREATIONFROM HOSTING A PROFESSIONAL SPORTS TEAM
Number of net jobs created 0 to 1,000Benefit per net job created $0 to $1,500
Baseline annual benefit (500 jobs x $750 benefit per job) $375,000
Sources: Authors’ calculations based on estimates from Hamilton and Kahn, Baade and Sanderson,Gyourko and Tracy, Rosen, and Roback
Rappaport/Wilkerson.qxd 4/25/01 3:14 PM Page 65
66 FEDERAL RESERVE BANK OF KANSAS CITY
evant local sales tax rate. The difficult part, of course, is estimating thenumber of visitors and how much they spend on average. Among thefour major professional sports leagues, specifics such as ticket prices,average attendance, and the number of home games per season varyenough to require separate estimates. And regardless of league, it isnecessary to distinguish nonlocal sports fans who visit for the purpose ofattending a game from nonlocal visitors who happen to attend a game.
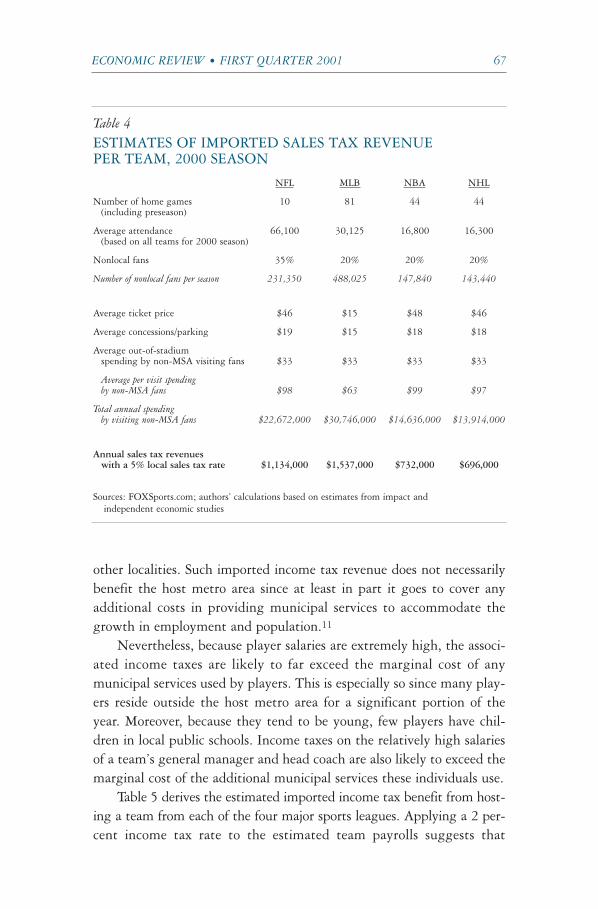
Table 4 derives the estimated imported sales tax benefit from hostinga team from each of the four major sports leagues. The listed percentagesof nonlocal visiting fans are toward the high end of estimates from anumber of impact and economic studies.8 For calculating the importedsales tax revenue benefit attributable to hosting a sports team, whatmatters is not the number of nonlocal residents who attend games butrather the number of nonlocal residents whose visits are explicitly moti-vated by the presence of a team. The distinction is crucial. Nonlocal res-idents who attend games may be visiting the host metro area fornon-game-related reasons such as business or family. If so, their spendingat games most likely represents a shifting away from spending on otherforms of local entertainment and hence the associated imported tax rev-enues should not be attributed to the presence of the sports team.9
Average spending by visiting sports fans is estimated to range from$63 for MLB games to $99 for NBA games. The concession portion ofaverage spending is based on the purchase of a representative bundle offood, merchandise, and parking at the average 2000 season price in therespective league (FOXSports.com). The out-of-stadium portion ofaverage spending is based on a survey of fans attending Baltimore Ori-oles games in 1992, converted to 2000 dollars (Hamilton and Kahn).
The imported tax revenue from a given amount of visitors’ spend-ing obviously depends on the applicable rate of sales tax. Assuming anextremely high local sales tax rate of 5 percent suggests that hosting asports team imports from $696,000 per year for an NHL team to$1,537,000 per year for an MLB team. At a more typical local sales taxrate of 2 percent, imported sales tax revenues for the four types of teamsrange from just $278,400 per year for an NHL team to $614,800 peryear for an MLB team.10
Estimating income tax revenue. Many of the localities in which profes-sional sports teams play levy local income taxes. If so, the income taxrevenue on salaries due to any net job creation is imported in the sensethat in the absence of a professional sports team, it would be paid to
Rappaport/Wilkerson.qxd 4/25/01 3:14 PM Page 66
ECONOMIC REVIEW • FIRST QUARTER 2001 67
other localities. Such imported income tax revenue does not necessarilybenefit the host metro area since at least in part it goes to cover anyadditional costs in providing municipal services to accommodate thegrowth in employment and population.11
Nevertheless, because player salaries are extremely high, the associ-ated income taxes are likely to far exceed the marginal cost of anymunicipal services used by players. This is especially so since many play-ers reside outside the host metro area for a significant portion of theyear. Moreover, because they tend to be young, few players have chil-dren in local public schools. Income taxes on the relatively high salariesof a team’s general manager and head coach are also likely to exceed themarginal cost of the additional municipal services these individuals use.
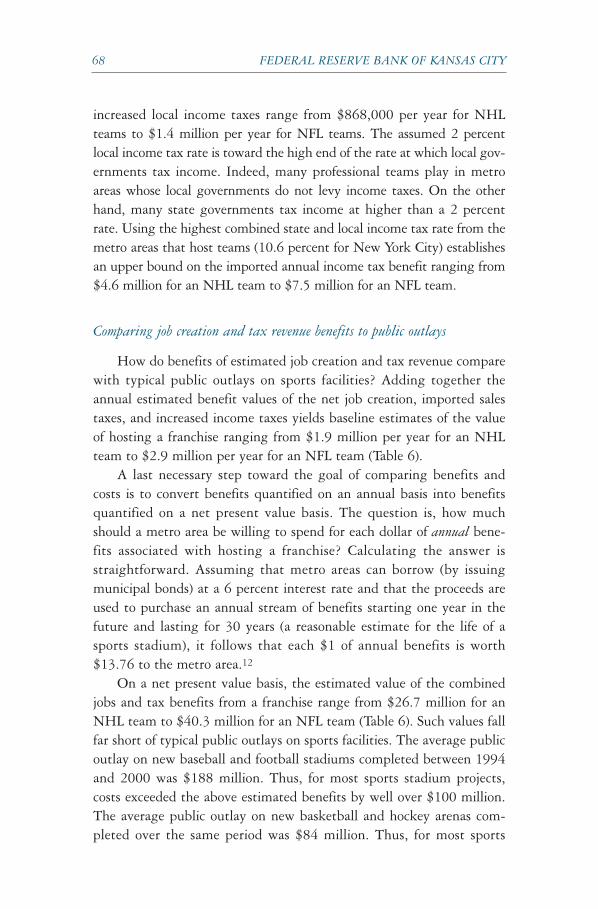
Table 5 derives the estimated imported income tax benefit from host-ing a team from each of the four major sports leagues. Applying a 2 per-cent income tax rate to the estimated team payrolls suggests that
Table 4ESTIMATES OF IMPORTED SALES TAX REVENUEPER TEAM, 2000 SEASON
NFL MLB NBA NHL
Number of home games 10 81 44 44(including preseason)
Average attendance 66,100 30,125 16,800 16,300(based on all teams for 2000 season)
Nonlocal fans 35% 20% 20% 20%
Number of nonlocal fans per season 231,350 488,025 147,840 143,440
Average ticket price $46 $15 $48 $46
Average concessions/parking $19 $15 $18 $18
Average out-of-stadiumspending by non-MSA visiting fans $33 $33 $33 $33
Average per visit spendingby non-MSA fans $98 $63 $99 $97
Total annual spendingby visiting non-MSA fans $22,672,000 $30,746,000 $14,636,000 $13,914,000
Annual sales tax revenueswith a 5% local sales tax rate $1,134,000 $1,537,000 $732,000 $696,000
Sources: FOXSports.com; authors’ calculations based on estimates from impact andindependent economic studies
Rappaport/Wilkerson.qxd 4/25/01 3:14 PM Page 67
68 FEDERAL RESERVE BANK OF KANSAS CITY
increased local income taxes range from $868,000 per year for NHLteams to $1.4 million per year for NFL teams. The assumed 2 percentlocal income tax rate is toward the high end of the rate at which local gov-ernments tax income. Indeed, many professional teams play in metroareas whose local governments do not levy income taxes. On the otherhand, many state governments tax income at higher than a 2 percentrate. Using the highest combined state and local income tax rate from themetro areas that host teams (10.6 percent for New York City) establishesan upper bound on the imported annual income tax benefit ranging from$4.6 million for an NHL team to $7.5 million for an NFL team.
Comparing job creation and tax revenue benefits to public outlays
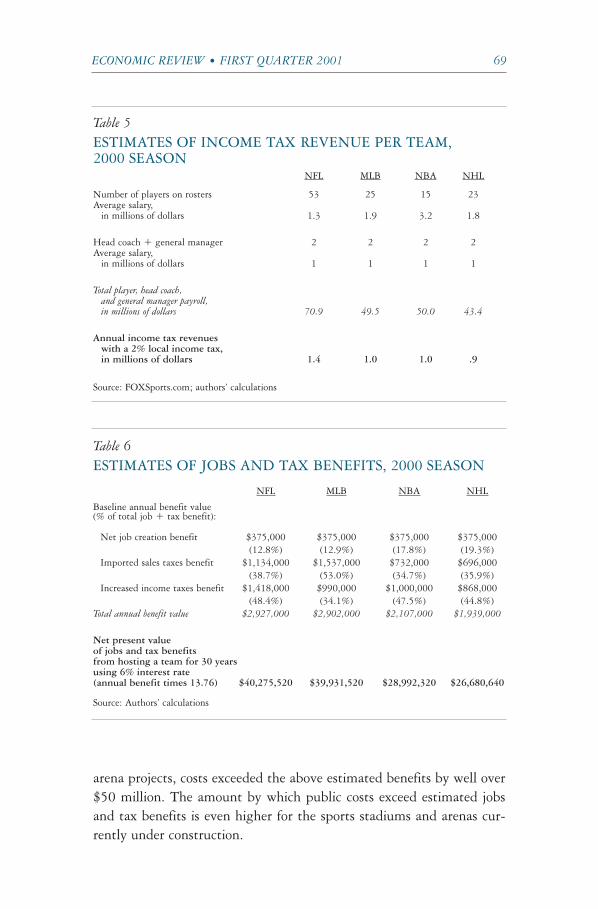
How do benefits of estimated job creation and tax revenue comparewith typical public outlays on sports facilities? Adding together theannual estimated benefit values of the net job creation, imported salestaxes, and increased income taxes yields baseline estimates of the valueof hosting a franchise ranging from $1.9 million per year for an NHLteam to $2.9 million per year for an NFL team (Table 6).
A last necessary step toward the goal of comparing benefits andcosts is to convert benefits quantified on an annual basis into benefitsquantified on a net present value basis. The question is, how muchshould a metro area be willing to spend for each dollar of annual bene-fits associated with hosting a franchise? Calculating the answer isstraightforward. Assuming that metro areas can borrow (by issuingmunicipal bonds) at a 6 percent interest rate and that the proceeds areused to purchase an annual stream of benefits starting one year in thefuture and lasting for 30 years (a reasonable estimate for the life of asports stadium), it follows that each $1 of annual benefits is worth$13.76 to the metro area.12
On a net present value basis, the estimated value of the combinedjobs and tax benefits from a franchise range from $26.7 million for anNHL team to $40.3 million for an NFL team (Table 6). Such values fallfar short of typical public outlays on sports facilities. The average publicoutlay on new baseball and football stadiums completed between 1994and 2000 was $188 million. Thus, for most sports stadium projects,costs exceeded the above estimated benefits by well over $100 million.The average public outlay on new basketball and hockey arenas com-pleted over the same period was $84 million. Thus, for most sports
Rappaport/Wilkerson.qxd 4/25/01 3:14 PM Page 68
ECONOMIC REVIEW • FIRST QUARTER 2001 69
arena projects, costs exceeded the above estimated benefits by well over$50 million. The amount by which public costs exceed estimated jobsand tax benefits is even higher for the sports stadiums and arenas cur-rently under construction.
Table 5ESTIMATES OF INCOME TAX REVENUE PER TEAM,2000 SEASON
NFL MLB NBA NHL
Number of players on rosters 53 25 15 23Average salary,
in millions of dollars 1.3 1.9 3.2 1.8
Head coach + general manager 2 2 2 2Average salary,
in millions of dollars 1 1 1 1
Total player, head coach,and general manager payroll,in millions of dollars 70.9 49.5 50.0 43.4
Annual income tax revenueswith a 2% local income tax,in millions of dollars 1.4 1.0 1.0 .9
Source: FOXSports.com; authors’ calculations
Table 6ESTIMATES OF JOBS AND TAX BENEFITS, 2000 SEASON
NFL MLB NBA NHL
Baseline annual benefit value(% of total job + tax benefit):
Net job creation benefit $375,000 $375,000 $375,000 $375,000(12.8%) (12.9%) (17.8%) (19.3%)
Imported sales taxes benefit $1,134,000 $1,537,000 $732,000 $696,000(38.7%) (53.0%) (34.7%) (35.9%)
Increased income taxes benefit $1,418,000 $990,000 $1,000,000 $868,000(48.4%) (34.1%) (47.5%) (44.8%)
Total annual benefit value $2,927,000 $2,902,000 $2,107,000 $1,939,000
Net present valueof jobs and tax benefitsfrom hosting a team for 30 yearsusing 6% interest rate(annual benefit times 13.76) $40,275,520 $39,931,520 $28,992,320 $26,680,640
Source: Authors’ calculations
Rappaport/Wilkerson.qxd 4/25/01 3:14 PM Page 69
70 FEDERAL RESERVE BANK OF KANSAS CITY
If anything, the baseline values estimated above likely overstaterather than understate the benefits they measure. As discussed, there ismuch doubt that hosting a professional sports team creates any jobs.Moreover, many host metro areas tax spending at a rate lower than theassumed 5 percent baseline. And, many do not tax income at all. As aresult, it is reasonable to believe that the net present value of the jobsand tax benefits may be no more than $5 million from hosting an NBAor NHL team and no more than $10 million from hosting an NFL orMLB team. Even using the upper-bound estimates from the analysisabove suggests that the public outlays on current sports facility projectsfar exceed any associated jobs and tax benefits.
The bottom line, then, is that the benefit to a host metro area fromincreased economic activity as measured by net job creation andincreased tax revenues appears to fall far short of the public outlays typ-ically needed to retain and attract professional sports teams. Neverthe-less, metro areas continue to approve ever-larger public outlays on newsports facility construction. If such public outlays represent good invest-ments, there must be some other large benefit from hosting a team thatthe above analysis is not measuring. The next section explores whethera professional sports team’s contribution to a host area’s quality of lifemay be exactly such a benefit.
III. QUALITY-OF-LIFE BENEFITSFROM HOSTING A MAJOR LEAGUE FRANCHISE
The presence of a major league sports franchise can help make ametro area an attractive place to live. Nearly all analyses of the benefitsfrom hosting professional sports teams recognize this contribution to ametro area’s quality of life. But because quality-of-life benefits are diffi-cult to quantify, stadium proponents and critics usually pay them littleattention beyond such acknowledgment.
The term “quality of life” used in this article is meant to capture thesatisfaction, or happiness, residents derive from shared metro areaattributes. Examples of shared attributes include pleasant weather, sce-nic vistas, and natural recreational opportunities. Of course, residents’happiness also depends on their individual circumstances, such as hav-ing a good job and living in a nice house.
This section discusses how the presence of a major league franchisecontributes to the quality of life of a host metro area’s residents. Three
Rappaport/Wilkerson.qxd 4/25/01 3:14 PM Page 70
ECONOMIC REVIEW • FIRST QUARTER 2001 71
possible ways of valuing this benefit are presented. Together they sug-gest that hosting a major league franchise contributes substantially toquality of life and perhaps justifies public outlays on sports stadiumsand arenas.
How hosting a professional sports team contributes to quality of life
Professional sports teams contribute to a metro area’s quality of lifeprimarily by increasing the happiness of sports fans. The most visiblesource of fan happiness comes from attending home games. However,only part of this happiness actually counts as a quality-of-life benefitattributable to hosting a team. This is because fans must pay to attendgames. In the absence of a professional sports team, fans could insteaduse what they paid for game admissions on other sources of happiness,such as watching a movie or traveling to a different metro area toattend a game.
Formally, the quality-of-life benefit to a particular fan who attends asports game is the amount above the admission price they would havebeen willing to spend to attend the game. For instance, if someone iswilling to spend $30 to attend a game that only costs $20, they receivea $10 quality-of-life benefit. Adding up the individual quality-of-lifebenefits of all residents who attend games yields the total metro area’squality-of-life benefit from game attendance.13
A second source of happiness for fans comes from rooting for a teammore generally, independent of actually attending games in person.Fans watch games on television, listen to them on the radio, and readabout them in local newspapers. Games serve as an occasion for partiesand barbecues. Teams’ performance is the subject of long discussionsamong friends. And second-guessing team decisions is the subject ofnearly continuous banter on local talk radio.
It is also possible that hosting a franchise increases the happiness ofall metro area residents, regardless of their being sports fans. Homegames and rooting for a sports team provide for shared communityexperiences. And hosting a sports team may increase civic pride—forinstance, by contributing to a sense that one lives in a “world class” city.
On the other hand, hosting a team may also decrease the happinessof some metro area residents. Home games impose traffic and conges-tion in the vicinity of sports facilities. And television viewers face inter-ruption of their favorite syndicated shows by local game broadcasts.
Rappaport/Wilkerson.qxd 4/25/01 3:14 PM Page 71
72 FEDERAL RESERVE BANK OF KANSAS CITY
Such possible negative contributions must be subtracted from positivecontributions in valuing the net contribution to quality of life fromhosting a team.
Valuing quality-of-life benefits
Valuing the happiness metro area residents derive from the presenceof a major league team is extremely difficult. A person’s happiness fromattending a game or from watching one on television is not observable.Nevertheless, there are several possible approaches to valuing quality-of-life benefits. A first approach is to ask a sample of metro area residentshow much they would be willing to pay to retain or attract a team. Asecond approach uses variations in metro area wages and house prices toimplicitly value quality-of-life attributes that may be similar in magni-tude to hosting a major league franchise. A third approach looks at theactions of metro areas that have lost sports franchises and so may havethe best information on the quality-of-life benefits from hosting a team.
Surveying residents. The most direct approach to valuing the quality-of-life benefits from hosting a team is to ask local residents how muchthey would be willing to pay to keep their team from moving.
In the only major study of this kind, Pittsburgh metro area residentswere asked during the winter of 2000, “What is the most you would bewilling to pay out of your own household budget each year in higher citytaxes to keep the Penguins in Pittsburgh?” (Johnson, Groothuis, andWhitehead). The responses implicitly valued the quality-of-life benefitsfrom hosting the NHL Penguins at somewhere between $0.83 to $2.30per Pittsburgh metro area resident per year. Given metro Pittsburgh’spopulation of 2.4 million and converting to a net present value basisusing a 6 percent interest rate, as described in the previous section, thevalue of hosting the Penguins for 30 years is estimated to fall somewherein the range of $26.9 million to $74.7 million.
Note that the lower-bound estimate of the quality-of-life value ofhosting the Penguins is nearly the same as the baseline estimate of thejob creation and tax benefit value of doing so. The upper-bound esti-mate of the quality-of-life value of hosting the Penguins begins toapproach the $84 million average public contribution to NBA/NHLsports arenas completed between 1994 and 2000.
Moreover, there are several reasons to believe that the quality-of-lifebenefits to Pittsburgh from hosting the Penguins may be low relative to
Rappaport/Wilkerson.qxd 4/25/01 3:14 PM Page 72
ECONOMIC REVIEW • FIRST QUARTER 2001 73
such benefits associated with other major league teams. First, the qual-ity-of-life benefits from hosting an NHL team are probably the lowestof the four leagues considered in this article. For instance, only 15 of the24 NHL teams currently have local network television contracts. Andwhen NHL games are broadcast, their ratings tend to be less than halfthose for MLB games (SportsBusiness Journal). Second, Pittsburgh alsohosts the NFL Steelers and the MLB Pirates. So even if it were to losethe Penguins, Pittsburgh would still host two major league teams. Eco-nomic theory argues that the additional benefit of something decreasesthe more you have of it. Third, at the time the survey was conducted,the Penguins organization was in Chapter 11 bankruptcy proceedings.Whatever problems caused the Penguins’ financial difficulties may alsohave lowered the team’s contribution to Pittsburgh’s quality of life.Fourth, as will be argued below, it may be that only by losing a team dometro area residents come to accurately value the team’s contribution toquality of life.14
Comparing to quality-of-life valuations of other attributes. The secondapproach to valuing the quality-of-life contribution from hosting a teamconsiders the valuations of other attributes that also contribute to qual-ity of life. For instance, the quality-of-life net present value associatedwith one extra day per year of pleasant weather for 30 years turns out tobe similar in magnitude to many of the recent public outlays on sta-dium projects. So if the contribution to quality of life from hosting amajor league team is at least as great as the contribution from one extraday per year of pleasant weather, then the public outlays on sports sta-diums and arenas may be justified.
The quality-of-life benefits of certain attributes that naturally differacross metro areas, such as the weather, can be measured by variationsin wages and house prices. All else equal, metro areas with attributesthat positively contribute to residents’ happiness attract populationinflows. This puts downward pressure on local wages and upward pres-sure on local house prices as people who move in try to find jobs andhousing. The lower wages and higher house prices serve as negative“compensation” for the high quality of life. Conversely, metro areas thatoffer low levels of happiness lose population, putting upward pressureon local wages and downward pressure on local house prices as firms tryto retain workers and the people who move out vacate housing. Thehigher wages and lower house prices serve as positive “compensation”for the low quality of life.15
Rappaport/Wilkerson.qxd 4/25/01 3:14 PM Page 73
74 FEDERAL RESERVE BANK OF KANSAS CITY
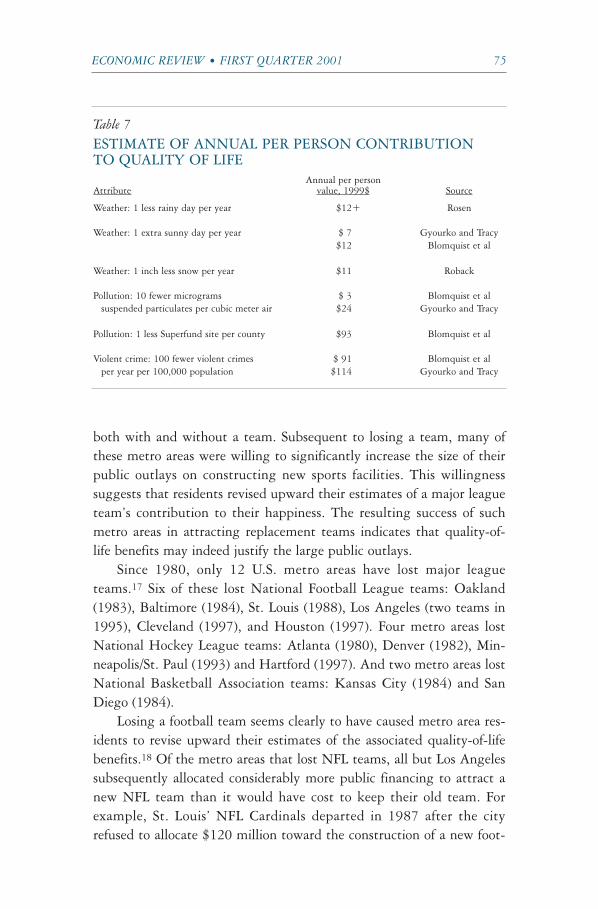
Using data on a large number of individuals and households living inmore than 100 different metro areas, statistical techniques can measurethe variations in wages and house prices that are due to each of severalmetro area attributes. The quality-of-life value of a given metro areaattribute can then be calculated as the sum of the lower wages individu-als are willing to accept and the higher house prices they are willing topay to live in an area with such an attribute.16 Table 7 summarizes a fewresults from research that estimates such “compensating differentials.”
The quantitative benefits from quality of life are found to be quitelarge. For instance, the estimates suggest that the annual value to ametro area of one extra sunny day per year is between $7 to $12 perperson. So a metro area with two million people should be willing topay between $14 million and $24 million per year for the extra annualsunny day (or roughly between $193 million and $330 million up frontfor an average extra sunny day over each of the subsequent 30 years).Quantitatively similar valuations are estimated for the quality-of-lifebenefits of one less rainy day per year and one inch less snow per year.
Unfortunately, this second approach cannot be used directly tovalue the quality of life from hosting a major league team. The reason isthat nearly all teams choose to locate in metro areas with high levels ofpopulation and employment. This makes it impossible to distinguishbetween the variations in wages and house prices that are due to thepresence of a sports team and those that are due to the high populationand employment.
Nevertheless, the high valuations of the quality-of-life benefits thatflow from geographic attributes such as pleasant weather serve as a use-ful benchmark for the quality-of-life benefits from hosting a majorleague team. In particular, large public outlays to attract and retain amajor league team may make sense if the team’s contribution to thearea’s quality of life is similar in magnitude to that of one extra sunnyday per year (or one less rainy day per year or one inch less snow peryear). Fan willingness to endure extreme weather to attend games atoutdoor stadiums suggests that the positive contribution to happinessfrom hosting a professional sports team may exceed such a threshold.
The experience of metro areas that lost teams. A third approach to valu-ing quality-of-life benefits points to the actions of metro areas thathosted a major league team that then moved elsewhere. These metroareas should be among those with the best information on the quality-of-life benefits from hosting a team since they can compare happiness
Rappaport/Wilkerson.qxd 4/25/01 3:14 PM Page 74
ECONOMIC REVIEW • FIRST QUARTER 2001 75
both with and without a team. Subsequent to losing a team, many ofthese metro areas were willing to significantly increase the size of theirpublic outlays on constructing new sports facilities. This willingnesssuggests that residents revised upward their estimates of a major leagueteam’s contribution to their happiness. The resulting success of suchmetro areas in attracting replacement teams indicates that quality-of-life benefits may indeed justify the large public outlays.
Since 1980, only 12 U.S. metro areas have lost major leagueteams.17 Six of these lost National Football League teams: Oakland(1983), Baltimore (1984), St. Louis (1988), Los Angeles (two teams in1995), Cleveland (1997), and Houston (1997). Four metro areas lostNational Hockey League teams: Atlanta (1980), Denver (1982), Min-neapolis/St. Paul (1993) and Hartford (1997). And two metro areas lostNational Basketball Association teams: Kansas City (1984) and SanDiego (1984).
Losing a football team seems clearly to have caused metro area res-idents to revise upward their estimates of the associated quality-of-lifebenefits.18 Of the metro areas that lost NFL teams, all but Los Angelessubsequently allocated considerably more public financing to attract anew NFL team than it would have cost to keep their old team. Forexample, St. Louis’ NFL Cardinals departed in 1987 after the cityrefused to allocate $120 million toward the construction of a new foot-
Table 7ESTIMATE OF ANNUAL PER PERSON CONTRIBUTIONTO QUALITY OF LIFE
Annual per personAttribute value, 1999$ Source
Weather: 1 less rainy day per year $12+ Rosen
Weather: 1 extra sunny day per year $ 7 Gyourko and Tracy$12 Blomquist et al
Weather: 1 inch less snow per year $11 Roback
Pollution: 10 fewer micrograms $ 3 Blomquist et alsuspended particulates per cubic meter air $24 Gyourko and Tracy
Pollution: 1 less Superfund site per county $93 Blomquist et al
Violent crime: 100 fewer violent crimes $ 91 Blomquist et alper year per 100,000 population $114 Gyourko and Tracy
Rappaport/Wilkerson.qxd 4/25/01 3:14 PM Page 75
76 FEDERAL RESERVE BANK OF KANSAS CITY
ball stadium (Quirk and Fort). Less than three years later, St. Louis vot-ers approved $280 million in public funds for a new football stadium—even before they had a team to play in it.19 And two years following thedeparture of the NFL Browns, Cleveland allocated $214 million towardconstruction of a football stadium for a newly awarded expansion team.The owner of the former Cleveland Browns commented, “The onlyregret I have, to be honest with you, is that if they gave me half of whatthey’re doing now, I’d still be in Cleveland” (Meyer). Similarly, Oakland,Baltimore, and Houston each increased by at least one-third theamount of public funds they were willing to spend on building newfootball stadiums.20
The experience of metro areas that lost NHL and NBA teams hasbeen more mixed. Minneapolis-St. Paul would probably have needed tospend only about $17 million to prevent the 1993 departure of its NHLteam (Bremner). But in 1999 it decided to allocate $130 million toattract a new NHL team. At the same time, Atlanta and Denver man-aged to endure the loss of their NHL teams for 19 and 13 years, respec-tively. They were eventually able to attract replacement NHL teams atwhat is probably a lower public cost than what would have beenrequired to prevent the original losses. Hartford has been more aggres-sive in attempting to attract an NFL team rather than a replacement forits departed NHL team. And neither Kansas City nor San Diego hasmade an extensive effort to replace their NBA teams.21
Taking account of quality-of-life benefits
The previous section’s discussion of the job creation and tax revenuebenefits from hosting a major league franchise suggested that such ben-efits fall far short of typical public outlays on the construction of newsports facilities. Can quality-of-life benefits make up the difference?
Based on results of a survey asking Pittsburgh metro area residentshow much they would be willing to be taxed to keep the NHL Pen-guins, the answer may be yes. However, caution warns against general-izing the results from a single survey.
Alternatively, results of economic studies of compensating differen-tials provide a benchmark in assessing quality-of-life benefits. Forinstance, if the contribution to metro area residents’ happiness fromhosting a major league sports franchise is similar in magnitude to thatfrom an additional day of pleasant weather per year, the net present
Rappaport/Wilkerson.qxd 4/25/01 3:14 PM Page 76
ECONOMIC REVIEW • FIRST QUARTER 2001 77
value quality-of-life benefit may indeed approach the magnitude ofrecent public outlays on sports facility construction.
Finally, the aggressive bids by metro areas to replace teams thathave departed further supports the view that the overall value to ametro area from hosting a professional sports team may exceed the asso-ciated large public expenditures. Of course, this will not always be thecase as is illustrated by the metro areas that have not made extensiveefforts to reattract lost teams. But for those metro areas that have bidaggressively, this would almost certainly have to be due to a large con-tribution to residents’ quality of life.
IV. SUMMARY AND CONCLUSIONS
U.S. metro areas have had to compete with each other to retain andattract major league sports franchises. The resulting large public outlaysto finance the construction of sports facilities have been quite controver-sial. Proponents of using public funds to finance stadium constructionargue that the benefits from increased economic activity and increased taxrevenue collection exceed the public outlays. But independent economicstudies universally find such benefits to be much smaller than claimed.
So does it makes sense for metro areas to use public funds to attractand retain major league sports franchises? The answer is definitely not ifbenefits are limited to increases in economic activity and tax revenuecollection. A strong case can be made, however, that the quality-of-lifebenefits from hosting a major league team can sometimes justify thelarge public outlays associated with doing so.22
Quality-of-life benefits are rarely explicitly included in the debateon using public funds to attract and retain a major league sports fran-chise. Acknowledging that the main benefit from hosting a team comesfrom improved metro-area quality of life should help to value this con-tribution. Doing so does not require impact studies. Residents andelected officials who understand that the benefits of a sports team arethe same sort that flow from parks, zoos, museums, and theater candecide on their own how much hosting a major league team is worth.
Rappaport/Wilkerson.qxd 4/25/01 3:14 PM Page 77
78 FEDERAL RESERVE BANK OF KANSAS CITY
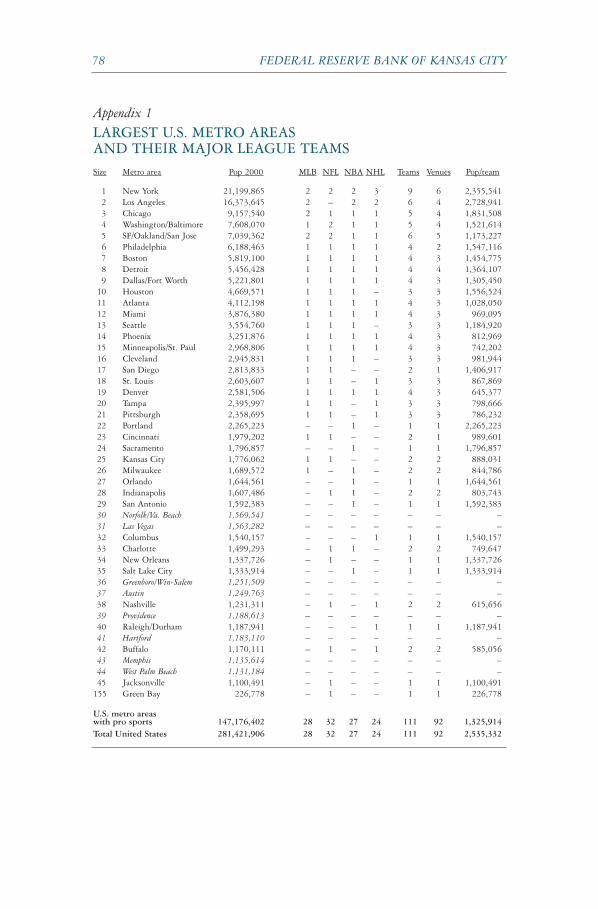
Appendix 1LARGEST U.S. METRO AREASAND THEIR MAJOR LEAGUE TEAMSSize Metro area Pop 2000 MLB NFL NBA NHL Teams Venues Pop/team
1 New York 21,199,865 2 2 2 3 9 6 2,355,5412 Los Angeles 16,373,645 2 – 2 2 6 4 2,728,9413 Chicago 9,157,540 2 1 1 1 5 4 1,831,5084 Washington/Baltimore 7,608,070 1 2 1 1 5 4 1,521,6145 SF/Oakland/San Jose 7,039,362 2 2 1 1 6 5 1,173,2276 Philadelphia 6,188,463 1 1 1 1 4 2 1,547,1167 Boston 5,819,100 1 1 1 1 4 3 1,454,7758 Detroit 5,456,428 1 1 1 1 4 4 1,364,1079 Dallas/Fort Worth 5,221,801 1 1 1 1 4 3 1,305,450
10 Houston 4,669,571 1 1 1 – 3 3 1,556,52411 Atlanta 4,112,198 1 1 1 1 4 3 1,028,05012 Miami 3,876,380 1 1 1 1 4 3 969,09513 Seattle 3,554,760 1 1 1 – 3 3 1,184,92014 Phoenix 3,251,876 1 1 1 1 4 3 812,96915 Minneapolis/St. Paul 2,968,806 1 1 1 1 4 3 742,20216 Cleveland 2,945,831 1 1 1 – 3 3 981,94417 San Diego 2,813,833 1 1 – – 2 1 1,406,91718 St. Louis 2,603,607 1 1 – 1 3 3 867,86919 Denver 2,581,506 1 1 1 1 4 3 645,37720 Tampa 2,395,997 1 1 – 1 3 3 798,66621 Pittsburgh 2,358,695 1 1 – 1 3 3 786,23222 Portland 2,265,223 – – 1 – 1 1 2,265,22323 Cincinnati 1,979,202 1 1 – – 2 1 989,60124 Sacramento 1,796,857 – – 1 – 1 1 1,796,85725 Kansas City 1,776,062 1 1 – – 2 2 888,03126 Milwaukee 1,689,572 1 – 1 – 2 2 844,78627 Orlando 1,644,561 – – 1 – 1 1 1,644,56128 Indianapolis 1,607,486 – 1 1 – 2 2 803,74329 San Antonio 1,592,383 – – 1 – 1 1 1,592,38330 Norfolk/Va. Beach 1,569,541 – – – – – – –31 Las Vegas 1,563,282 – – – – – – –32 Columbus 1,540,157 – – – 1 1 1 1,540,15733 Charlotte 1,499,293 – 1 1 – 2 2 749,64734 New Orleans 1,337,726 – 1 – – 1 1 1,337,72635 Salt Lake City 1,333,914 – – 1 – 1 1 1,333,91436 Greenboro/Win-Salem 1,251,509 – – – – – – –37 Austin 1,249,763 – – – – – – –38 Nashville 1,231,311 – 1 – 1 2 2 615,65639 Providence 1,188,613 – – – – – – –40 Raleigh/Durham 1,187,941 – – – 1 1 1 1,187,94141 Hartford 1,183,110 – – – – – – –42 Buffalo 1,170,111 – 1 – 1 2 2 585,05643 Memphis 1,135,614 – – – – – – –44 West Palm Beach 1,131,184 – – – – – – –45 Jacksonville 1,100,491 – 1 – – 1 1 1,100,491
155 Green Bay 226,778 – 1 – – 1 1 226,778
U.S. metro areaswith pro sports 147,176,402 28 32 27 24 111 92 1,325,914Total United States 281,421,906 28 32 27 24 111 92 2,535,332
Rappaport/Wilkerson.qxd 4/25/01 3:14 PM Page 78
ECONOMIC REVIEW • FIRST QUARTER 2001 79
Appendix 2FINANCING OF NEW SPORTS FACILITIESAND MAJOR RENOVATIONS, 1994–2004
Total Publiccost cost Source of Type of tax used to repay bonds
Metro area, Facility (League) ($mil) ($mil) public funding or other means of public financing
1994–2000 newAtlanta 235 0 – n/a
Turner Field (MLB)Atlanta 214 173 County Gate/concession, Hotel/rental-car
Philips Arena (NBA/NHL)Boston 160 0 – n/a
Fleet Center (NBA/NHL)Buffalo 123 54 State,County,City Gate/concession
HSBC Arena (NHL)Charlotte 298 10 City General fund
Ericcson Stadium (NFL)Chicago 150 11 City General fund
United Center (NBA/NHL)Cincinnati 452 452 State,County,City Sales
Paul Brown Stadium (NFL)Cleveland 173 152 County Alcohol/tobacco, Gate/concession
Jacobs Field (MLB)Cleveland 152 73 State,County Alcohol/tobacco, Capital improvement fund
Gund Arena (NBA)Cleveland 309 216 County Alcohol/tobacco
Cleveland BrownsStadium (NFL)
Columbus 150 0 – n/aNationwide Arena (NHL)
Dallas/Fort Worth 191 153 City Sales, General fundBallpark at Arlington (MLB)
Denver 215 161 Multi-county SalesCoors Field (MLB)
Denver 165 5 County General fundPepsi Center (NBA/NHL)
Detroit 290 145 County Hotel/rental-car, casino revenuesComerica Park (MLB)
Houston 266 180 County Hotel/rental-carEnron Field (MLB)
Indianapolis 175 72 City Sales, Capital improvement fundConseco Fieldhouse (NBA)
Los Angeles 321 71 CityStaples Center (NBA/NHL)
Miami 212 184 City Hotel/rental-carNational Car RentalArena (NHL)
Miami 241 142 City Hotel/rental-carAmerican Airlines Arena (NBA)
Minneapolis/St. Paul 130 130 State,City SalesXcel Energy Center (NHL)
Nashville 144 144 City General fundGaylord EntertainmentCenter (NHL)
Nashville 292 292 State,City Hotel/rental-car, Gate/concession, General fundAdelphia Coliseum (NFL)
Philadelphia 206 23 State,City General fundFirst Union Center (NBA/NHL)
Phoenix 355 270 County Sales, Gate/concessionBankOne Ballpark (MLB)
Portland 262 200 City Gate/concession, General fundRose Garden (NBA)
Raleigh 160 139 State,County Hotel/rental-car, General fundRaleigh Entertainment/Sports Arena (NHL)
Seattle 517 393 State,County Sales, Hotel/rental-car, Gate/concessionSafeco Field (MLB)
SF/Oakland/San Jose 306 15 City Special financing districtPacific Bell Park (MLB)
St. Louis 160 24 City General fundSavvis Center (NHL)
St. Louis 300 300 State,County,CityTWA Dome (NFL)
Tampa 139 86 State,County,City General fundIce Palace (NHL)
Appendix 2 continues on following page
Rappaport/Wilkerson.qxd 4/25/01 3:14 PM Page 79

80 FEDERAL RESERVE BANK OF KANSAS CITY
Appendix 2, continuedTotal Publiccost cost Source of Type of tax used to repay bonds
Metro area, Facility (League) ($mil) ($mil) public funding or other means of public financing
Tampa 190 190 City SalesRaymond James Stadium (NFL)
Washington/Baltimore 251 70 State,City General fundFedEx Field (NFL)
Washington/Baltimore 260 60 State,City General fundMCI Center (NBA/NHL)
Washington/Baltimore 229 200 State General fund, Lottery proceedsPSINet Stadium (NFL)
1994–2000 renovationsBuffalo 63 63 State General fund
Ralph Wilson Stadium (NFL)Jacksonville 135 122 State,City General fund, Hotel/rental-car, Gate/concession
Alltel Stadium (NFL)Los Angeles 117 30 City Gate/concession, Hotel/rental-car, General fund
Edison InternationalField (MLB)
San Diego 78 60 City General fundQualcomm Field (MLB/NFL)
Seattle 107 75 City General fundKey Arena (NBA)
SF/Oak/SJ 200 200 County,City General fundNetwork Associates (MLB/NFL)
SF/Oak/SJ 121 121 County,City General fundOakland Arena (NBA)
Tampa 65 51 State,City Hotel/rental-car, Gate/concession, General fundTropicana Field (MLB)
2001–2004 new*Boston 325 70 State General fund
New Patriots stadium (NFL)Chicago 587 387 City Hotel/rental-car
New Bears stadium (NFL)Cincinnati 297 224 County Sales
Great American Ballpark (MLB)Dallas/FW 325 125 City Hotel/rental-car
American AirlinesArena (NBA/NHL)
Denver 360 270 Multi-county SalesInvesco Field (NFL)
Detroit 245 125 County Hotel/rental-car, General fundFord Field (NFL)
Green Bay 295 169 County SalesNew Lambeau Field (NFL)
Houston 402 287 County Hotel/rental-carReliant Stadium (NFL)
Houston 175 70 County Hotel/rental-car, General fundNew Rockets arena (NBA)
Milwaukee 322 232 State,County,City Sales, General fundMiller Park (MLB)
Philadelphia 642 304 State,City General fund, Gate/concessionNew Eagles stadium (NFL)
Philadelphia 367 170 State,City General fund, Gate/concessionNew Phillies stadium (MLB)
Phoenix 331 229 County Hotel/rental-car, Player incomeNew Cardinals stadium (NFL)
Pittsburgh 233 193 State,County,City Gate/concession, General fundPNC Park (MLB)
Pittsburgh 244 177 State,County General fund, SalesNew Steelers stadium (NFL)
San Antonio 175 147 County Hotel/rental-carSBC Arena (NBA)
San Diego 411 296 City Hotel/rental-car, General fundNew Padres stadium (MLB)
Seattle 430 323 County Sales, Gate/concession,New Seahawks stadium (NFL) Hotel/rental-car, Lottery proceeds
* Facilities approved by January 1, 2001
Sources: Sports Facility Reports, ballparks.com, newspaper reports
Rappaport/Wilkerson.qxd 4/25/01 3:14 PM Page 80
ECONOMIC REVIEW • FIRST QUARTER 2001 81
ENDNOTES
1 Benefits may also arise when high-paying jobs replace low-paying ones.2 Impact studies usually attribute to the presence of a professional sports team
gross job creation due to all local spending by nonlocal residents who attend asports game. But some of this spending is likely to have occurred anyway, as manyof the nonlocal residents who attend a game may be visiting the metro area forother reasons (e.g., to visit family or for business).
3 Equivalently, local multiplier jobs can be thought of as implying that totalnet job creation will be some multiple of observable jobs created less unobservedjobs lost.
4 Many impact studies also claim large benefits from the actual constructionjobs associated with building stadiums. But such jobs are unlikely to produce largemetro area benefits. Except in the depths of a recession, any very large constructionproject must either hire workers from elsewhere who temporarily relocate into ametro area or else hire local workers away from other local construction projects.In both cases, wages for local construction workers should rise, which for them iscertainly a benefit. But the remaining residents of the metro area will temporarilyface higher costs for doing any construction. Even if the former benefit exceeds thelatter cost, the one-time nature of construction implies that any net benefit will besmall in magnitude (i.e., it is already on a net present value basis and so is notscaled up as is the permanent job creation annual benefit).
5 The ambiguity of whether a metro area benefits from net job creation sharplycontrasts with the common perception that local net job creation is a benefit in andof itself. The perception is easy to understand given that net job creation usuallyreflects beneficial underlying metro area fundamentals. For instance, Denver hasseen explosive employment and population growth during the late 1990s. Manyfirms and individuals cite the natural beauty and recreational opportunities affordedby the nearby Rocky Mountains as key reasons for choosing to locate in Denver. Itis this natural beauty and recreational opportunity which benefit Denver’s residents,both long-time and newly arrived. The job growth just reflects such benefits.
6 To the extent that such statistical techniques fail to control for underlyingfundamentals that cause simultaneous increases in jobs, wages, and property val-ues, they will overestimate the benefits associated with increases in employment.For instance, statistical analysis will tend to attribute Denver’s rapidly rising wagesand house values to its explosive population and employment growth. But asargued in note 5 above, probably the growth of all three should be attributed toindividuals’ increasing desire to enjoy the natural beauty and recreational opportu-nities afforded by the nearby Rocky Mountains. Rappaport (2000) shows how anincrease in either quality of life or productivity lends to simultaneous changes inpopulation, employment, wages, and home values.
7 A second way that increased sales tax revenue benefits a host metro area is ifit is due to local residents’ spending a greater proportion of their entertainment dol-lars within the host metro area rather than elsewhere. For example, in the absenceof a local professional sports team, local sports fans may travel to other metro areasto watch games. If their total expenditures on entertainment are to remainunchanged, such fans will end up spending less in their home metro area and hencecontribute less to local sales tax revenue. By spending money in other tax jurisdic-tions, these fans are exporting sales tax revenue. From the perspective of local resi-dents, the recovery of exported sales tax revenue by the shifting of their spending
Rappaport/Wilkerson.qxd 4/25/01 3:14 PM Page 81
82 FEDERAL RESERVE BANK OF KANSAS CITY
from outside to a home tax jurisdiction is definitely a benefit. After all, if they aregoing to pay sales taxes, they should prefer to do so to their own local governmentrather than the local government of someone else. Local residents neverthelessimplicitly may choose to export tax revenue if the things they wish to purchase arenot available locally (or if they are more expensive locally). For local sports fans,hosting a team makes available locally something they formerly had to travel topurchase. However, it is not actually clear that hosting a professional sports teamrecovers exported sales tax revenue. No good estimates exist on the magnitude ofexported sales tax revenues due to a metro area’s not hosting a professional sportsteam. In addition, it is possible that host metro area fans’ traveling to attend awaygames of their home team may export as much sales tax revenue as is recovered byfans’ not traveling to attend “home” games in the absence of a local team.
Hosting a professional sports team may also increase local sales tax revenue iflocal residents’ spending on admissions and concessions at sports games is subjectto higher than average sales taxes. However, any such increase in local tax revenuerepresents a cost rather than a benefit to the host metro area. To see this, considerthat the host metro area could also increase its sales tax revenue simply by raisingthe sales tax rates which apply to all local spending (with the caveat that thehigher rates are not more than offset by lower spending). Local residents’ willing-ness to pay the higher local sales tax on stadium admissions and concessions showsthat they perceive an attached benefit (that such taxes support the presence of asports team). But all else equal, locally residing fans should certainly prefer not tobe taxed at a higher than average rate.
8 Of course, depending on particular circumstances, visits by non-MSA fansmay vary tremendously. For instance, a study of fans attending Baltimore Oriolesgames in 1992 concluded that 46 percent were from outside the Baltimore metroarea and 31 percent were from outside the state of Maryland. A likely factor con-tributing to such a high percentage of nonlocal fans is Baltimore’s location lessthan a one-hour drive from Washington D.C., a metro area that lacks a baseballteam. In addition, 1992 was the first year the Orioles played in the new CamdenYards stadium which also might have contributed to above-average nonlocal atten-dance (Hamilton and Kahn).
9 However, any revenue due to such visitors’ spending at games being taxed athigher than average rates does count as a benefit attributable to hosting a sports team.
10 On the other hand, 5 percent is not an uncommon state sales tax rate. Butfor states, imported tax revenue accrues only from visits by out-of-state sports fans,which is likely to be a smaller percentage than for non-metro sports fans.
11 To the extent that any increased income tax revenue from net job creationdoes exceed the marginal cost of providing any associated increased municipalservices, the resulting benefit is largely what underlies the explanation of how netjob creation benefits a metro area’s existing residents. To include it again as animported income tax benefit would be to double count. Hence Table 5 excludesassistant coaches along with the approximately 100 people team organizationsemploy in “front office” positions, for instance managing business operations, sell-ing advertising, and maintaining physical facilities.
12 Using a 5 percent interest rate instead implies that each dollar of annualbenefits is worth $15.37. Using a 7 percent interest rate implies that each dollar ofannual benefits is worth $12.41.
Rappaport/Wilkerson.qxd 4/25/01 3:14 PM Page 82
ECONOMIC REVIEW • FIRST QUARTER 2001 83
13 This aggregate quality-of-life benefit is known as “consumer surplus.” Esti-mates of consumer surplus from major league game attendance range from $2 mil-lion to $54 million per team per year (Alexander et al, Irani).
14 On the other hand, many economists argue that people overestimate theirwillingness to pay for things when answering surveys (Diamond and Hausman).
15 Population inflows drawn to high quality of life may also result in large-scalejob creation. The straightforward intuition is that firms desire to locate where theycan affordably hire good workers. High quality of life is commonly cited as a reasonfor rapid job growth in a number of U.S. states including Arizona, California, Col-orado, Florida, and Nevada. Looking across U.S. counties at the relationshipbetween weather and 1990 employment levels, statistical analysis suggests that aone degree Celsius higher mean January temperature is associated with a 3 percentincrease in employment. For a medium-sized metro area with 2 million residents,such an increase is more than 30 times the size of even the most optimistic estimatesof the observable job creation from hosting a professional sports team.
Because all else is not equal, metro areas with high quality of life may beobserved to have high rather than low average wages. First, individuals who canearn a high income regardless of where they live may be more likely to choose todo so in high quality-of-life metro areas. Hence, measuring the effect of metro areaattributes on metro area wages requires taking account of individual-specific char-acteristics such as education and occupation. Second, attributes that contributepositively to a metro area’s quality of life may also contribute positively to its pro-ductivity and so raise wages. For instance, location on an ocean coast provides bothrecreational opportunities and access to low-cost seaborne transport (Rappaportand Sachs). Indeed, the unobservable job creation due to high quality of life mayitself be a source of high productivity by bringing external economies of scale to ametro area’s firms.
16 More specifically, individuals’ wages are regressed on individual-specificcharacteristics and metro area characteristics. Negative coefficients on the metroarea characteristics measure positive contributions to quality of life. House pricesare regressed on house-specific characteristics and metro area characteristics. Posi-tive coefficients on the metro area characteristics measure positive contributions toquality of life.
17 In addition, two relatively small Canadian metro areas, Quebec and Win-nipeg, lost NHL teams in the mid-1990s.
18 It could also be that the metro areas revised upward their estimates of thejob creation and tax revenue benefits. But this seems unlikely given economists’unanimous inability to find evidence of any large such benefits.
19 Additional incentives were later added to lure the NFL Rams in 1995.20 Los Angeles, as well, committed to a $100 million public outlay in a bid to
win an NFL expansion team that was awarded in 1999. Given the large quantityand variety of alternative entertainment venues in the Los Angeles metro area(e.g., four major league teams, two top college athletic programs, four majoramusement/theme parks, beaches, nearby mountains), it is not surprising that thequality-of-life benefits from hosting an additional team may be lower to Los Ange-les than they are to other metro areas.
21 One reason that Kansas City and San Diego may not have done so is thatboth cities already host both an MLB and an NFL team. As was argued above withregard to the NHL Pittsburgh Penguins, the additional quality-of-life benefit froma third team may be much smaller than the benefit from a first or second team. In
Rappaport/Wilkerson.qxd 4/25/01 3:14 PM Page 83

84 FEDERAL RESERVE BANK OF KANSAS CITY
addition, both of the departing NBA teams had losing records in the several seasonsprior to leaving, which also may have lowered their contributions to quality of life.
22 A conceptually different question is whether metro areas would be betteroff if all public contributions to the building of sports stadiums were prohibited.On the one hand, the competition among metro areas for sports teams transfersbenefits from metro area residents to team owners and players. On the other hand,competition for teams should cause the teams to locate in metro areas where totalbenefits will be greatest.
Rappaport/Wilkerson.qxd 4/25/01 3:14 PM Page 84
ECONOMIC REVIEW • FIRST QUARTER 2001 85
REFERENCES
Alexander, Donald L., William Kern, and Jon Neill. 2000. “Valuing the Consump-tion Benefits from Professional Sports Franchises,” Journal of Urban Economics,September.
Baade, Robert A. 1997. “Mariner Economic Analysis,” prepared for Citizens forLeaders with Ethics and Accountability Now, March.
________. 1994. “Stadiums, Professional Sports, and Economic Development:Assessing the Reality,” Heartland Institute Policy Study, No. 62.
Baade, Robert A., and Allen R. Sanderson. 1997. “The Employment Effect ofTeams and Sports Facilities,” in Roger G. Noll and Andrew Zimbalist, eds.,Sports, Jobs, and Taxes: The Economic Impact of Sports Teams and Stadiums. Washing-ton: Brookings Institution Press.
Blomquist, Glenn C., Mark C. Berger, and John P. Hoehn. 1988. “New Estimatesof Quality of Life in Urban Areas,” American Economic Review, March.
Bremner, B. 1990. “Ice Folly in Minneapolis,” Business Week, February 26.CSL International. 2000a. “Green Bay Packers Impact Analysis,” prepared for the
Green Bay Packers. __________. 2000b. “Houston Rockets Impact Analysis,” prepared for Central
Houston, Inc.Center for Economic Education, University of Cincinnati. 1996. “The Effects of the
Construction, Operation, and Financing of New Sports Stadia on CincinnatiEconomic Growth,” prepared for the Hamilton County Administrator, January.
Coates, Dennis, and Brad R. Humphreys. 2000. “The Stadium Gambit and LocalEconomic Development,” Regulation, no. 2.
Conway, Dick, and Associates. 1996. “Seattle Seahawks Economic Impact,” pre-pared for HOK Sport and King County, March.
Diamond, Peter A., and Jerry A. Hausman. 1994. “Contingent Valuation: Is SomeNumber Better Than No Number?” Journal of Economic Perspectives, Fall.
Gyourko, Joseph, and Joseph Tracy. 1991. “The Structure of Local Public Financeand the Quality of Life,” Journal of Political Economy, August.
Hamilton, Bruce W., and Peter Kahn. 1997. “Baltimore’s Camden Yards Ball-parks,” in Roger G. Noll and Andrew Zimbalist, eds., Sports, Jobs, and Taxes:The Economic Impact of Sports Teams and Stadiums. Washington: Brookings Insti-tution Press.
Irani, Daraius. 1997. “Public Subsidies to Stadiums: Do the Costs Outweigh theBenefits?” Public Finance Review, March.
Johnson, Bruce K., Peter A. Groothuis, and John C. Whitehead. 2001. “The Valueof Public Goods Generated By a Major League Sports Team: The CVMApproach,” Journal of Sports Economics, February.
Johnson, C.H., Consulting, Inc. 1999. “Economic Impact Analysis of the ProposedBallpark for the Boston Red Sox,” prepared for Greater Boston Conventionand Visitors Bureau and Greater Boston Chamber of Commerce, June.
KPMG. 1998. “Economic and Fiscal Impact Analysis for a Proposed New Stadiumto Host the New England Patriots in Hartford, Connecticut,” prepared forState of Connecticut, November.
Meyer, Ed. 1997. “Cleveland Sells NFL on Its Abilities,” Akron Beacon Journal,January 22.
Rappaport/Wilkerson.qxd 4/25/01 3:14 PM Page 85
86 FEDERAL RESERVE BANK OF KANSAS CITY
Mid-America Regional Council. 2001. Update to “Economic Impact of the KansasCity Chiefs and Kansas City Royals on the State of Missouri,” prepared forJackson County Executive, January.
National Sports Law Institute of Marquette University Law School. 2000. SportsFacility Reports, vol. 1, no. 2.
Noll, Roger G., and Andrew Zimbalist, eds. 1997. Sports, Jobs, and Taxes: The EconomicImpact of Sports Teams and Stadiums. Washington: Brookings Institution Press.
Office of Business and Economic Research, Maryland Department of Business andEconomic Development. 1999. “Impact of the Baltimore Ravens Pro FootballTeam on the Maryland Economy: 1999 Update,” October.
Pollack, Elliott D., and Company. 1998. “Economic and Fiscal Impact of BankOneBallpark and the Arizona Diamondbacks,” prepared for Downtown PhoenixPartnership, September.
Quirk, James, and Rodney Fort. 1992. Pay Dirt: The Business of Professional TeamSports. Princeton: Princeton University Press.
Rappaport, Jordan. 2000. “Why Are Population Flows So Persistent?” FederalReserve Bank of Kansas City, working paper no. 99-13, August.
__________, and Jeffrey Sachs. Forthcoming. “The U.S. as a Coastal Nation,” Fed-eral Reserve Bank of Kansas City, working paper.
Roback, Jennifer. 1982. “Wages, Rents, and the Quality of Life,” Journal of PoliticalEconomy, December.
Rosen, Sherwin. 1979. “Wage-Based Indexes of Urban Quality of Life,” inMiezkowski and Straszheim, eds., Current Issues in Urban Economics. Baltimore:Johns Hopkins University Press.
Siegfried, John, and Andrew Zimbalist. 2000. “The Economics of Sports Facilitiesand Their Communities,” Journal of Economic Perspectives, Summer.
Street and Smith’s SportsBusiness Journal. 2000. “Special Report: Broadcast Media,”April 17-23.
Texas Perspectives, Inc. 1999. “The Role of the Spurs in the San Antonio Economy,”prepared for City of San Antonio.
Walden, Michael. 1997. “Don’t Play Ball,” Carolina Journal, October/November.
Rappaport/Wilkerson.qxd 4/25/01 3:14 PM Page 86