Embed Size (px)
Citation preview
1
The GRIM test: A simple technique detects numerous anomalies in the reporting of results in 1
psychology 2
3
Nicholas J. L. Brown (*) 4
University Medical Center Groningen 5
6
James A. J. Heathers 7
Division of Cardiology and Intensive Therapy, Poznań University of Medical Sciences 8
University of Sydney 9
10
(*) Corresponding author: E-mail: [email protected] 11
PeerJ Preprints | https://doi.org/10.7287/peerj.preprints.2064v1 | CC-BY 4.0 Open Access | rec: 23 May 2016, publ: 23 May 2016
2
Abstract 12
We present a simple mathematical technique that we call GRIM (Granularity-Related 13
Inconsistency of Means) for verifying the summary statistics of published research reports in 14
psychology. This technique evaluates whether the reported means of integer data such as Likert-15
type scales are consistent with the given sample size and number of items. We tested this 16
technique with a sample of 260 recent articles in leading journals within empirical psychology. 17
Of the subset of articles that were amenable to testing with the GRIM technique (N = 71), around 18
half (N = 36; 50.7%) appeared to contain at least one reported mean inconsistent with the 19
reported sample sizes and scale characteristics, and more than 20% (N = 16) contained multiple 20
such inconsistencies. We requested the data sets corresponding to 21 of these articles, receiving 21
positive responses in 9 cases. We were able to confirm the presence of at least one reporting 22
error in all cases, with 2 articles requiring extensive corrections. The implications for the 23
reliability and replicability of empirical psychology are discussed. 24
PeerJ Preprints | https://doi.org/10.7287/peerj.preprints.2064v1 | CC-BY 4.0 Open Access | rec: 23 May 2016, publ: 23 May 2016
3
Consider the following extract from a recent article in the Journal of Porcine Aviation Potential. 25
The authors’ principal hypothesis was that drinking Kool-Aid1 increases people’s willingness to 26
believe that pigs can fly. 27
Fifty-five undergraduates took part in this study in return for course credit. Participants 28
were randomly assigned to drink eight ounces of water, which either contained 29
(experimental condition, N = 28) or did not contain (control condition, N = 27) 17g of 30
cherry flavor Kool-Aid powder. Fifteen minutes after consuming the beverage, 31
participants responded to the question, “To what extent do you believe that pigs can fly?” 32
on a 7-point Likert-type scale from 1 (Not at all likely) to 7 (Overwhelmingly likely). 33
Participants in the “drunk the Kool-Aid” condition reported a significantly stronger belief 34
in the ability of pigs to fly (M = 5.19, SD = 1.34) than those in the control condition 35
(M = 3.87, SD = 1.41), t(53) = 3.56, p < .001. 36
These results (and similarly improbable but provocative data in real articles) may garner 37
both intense public interest and skepticism. They also sometimes provoke speculation over their 38
fidelity; this speculation frequently continues in public fora such as PubPeer and Twitter in the 39
absence of re-analysis of the data in question. However, in a subset of cases, it is possible to 40
determine the fidelity of scale data directly from the descriptive statistics. 41
The case cited above, for example, seems superficially reasonable but actually describes a 42
situation which is mathematically impossible. The reported means represent either errors of 43
transcription, some version of misreporting, or the deliberate manipulation of results. 44
1 The popular metaphor referred to in this example may be based on a distortion of reality
(Reiterman & Jacobs, 1982). We apologize to the good people at Kraft Foods, manufacturers of
Kool-Aid, for repeating this myth one more time here to make a rhetorical point.
PeerJ Preprints | https://doi.org/10.7287/peerj.preprints.2064v1 | CC-BY 4.0 Open Access | rec: 23 May 2016, publ: 23 May 2016
4
Specifically, the mean of the 28 participants in the experimental condition, reported as 5.19, 45
cannot be correct. Since all responses were integers between 1 and 7, the total of the response 46
scores across all participants must also be an integer in the range 28–196. The two integers that 47
give a result closest to the reported mean of 5.19 (which will typically have been subjected to 48
rounding) are 145 and 146. However, 145 divided by 28 is 85714217.5 , which conventional 49
rounding returns as 5.18. Likewise, 146 divided by 28 is 42857121.5 , which rounds to 5.21. 50
That is, there is no combination of responses to the question that can give a mean of 5.19 when 51
correctly rounded. Similar considerations apply to the reported mean of 3.87 in the control 52
condition. Multiplying this value by the sample size (27) gives 104.49, suggesting that the total 53
score across participants must have been either 104 or 105. But 104 divided by 27 is 851.3 , 54
which rounds to 3.85, and 105 divided by 27 is 888.3 , which rounds to 3.89. 55
In this article, we will use the term inconsistent to refer to reported means of integer data 56
whose value, appropriately rounded, cannot be reconciled with the stated sample size. We first 57
introduce the general background to and calculation of what we term the Granularity-Related 58
Inconsistent Means (GRIM) test. Next, we report on the results of an analysis using the GRIM 59
test of a number of published articles from leading psychological journals. Finally, we discuss 60
the implications of these results for the published literature in empirical psychology. 61
62
General description of the GRIM approach for reanalyzing published data 63
The crux of this method lies in the transition from ordinal to continuous data. Scale data 64
collected in psychology typically lie on an ordinal scale—that is, the recorded values are in rank 65
order but are arbitrary, such that the number corresponding to any scale item has no technical 66
significance beyond its ability to establish a position on a continuum relative to the other 67
PeerJ Preprints | https://doi.org/10.7287/peerj.preprints.2064v1 | CC-BY 4.0 Open Access | rec: 23 May 2016, publ: 23 May 2016
5
numbers. For example, if we use a typical Likert-type scale, and grade an opinion on a chosen 68
subject from 1 (strongly disagree) to 5 (strongly agree), the difference between 2 (disagree) and 3 69
(neither agree nor disagree) is not directly equivalent to the difference between 1 and 2. 70
While the limits of ordinal data in measurement have been extensively discussed in 71
measurement theory (e.g., Coombs, 1960; Thurstone, 1927), this discussion is largely separate 72
from research practice. It is presently common to a) treat ordinal scale measures as continuous 73
variables, b) calculate means and standard deviations from these numbers, and c) subject those 74
values to null-hypothesis significance testing. Although discussions as to the general validity of 75
such scales, whether composed of single or multiple items, appear in the literature from time to 76
time (e.g., Jamieson, 2004; Carifio & Perla, 2007), the position of these measures as the 77
dominant paradigm in psychometric testing does not seem to be under any immediate threat. 78
One often-overlooked property of data derived from Likert-type scales is their 79
granularity—that is, the numerical separation between possible values of the summary statistics. 80
Here, we consider the example of the mean. As our initial example demonstrates, within typical 81
ordinal scale data the smallest unit by which two means can differ is an inverse function of the 82
number of participants and the number of scale items. In other words, if we consider a Likert-83
type scale administered to 10 people averaged across three items, the smallest amount by which 84
two mean scores can differ (the granularity) is 1 / (10 × 3) = .303.0 If means are reported to two 85
decimal places (as is the case in the great majority of psychology journals), then, although 86
numerically there are 100 possible two-digit fractional parts of a mean M in the range 1 ≤ M < 2 87
(1.00, 1.01, 1.02, 1.03, etc., up to 1.99), the possible outcomes from the process of division (to 88
obtain the mean) and subsequent rounding to two decimal places are considerably fewer (1.00, 89
1.03, 1.07, 1.10, 1.13, etc., up to 1.97). In the typical case where means are reported to two 90
PeerJ Preprints | https://doi.org/10.7287/peerj.preprints.2064v1 | CC-BY 4.0 Open Access | rec: 23 May 2016, publ: 23 May 2016
6
decimal places, if the number of participants (N) is less than 100 and the measured quantity is an 91
integer, then not all of the possible sequences of two digits can occur after the decimal point in 92
correctly rounded fractions. (More generally, if the number of decimal places reported is D, then 93
some combinations of digits will not be consistent if N is less than 10D.) 94
This relation is always true for integer data that are recorded as single items, such as 95
participants’ ages in whole years, or a one-item measure of an attitude to a specific issue, as is 96
frequently found in a manipulation check. When a composite measure is used, such as a scale 97
with three Likert-type items on a scale of 1–7 where the mean of the item scores is taken as the 98
value of the measure, this mean value will not necessarily be an integer; instead, it will be some 99
multiple of (1 / L), where L is the number of items in the measure. However, the range of 100
possible values that this mean can take is still constrained (in the example, to 1.00, 33.1 , 66.1 , 101
2.00, 33.2 , etc.,) and so for any given sample size, the range of possible values for the mean of 102
all participants is also constrained. For example, with a sample size of 15 and L = 3, possible 103
values for the mean are 1.00, 1.02 [rounded from 6016.1 ], 1.03 [rounded from 3033.1 ], 1.05, 104
1.07, 1.08, 1.10, etc. More generally, the range of means for a measure with L items and a 105
sample size of N is identical to the range of means for a measure with one item and a sample size 106
of .NL× Thus, by multiplying the sample size by the number of items in the scale, composite 107
measures can be analyzed using the GRIM technique in the same way as single items, although 108
as the number of scale items increases, the maximum sample size for which this analysis is 109
possible is correspondingly reduced, as the granularity decreases towards 0.01. For example, a 110
five-item measure with 25 participants has the same granularity (0.008) as a one-item measure 111
with 125 participants, and hence scores on this measure are not typically GRIM-testable. 112
PeerJ Preprints | https://doi.org/10.7287/peerj.preprints.2064v1 | CC-BY 4.0 Open Access | rec: 23 May 2016, publ: 23 May 2016
7
Note that the adjustment for sample size just mentioned is only required when the 113
composite measure is presented as a mean. If it is presented as a total (e.g., a three-item measure 114
on a scale of 1–7 reported as a total in the range 3–21), no adjustment is necessary. Indeed, one 115
of the attractions of the GRIM technique is that it is independent of the possible values that the 116
measured variable can take, provided either that these are integers, or (in the case of composite 117
items) that they can be represented as integers divided by a sufficiently small number of items. 118
In particular, the number of possible responses to a single Likert-type item (such as five or 119
seven) is irrelevant. This technique can also be applied to real or quasi-real values, such as ages 120
in years, provided that these were measured as integers (or simple fractions thereof, with an 121
adjustment to the sample size as discussed above)2. We refer to variables that are amenable to 122
testing for inconsistencies by our technique as “GRIM-testable data.” 123
2 In the studies that we examined for the present article, we sometimes had to make pragmatic
assumptions about the reporting of such values. For example, if participants were instructed to
make offers of up to five dollars in a dictator game, it is plausible that some would choose an
amount such as $1.50. On the other hand, when Cole, Balcetis, and Dunning (2013) asked their
participants to stand 156 inches (13 feet, or approximately 4 meters) from a live tarantula and
estimate the distance between them and the spider in inches, it seems unlikely that any responses
would have included a fractional component (although, of course, only an inspection of the data
set could determine this with certainty).
PeerJ Preprints | https://doi.org/10.7287/peerj.preprints.2064v1 | CC-BY 4.0 Open Access | rec: 23 May 2016, publ: 23 May 2016
8
124
===================================================================== 125
Insert Figure 1 around here 126
===================================================================== 127
128
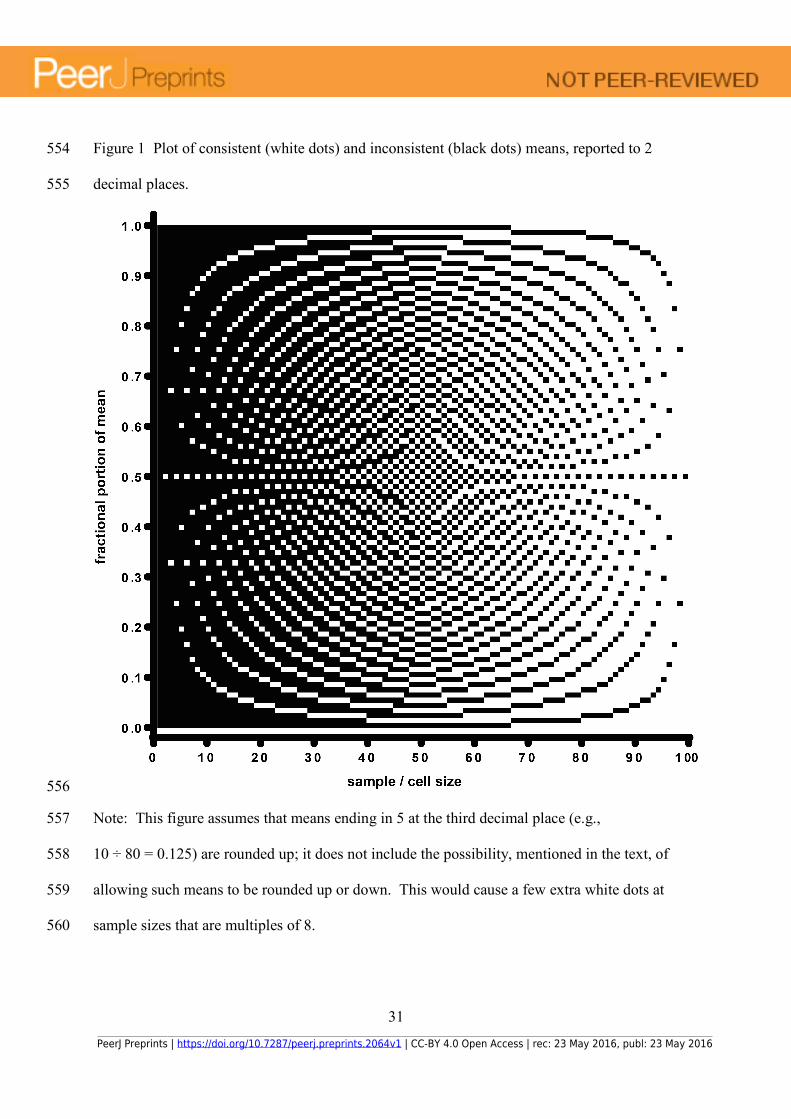
Figure 1 shows the distribution of consistent (shown in white) and inconsistent (shown in 129
black) means as a function of the sample size. Note that it only the 2-digit fractional component 130
is linked to consistency; the integer part of the mean plays no role. The overall pattern is clear: 131
As the sample size increases towards 100, the number of fractional means that is consistent with 132
that sample size also increases, and so the chance that any incorrectly-reported (due to a random 133
error) mean will appear as an anomaly is reduced. However, even with quite large sample sizes, 134
it is still possible to detect inconsistent means if an article contains multiple inconsistencies. For 135
example, consider an article with N = 75 and six reported means that have, in fact, been 136
mistyped. For any one mean, there is a 75% chance that it will be consistent, but there is only a 137
17.8% chance that all six means will be consistent. 138
Our general formula, then, is that when the number of participants (N) is multiplied by 139
the number of items composing a measured quantity (L, commonly equal to 1), and the means 140
that are based on N are reported to D decimal places, then if ( ) DNL 10<× , there exists some 141
number of decimal fractions of length D that cannot occur if the means are reported correctly. 142
The number of inconsistent values is generally equal to (10D − N), although there are a few 143
values of N where this breaks down if means that end in 5 at the (D + 1)th place are allowed to 144
be rounded either up or down (e.g., with D = 2 and N = 88, a total score of 297 gives a mean of 145
exactly 3.125. Using the most common rounding rule this terminal 5 would be rounded up to 146
PeerJ Preprints | https://doi.org/10.7287/peerj.preprints.2064v1 | CC-BY 4.0 Open Access | rec: 23 May 2016, publ: 23 May 2016
9
3.13, but other rules exist which would see it rounded down to 3.12: indeed the round() 147
function in the R programming language would give this result, since it rounds to the nearest 148
even number in the last digit position). In all of the analyses reported in the present article, we 149
conservatively allowed numbers ending in exactly 5 at the third decimal place to be rounded 150
either up or down without treating the resulting reported means as inconsistent. 151
152
A numerical demonstration 153
For readers who prefer to follow a worked example, we present here a simple method for 154
performing the GRIM test to check the consistency of a mean. We assume that some quantity 155
has been measured as an integer across a sample of participants and reported as a mean to two 156
decimal places. For example: 157
Participants (N = 52) responded to the manipulation check question, “To what extent did 158
you believe our story about the dog having eaten our homework?” on a 1–7 Likert-type 159
scale. Results showed that they found our story convincing (M = 6.28, SD = 1.22). 160
The first step is to take the mean and multiply it by the sample size. In this example, that gives 161
(6.28 × 52) = 326.56. Next, round that product to the nearest integer (here, we round up to 327). 162
Now, divide that integer by the sample size, rounding the result to two decimal places, giving 163
(327 / 52) = 6.29. Finally, compare this result with the original mean. If they are identical, then 164
the mean is consistent with the sample size and integer data; if they are different, as in this case 165
(6.28 versus 6.29), the mean is inconsistent. 166
When the quantity being measured is a composite Likert-type measure, or some other 167
simple fraction, it may still be GRIM-testable. For example: 168
PeerJ Preprints | https://doi.org/10.7287/peerj.preprints.2064v1 | CC-BY 4.0 Open Access | rec: 23 May 2016, publ: 23 May 2016
10
Participants (N = 21) responded to three Likert-type items (0 = not at all, 4 = extremely) 169
asking them how rich, famous, and successful they felt. These items were averaged into 170
a single measure of fabulousness (M = 3.77, SD = 0.63). 171
In this case, the measured quantity (the mean score for fabulousness) can take on the values 1.00, 172
33.1 , 66.1 , 2.00, 33.2 , 66.2 , 3.00, etc. The granularity of this quantity is thus finer than if it 173
had been reported as an integer (e.g., if the mean of the total scores for the three components, 174
rather than the mean of the means of the three components, had been reported). However, the 175
sample size is sufficiently small that we can still perform a GRIM test, by multiplying the sample 176
size by the number of items that were averaged to make the composite measure (i.e., three)3 177
before performing the steps just indicated. Thus, in this case, we multiply the sample size of 21 178
by 3 to get 63; multiply 63 by 3.77 to get 237.51; round 237.51 to 238; divide 238 by 63 to get 179
,777.3 which rounds to 3.78; and observe that, once again, this mean is inconsistent with the 180
reported sample size. We have made a simple Excel spreadsheet available at 181
https://osf.io/3fcbr that automates the steps of this procedure. 182
183
Practical applications 184
Using the GRIM technique, it is possible to examine published reports of empirical research to 185
see whether the means have been reported correctly. As psychological journals typically require 186
the reporting of means to 2 decimal places, the sample size corresponding to each mean typically 187
3 An alternative is to adapt the calculation method so that, at the second step, the product of the
(unadjusted) sample size and the reported mean is rounded not to the nearest integer, but to the
nearest multiple of the granularity of the scale—in this case, .33.0 However, this is unlikely to
be simpler in practice than adjusting the sample size.
PeerJ Preprints | https://doi.org/10.7287/peerj.preprints.2064v1 | CC-BY 4.0 Open Access | rec: 23 May 2016, publ: 23 May 2016
11
needs to be less than 100 in order for its consistency to be checked. However, since the majority 188
of means of interest in experimental psychology are those for subgroups of the overall sample 189
(for example, the numbers in each of two or more experimental conditions), it can still be 190
possible to use the GRIM technique to studies with overall sample sizes substantially above 100, 191
thus making it applicable to a considerable proportion of published articles4. 192
When an inconsistent mean is uncovered by this method, we of course have no 193
information about the true mean value that was obtained in the study; that can only be 194
determined by a reanalysis of the original data. But such an inconsistency does indicate, at a 195
minimum, that a mistake has been made. When multiple numerical inconsistencies are 196
demonstrated in the same article, we feel the reader is entitled to question what else might not 197
have been reported accurately. And, if the reported test (typically F or t) statistics and their 198
corresponding p values are themselves perfectly consistent with the reported (inconsistent) 199
means, the authors may well have some explaining to do5. 200
4 Note that a percentage in the range 0.0%–99.9%, even when reported to only one decimal
place, can be tested for consistency with a sample size of up to 1000, as it is, in effect, a fraction
reported to three decimal places. For example, if the percentage of a sample of 847 participants
endorsing a particular statement is reported as 29.1%, it can be shown that this percentage is
inconsistent. The demonstration of this is left as an exercise for the reader.
5 It is quite plausible for a set of correctly reported means and SDs from an article, when input
into a simple calculator for F or t tests of the kind that is widely available online, to give a test
statistic and p value that are not exactly identical to those reported to two decimal places,
because the reported F/t and p values in the article will have been calculated from numbers
having greater precision and then rounded. Indeed, if an online calculator gives the exact F/t and
PeerJ Preprints | https://doi.org/10.7287/peerj.preprints.2064v1 | CC-BY 4.0 Open Access | rec: 23 May 2016, publ: 23 May 2016
12
We now turn to our pilot trial of the GRIM test, in which we examined the consistency of 201
means and other comparable quantities in a substantial sample of recent empirical articles 202
published in leading psychological journals. 203
204
Method 205
We searched recently published (January 2011 to December 2015; i.e., in the five years 206
preceding the start of our investigations) issues of Psychological Science (PS), the Journal of 207
Experimental Psychology: General (JEP:G), and the Journal of Social and Personality 208
Psychology (JPSP) for articles containing the word “Likert” anywhere in their text. This simple 209
strategy was chosen on the basis that we expected to find Likert-type data reported in most of the 210
articles containing that word. (Some articles that were identified using this method also 211
contained reported means of other, non-Likert type integer data; we also checked the consistency 212
of those means where possible.) We sorted the results in descending order of date of publication 213
(most recent first) and downloaded at most the first 100 matching articles from each journal. 214
Thus, our sample consisted of 100 articles from PS published between January 2011 and 215
December 2015; 60 articles from JEP:G published between January 2011 and December 2015; 216
and 100 articles from JPSP published between October 2012 and December 2015. 217
We examined the Method section of each study reported in the articles that we had 218
selected to see whether measures suitable for GRIM testing (i.e., those that would generate 219
integer data, or simple composites) were used, and also to determine the sample sizes for the 220
p values as reported in an article when one or more of the means is known to be inconsistent, this
can be a strong indication that the test statistic may be fictitious, having been produced using
exactly such a calculation program.
PeerJ Preprints | https://doi.org/10.7287/peerj.preprints.2064v1 | CC-BY 4.0 Open Access | rec: 23 May 2016, publ: 23 May 2016
13
study and, where appropriate, for each condition. A preliminary check was performed by the 221
first author; if he did not see evidence of either GRIM-compatible measures, or any (sub)sample 222
sizes less than 100, the article was discarded. Subsequently, each author worked independently 223
on the retained articles. We examined the table of descriptives (if present), any other result 224
tables, and the text of the Results section, looking for means or percentages that we could check 225
using the GRIM technique. We noted all of the inconsistent results that we found, double-226
checking where necessary that we had correctly identified the per-cell sample size. On the basis 227
of our tests, we assigned each article a subjective “inconsistency level” rating. A rating of 0 (all 228
clear) meant that all the means we were able to check were consistent. We assigned a rating of 1 229
(minor problems) to articles that contained only one or two inconsistent numbers, where we 230
believed that these were most parsimoniously explained by typographical or transcription errors, 231
and where an incorrect value would have little effect on the main conclusions of the article. 232
Articles that had a small number of inconsistencies, but which might impact the principal 233
reported results of a study, were rated at level 2 (moderate problems); we also gave this rating to 234
articles in which the results seemed to be uninterpretable as described. Finally, we applied a 235
rating of 4 (substantial problems) to articles with a larger number of inconsistencies, especially if 236
these appeared at multiple points in the article. There was no level 3, in keeping with the 237
observation that for a one-item measure such as this, the numerical values are completely 238
arbitrary (Carifio & Perla, 2007; Murphy & Reiner, 1984). Finally, individual ratings were 239
compared and differences in ratings resolved by discussion. 240
241
Results 242
GRIM analysis of articles 243
PeerJ Preprints | https://doi.org/10.7287/peerj.preprints.2064v1 | CC-BY 4.0 Open Access | rec: 23 May 2016, publ: 23 May 2016
14
The total number of articles examined from each journal, the number retained for GRIM 244
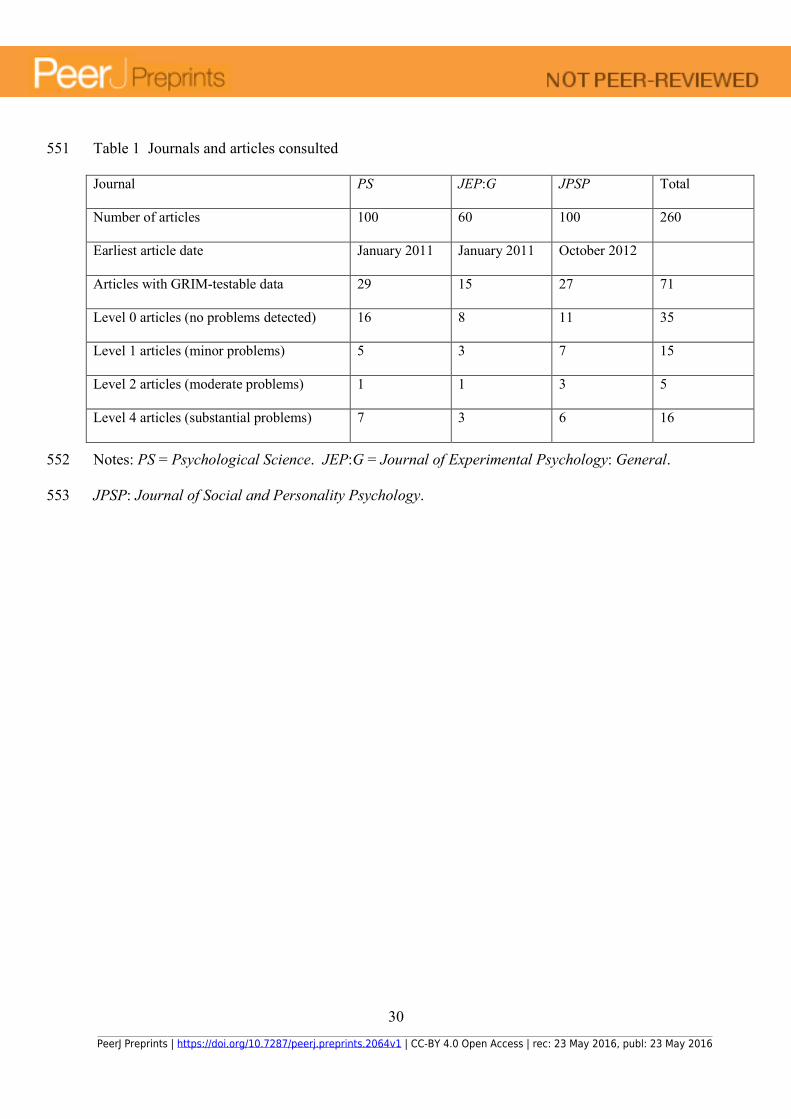
analysis, and the number to which we assigned each rating, are shown in Table 1. A total of 260 245
articles were examined. Of these, 189 (72.7%) were discarded, principally because either they 246
reported no GRIM-testable data or their sample sizes were all sufficiently large that no 247
inconsistent means were likely to be detected. Of the remaining 71 articles, 35 (49.3%) reported 248
all GRIM-testable data consistently and were assigned an inconsistency level rating of 0 (all 249
clear); that is, all of the means (or percentages of integer quantities) that we were able to check 250
were consistent with integers having been divided by the relevant sample sizes (or other 251
denominator), within the limits of rounding. 252
253
===================================================================== 254
Insert Table 1 around here 255
===================================================================== 256
257
That left us with 36 articles that appeared to contain one or more inconsistently-reported 258
GRIM-testable data item. Of these, we assigned an inconsistency level rating of 1 (minor 259
problems) to 15 (21.1% of the 71 articles for which we performed a GRIM analysis), 2 260
(moderate problems) to 5 (7.0%), and 4 (substantial problems) to 16 (22.5%). In some of these 261
“level 4” articles, over half of the analyzable decimal fractions and percentages were 262
inconsistent with the stated sample size. 263
264
Requests for data 265
Next, we wrote to the authors of the 21 articles that were rated at level 2 or 4 asking for their data 266
set(s). Our initial e-mail was concise, and stated only that we wished to see these data in order to 267
PeerJ Preprints | https://doi.org/10.7287/peerj.preprints.2064v1 | CC-BY 4.0 Open Access | rec: 23 May 2016, publ: 23 May 2016
15
allow us to “verify the substantive claims of your article through reanalysis.” We took this 268
wording directly (adding only the words “of your article”) from article 8.14, “Sharing Research 269
Data for Verification”, of the American Psychological Association’s (2003) ethics code. In the 270
case of articles published in JEP:G and JPSP, we knew that the corresponding author had 271
explicitly agreed to these conditions by signing a copy of a document entitled “Certification of 272
Compliance With APA Ethical Principles” prior to publication. 273
In response to our 21 initial requests, we received 11 replies. We obtained the requested 274
data sets from eight authors either by immediate return e-mail, or after a request to indicate 275
exactly which studies within an article were relevant; in seven of these cases, the data were 276
complete, while in the eighth, data from one study was not available. One other author 277
immediately promised to send the requested data, but has not done so to date. One author 278
expressed hostility towards the process and sent no further reply to our follow-up e-mails. In one 279
other case, the corresponding author’s e-mail address (which was at a popular web-based e-mail 280
hosting service, rather than an institutional address) turned out to have been deleted; in this case, 281
the second author informed us that the first author had left academia and was no longer 282
contactable, and that the location of the data set was unknown. 283
After two weeks, we sent follow-up requests, including more details about our study and 284
its aims, to the 10 corresponding authors who had not replied to our initial e-mail. In response to 285
these 10 follow-up e-mails, we received eight replies, of which four contained more or less firm 286
offers to send the authors’ data sets with varying degree of qualification as to the effort involved 287
(in the end, one of these authors provided us with sufficient information about the data in 288
question to enable us to check the consistency of the means, but we never received anything 289
from the other three), and the other four basically constituted refusals. In these last four cases, 290
PeerJ Preprints | https://doi.org/10.7287/peerj.preprints.2064v1 | CC-BY 4.0 Open Access | rec: 23 May 2016, publ: 23 May 2016
16
we replied explaining the full details of our method, but we did not receive any further responses. 291
Interestingly, two of the four refusals were identically worded. The remaining two of our 10 292
follow-up e-mails remained unanswered after ten more weeks had elapsed. 293
We found the rate of response to our requests for these data sets to be rather 294
disappointing, although we appear to have been more successful than Wicherts, Borsboom, Kats, 295
and Molenaar (2006), who reported that 73% of the 141 authors they asked had not shared their 296
data after six months. Since the purpose of our request for data sets was to examine the validity 297
of the GRIM technique, rather than to investigate the specific irregularities that might exist in 298
any given article, we did not attempt to emulate the tenacity6 shown by Wicherts and colleagues 299
in terms of the number of requests sent per data set, the total time allowed for responses, or the 300
amount of discussion we were prepared to enter into with the authors. We sent a maximum of 301
two unsolicited e-mails to each corresponding author, plus a single follow-up reminder to those 302
authors who offered to share their data but did not, in fact, send these within four weeks. 303
304
Analysis of received data sets 305
Our examination of the data sets that we did receive showed that the GRIM technique identified 306
one or more genuine inconsistency in each case. We report the results of each analysis briefly 307
here, in the order in which the data sets were received. 308
6 We note that an investigation into the willingness of researchers to share their data was not the
principal goal of these authors either: “Our original aim was to reanalyze these data sets to assess
the robustness of the research findings to outliers. We never got that far.” (Wicherts et al., 2006,
p. 726)
PeerJ Preprints | https://doi.org/10.7287/peerj.preprints.2064v1 | CC-BY 4.0 Open Access | rec: 23 May 2016, publ: 23 May 2016
17
Data set 1. Our GRIM analysis had detected two inconsistent means in a table of descriptives, as 309
well as eight inconsistent standard deviations (the issue of inconsistent SDs will be the subject of 310
a forthcoming article). From the data set, we found that the two inconsistent means and one of 311
the inconsistent SDs were caused by the sample size for that cell not corresponding to the sample 312
size for the column of data in question; five SDs had been incorrectly rounded because the 313
default (3 decimal places) setting of SPSS had caused a value of 1.2849 to be rounded to 1.285, 314
which the authors had subsequently rounded manually to 1.29; and two further SDs appeared to 315
have been incorrectly transcribed, with values of 0.79 and 0.89 being reported as 0.76 and 0.86, 316
respectively. All of these errors were minor and had no substantive effect on the published 317
results of the article. 318
Data set 2. Our reading of the article in this case had detected several inconsistent means, as 319
well as what appeared to be typing mistakes in the reporting of some other statistics and several 320
inconsistently-reported degrees of freedom. The data set revealed that most of these problems 321
were indeed present, and it also showed up a number of other errors in the authors’ analysis, such 322
as the use of estimated marginal means reported from an ANOVA, rather than the means and 323
SDs of the original data, to perform post hoc t tests. We subsequently discovered that the article 324
in question had already been the subject of a correction in the journal, which did not address 325
most of the problems that we found. We plan to write to the authors to suggest a number of 326
points that they need to address in a subsequent correction; indeed, a strong case could be made 327
for the entire article to be retracted and resubmitted, as—per the Committee on Publication 328
Ethics guidelines on retraction—the results are probably no longer reliable. 329
Data set 3. In this case, our GRIM analysis had shown a large number of inconsistent means in 330
two tables of descriptives. The corresponding author provided us with an extensive version of 331
PeerJ Preprints | https://doi.org/10.7287/peerj.preprints.2064v1 | CC-BY 4.0 Open Access | rec: 23 May 2016, publ: 23 May 2016
18
the data set, including some intermediate analysis steps. We identified that all but one of the 332
columns of data in the two tables of descriptives had been calculated using a formula within 333
Microsoft Excel that included an incorrect selection of cells; for one of the two conditions, this 334
even resulted in the mean and SD of the first condition being included as data points in the 335
calculation of the mean and SD of the second. The corresponding author has assured us that a 336
correction will be issued. It is unclear whether the principal inferential results of the article were 337
affected by these errors; we assume that the authors will verify this in more detail in the course 338
of writing their correction. 339
Data set 4. In their covering e-mail accompanying their data set, the authors of this article 340
apologized in advance for some possible discrepancies between the sample sizes in the data 341
compared to the article (even though we had not told them that issues with the calculated means 342
formed the reason why we were writing to them). They stated that, due to “a number of 343
computer crashes,” they had only been able to retrieve an early version of the data set, and not 344
the final version on which the article was based. We adjusted the sample sizes using the notes 345
that the authors provided, and found that this adequately resolved the inconsistencies in means 346
that we had noticed during our GRIM analysis. 347
Data set 5. The GRIM analyses in this case found some inconsistent means in the reporting of 348
the data that was used as the input to some t tests, as well as in the descriptives for one of the 349
four conditions in the study. The data set revealed that the former were the result of the authors 350
having reported the Ns that were output by SPSS from a 2 × 2 repeated-measures ANOVA in 351
which some cases were missing, so that these Ns were smaller than the sample sizes that were 352
reported in the method section. The problems in the descriptives were caused by the authors 353
having incorrectly reported the number of participants who met the criteria for exclusion from 354
PeerJ Preprints | https://doi.org/10.7287/peerj.preprints.2064v1 | CC-BY 4.0 Open Access | rec: 23 May 2016, publ: 23 May 2016
19
analyses for one cell, with the actual number being five larger than the reported value. We were 355
unable to determine to what extent this difference affected the results of the study, although we 356
noted that the per-cell sample sizes were rather small to begin with. We therefore consider that 357
the GRIM analysis made a useful contribution in this case (and the author thanked us warmly for 358
our observations). 359
Data set 6. In this case, the inconsistencies that we detected with our GRIM analyses turned out 360
to be mostly due to the misreporting by the authors of their sample size. This was not easy to 361
explain as a simple typographical error, as the number of participants was the first word in the 362
first sentence of the methods section, and hence was reported as a word (“Sixty7 undergraduates 363
took part”). Additionally, one reported standard deviation that had caused us some concern 364
turned out to have been incorrectly copied and pasted during the drafting process. 365
Data set 7. This data set confirmed numerous inconsistencies, including several gross errors in 366
the reported degrees of freedom for F tests, from which we had inferred the per-cell sample 367
sizes. Furthermore, a number that was meant to be the result of subtracting one Likert-type item 368
score from another (thus giving an integer result) had the impossible value of 1.5. We reported 369
this discrepancy and the other inconsistencies to the corresponding author. 370
Data set 8. The corresponding author of this study indicated that providing the data set could be 371
problematic, as the data were taken from a much larger longitudinal study. We therefore 372
changed our approach and provided a detailed explanation of the specific inconsistencies we had 373
found, and asked the author to could check these. The author subsequently confirmed that the 374
7 We have changed the actual number in this example to prevent identification of the article in
question. Several other points of detail in the description of the data sets we received have been
similarly altered.
PeerJ Preprints | https://doi.org/10.7287/peerj.preprints.2064v1 | CC-BY 4.0 Open Access | rec: 23 May 2016, publ: 23 May 2016
20
sample size of the study in question had been reported incorrectly, as several participants had 375
been excluded from the analyses but not from the reported count of participants. We were 376
pleased by this result, at least to the extent that it confirmed our calculations, but the author 377
expressed regret at having committed this minor inconsistency and described the exercise as “a 378
good lesson.” It did not seem to us that a correction was necessary in this case. 379
Data set 9. We asked this author for three data sets from a multiple-study article. In one study, 380
we found numerous inconsistencies in a table of descriptives; some of these were explained by 381
missing values for some participants, but others were caused by different numbers than those 382
described in the text having been copied into the table from the SPSS output. In the second, the 383
apparent inconsistencies in the means were caused by missing values for some variables for one 384
participant. The third data set from this article was never obtained. 385
For completeness, we should also mention that in one of the cases above, the data we 386
received showed that we had failed to completely understand the original article; what we had 387
thought were inconsistencies in the means on a Likert-type measure were due to that measure 388
being a multi-item composite (and correctly reported as such). While our analysis also 389
discovered separate problems with the article in question, this underscores how careful reading is 390
always necessary when using this technique. 391
392
Discussion 393
We identified a simple method for detecting discrepancies in the reporting of statistics derived 394
from integer-based data, and applied it to a sample of articles published in some of the leading 395
journals in empirical psychology. Of the 71 articles that we were able to test after discarding 396
PeerJ Preprints | https://doi.org/10.7287/peerj.preprints.2064v1 | CC-BY 4.0 Open Access | rec: 23 May 2016, publ: 23 May 2016
21
those whose sample sizes were too large8, 36 (50.7%) appeared to contain reporting errors in the 397
summary statistics. Because of the limitations of the GRIM method, we have no way of 398
knowing how many similar inconsistencies might have been discovered in the articles where 399
larger samples of participants were tested, had it been standard practice to report means to three 400
decimal places. 401
Of the 71 articles that we tested, in 21 cases the inconsistencies seemed to us to be 402
sufficiently serious to warrant asking the authors to share their data. Of these, five essentially 403
refused to share their data, two more did not reply to our requests, and one seems to have become 404
unreachable. Four other authors assented to data sharing but were ultimately uncooperative. Of 405
the nine cases where the authors did share their data (or, in one case, provided technical details 406
about these), we confirmed the existence of reporting problems in all nine, with eight articles 407
showing GRIM-related inconsistencies. 408
409
Some possible objections 410
8 Note that we made the conservative choice to assign an explicit level 0 rating to articles in
which all of the means that we were able to test were consistent, even if these means represented
only a small percentage of the reported data in the article. Thus, an article reporting six studies,
of which five had samples sizes of 500 and one had a sample of 150 divided across three
conditions, would receive a level 0 rating if the per-condition means for the one smaller study
were consistent. Had we discarded such articles on the basis that the majority of their reported
means were untestable, the percentage of articles in which means were tested and found to be
inconsistent would have been even higher.
PeerJ Preprints | https://doi.org/10.7287/peerj.preprints.2064v1 | CC-BY 4.0 Open Access | rec: 23 May 2016, publ: 23 May 2016
22
It might be argued that inconsistent means could arise due to truncation being performed when 411
rounding would have been appropriate. For example, with N = 37 and a total score of 135, the 412
true mean is 648.3 , which should be rounded to 3.65, but could conceivably be truncated to 3.64 413
if the researcher was not paying close attention. While this is perhaps plausible in some cases, 414
we do not consider that it is sufficient to explain most of the occurrences of the problem that can 415
be observed in the published literature, for several reasons. First, most statistical software 416
packages have functionality to either round values to any desired number of decimal places 417
automatically, or to expand the number of decimal places so that borderline cases, such as a third 418
and (currently) last digit of 5, can be corrected. Third, in 50% of cases (namely, those where the 419
decimal fraction is strictly less than .50), truncation gives the same result as rounding. Fourth, as 420
noted earlier, we decided not to consider the (formally incorrect) truncation of exact fractional 421
values ending in 5 at the third decimal place (such as 13 ÷ 8 = 1.625 being truncated to 1.62) to 422
be an inconsistency in the present analysis. Fifth, for smaller sample sizes (e.g., those in the 423
fictional case cited at the start of the present article), even an incorrectly truncated value is often 424
still not consistent with the sample size. Corroborating the above analysis, we note that only one 425
of the data sets that we examined contained any cases of inconsistent means due to rounding 426
errors9. 427
Another objection that could be made is that one or more of the reported means could 428
simply have been mistyped at some point during the analysis. However, with modern statistical 429
packages, the means and SDs are typically computed directly by the software from the per-430
9 Specifically, when rounding to three decimal places, SPSS had rounded a value of 8.4448 to
8.445. The author had then manually rounded this figure to two decimal places as 8.45, although
the correctly reported value should have been 8.44.
PeerJ Preprints | https://doi.org/10.7287/peerj.preprints.2064v1 | CC-BY 4.0 Open Access | rec: 23 May 2016, publ: 23 May 2016
23
participant data as part of the calculation of the test statistic, so that if the combination of the 431
reported means and SDs is consistent with the exact reported t or F value, it is unlikely that the 432
means have been accidentally changed at some stage in the process (as might have happened in 433
the past when the computation of means, SDs, and test statistics typically required the results of 434
several intermediate steps to be noted on paper). Furthermore, in the case of a simple 435
typographical error in copying the value of a mean from the output of the software, one would 436
expect to see a discrepancy between the reported means and SDs on the one hand, and the test 437
statistic on the other. For example, consider the case of two groups of 44 participants, with 438
means (SDs) of 5.36 (1.18) and 4.77 (1.22). The difference between these groups gives 439
t(86) = 2.31, p = .02. If, when reporting this result, the researcher were to accidentally type 5.63 440
instead of 5.36 for the first mean, a reader of the subsequent article who applies the GRIM test 441
will detect that this is inconsistent with a sample size of 44; but on comparing the means and 442
obtaining t(86) = 3.36, p = .001, it will be apparent that this inconsistency may well be simply 443
due to a typographical error. 444
A limitation of the GRIM technique is that, with the standard reporting of means to two 445
decimal places, it cannot reveal inconsistencies with per-cell sample sizes of 100 or more, and its 446
ability to detect such inconsistencies decreases as the sample size increases (or as the number of 447
items in a composite measure increases). However, this still leaves a substantial percentage of 448
the literature that can be tested. Recall that we selected our articles from some of the highest-449
impact journals in the field; it might well be that lesser journals have a higher proportion of 450
smaller studies. Additionally, it might be the case that smaller studies are more prone to 451
reporting errors (for example, because they are run by laboratories that have fewer resources for 452
professional data management). 453
PeerJ Preprints | https://doi.org/10.7287/peerj.preprints.2064v1 | CC-BY 4.0 Open Access | rec: 23 May 2016, publ: 23 May 2016
24
A further potential limitation that was raised by one of the corresponding authors with 454
whom we discussed our technique is the case where one or two participants are missing values 455
on individual items in a composite measure. Such missing values could, indeed, introduce false 456
positives into the estimates of inconsistencies. However, in our admittedly modest sample of 457
articles, this issue only caused inconsistencies in one case. We believe that this limitation is 458
unlikely to be a major problem because in any case, as discussed in the previous paragraph, the 459
GRIM test is typically not applicable to measures with a large number of items because of the 460
requirement for the product of the per-cell sample size and the number of items to be less than 461
100. 462
463 Concluding remarks 464
On its own, the discovery of one or more inconsistent means in a published article need not be a 465
cause for alarm; indeed, we discovered from our reanalysis of data sets that in many cases where 466
such inconsistencies were present, there was a perfectly innocent explanation, such as a minor 467
error in the reported sample sizes, or some lack of clarity in the reporting of the design of a 468
study. On occasion, too, the GRIM analysis may produce false positives: The reader may have 469
assumed that what looked like a single Likert-type item was in fact a composite measure, or that 470
a stimulus was measured as an integer when in fact it was a continuous real quantity. 471
It might also be that psychologists are simply sometimes rather careless in retyping 472
numbers from statistical software packages into their articles. However, in such cases, we 473
wonder how many other elementary mistakes have been made in the analysis of the data, and 474
with what effects on the reported results. Indeed, as noted above, in two cases our examination 475
of the data sets we received showed that the authors had made a number of errors in their 476
analyses that were both elementary in their nature and severe in their effects, It is interesting to 477
PeerJ Preprints | https://doi.org/10.7287/peerj.preprints.2064v1 | CC-BY 4.0 Open Access | rec: 23 May 2016, publ: 23 May 2016
25
compare our experiences with those of Wolins (1962), who asked 37 authors for their data, 478
obtained them from nine authors, and found gross errors in three cases. While the sample sizes 479
here are small, we wonder if some proportion of psychology’s replication crisis (Open Science 480
Collaboration, 2015) might be due to the initial (or replication) results being simply the products 481
of erroneous analyses. 482
Beyond inattention and poorly-designed analyses, however, we cannot exclude that in 483
some cases, a plausible explanation for GRIM inconsistencies is that some form of data 484
manipulation has taken place. For example, in the fictional extract at the start of this article, here 485
is what should have been written in the last sentence: 486
Participants in the “drunk the Kool-Aid” condition did not report a significantly stronger 487
belief in the ability of pigs to fly (M = 4.79, SD = 1.34) than those in the control 488
condition (M = 4.27, SD = 1.41), t(53) = 1.40, p = .17. 489
In the “published” extract, compared to the above version, the first mean was “adjusted” by 490
adding 0.40, and the second by subtracting 0.40. This transformed a non-significant p value into 491
a significant one, thus making the results considerably easier to publish (cf. Kühberger, Fritz, & 492
Scherndl, 2014). 493
We are particularly concerned about the eight data sets (out of the 21 we requested) that 494
we believe we will probably never see (five due to outright refusals to share the data, two due to 495
repeated non-response to our requests, and one due to the apparent disappearance of the 496
corresponding author). Refusing to share one’s data for reanalysis without giving a clear 497
(typically, ethical) reason is, we feel, professionally disrespectful at best after assenting to such 498
sharing as a condition of publication, as is the case in (for example) APA journals such as JPSP 499
and JEP:G. When accompanied by numerical evidence that the results of a published article 500
PeerJ Preprints | https://doi.org/10.7287/peerj.preprints.2064v1 | CC-BY 4.0 Open Access | rec: 23 May 2016, publ: 23 May 2016
26
may be unreliable, such a refusal will inevitably cause speculation about what those data might 501
reveal. However, throughout the present article, we have refrained from mentioning the titles, 502
authors or any identifying features of the articles in which the GRIM analysis identified apparent 503
inconsistencies. There are three reasons for this; first, the technique as it stands was considered 504
prospective at the time we started to examine the published articles, rather than an established 505
method; second, in any given case, there may be an innocent explanation for any or all of the 506
inconsistencies that we identified in any given article; third, it is not our purpose here to 507
“expose” anything or anyone. We offer our results in the hope that they will stimulate discussion 508
within the field. It would appear, as a minimum, that we have identified an issue worthy of 509
further investigation, and produced a tool that might assist reviewers of future work, as well as 510
those who might wish to check some results in the existing literature. 511
PeerJ Preprints | https://doi.org/10.7287/peerj.preprints.2064v1 | CC-BY 4.0 Open Access | rec: 23 May 2016, publ: 23 May 2016
27
Acknowledgements 512
The authors wish to thank Tim Bates and Chris Chambers for their helpful comments on an 513
earlier draft of this article. 514
PeerJ Preprints | https://doi.org/10.7287/peerj.preprints.2064v1 | CC-BY 4.0 Open Access | rec: 23 May 2016, publ: 23 May 2016
28
References 515
American Psychological Association (2003). APA ethical principles of psychologists and code 516
of conduct. Retrieved from http://memforms.apa.org/apa/cli/interest/ethics1.cfm 517
Bakker, M., & Wicherts, J. M. (2011). The (mis)reporting of statistical results in psychology 518
journals. Behavior Research Methods, 43, 666–678. http://dx.doi.org/10.3758/s13428-519
011-0089-5 520
Carifio, J., & Perla, R. J. (2007). Ten common misunderstandings, misconceptions, persistent 521
myths and urban legends about Likert scales and Likert response formats and their 522
antidotes. Journal of Social Sciences, 3, 106–116. 523
http://dx.doi.org/10.3844/jssp.2007.106.116 524
Cole, S., Balcetis, E., & Dunning, D. (2013). Affective signals of threat increase perceived 525
proximity. Psychological Science, 24, 34-40. 526
http://dx.doi.org/10.1177/0956797612446953. 527
Coombs, C. H. (1960). A theory of data. Psychological Review, 67, 143–159. 528
http://dx.doi.org/10.1037/h0047773 529
Jamieson, S. (2004). Likert scales: how to (ab)use them. Medical Education, 38, 1212–1218. 530
http://dx.doi.org/10.1111/j.1365-2929.2004.02012.x 531
Kühberger, A., Fritz, A., & Scherndl, T. (2014). Publication bias in psychology: A diagnosis 532
based on the correlation between effect size and sample size. PLoS ONE, 9(9): e105825. 533
http://dx.doi.org/10.1371/journal.pone.0105825 534
Murphy, K. (Producer), & Reiner, R. (Director). (1984). This is Spinal Tap [Motion picture]. 535
United States: Embassy Pictures. 536
PeerJ Preprints | https://doi.org/10.7287/peerj.preprints.2064v1 | CC-BY 4.0 Open Access | rec: 23 May 2016, publ: 23 May 2016
29
Open Science Collaboration (2015). Estimating the reproducibility of psychological science. 537
Science, 349, aac4716. http://dx.doi.org/10.1126/science.aac4716 538
Reiterman, T., & Jacobs, J. (1982). Raven: The untold story of the Rev. Jim Jones and his 539
people. New York, NY: E. P. Dutton. 540
Simonsohn, U. (2013). Just post it: The lesson from two cases of fabricated data detected by 541
statistics alone. Psychological Science, 24, 1875–1888. 542
http://dx.doi.org/10.1177/0956797613480366 543
Thurstone, L. L. (1927). A law of comparative judgment. Psychological Review, 34, 273–286. 544
http://dx.doi.org/10.1037/h0070288 545
Wicherts, J. M., Borsboom, D., Kats, J., & Molenaar, D. (2006). The poor availability of 546
psychological research data for reanalysis. American Psychologist, 61, 726–728. 547
http://dx.doi.org/10.1037/0003-066X.61.7.726 548
Wolins, L. (1962). Responsibility for raw data. American Psychologist, 17, 657–658. 549
http://dx.doi.org/10.1037/h0038819 550
PeerJ Preprints | https://doi.org/10.7287/peerj.preprints.2064v1 | CC-BY 4.0 Open Access | rec: 23 May 2016, publ: 23 May 2016
30
Table 1 Journals and articles consulted 551
Journal PS JEP:G JPSP Total
Number of articles 100 60 100 260
Earliest article date January 2011 January 2011 October 2012
Articles with GRIM-testable data 29 15 27 71
Level 0 articles (no problems detected) 16 8 11 35
Level 1 articles (minor problems) 5 3 7 15
Level 2 articles (moderate problems) 1 1 3 5
Level 4 articles (substantial problems) 7 3 6 16
Notes: PS = Psychological Science. JEP:G = Journal of Experimental Psychology: General. 552
JPSP: Journal of Social and Personality Psychology. 553
PeerJ Preprints | https://doi.org/10.7287/peerj.preprints.2064v1 | CC-BY 4.0 Open Access | rec: 23 May 2016, publ: 23 May 2016
31
Figure 1 Plot of consistent (white dots) and inconsistent (black dots) means, reported to 2 554
decimal places. 555
556
Note: This figure assumes that means ending in 5 at the third decimal place (e.g., 557
10 ÷ 80 = 0.125) are rounded up; it does not include the possibility, mentioned in the text, of 558
allowing such means to be rounded up or down. This would cause a few extra white dots at 559
sample sizes that are multiples of 8. 560
PeerJ Preprints | https://doi.org/10.7287/peerj.preprints.2064v1 | CC-BY 4.0 Open Access | rec: 23 May 2016, publ: 23 May 2016
32
Appendix A 561
We show here the e-mails that were sent to the authors of the articles in which we found apparent 562
problems, to request that they share their data. In some cases there were minor variations in 563
wording or punctuation. 564
565
The first e-mail, sent in late January 2016: 566
Dear Dr. <name>, 567 568 We have read with interest your article “<title>”, published in <year> in <Journal>. 569 570 We are interested in reproducing the results from this article as part of an ongoing project 571 concerning the nature of published data. 572 573 Accordingly, we request you to provide us with a copy of the dataset for your article, in 574 order to allow us to verify the substantive claims of your article through reanalysis. We 575 can read files in SPSS, XLS[x], RTF, TXT, and most proprietary file types (e.g., .MAT). 576 577 Thank you for your time. 578 579 Sincerely, 580 581 Nicholas J. L. Brown 582 PhD candidate, University of Groningen Medical Center 583 584 James A. J. Heathers 585 Postdoctoral Fellow, Poznań University of Medical Sciences 586
587
The second e-mail, sent about 10 days after the first if we had received no reply: 588
Dear Dr. <name>, 589 590 Not having received a reply to our first e-mail (see below), we are writing to you again. 591 We apologise if our first message was a little cryptic. 592 593 We are working on a technique that we hope will become part of the armoury of peer 594 reviewers when checking empirical papers, which we hope will allow certain kinds of 595 problems with the reporting of statistics to be detected from the text. Specifically, we 596 look at means that do not appear to be consistent with the reported sample size. From a 597
PeerJ Preprints | https://doi.org/10.7287/peerj.preprints.2064v1 | CC-BY 4.0 Open Access | rec: 23 May 2016, publ: 23 May 2016
33
selection of articles that we have analysed, yours appears to be a case where our 598 technique might be helpful (if we have understood your method section correctly). 599 600 However, we are still refining our technique, which is why we are asking 20 or so authors 601 to provide us with data so that we can check that we have fully understood their methods, 602 and see how we should refine the description of our technique to make it as specific and 603 selective as possible. Comparing the results of its application with the numbers in the 604 dataset(s) corresponding to the articles that we have identified will hopefully enable us to 605 understand this process better. So if you could provide us with your data from this article, 606 that would be very helpful. 607 608 Kind regards, 609 Nick Brown 610 James Heathers 611
612
PeerJ Preprints | https://doi.org/10.7287/peerj.preprints.2064v1 | CC-BY 4.0 Open Access | rec: 23 May 2016, publ: 23 May 2016


![GRIM commission BEHR]](https://img.pdfslide.net/doc/110x75/623ef96b04c3026a683d0fec/grim-commission-behr.jpg)