Embed Size (px)
Citation preview

THE HIGHER EDUCATION SCHEDULING INDEX
JULY
201
6 RE
PORT
Ad Astra Information Systems6900 W. 80th St., Suite 300 | Overland Park, KS 66204 | 913-652-4100 | aais.com
© 2016 Ad Astra Information Systems, LLC

Ad Astra Information Systems | aais.com
THE HIGHER EDUCATION SCHEDULING INDEXJULY 2016 REPORT
1
TABLE OF CONTENTS
Introduction ...............................................................................2
What is The Higher Education Scheduling Index (HESI™)? ......3
Methodology .............................................................................4
HESI Terminology and Industry Index .......................................5
Course Offerings ..................................................................5
Space Management .............................................................6
HESI Industry Observations .......................................................7
Course Offerings Metrics Highlights ....................................7
Space Management Metrics Highlights ...............................8
Challenges and Opportunities from 2016 Observations ..........9
Case Studies, Interventions and Outcomes ............................13
Institution A ........................................................................13
Institution B ........................................................................13
Institution C ........................................................................14
Institution D ........................................................................15
What’s Next for the HESI? .......................................................16
ADDENDUM
Who is Ad Astra Information Systems? ...................................17

Ad Astra Information Systems | aais.com
THE HIGHER EDUCATION SCHEDULING INDEXJULY 2016 REPORT
2
INTRODUCTION
Change in higher education is a common denominator. Institutions are
facing enrollment fluctuations, student population changes, shifts in
state funding, and pressure to increase tuition. Over the past 20 years,
Ad Astra Information Systems has collaborated with more than 1,000
higher education campuses, as well as many state and regional systems
who are striving to respond to these changes. This collaboration is focused
on the business intelligence needed to optimally allocate instructional
resources and advance timely student completions.
Although the challenges are widely acknowledged, benchmarking how
institutions respond to these challenges has been lacking. For this reason,
Ad Astra developed the Higher Education Scheduling Index (HESI™), the
industry’s only peer-comparison database focused on academic resources
and student success.
This 2016 Annual Report of the Higher Education Scheduling Index (HESI)
includes key analytical findings that highlight opportunities for academic
leaders to address enrollment fluctuations, funding shifts, and student
success through a series of strategies including better allocation of finite
instructional resources. This report also recommends best practices that
can help leaders from campuses of any size reimagine the possibilities to
improve instructional resource utilization, student-centric scheduling, and
student completions.
Generally, these findings show a consistent conflict between an institution’s
desire to fulfill student course needs and efficiently allocate and utilize
campus resources. It is not uncommon for a partner institution to excel in
one of these priorities while performing below “like” institutions in the other.
Decision-support information enables institutions to strike the balance
by identifying, segmenting, and managing these issues. The case studies
presented in this report demonstrate practical ways that schools can
succeed at meeting all of these goals: efficient resource utilization,
improved student success, and the ability to respond to change.
AD ASTRA
OVER THE PAST
HIGHER EDUCATION
20 YEARS,INFORMATION SYSTEMSHAS COLLABORATED WITH MORE THAN
1,000CAMPUSES

Ad Astra Information Systems | aais.com
THE HIGHER EDUCATION SCHEDULING INDEXJULY 2016 REPORT
3
WHAT IS AD ASTRA’S HIGHER EDUCATION SCHEDULING INDEX (HESI)?
The HESI is a benchmarking database. The 2016 HESI Report reflects
national averages derived from the HESI database of 157 colleges and
universities. The performance metrics track the allocation of faculty and
space resources on these campuses. These metrics:
• Allow institutions to gain clarity concerning their resource allocation
and opportunities for improvement
• Provide the context for comparing institutional performance to the
industry and a sub-set of “like” institutions
• Create a framework to measure and more effectively manage the highly
decentralized model of scheduling employed on campuses today
• Highlight many of the best practices in higher education that can lead
to improvements in balancing resource utilization and student success
The 2016 HESI Report findings serve as a starting point for institutions
to take action. They answer the questions: “Where are we today?” and
“What are our biggest opportunities for improvement?” Although the
metrics in the HESI record an institution’s initial benchmark only, most have
made substantial improvements from their original findings by monitoring
performance during their scheduling and registration processes and
making targeted schedule changes.
In doing so, these example institutions help expand the industry’s thinking
about what is possible and, arguably, essential. Ad Astra is pleased to
offer the 2016 HESI Report as a resource to assist industry leaders in this
complex and rewarding process.
157DATABASE OF
COLLEGES &UNIVERSITIES
HESI

Ad Astra Information Systems | aais.com
THE HIGHER EDUCATION SCHEDULING INDEXJULY 2016 REPORT
4
METHODOLOGY
The HESI database is populated through the following process: Ad Astra
consultants gather scheduling data — academic facilities, student academic
history, and course sections — from partner institutions over multiple
academic terms. Data analysts then review the institutional data and the
metrics from the course offering and space capacity analyses. The metrics
objectively describe the effectiveness of the course and room scheduling
processes at each institution, and rank each finding relative to “like”
institutions.
Consultants then meet with campus leadership and a strategic scheduling
team to present and help interpret the metrics and create action plans.
When no central scheduling team exists, the consultants advise how to
formalize such a committee to collectively evaluate and take action on
the recommendations.
HIGHER EDUCATION SCHEDULING INDEX157 INSTITUTIONS
June 2016 Higher Education Scheduling Index (HESI™)
Ad Astra Information Systems | aais.com
THE HIGHER EDUCATION SCHEDULING INDEXJULY 2016 REPORT
5
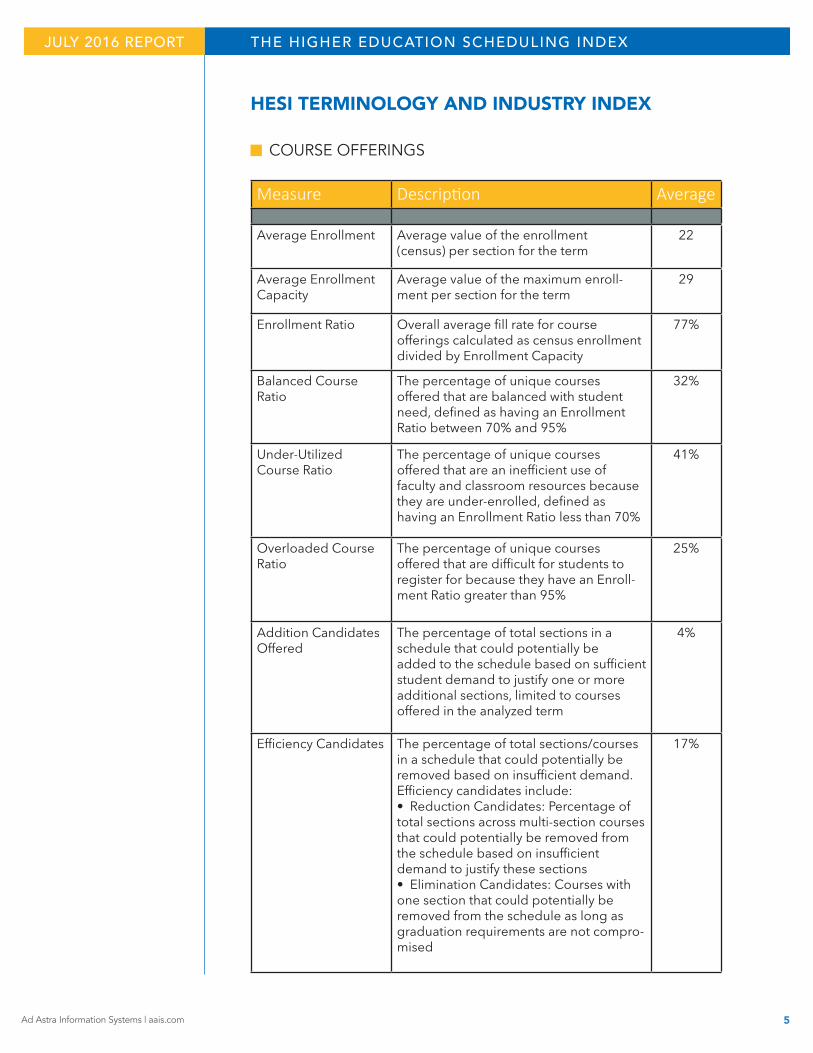
HESI TERMINOLOGY AND INDUSTRY INDEX
Measure Description Average
Average Enrollment Average value of the enrollment (census) per section for the term
22
Average Enrollment Capacity
Average value of the maximum enroll-ment per section for the term
29
Enrollment Ratio Overall average fill rate for course offerings calculated as census enrollment divided by Enrollment Capacity
77%
Balanced Course Ratio
The percentage of unique courses offered that are balanced with student need, defined as having an Enrollment Ratio between 70% and 95%
32%
Under-Utilized Course Ratio
The percentage of unique courses offered that are an inefficient use of faculty and classroom resources because they are under-enrolled, defined as having an Enrollment Ratio less than 70%
41%
Overloaded Course Ratio
The percentage of unique courses offered that are difficult for students to register for because they have an Enroll-ment Ratio greater than 95%
25%
Addition Candidates Offered
The percentage of total sections in a schedule that could potentially be added to the schedule based on sufficient student demand to justify one or more additional sections, limited to courses offered in the analyzed term
4%
Efficiency Candidates The percentage of total sections/courses in a schedule that could potentially be removed based on insufficient demand. Efficiency candidates include:• Reduction Candidates: Percentage of total sections across multi-section courses that could potentially be removed from the schedule based on insufficient demand to justify these sections• Elimination Candidates: Courses with one section that could potentially be removed from the schedule as long as graduation requirements are not compro-mised
17%
COURSE OFFERINGS

Ad Astra Information Systems | aais.com
THE HIGHER EDUCATION SCHEDULING INDEXJULY 2016 REPORT
6
HESI TERMINOLOGY AND INDUSTRY INDEX
Measure Description Average
Standard Week Hours The number of hours in all the days/times that are available for scheduling academic sections
64
Primetime Hours The most popular days/times for sched-uling academic sections, where room utilization is often disproportionately high. The prime week is a subset of the Stan-dard Week Hours
25
Classroom Utilization Standard Week
The percentage of hours in a standard week (as defined by each institution’s usage patterns) that a typical classroom is in use
46%
Classroom Utilization Primetime
The percentage of hours in the primetime subset of a standard week (as defined by each institution’s usage patterns) that a typical classroom is in use
67%
Prime Ratio Percentage of hours scheduled during Primetime Hours (Prime Hours divided by Total Hours)
59%
Seat Fill Utilization - Enrollment
The percentage of seats in use (based on enrollment) in a classroom when it is scheduled (Average Enrollment divided by room capacity)
62%
Seat Fill Utilization - Enrollment Cap
The percentage of seats in use (based on section enrollment caps) in a classroom when it is scheduled (Average Enrollment Capacity divided by room capacity)
81%
Off-Grid Utilization The percentage of scheduling using non-standard meeting patterns during Primetime Hours
42%
Off-Grid Waste The percentage of capacity wasted by scheduling non-standard meeting patterns during Primetime Hours
14%
SPACE MANAGEMENT

Ad Astra Information Systems | aais.com
THE HIGHER EDUCATION SCHEDULING INDEXJULY 2016 REPORT
7
HESI INDUSTRY OBSERVATIONS
COURSE OFFERINGS METRICS HIGHLIGHTSAd Astra has discussed course and resource scheduling with leaders
from many of the colleges and universities in North America. Only a few
institutions comprehensively manage the course schedule or track related
performance metrics. As a result, it’s not surprising that the course
offering findings in the HESI database show significant opportunities
for improvement.
The general pattern in the data reflects an imbalance between seats offered
and seats needed for most courses. Specifically, fewer than a third of the
courses taught in a major term at a typical institution have a “balanced”
seat supply and demand. The highlights of the 2016 course offering findings
are listed below:
1. While overall course fill rates (Enrollment Ratios) are at a respectable
level of 77% for the industry, this masks the fact that only 32% of the
courses offered are “Balanced.”
2. The largest group of courses are Under-Utilized (41%), leading to
17% of the course sections in a typical schedule being unneeded
relative to student course demand.
3. Addition Candidates are less than one-fourth the number of
Efficiency Candidates in a typical schedule, meaning that most
institutions currently have the capacity to meet students’ course
needs without additional faculty resources.
4. Given that significant capacity is consumed by unneeded course sections,
more efficient schedules would greatly increase effective classroom
capacity for most institutions.
RELATIVE TO
17%OF THE COURSESECTIONS IN A TYPICAL
STUDENTCOURSE DEMAND
SCHEDULE AREUNNEEDED

Ad Astra Information Systems | aais.com
THE HIGHER EDUCATION SCHEDULING INDEXJULY 2016 REPORT
8
SPACE MANAGEMENT METRICS HIGHLIGHTSStatistically, many institutions understand their academic space utilization.
Most public colleges and universities are required to calculate and report
utilization to their governing or coordinating boards. The opportunity is
to evolve from simply measuring high-level utilization to strategically
planning and managing space.
A focus on capacity, versus utilization only, is a recommended starting
point. A capacity approach identifies bottlenecks and develops strategies
for resolution. A campus with less than average space utilization and a
perceived lack of space can benefit from this approach. The highlights of
the 2016 space management findings are offered below:
1. Most institutions feel and express that they are “out of space,”
even though a typical classroom is in use less than half of the
weekly instructional hours (Standard Week Hours) and is only
62% full when in use.
2. A typical campus loses more than 14% of its classroom capacity to
Off-Grid Scheduling during Primetime. With careful management,
most campuses can reduce this number to less than 10%, creating
over 4% more available classroom capacity (e.g., a campus with 100
classrooms effectively loses 14 classrooms of capacity, but could
reduce this to 10 or fewer).
3. While the industry widely compares classroom utilization statistics,
there is a large variance in Standard Week Hours on the various
campuses measured (from 32 to 96).
4. Primetime Hours, with concentrated usage, are less than half of
Standard Week Hours on a typical campus reflecting the opportunity
for increased capacity.
EFFICIENT
WOULD GREATLYSCHEDULES
EFFECTIVE CLASSROOM CAPACITY FOR MOST
INCREASE
INSTITUTIONS

Ad Astra Information Systems | aais.com
THE HIGHER EDUCATION SCHEDULING INDEXJULY 2016 REPORT
9
CHALLENGES AND OPPORTUNITIES FROM
2016 OBSERVATIONS
Balancing Competing Priorities The basic challenge illustrated in the scatter plot of HESI institutions below
is the need to balance students’ course access with campus efficiency. As
previously stated, success in these areas is frequently inversely correlated
(e.g. efficient institutions tend to have lower course access, and vice versa).
Only 23 of the 157 institutions in the 2016 HESI excelled in both categories.
They are represented in the top-right quadrant of this graph (green dots).
This is the “magic quadrant” of scheduling where student course access and
campus efficiency performance are both better than industry averages.
Over time, an institution’s performance can be tracked, with the goal of
moving toward the upper-right quadrant of the scatter plot.
THE MAGIC
ONLY 23 OF THE 157 INSTITUTIONS
QUADRANT:
EXCELLEDIN BOTH CATEGORIES
PERFORMANCE BY PERCENTILE RANK
EFFICIENCY
CO
UR
SE A
CC
ESS
Ad Astra Information Systems | aais.com
THE HIGHER EDUCATION SCHEDULING INDEXJULY 2016 REPORT
10
Enrollment Trends Influence Findings Enrollment fluctuation is a concern for all institutions regardless of whether
they are public or private, two-year or four-year. Overall, enrollments have
been declining nationwide since 2011, and the 18-to-24 year-old population
is expected to decrease for at least another decade1. This trend has led to
a decline in tuition revenue for many institutions as, in many cases, state
support per student continues to decline.
To evaluate the impact of changes in enrollments on HESI performance,
the 157 institutions were grouped into three categories based on
recent (since 2010) predominant enrollment trends: those with declining
enrollments, those with flat enrollments, and those with growing enrollments.
A clear pattern emerged. Institutions with declining enrollments often
have challenges with resource efficiency, while institutions that are still
experiencing growth are frequently more challenged with course access
for their students. From this pattern it is logical to hypothesize that
enrollments change faster than schedules on many campuses, leading
to a disconnect between students’ course needs and offerings in those
schedules. While the prevalent scheduling practice of “rolling forward”
from term-to-term may minimize internal and staffing disruptions, it also
appears to limit course access and an institutions’ ability to respond to
changing enrollment climates.
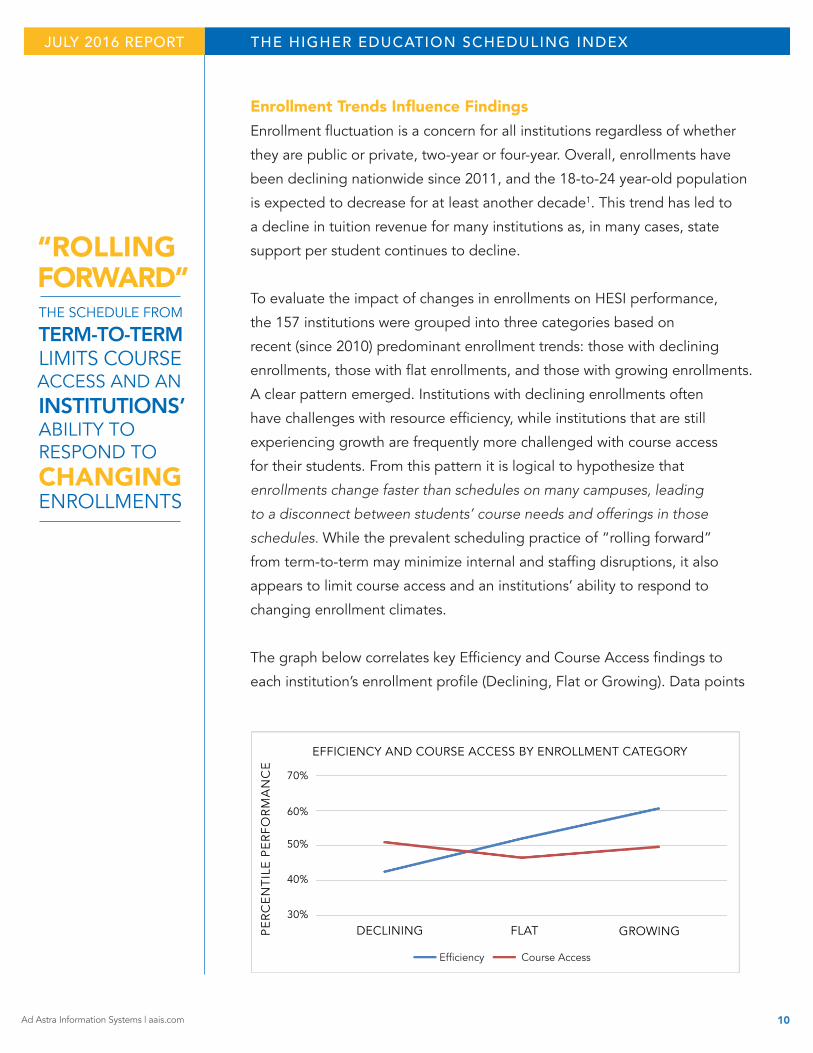
The graph below correlates key Efficiency and Course Access findings to
each institution’s enrollment profile (Declining, Flat or Growing). Data points
THE SCHEDULE FROM TERM-TO-TERM LIMITS COURSE
“ROLLING FORWARD”
INSTITUTIONS’ ABILITY TO RESPOND TO
ACCESS AND AN
CHANGING ENROLLMENTS
EFFICIENCY AND COURSE ACCESS BY ENROLLMENT CATEGORY
PE
RC
EN
TIL
E P
ER
FOR
MA
NC
E
DECLINING FLAT GROWING
Efficiency Course Access
70%
60%
50%
40%
30%
Ad Astra Information Systems | aais.com
THE HIGHER EDUCATION SCHEDULING INDEXJULY 2016 REPORT
11
represent the performance, on a percentile basis, of institutions in these
categories, relative to the overall HESI database. Note that the average
efficiency of growing institutions measures in the 61st percentile, while their
course access metrics only average in the 40th percentile. Conversely, the
average efficiency of institutions with declining enrollments measures in the
42nd percentile. These same schools with declining enrollments outperform
“like” institutions in course access metrics, with an average in the 58th
percentile. Institutions with materially flat enrollments fall in the
middle of both efficiency and course access metrics.
Fiscal ConsiderationsIn order for institutions with declining enrollments to meet students’ course
access needs, campus leaders should consider more effectively utilizing
full-time faculty rather than relying as heavily on adjunct instruction. For
example, removing unneeded sections may allow institutions to reduce
adjunct spending and reallocate full-time faculty resources, enabling them
to teach the courses that are in demand. In this scenario, data serve a
critical role in informing decisions to optimize resource allocation and
create better course schedules. More than 41% of the undergraduate
courses taught on a typical campus are under-enrolled (census enrollment
is < 70% of the seats offered for that course). For institutions with declining
enrollments, this finding increases to 44%.
On the other hand, adding sections to Overloaded Courses (courses
more than 95% filled) can accelerate completions and increase tuition
revenues. Courses which are overloaded comprise 25% of a typical course
schedule (23% for those institutions with declining enrollment). Rather than
replicate the same “like” term schedule, using new enrollment data for
each term allows strategic scheduling teams to identify and take action on
Under-Utilized and Overloaded Courses, better allocating resources while
advancing student completions.
UNDER-ENROLLED
41%OF THE
COURSESTAUGHT ON A TYPICAL CAMPUS ARE
UNDERGRADUATE
Ad Astra Information Systems | aais.com
THE HIGHER EDUCATION SCHEDULING INDEXJULY 2016 REPORT
12
Capacity RestrictionsAccording to the HESI data, institutions with growing enrollment can
creatively overcome constrained space and faculty resources through
efficient scheduling. Since budget restrictions preclude new space and
new faculty lines, these institutions must continue to focus on class fill
rates and capacity strategies to maximize resource utilization. Wasted
capacity, especially sections with low enrollment during Primetime, will
be increasingly difficult to overcome as enrollments grow. While growing
institutions are, on average, more efficient, 15% of the offerings at these
institutions are not statistically needed (compared to the 17% average
for all HESI institutions). Even institutions with efficient schedules that
are ranked in the 80th percentile in the HESI could remove more than
9% of the sections offered to better optimize use of resources. Due to
the prevalence of this phenomenon among the 157 institutions, Ad Astra
believes any institution would benefit from considering removal of some
of those unneeded sections, while adding sections that students require
to complete their programs.
Institutions that efficiently match sections to classrooms may improve
their classroom fill rates (Average Enrollment divided by room capacity).
The average classroom fill rate among institutions in the 2016 HESI
Report is 62% (66% for schools with growing enrollments). Utilizing these
strategies, along with adherence to the most efficient non-overlapping
meeting patterns in Primetime, can help a campus recapture 10-25% of
additional capacity without adding resources.
THE AVERAGE CLASSROOM FILL RATEAMONG INSTITUTIONS IN THE 2016 HESI REPORT
62%

Ad Astra Information Systems | aais.com
THE HIGHER EDUCATION SCHEDULING INDEXJULY 2016 REPORT
13
CASE STUDIES, INTERVENTIONS, AND OUTCOMES
INSTITUTION A Course scheduling improved completion progress and reversed financial
impact of an enrollment downturn.
• 2-year college
• 3,500 headcount enrollment
• 28% decrease in enrollment since 2010
As previously acknowledged, many higher education institutions are facing
declining tuition revenues and drastically reduced state funding. The future
of these schools is uncertain and some are closing.
The president of this rural community college recognized this possibility,
adopted a proactive approach, and partnered with Ad Astra to revise their
“roll-forward” scheduling practice. High-impact changes were recommended
and acted on for the Fall 2015 schedule, producing significant results:
• The college saw an 18% increase in the average student credit hour
load, resulting in an increased tuition revenue yield of $167,414 in
one fall term
• The college right-sized the course sections (from 511 to 442) to respond
to downward trend in FTE enrollment, resulting in an estimated savings
of $113,850 in one term
INSTITUTION B University used course demand analytics to improve student access to
required courses and degree completion.
• 4-year university
• 23,397 headcount enrollment
• Record high enrollment in 2015
In some states, a part of the funding formula is tied to space utilization.
Utilization statistics must be reported to a system and governing
board annually.
THE COLLEGE REALIZED AN
$250K
IN TUITION REVENUEINCREASEYIELD AND ESTIMATED
OF OVERSAVINGS

Ad Astra Information Systems | aais.com
THE HIGHER EDUCATION SCHEDULING INDEXJULY 2016 REPORT
14
This institution set out to optimize their space utilization by aligning course
sections with student demand for courses. By using HESI performance
metrics, the school was able to improve space utilization scores each year
since 2012 and recently received a perfect (maximum) rating and related
funding. While improving efficiency, the institution increased its Balanced
Course Ratio and student access to courses significantly by decreasing
Under-Utilized and Overloaded Courses Ratios by more than 10%. The
impact of these changes resulted in:
• Increased average credit hour load per student by 5%
• Increased tuition receipts and related revenues by an estimated
$5 million, annually
• Decreased student time-to-completion by an estimated .2 years
INSTITUTION C The course schedule is leveraged to improve degree completion,
operational efficiency, and performance funding metrics.
• 2-year college
• 15,000 + headcount enrollment
• Enrollment doubled between 2006 and 2010; has been declining
since 2010
Course scheduling is an important part of an overall strategy to increase
completions. Working with Ad Astra, this institution implemented a system
of metrics and course demand analytics to align academic resources to their
students’ needs. Optimization and targeted changes made to the fall and
spring schedules resulted in:
• Saved approximately $2 million in instructional cost in one
academic year
• Increased the annual average student credit hour load by 6%
• Increased the average velocity to completion by .2 years
IN ONE ACADEMIC YEAR
$2 MILLIONAPPROXIMATELY
IN INSTRUCTIONALDOLLARS SAVED
(7.71 to 8.18), despite a declining enrollment

Ad Astra Information Systems | aais.com
THE HIGHER EDUCATION SCHEDULING INDEXJULY 2016 REPORT
15
• Increased the number of degrees awarded by 22% in a three-year
period, while unduplicated degree-seeking enrollment decreased
by 31%
• Realized an additional tuition yield of $72.19 per student, resulting
in an increase of $1.5 million in aggregate revenue
INSTITUTION D Public university aligned course offerings with student course needs and
classroom capacity to save $249,000 in one academic term.
• 4-year university
• 5,200 headcount enrollment
• Enrollment trended up from 2004 - 2011, then began trending
down (9% decrease since 2011)
The previous five years of historical enrollment data were gathered and
analyzed for this institution. The findings then informed schedule changes
for Fall 2016, which were quickly acted upon by academic leadership.
The recommendations included removing 86 sections with historically
low enrollment and adding three sections that had been bottlenecked for
student access. These actions resulted in:
• Recaptured $249,000 in instructional costs
• Adjusted course capacity to more realistic levels, allowing better
classroom assignment based on projected enrollment levels
• Reallocated funds for additional full-time faculty to teach historically
overloaded courses
FACULTY TO TEACH HISTORICALLY
THE INSTRUCTIONAL
FUNDEDCOST SAVINGS
FULL-TIME
OVERLOADED
ADDITIONAL
COURSES

Ad Astra Information Systems | aais.com
THE HIGHER EDUCATION SCHEDULING INDEXJULY 2016 REPORT
16
WHAT’S NEXT FOR THE HESI IN 2017?
As the number of partner institutions benchmarked in the HESI continues to
grow, Ad Astra plans to augment the database with new metrics. Many of
the new metrics will result from a “snapshot” process, a series of recurring
captures of section data during various phases of the registration process
and the academic term. These snapshots allow for tracking of a number of
important metrics such as section cancellations and late additions to the
term schedules, as well as attrition from peak enrollment to census date
and beyond.
Additionally, existing integration of Ad Astra software with industry-leading
degree audit systems will be leveraged to track students’ progress to degree
completion through the lens of productive versus non-productive credits.
This “Velocity to Completion” metric will be the first leading indicator of
graduation rates in the industry. Because it tracks current students rather
than collecting data from recent graduates, this metric will be actionable.
Finally, as referenced in the 2015 HESI Report, Ad Astra’s new Simulated
Registration algorithm now allows tracking of important metrics regarding
students’ registration conflicts. These metrics will provide insight into the
critical question: “is completion delayed because students are not taking
the courses they are advised to take, or because they can’t get seats in
those courses at registration?”
Ad Astra is enthusiastic about researching and uncovering opportunities
for the industry to improve student and institutional success. Continued
development of new HESI findings will allow this report, and Ad Astra’s
services, to better address those opportunities.
Notes 1 Source: U.S. Department of Education, National Center for Education Statistics. (2015)

Ad Astra Information Systems | aais.com
THE HIGHER EDUCATION SCHEDULING INDEXJULY 2016 REPORT
17
WHO IS AD ASTRA INFORMATION SYSTEMS?
Ad Astra’s interest in academic space began in the 1950’s when the founder’s
father, John Shaver, was introduced to a Ford Foundation project at Stanford
University that cemented the firm’s future. Shaver decided to morph his
architectural firm from a general design practice to one specializing in
higher education facilities. He enthusiastically joined the project and helped
shape its contribution to the industry: a framework that quickly became and
remains the standard by which space utilization is assessed and facilities’
master plans are developed.
When Founder and CEO Tom Shaver launched Ad Astra in 1996,
it was known that space management was both critically important and
incredibly complex. Measuring space utilization wasn’t enough. First, and
most obvious, was that measurement didn’t improve utilization; it simply
confirmed the need to improve. Second, space was only part of the
equation. Scheduling must be embraced as a way to allocate not only
space, but also faculty; to deliver instruction, and to enable students to
graduate on time.
Ad Astra has collaborated with more than 1,000 higher education campuses
and many state systems that prioritize the stewardship of instructional
resources and improved student outcomes.
ADDENDUM
For more information about Ad Astra’s Higher Education Scheduling Index (HESI), and how strategic scheduling can make a difference, please contact: Sarah Collins, Chief Client Experience Officer at [email protected] or (913) 652-4120.
913.652.4120 [email protected]
SARAH COLLINSCONTACT