Embed Size (px)
Citation preview

Preliminary Report For the Department of Arts Heritage and the Gaeltacht
Environment Fund
THE HILL OF SLANE
ARCHAEOLOGICAL PROJECT (HoSAP)
EF/HER/2011/68
Preliminary Survey Report, 2012
Dr Conor Brady
Department of Humanities Dundalk Institute of Technology
Kevin Barton
Landscape and Geophysical Services
Matthew Seaver School of Archaeology
University College Dublin
May 2012
1.0 Introduction This report details the activities carried out by the Hill of Slane Archaeological Project since granting of funding under the Department of Arts Heritage and the Gaeltacht Environment Fund in September 2011. We had divided the hill onto four zones or sectors as a means for managing the survey (Figure 1). These were outlined in the initial application for funding. In this first phase of fieldwork under the Environment Fund, the focus of activity was in Areas 1 and 3. In Area 1, survey work concentrated on the small enclosure feature to the SE of the motte. In Area 3, survey work examined the area to the N of the College and Graveyard. Due to the soft and slippery ground conditions at the time of the Phase 1 fieldwork described here, for environmental impact and safety reasons, it was decided to avoid carrying out work on the motte as planned. Work was instead carried out in the area of the small enclosure to the SE of the motte. The work planned for the motte will take place in Phase 2 of the 2011-12 survey.
Figure 1: Outline plan of the Hill of Slane with survey zones indicated. 2.0 Methodology
A methodology was agreed with the geophysical contractor; Kevin Barton of Landscape & Geophysical Services and consents to use a detection device were applied for to carry out the geophysical surveys.

2.1 Establishment of Survey Control Points Once the general survey area had been defined on the ground, a Global Positioning System (GPS), operating in Differential mode (DGPS), was used to establish a series of control points around the overall site including the College, Graveyard and in the area of the motte to the west. These data were gathered in Irish National Grid (ING). The DGPS receiver was a Trimble R8 GNSS system which obtained real-time differential corrections from the Trimble VRS Now System. The positional accuracy of a single DGPS fix using this system is sub-decimetre and typically 0.03m to 0.05m. The control points, now established (Figure 2, Table 1), will be used for all future work on the site.
Figure 2: Survey control stations overlain on an orthophoto (orthophoto with permission of OSi)

Easting
(m) Northing
(m) Height
(m) Station number
296421.476 275203.686 134.664 4 296421.824 275160.324 132.501 5 296384.686 275196.044 136.764 6 296331.042 275174.580 142.029 7 296271.566 275191.274 144.522 8 296263.168 275176.523 145.792 10 296271.514 275135.762 144.603 12 296224.560 275149.338 147.745 13 296230.197 275179.761 146.916 15 296250.687 275177.527 145.494 16 296246.588 275183.666 145.013 17 296255.171 275181.676 145.501 18 296245.076 275166.979 145.782 19 296230.292 275135.835 147.551 20 296224.357 275128.514 147.572 23 296202.488 275099.693 147.797 24 296263.643 275118.225 144.685 25 296246.559 275144.789 147.061 26 296184.612 275130.528 149.618 29 296161.415 275171.209 150.445 30 296023.598 275138.828 154.587 31 296003.786 275102.076 153.594 33 296022.821 275079.214 151.028 34 296100.588 275074.046 152.144 35 296039.597 275112.915 159.329 37
Table 1: The Irish National Grid co-ordinates, height and station number for each control station shown in Figure 2. 3.0 Area 3: the College and graveyard area 3.1 Site Survey and Grid Layout The survey control points were used to establish accurate outline plans of the fences, upstanding buildings and graveyard wall on the site. They were used in turn to establish a series of 20m x 20m grids aligned with the ING for the geophysical surveys. These data were gathered using a Sokkia Set 500 total station with a Sokkia SDR33 datalogger. The locational accuracy of the total station was sub-centimetre. The process of setting up the total station on the control stations verified the overall positional accuracy of the survey within the ING and this was normally found to be in the range 0.03 to 0.05m.

3.2 Geophysical Survey Methodology 3.2.1 Reconnaissance Magnetic Susceptibility Survey Measurements of topsoil magnetic susceptibility were collected at 5m intervals along parallel transects set 5m apart on the survey grid. The survey instrument was a Bartington MS2 with an MS2D fieldloop. The depth of investigation is nominally 0.1m. The data were manually recorded and input to a text file using Notepad. The Notepad file was processed using xyzcoord software to georeference the data for final processing using the Surfer package. 3.2.2 Magnetic Gradiometry Survey In Area 1 magnetic gradiometry survey was carried out on 20m x 20m grids along traverse lines set 0.5m m apart with a sampling interval along each line of 0.125m using a Bartington Grad601-1 magnetic gradiometer. In Area 3 the traverse lines were set 1m apart with a 0.25m sampling interval. The magnetic gradiometry survey was carried out in zig-zag mode. A single balancing or calibration point was used for both Area 1 and Area 3 surveys. Data were downloaded and initially processed using the Geoscan Research Geoplot 3 software package. Final processing to make maps was carried out using the Surfer package. The Bartington Grad601-1 gradiometer has a single sensor array. The array consists of a pair of fluxgate sensors spaced 1m vertically apart. The depth of investigation, depending on sub-surface magnetic contrasts, is accepted as being up to 2m. Data were downloaded using Bartington software, imported into Geoplot 3 for initial processing with final processing being carried out using the Geosoft and Surfer packages. 3.2.3 Earth Resistance Survey Earth resistance survey was carried out on sub-sets of the grids used for the magnetic gradiometry survey. Surveys were carried out in zig-zag mode along lines 0.5m apart with a sampling interval of 0.5m using a 0.5m twin probe array with remote electrodes set a minimum distance of 15m away from the survey grid. The instrument used was a TRS/CIA resistance meter with associated twin-probe array. The depth of investigation using a 0.5m twin-probe array is generally about 0.5m. Data were downloaded from the instrument and initially processed using proprietary TRS/CIA software. Subsequent processing to make maps was carried out using the Geosoft and Surfer software packages. 3.3 Field survey and preliminary interpretation Phase 1 of two planned phases of fieldwork took place between Thursday 17th November and Friday 25th November. 3.3.1 Initial Site Survey An outline survey of the layout of the upstanding building, graveyard wall and field boundaries for survey areas 3 and 4 was carried out both to facilitate the layout of the geophysical survey grids and to incorporate previous building plans. Plans of the buildings had been made in the past by Westropp (1901), with new versions by Bradley (1986) and a further phase-plan of the construction of the church published by Manning (2008). However, these surveys were not recorded in Irish National Grid and thus were not suitable for direct incorporation into the present survey. The outline plans of the buildings, the graveyard wall and the field boundaries were used to
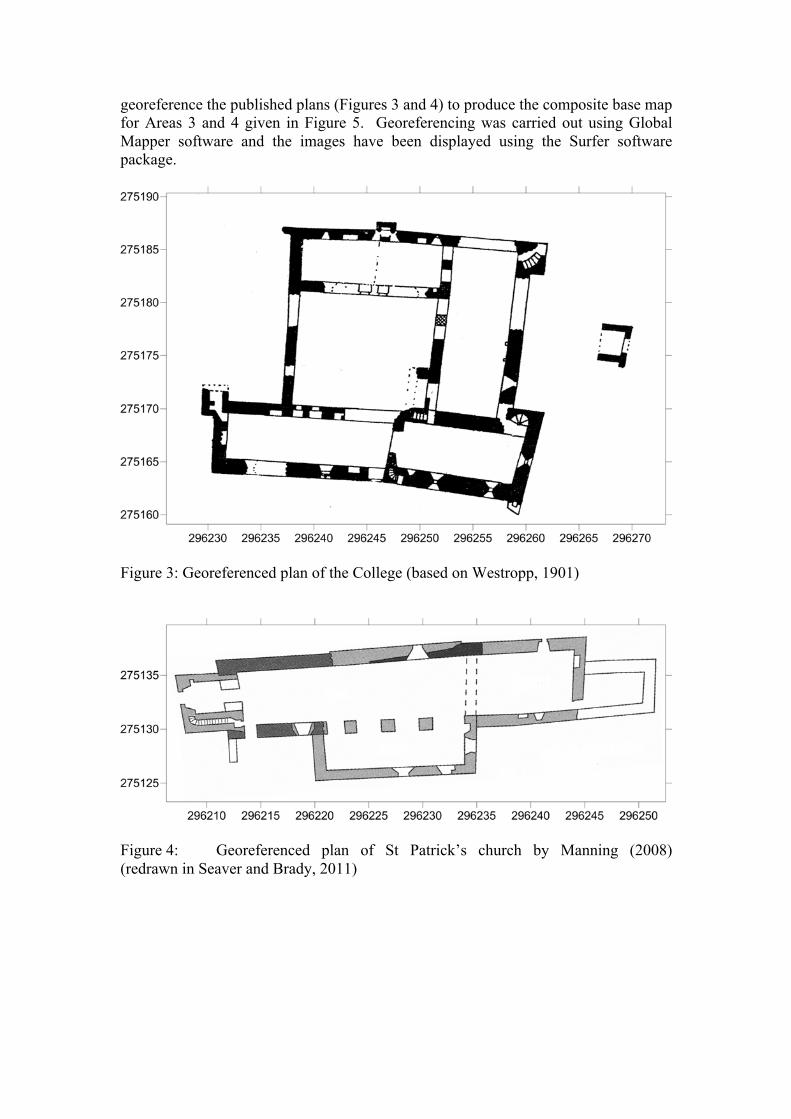
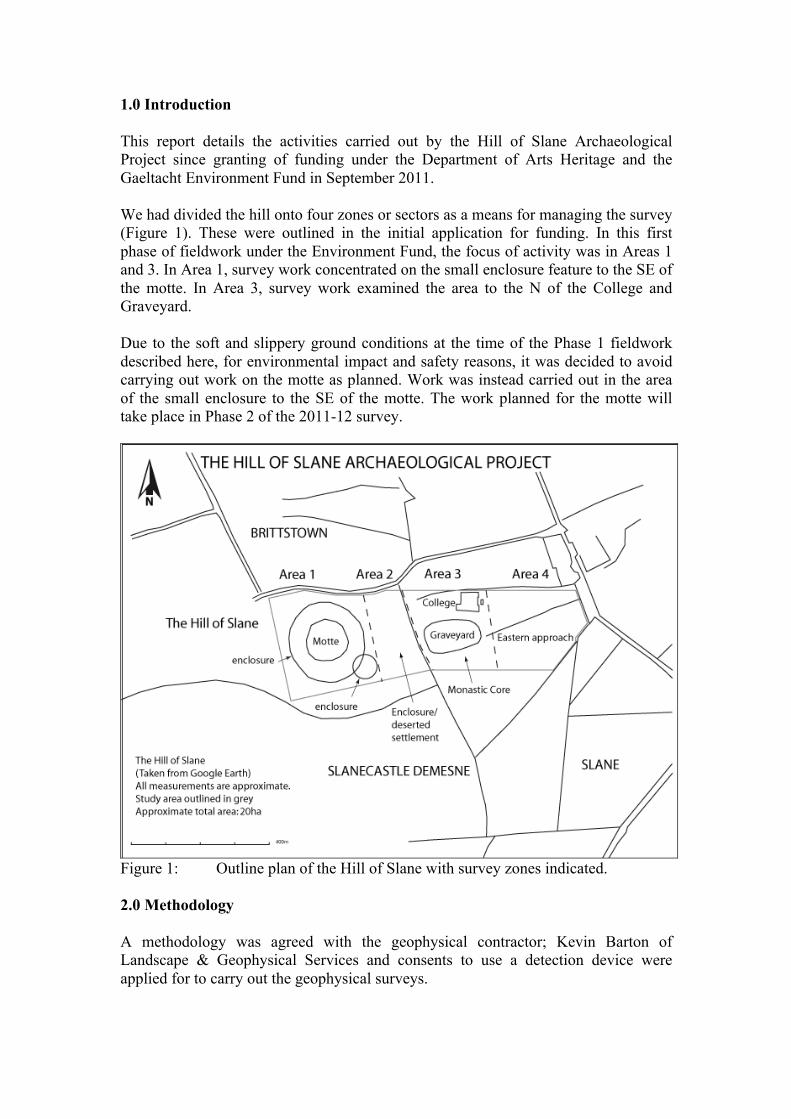
georeference the published plans (Figures 3 and 4) to produce the composite base map for Areas 3 and 4 given in Figure 5. Georeferencing was carried out using Global Mapper software and the images have been displayed using the Surfer software package.
Figure 3: Georeferenced plan of the College (based on Westropp, 1901)
Figure 4: Georeferenced plan of St Patrick’s church by Manning (2008) (redrawn in Seaver and Brady, 2011)

Figure 5: Composite georeferenced base map for Areas 3 and 4 3.3.2 Magnetic Susceptibility Survey The results from the survey and presented in two different ways, firstly as a proportional symbol plot (Figure 6) and secondly as a colour-coded interpolated grid (Figure 7). The symbol and colour-coded plots show a relatively uniform susceptibility enhancement across the survey area with values up to 30 SI units. This level of enhancement can be described as elevated and could be due to weakly magnetic soils derived from the volcanic bedrock known to outcrop in the area. The enhancement may in part be also due to settlement, industrial and domestic activity associated with the monument types on the top on the hill. There are a number of isolated ‘hot spots’ to the NW and SW of the survey area. Those to the NW lie on an area of rock outcrop. The ‘hot spot’ to the N and SE of the College may be due to debris or ferrous debris.
Figure 6: Magnetic susceptibility survey results displayed as proportional symbols

Figure 7: Magnetic susceptibility results displayed as a colour-coded interpolated grid 3.3.3 Magnetic Gradiometry Survey The overall high magnetic response in the survey area is also seen in the gradiometry image (Figure 8). The data are clipped to +/- 10nT to partially minimise the effect of sub-surface magnetic features. The main features seen are a series of small amorphous zones of positive gradient lying E-W near the northern margin of the map. These could be due to shallow magnetic bedrock and/or areas of burning. There is an area of intense magnetic response associated with the present entrance to the College. This response is due to the large iron bars forming a barrier to livestock entering the building. There is a similar area of intense activity to the E of the College associated with the floodlights and their security cages. At present the most interesting features are the positive gradient linears extending from the SW and SE corners of the College. These are likely to be due to ditches or cut features. The feature to the SE may relate to cabling to the floodlights, the narrower feature to the SW may be an old boundary.

Figure 8: Magnetic gradiometry survey results clipped to +/- 10 nT/m 3.3.4 Earth Resistance Survey The resistance data clipped between 30 – 100 Ohms is displayed in Figure 9.
Figure 9: Earth resistance results clipped between 30 – 100 Ohms There seems to be a double linear feature comprised of both higher and lower resistance elements trending westwards from the SW corner of the College, parallel to

the current 19th century graveyard wall. There is a possibility that the S wall of the College is built on top of the line of this feature as part of the linear is visible immediately to the south of this wall. There may be a return in the linear approximately at the College entrance where the linear veers towards the S. This linear feature could be an enclosure/boundary feature or alternatively a trackway. There is a general area of higher resistance in the central part of the W end of the panel. This area has no particularly clear form and may be related to bedrock close to the ground surface. There is some outcrop just outside the survey grid to the NW. This higher resistance can be tentatively correlated with an anomalous response in the gradiometry data from this area. 4.0 Area 1: the motte, its enclosures and the small enclosure The Ordnance Survey Ireland (OSi) LiDAR and orthophoto data has proved invaluable in preliminary mapping of the features in Area 1 which is heavily overgrown in places. Figure 10 provides an overview of the main archaeological features in Area 1.
Figure 10: A 3-D model derived from LiDAR data of the motte, its enclosing elements and small enclosure to the SE. View from the NE. (LiDAR data with permission of OSi)

4.1 Small enclosure A partial survey of this feature was carried out. Some parts of the feature were inaccessible at the time of survey due to dense vegetation. It is hoped to clear some of this vegetation, in consultation with the landowner, and complete the survey in this area.
Figure 11: Terrain model of the small enclosure viewed obliquely from the SW. (LiDAR data with permission of OSi). Figure 11 shows a terrain model of the area of the small enclosure/barrow and is based on OSi LiDAR data. This strongly suggests that the outer enclosing element of the motte – the curvilinear line on the left side of the image – overprints the small enclosure/barrow feature indicating that the barrow is the earlier of the two monuments. Note that the interrupted ‘boxy’ texture of the rendering along the S side of the feature is due to vegetation cover which partially obscured the ground during the initial LiDAR data-capture (Figure 12). The terrain model indicates that the feature is unlikely to be an enclosure, having a more platform-like profile with central area above surrounding ground level, although there are traces of a ‘lip’ or low bank along the S side of the feature. There is no sign of an enclosing ditch which would be expected with an enclosure.

Figure 12: orthophoto draped over LiDAR terrain model showing small enclosure/barrow feature (Orthophoto with permission of OSi). 4.2 Field survey and preliminary interpretation An original survey area over the small enclosure/barrow of 60m x 40m was based on the degree of vegetation coverage at its southern extent, its visible expression to the N and the practicality of surveying using the different geophysical techniques. During the course of the survey it became apparent that there were previously unknown features lying to the N and the survey area was extended 20m to the north giving a survey area of 60m x 60m. Magnetic surveys were carried out in this extended area.

4.2.1 Reconnaissance Magnetic Susceptibility Survey
Figure 13: Magnetic susceptibility (MS) data over area of small enclosure/barrow draped over LiDAR terrain model. (LiDAR data with permission of OSi) The susceptibility results within an extended 60m x 60m survey area are presented in Figure 13 as a colour-coded grid. The background response indicates a lower background enhancement relative to that found in Area 3 (Figure 7). There is an amorphous anomalous zone of enhancement within the curtilage of the small enclosure/barrow. This extends to the N from an area of high susceptibility. A further zone of enhancement appears to coincide with the eastern ‘edge’ of the ‘barrow’. A small isolated zone of enhancement is found at the western edge of the ‘barrow’ where it is intersected by the outer enclosing element of the motte. This area is close to a hollow in the ground surface and the enhanced susceptibility value here may be indicating a change in the material used to construct the small enclosure/barrow.

4.2.2 Magnetic Gradiometry Survey
Figure 14: Magnetic gradiometry data over area of small enclosure/barrow draped over LiDAR terrain model. (LiDAR data with permission of OSi) The gradiometry results from the extended 60m x 60m survey area are presented in Figure 14. There is a curvilinear anomaly of positive gradient coincident with the northern edge of the small enclosure/barrow indicating a ditch defining northern edge although there is no ditch evident on the ground or in the LiDAR data. This possible ditch is cut at the W by a weaker, curvilinear feature running in an approximate N – S direction. This weaker feature appears to lie outside the outer enclosing element of the motte. It is not possible at this stage to interpret the precise nature or function of this feature. There is a SW – NE zone or possible line of pits/cut features running from the central northern area of the ‘barrow’ across the ditch into the ground outside the barrow to the NE. There is a curvilinear feature of positive gradient in the NE corner of the survey area indicating an arcuate ditch outside the ‘barrow’. The trend of the gentle curvature of the ditch indicates that it may be associated with a presently unknown feature lying to the NE of the survey area.

4.2.3 Earth resistance survey
Figure 15: Electrical resistance plot of area of small enclosure/barrow draped over LiDAR terrain model. (LiDAR data with permission of OSi) Figure 15 shows the earth resistance plot from the original 60m x 40m survey area positioned over the small enclosure/barrow. This corresponds with the lower 60m x 40m of the MS and MG survey areas. The general area of the ‘barrow’ is composed of higher resistance with the exception of two areas of lower resistance. The lower resistance area to the W corresponds with the hollowed out area of the ground surface. A larger area of lower resistance in the central northern sector of the ‘barrow’ appears to have a circular form with a small area of higher resistance in the centre. This has the appearance of a second feature perhaps superimposed or cut into the ‘barrow’. There is a tentative correlation with anomalies in the MS and MG data which show anomalous responses in this area.

5.0 Outreach 5.1 Website The project website, http://hillofslane.wordpress.com, has been maintained during the period of the survey. A News/Blog section has been added for short entries on the conduct of the work of the project as they happen. A new Research section has been added with a drop-down menu allowing access to pages detailing particular phases of research activity. A new section will be added here shortly detailing the work reported on in this document. In terms of site statistics, there have been over 2,500 unique visits to the site since it was set up in November 2010. On the busiest day, 28th March 2012, there were 119 visits. There is a parallel Facebook page for the project and there are currently 75 ‘likes’ since the page was set up in December 2011. 5.2 Hill of Slane Heritage Guide No. 55 A guide to the Hill of Sane was published in December by Wordwell Ltd. as No. 55 in their Heritage Guide series and has been initially distributed with the winter 2011 issue of Archaeology Ireland magazine. Costs of publication were covered by Meath County Council Heritage Office as an action of the Meath Heritage Plan. A small grant to assist with production was also received from the ArchaeoLandscapes project. This is a 5-year project established to promote the use of archaeological remote sensing technologies across Europe. Currently fifty-seven partner institutions from 26 countries are working together to build up a self-supporting network facilitating the mutual exchange of ideas and teaching activities to advance techniques in landscape archaeology such as aerial archaeology, satellite imagery, geophysics and airborne laser scanning (LiDAR) (see www.arcland.eu for more information). The launch of the Archaeology Ireland Hill of Slane Heritage Guide (no. 55) took place in Slane Castle on 26th March in Slane Castle with the assistance of Meath County Council Heritage Office. The guide was launched by the Cathaiorleach of Meath County Council, Eoin Holmes and attendance was around 150. Copies were distributed to attendees on the night and are being distributed free of charge in the Slane area and are available from the Slane Community Forum office, The Hub, in Slane Village. 5.3 The Hill of Slane International Field School The Hill of Slane International Field School held on the Hill of Slane with the support of the ArchaeoLandscapes Europe project. Eighteen students from 11 different countries around the world participated. A wide range of activities was carried out over the course of the week including surface collection, low-level aerial photography, upstanding building recording and a range of archaeological geophysical techniques. Participants were given an understanding of the principles of and hands-on experience of the basic field operation of the techniques. Each evening there was instruction given in data processing, data interpretation and reporting.

We received significant support from a number of institutions in running the field school. Personnel from Discovery Programme also participated in the field school – they brought terrestrial laser-scanning equipment and provided demonstrations and tuition. A group from the University of Warsaw came with a specially designed kite and balloon for low-level aerial photography. The Irish Archaeology Field School gave us logistical support for the field school. The ArchaeoLandscapes Europe Project provided grant assistance for a number of the participants to travel to Ireland to take part in the field school. An open day was held on Thursday 12th April where members of the local community were invited to come along and observe the various surveys in progress. This was well attended and over the course of the day, over 50 visitors came to the site. Copies of the Hill of Slane Heritage Guide were distributed to visitors. The field school received coverage from RTE News and an item was carried on both the 6 o’clock and 9 o’clock news on Friday 13th April. (See http://www.rte.ie/news/av/2012/0413/media-3256784.html#&search=Hill%20of%20Slane). We acknowledge the permission of the local landowners Mr Ciaran Baxter and Mr Leo Nulty who farms his land and Lord Conyngham and Gerry McGuinness to access their lands for our activities and also to the Office of Public Works who own the publicly accessible part of the hill. 5.4 Conferences and Talks As part of our commitment to community engagement and dissemination of the findings of the HoSAP project to the wider public, we have taken part in a number of events. A list is provided below. Conor Brady, Matthew Seaver & Kevin Barton. ‘The Hill of Slane Archaeological Project’. Institute of Archaeologists of Ireland Autumn Conference 2011 ‘Heritage tourism and community initiatives: The value of communicating archaeology’ Gresham-Metropole Hotel, Cork City Friday 4th and Saturday 5th November 2011. Conor Brady, Matthew Seaver & Kevin Barton. Presentation Dundalk Institute of Technology Humanities and Social Sciences Research Centre. 18th November 2011. Matthew Seaver, Conor Brady & Kevin Barton. ‘The mound, the saint and the hill: first findings from the Hill of Slane Archaeological Project’. UCD School of Archaeology Research Day. 15th December 2011. Conor Brady. ‘The Hill of Slane Archaeological Project’. Presentation at Slane Local Heroes event. Slane Community Forum.17th January 2012. Matthew Seaver, Conor Brady & Kevin Barton. ‘The mound, the saint and the hill: first findings from the Hill of Slane Archaeological Project’. Lecture to Slane Historical Society. March 2012. Matthew Seaver. ‘The mound, the hill and the saint: the Hill of Slane Archaeological Project’. Rathcroghan Archaeological Conference. 15th April 2012.

6.0 Phase 2 Field survey The second phase of fieldwork under the 2011-12 funding cycle is planned for May-June 2012. At this time the following activities will be carried out:
1. Where possible carry out fill-in topographic survey of the motte where LiDAR coverage was not possible due to dense vegetation (Area 1).
2. Carry out detailed ERT transects on the summit and around the base of the motte (Area 1)
3. Complete survey of small enclosure/barrow feature subject to clearance of vegetation (Area 1).
4. Carry out detailed targeted follow-up geophysical survey using magnetic gradiometry and earth resistance in the vicinity of the College and Graveyard (Area 3).
5. Based on results from the Phase 1 surveys, carry out ERT transects, as appropriate, in the vicinity of the College and Graveyard (Area 3).
6. Outreach will be an integral part of Steps 1, 2 and 5 and will also include media communications, website, and lectures.
7. Final report for Season early-mid July 2012.