Embed Size (px)
Citation preview

Astronomy & Astrophysics manuscript no. main ©ESO 2021July 15, 2021
The IBISCO survey
I. Multiphase discs and winds in the Seyfert galaxy Markarian 509
M.V. Zanchettin1, 2, 3, C. Feruglio3, 4, M. Bischetti3, A. Malizia5, M. Molina5, A. Bongiorno6, M. Dadina5, C.Gruppioni5, E. Piconcelli6, F. Tombesi7, 6, 8, 9, A. Travascio3, and F. Fiore3, 4
1 SISSA, Via Bonomea 265, I-34136 Trieste, Italy e-mail: [email protected] Dipartimento di Fisica, Sezione di Astronomia, Universita degli Studi di Trieste, Via Tiepolo 11, I-34143 Trieste, Italy3 INAF Osservatorio Astronomico di Trieste, via G.B. Tiepolo 11, 34143 Trieste, Italy4 IFPU - Institute for fundamental physics of the Universe, Via Beirut 2, 34014 Trieste, Italy5 INAF-OAS Bologna, via Gobetti 101, I-40129 Bologna, Italy6 INAF - Osservatorio Astronomico di Roma, Via di Frascati 33, 00040, Monteporzio Catone, Rome, Italy7 Dept. of Physics, University of Rome ‘Tor Vergata’, via della Ricerca Scientifica 1, 00133, Rome, Italy8 Dept. of Astronomy, University of Maryland, College Park, MD, 20742, USA9 NASA - Goddard Space Flight Center, Code 662, Greenbelt, MD 20771, USA
Received 2020 October 27 ; accepted 2021 July 13
ABSTRACT
We present the analysis of the ALMA CO(2-1) emission line and the underlying 1.2 mm continuum of Mrk509 with spatial resolutionof ∼270 pc. This local Seyfert 1.5 galaxy, optically classified as a spheroid, is known to host a ionised disc, a starburst ring, andionised gas winds on both nuclear (Ultra Fast Outflows) and galactic scales. From CO(2-1) we estimate a molecular gas reservoir ofMH2 = 1.7×10⁹ M�, located within a disc of size ∼5.2 kpc, with Mdyn = (2.0±1.1) × 1010 M� inclined at 44±10 deg. The molecular gasfraction within the disc is µgas = 5%, consistent with that of local star-forming galaxies with similar stellar mass. The gas kinematicsin the nuclear region within r∼700 pc, that is only marginally resolved at the current angular resolution, suggests the presence ofa warped nuclear disc. Both the presence of a molecular disc with ongoing star-formation in a starburst ring, and the signatures ofa minor merger, are in agreement with the scenario where galaxy mergers produce gas destabilization, feeding both star-formationand AGN activity. The spatially-resolved Toomre Q-parameter across the molecular disc is in the range Qgas = 0.5 − 10, and showsthat the disc is marginally unstable across the starburst ring, and stable against fragmentation at nucleus and in a lopsided ring-likestructure located inside of the starburst ring. We find complex molecular gas kinematics and significant kinematics perturbations at twolocations, one within 300 pc from the nucleus, and one 1.4 kpc away close to the region with high Qgas, that we interpret as molecularwinds with velocity v98 = 200 − 250 km/s. The total molecular outflow rate is in the range 6.4 - 17.0 M�/yr, for the optically thinand thick cases, respectively. The molecular wind total kinetic energy is consistent with a multiphase momentum-conserving winddriven by the AGN with Po f /Prad in the range 0.06-0.5 . The spatial overlap of the inner molecular wind with the ionised wind, andtheir similar velocity suggest a cooling sequence within a multiphase wind driven by the AGN. The second outer molecular windcomponent overlaps with the starburst ring, and its energy is consistent with a SN-driven wind arising from the starburst ring.
Key words. galaxies: active - galaxies: ISM - galaxies: kinematics and dynamics - galaxies: Seyfert - techniques: interferometric
1. Introduction
Understanding the relation between the Feedback from accretingsuper-massive black holes (SMBHs) and the interstellar medium(ISM) of their host galaxies is still an open issue. Host bulgeproperties such as velocity dispersion, luminosity and mass aretightly correlated with the mass of the SMBHs in the galacticcenter as shown by past seminal works (Gebhardt et al. 2000;Ferrarese & Ford 2005; Kormendy & Ho 2013; Shankar et al.2016, 2017). The gas in the galactic bulge inflows toward thenucleus and gives rise to the growth of central SMBH throughthe active luminous phase of the Active Galactic Nuclei (AGN)(Fabian 2012; King & Pounds 2015). During their active phases,AGN can generate winds that interact with galaxy ISM, poten-tially altering both the star formation process and the nucleargas accretion. When the black hole reaches a critical mass theAGN driven winds, the nuclear activity and the SMBH growthare stopped giving rise to the SMBH - host bulge properties re-
lations (Silk & Rees 1998; Fabian 1999; King 2003).Outflows are ubiquitous in both luminous AGN and in localSeyfert galaxies, and occur on a wide range of physical scales,from highly-ionised semi-relativistic winds and jets in the nu-clear region at sub-parsecs scales, out to galactic scale out-flows seen in mildly ionised, molecular and neutral gas (Mor-ganti et al. 2016; Fiore et al. 2017; Fluetsch et al. 2019; Lutzet al. 2020; Veilleux et al. 2020, and references therein). In somecases molecular and ionised winds have similar velocities andare nearly co-spatial, suggesting a cooling sequence scenariowhere molecular gas forms from the cooling of the gas in theionised wind (Richings & Faucher-Giguere 2017; Menci et al.2019). Other AGNs show ionised winds that are faster than themolecular ones, suggesting a different origin of the two phases(Veilleux et al. 2020, and references therein). The molecularphase is a crucial element of the feeding and feedback cycleof AGN because it constitutes the bulk of the total gas massand it is the site of star formation activity. On galactic scales,
Article number, page 1 of 13
arX
iv:2
107.
0675
6v1
[as
tro-
ph.G
A]
14
Jul 2
021

A&A proofs: manuscript no. main
massive molecular winds are common in local Seyfert galaxies(e.g. Feruglio et al. 2010; Cicone et al. 2014; Dasyra et al. 2014;Morganti et al. 2015; García-Burillo et al. 2014, 2017, 2019),these winds likely suppress star formation (i.e. negative feed-back) as they reduce the molecular gas reservoir by heating orexpelling gas from the host-galaxy ISM. In late type AGN-hostgalaxies, the gas kinematics appears complex at all scales, show-ing several components such as bars, rings, and (warped) discs,with high velocity dispersion regions (e.g. Shimizu et al. 2019;Feruglio et al. 2020; Fernández-Ontiveros et al. 2020; Alonso-Herrero et al. 2020; Aalto et al. 2020; Audibert et al. 2020).Accurate dynamical modeling of the molecular gas kinematicsreveals kinematically-decoupled nuclear structures, high veloc-ity dispersion at nuclei, trailing spirals, evidences of inflowsand AGN-driven outflows. (e.g. Combes et al. 2019a; Combes2019b, 2020). The outflows driving mechanism (wind shock, ra-diation pressure or jet), their multiphase nature and their rela-tive weights and impact on the galaxy ISM are still open prob-lems (Faucher-Giguère & Quataert 2012; Zubovas & King 2012;Richings & Faucher-Giguere 2017; Menci et al. 2019; Ishibashiet al. 2021). So far different outflow phases have been observedonly for a handful of sources. Atomic, cold and warm molec-ular outflows have been observed in radio galaxies (e.g. Mor-ganti et al. 2007; Dasyra & Combes 2012; Dasyra et al. 2014;Tadhunter et al. 2014; Oosterloo et al. 2017). The nuclear semi-relativistic phase and the galaxy scale molecular phase havebeen observed simultaneously in less than a dozen sources, withvaried results: in some cases data suggest energy driven flows(Feruglio et al. 2015; Tombesi et al. 2015; Longinotti et al.2018; Smith et al. 2019), in other cases data suggest momen-tum driven flows (e.g. García-Burillo et al. 2014; Feruglio et al.2017; Fluetsch et al. 2019; Bischetti et al. 2019; Marasco et al.2020). Fiore et al. (2017), using a compilation of local and highredshift winds, showed that there is a broad distribution of themomentum boost, suggesting that both energy and momentum-conserving expansion may occur. Enlarging the sample of localAGN-host galaxies with outflows detected in different gas phasesis important to understand the nature and driving mechanisms ofgalaxy-scale outflows.In this paper we present a study of Markarian 509 (Mrk 509)based on ALMA observations. Mrk 509 is a Seyfert 1.5 galaxylocated at D ∼ 142.9 Mpc (z = 0.034397, Huchra et al. 1993) im-plying a physical scale of 0.689 kpc/arcsec, and hosts an AGNwith L2−10keV = 1044.16 erg s−1 (Shinozaki et al. 2006), a bolo-metric luminosity of LBol = 1044.99 erg s−1 (Duras et al. 2020),and a black hole with mass Mbh = 108.04 M� (Bentz et al. 2009).The AGN is hosted by a medium size galaxy resembling a bulgein optical imaging (Ho & Kim 2014), but hosting both an ion-ized gas disc and a starburst ring (Phillips et al. 1983; Kriss et al.2011; Fischer et al. 2015), where star formation is currently on-going (S FR ∼ 5M�/yr, Gruppioni et al. 2016).Mrk 509 is a complex system showing evidence of both an ongo-ing minor merger and multiphase gas winds. The minor mergerwith a gas-rich dwarf is suggested by an ionised gas linear tail(Fischer et al. 2013, 2015), whereas Liu et al. (2015) found ev-idence of a [OIII] quasi-spherical wind powered by the AGNin the inner ∼ 2 kpc region, with velocity 290 km/s and massoutflow rate Mo f = 5 M�/yr. The ionised wind appears spa-tially anti-correlated with the Hβ emission, suggesting suppres-sion of star formation in this region. Gas kinematics suggeststhat the ionised wind is physically unrelated to the linear tail,and their apparent overlap is due to projection effects only (Liuet al. 2015). On nuclear scales, highly ionised semi-relativisticgas winds are detected with velocity v∼ 0.15-0.2c and outflow
rates in the range 0.005-0.05 M�/yr (Dadina et al. 2005; Cappiet al. 2009; Tombesi et al. 2011, 2012; Detmers et al. 2011). Si-multaneous Chandra and Hubble Space Telescope with the Cos-mic Origins Spectrograph (HST-COS) observations showed thatthe wind detected through UV absorption lines is located within∼ 200 pc from the active nucleus, and that X-ray warm absorbersand UV absorbers are related (Ebrero et al. 2011; Kriss et al.2019). Given the widespread evidence of winds from nuclear tokpc scales and in different gas phases (Phillips et al. 1983; Krisset al. 2011; Tombesi et al. 2011, 2012; Liu et al. 2015), Mrk 509is an optimal candidate to investigate the wind driving mecha-nisms, stellar feedback versus AGN feedback, and their impacton the host-galaxy ISM. In this paper, we exploit ALMA data ofMrk509 to trace the distribution and kinematics of cold molecu-lar gas and to look for evidences of molecular winds. The CO(2-1) and underlying continuum observations examined here arepart of the ALMA survey of the IBISCO sample. The IBISCOsample is drawn from the INTEGRAL (International Gamma-Ray Astrophysics Laboratory) IBIS (Imager on Board INTE-GRAL Spacecraft) catalog of hard X-ray (20-100 keV) selectedAGN (Malizia et al. 2012). The IBISCO sample is selected tohave z<0.05, AGN bolometric luminosity LBol > 1043 erg s−1,and accurate black hole mass measurements. Being hard X-rayselected, the IBISCO sample is unbiased against nuclear obscu-ration, similarly to BASS, the BAT AGN Spectroscopic Survey(Koss et al. 2017, 2020). The ALMA survey of IBISCO is aimedat obtaining a reliable overview of the cold gas kinematics in thecentral ∼ kpc of the AGN host galaxies with angular resolutionsin the range 100-200 pc.The paper is organized as follows. Section 2 presents the ALMAobservational setup and data reduction. Section 3 presents theobservational results, in particular the continuum emission, thegas properties and the CO kinematics. Section 4 describes thedynamical modeling, section 5 the properties of the molecularwind. In Section 6 we discuss our results and in section 7 weshow our conclusions and future perspectives.
2. Observations and data reduction
Mrk 509 was observed with ALMA (program ID2017.1.01439.S) during cycle 5 on September 2018 for atotal integration time of 75 minutes in the frequency range221.8-223.7 GHz (band 6), which covers the CO(2-1) line (ob-served redshifted frequency of 222.9 GHz) and the underlying1.2 mm continuum. The obervations were conducted with the 12m array in the C43-5 configuration with 44 antennas, minimumbaseline of 14.6 m and maximum baseline of 1397.9 m. Thisprovided us an angular resolution of about 0.4 arcsec and alargest angular scale of ∼ 4.6 arcsec.We used CASA 5.4.1 software (McMullin et al. 2007) toproduce a set of calibrated visibilities and to generate cleandata-cubes. We calibrated the visibilities in the pipeline modeand using the default calibrators provided by the observatory:bandpass and flux calibrators J2148+0657 and J2000-1748,J2025-0735 phase/amplitude calibrator. The absolute fluxaccuracy is better than 10%. To estimate the rest-frame 1.2 mmcontinuum emission we averaged the visibilities in the fourspectral windows, excluding the spectral range covered by theCO(2-1) emission line. To estimate the continuum emissionunderlying the CO(2-1) line, we modeled the visibilities inthe spectral window (spw) containing the emission line withthe uvcontsub task, adopting a first order polynomial. Weverified that using a zero order polynomial did not affect theresults. We subtracted the continuum from the global visibilities
Article number, page 2 of 13

M.V. Zanchettin et al.: The IBISCO survey
Fig. 1. Left panel: 1.2 mm continuum map of Mrk509. Regions with emission below 5σ have been blanked. The synthesized beam (0.396× 0.343arcsec2) is shown by the grey filled ellipse. Central panel: CO(2-1) integrated flux map, where a mask with threshold of 3σhas been applied. Black contours show the 1.2 mm continuum emission at (5,30,100)×σ. The synthesized beam is reported bottomleft corner. Right panel: CO(2-1) spectrum (black crosses) extracted from the continuum-subtracted clean data-cube from the regionswhere emission is above 3σ. The solid red shows the multi-gaussian fit, the three gaussian components are shown using magentalines.
Table 1. Parameters of the Gaussian fit of the CO(2-1) line.
FWHM [km/s] IPeak [mJy] Velocity [km/s](1) (2) (3)
21.60 ± 0.03 59.4 ±0.1 -187.71 ± 0.03116.82 ± 0.08 89.5 ± 0.3 -23.56 ± 0.0537.63 ± 0.02 96.2 ± 0.1 175.39 ±0.02
Notes. Parameters of the three Gaussian components plotted in Fig. 1(1) the FWHM, (2) the intensity at the peak in mJy, (3) the velocity atthe peak w.r.t the rest frame. Errors are given at 1σ.
and created the continuum-subtracted CO(2-1) visibility table.We imaged CO(2-1) and continuum using the tclean task byadopting a natural weighting scheme, and produced a cleancube by using the hogbom cleaning algorithm with a detectionthreshold of 3 times the r.m.s. noise, a pixel size of 0.05 arcsecand a spectral resolution of 10.6 km/s. With this procedure weobtained a clean map of the continuum with a synthesized beamof 0.396 × 0.343 arcsec2 at PA = 51 deg, which correspondsto a spatial resolution of ∼ 285 × 244 pc2. The resulting r.m.s.noise in the clean continuum map is 0.014 mJy/beam in theaggregated bandwidth. From the continuum-subtracted CO(2-1)visibilities we produced a clean data-cube with a beam size of0.412 × 0.353 arcsec2 at a PA = 48 deg and a r.m.s. noise of0.38 mJy/beam for a channel width of 10.6 km/s.
3. Results
Figure 1, left panel, shows the 1.2 mm continuum map. The peakposition of the continuum flux density map, obtained through 2Dfitting in the image plane with CASA, is consistent with the AGNposition reported by NED (NASA/IPAC Extragalactic Database,https://ned.ipac.caltech.edu). We measure a continuum flux den-sity S 1.2mm = 2.17 ± 0.04 mJy, and a flux at the peak positionS peak = 2.09 ± 0.02 mJy/beam. According to our 2D fit the con-tinuum emission is consistent with an unresolved source.Figure 1, central panel, shows that the CO(2-1) surface bright-ness (moment 0 map) is distributed over a region of approxi-mately 8 arcsec, that is 5.5 kpc, and, in the inner ∼1.4 kpc re-gion, shows an elongated shape along the north-west to south-east direction, crossing the AGN position. A CO-depleted re-gion, that is a region with a CO(2-1) surface brightness lower
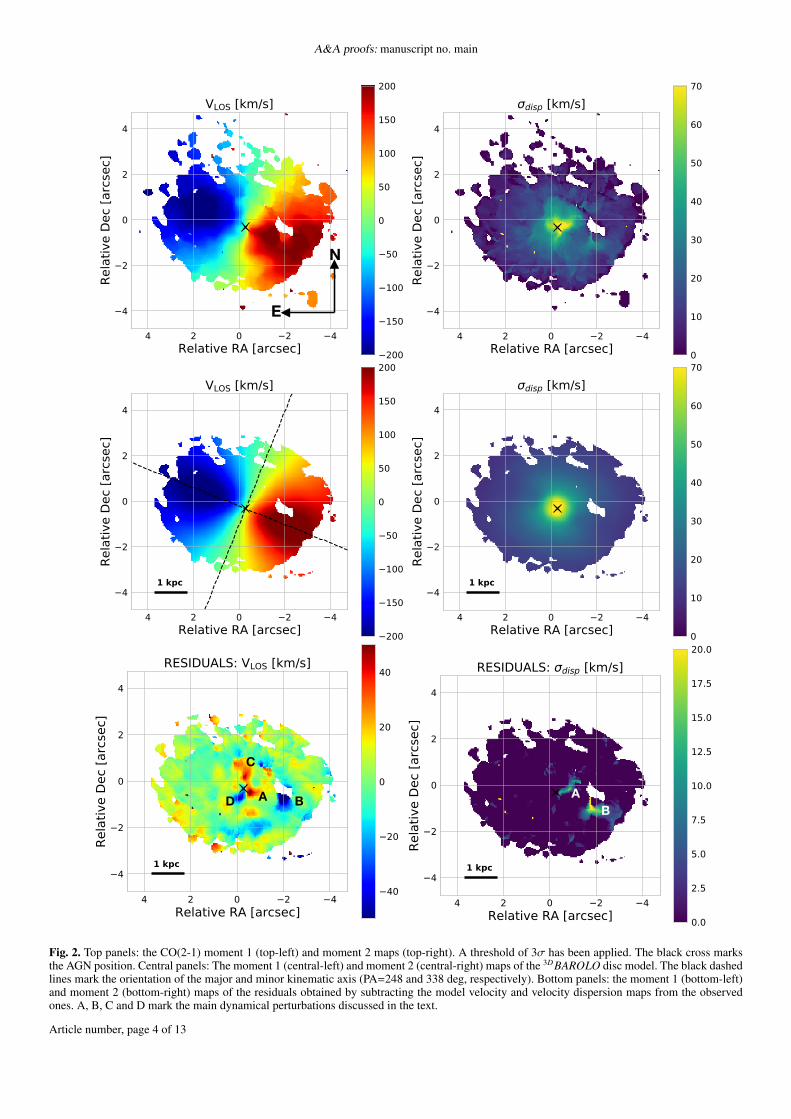
than neighbouring regions, is detected located at 1.4 kpc west-ward to the AGN. The CO(2-1) spectrum (Fig. 1, right panel),extracted from the clean data-cube in the region defined by amask with 3σ threshold, shows a multiple peak profile remi-niscent of disc-like kinematics. We fitted the emission line witha combination of three Gaussian profiles whose parameters arereported in the Table 1. From the best-fit we measured an in-tegrated flux density of S CO = 36.7 ± 0.8 Jy km/s over a linewidth of 180 km/s. We then derived the CO(2-1) luminosityL′CO(2−1) = (5.0 ± 0.1) × 108 K km/s pc2 using the relation ofSolomon & Vanden Bout (2005). To estimate the proper conver-sion factor αCO, we use the stellar mass M∗ and the conversionfunction by Accurso et al. (2017). The M∗ is derived from broad-band spectral energy distribution (SED) decomposition includ-ing the emission of stars, dust heated by SF and AGN dusty torus(Gruppioni et al. 2016). We report in Appendix A details on theSED fitting. We derive a total stellar mass of M∗ = 1.2×10¹¹ M�,and a αCO = 3.3 M�(K km/s pc2)−1. Using this, we derive amolecular gas mass MH2 = (1.65 ± 0.04) × 109 M� within aregion of ∼ 5.2 kpc diameter. For the CO-depleted region we de-rived a 3σ upper limit molecular gas mass MH2 < 0.35 × 10⁷M�assuming the same conversion factor.The mean-velocity map (moment 1 map, Fig. 2 top-left panel)shows a gradient oriented north-east to south-west along a posi-tion angle (PA) of ∼ 250 deg, with range from -200 to 200 km/s,which likely indicates an inclined rotating disc (PA in degrees ismeasured anti-clockwise from North). Figure 2 (top-right panel)shows the CO(2-1) velocity dispersion (moment 2 map), σdisp,with values of 10-20 km/s in the outer regions. In the inner 1.4 ×1.4 kpc2 (corresponding to 2×2 arcsec2), σdisp has a butterfly-shaped morphology with a σdisp = 80 km/s towards the cen-tral beam, where beam-smearing effects can boost the σdisp (e.gDavies et al. 2011). A more reliable estimate of the real σdisp inthe nuclear region is 50-60 km/s, as measured in an annulus with0.3 < R < 0.6 arcsec. We detect a region with enhanced σdisp =30-40 km/s located south of the CO-depleted region, suggestingthat also at this location dynamic perturbations are likely present.
4. Molecular Discs
Based on the moment maps we build a dynamical model of thesystem using 3DBAROLO ("3D-Based Analysis of Rotating Ob-
Article number, page 3 of 13
A&A proofs: manuscript no. main
N
E
A ABBD
C
Fig. 2. Top panels: the CO(2-1) moment 1 (top-left) and moment 2 maps (top-right). A threshold of 3σ has been applied. The black cross marksthe AGN position. Central panels: The moment 1 (central-left) and moment 2 (central-right) maps of the 3DBAROLO disc model. The black dashedlines mark the orientation of the major and minor kinematic axis (PA=248 and 338 deg, respectively). Bottom panels: the moment 1 (bottom-left)and moment 2 (bottom-right) maps of the residuals obtained by subtracting the model velocity and velocity dispersion maps from the observedones. A, B, C and D mark the main dynamical perturbations discussed in the text.
Article number, page 4 of 13

M.V. Zanchettin et al.: The IBISCO survey
0 1 2Radius (kpc)
0
100
200
300
v rot
(km
/s)
0 1 2Radius (kpc)
0.0
0.5
1.0
1.5
2.0
2.5
Mdyn (
1010
M)
0 1 2 3Radius (arcsec)
0 1 2 3Radius (arcsec)
Fig. 3. Left panel: rotational velocity vrot versus radius of the bestfit disc model of the main disc. Right panel: dynamical mass ver-sus radius within the inner ∼2.5 kpc radius, derived from the relationMdyn = rv2
rot/2G.
jects from Line Observations”, Di Teodoro & Fraternali 2015).Any deviation from a rotating disc kinematics can then be iden-tified by comparing the disc dynamical model with the observeddata, through the residual data-cube, that is obtained by subtract-ing the model from the observed data-cube. We fitted a 3D tilted-ring model to the emission line data-cube to provide a first orderdynamical model of the CO-emitting gaseous disc. In the firstrun, we allowed four parameters to vary: rotation velocity, veloc-ity dispersion, the disc inclination and position angle. We fixedthe kinematic center to the 1.2 mm continuum position (Sec. 3).We then run the model again fixing the inclination, so only PA,rotation velocity and velocity dispersion are allowed to vary. Theinclination from the minor/major axis ratio from UV imaging(GALEX archive) is 44 ± 10 deg, and we fix it to 44 deg in themodel. The first run produces residuals of amplitude about 5%in the moment 0 map, that further increase by adding a radialvelocity component. The second run, with fixed inclination, pro-duces residuals of amplitude about 2%, therefore we adopt thelatter as best-fit disc model. The disc model has a position anglePA = 248 ± 5 deg, a vLOS that ranges from -200 to 200 km/s anda velocity dispersion that decreases from 70 km/s in the innerregion to ∼10 km/s in the outer part of the disc (Fig. 2, cen-tral panels). Fig.3 shows the rotation velocity (left panel), of thebest fit disc model, and the virial dynamical mass (right panel)Mdyn = rv2
rot/2G as a function of the radius out to ∼ 2.5 kpc.The rotation velocity shows a maximum value of ∼ 300 km/sand the dynamical mass enclosed within the maximum radius is∼ 2.1 × 10¹⁰M�.We computed the residual velocity and velocity dispersion mapsby subtracting the disc model from the data (Fig. 2, bottompanels). Residual maps indicate that the model nicely describesthe observed large-scale velocity gradient, from r∼1 arcsec tothe outer boundary. Dynamical perturbations are detected in theresidual velocity map (Fig. 2, bottom left panel) at positionsA, C (redshifted), and B, D (blueshifted). In the velocity dis-persion residual map (Fig. 2, bottom right panel), residuals arepresent only at positions A and B. The position-velocity (PV)plots shown in Fig. 4 capture the main kinematics componentsseen in the moment maps and in the residual maps (Fig.2). Theslices are taken through the continuum peak position, using a slit0.45 arcsec wide (i.e. approximately the FWHM size of the syn-thetic beam major axis). The PV diagram along the kinematicmajor axis (PA=248 deg) shows kinematic perturbations at off-set 0.5 arcsec with VLOS ∼ 250 km/s (A), and at offset 2 arcsecwith VLOS ∼ 150 km/s (B), on top of the typical disc rotationpattern. The PV diagram along the kinematic mainor axis (PA =
338 deg) shows both blue-shifted and red-shifted non-rotationalmotions with velocities that reach 300 km/s and −200 km/s inthe inner ± 0.5 arcsec region (C,D). The perturbations C and Dsuggest the presence of a warped disc or bar. The nuclear regionis barely resolved at the current angular resolution. Here we at-tempt to model it with a nuclear disc, as detailed in Appendix B.The modeling with a disc of inclination fixed to 66 deg and PAfixed to 330 deg, i.e. along the two brightest emission regionsin the residual intensity map (C and D, black contours in Fig. 5left panel), is able to account for and nicely model the residualemission (Fig. 5, right panel, and Fig. 6, top panel), suggestingthe presence of a nuclear warped disc. We note that observationswith higher angular resolution would be required to better assessthe kinematic properties in this region. The modeling of the nu-clear region does not impact the analysis of the molecular windpresented in the next Section.
5. Molecular Wind
Regions A and B show residuals both in the velocity and in thevelocity dispersion maps. Fig. 6, top panel, shows the intensitymap of the residuals. The spectra extracted from A and B areshown in Fig. 6, bottom panels. The gas in region A has a peakvelocity of 220 km/s, and a red tail reaching 300 km/s, whereasthe gas in B is characterized by a peak velocity of about 170km/s. We note that the disc rotational velocity at A and B is 70and 210 km/s (dashed lines), respectively, thus showing that gasin these regions is not participating to the disc rotation, but it canbe rather associated to a wind. The wind mass outflow rate iscomputed using the relation from Fiore et al. (2017), assuming aspherical sector:
Mo f = 3Mo f vo f
Ro f(1)
where vo f = v98 is the wind velocity, the velocity enclosing98% of the cumulative velocity distribution of the outflowinggas (Bischetti et al. 2019), Mo f is the wind molecular mass, andRo f is distance from the active nucleus reached by the wind. Ta-ble 2 gives v98, Mo f and Ro f for regions A and B. Because wedo not know a-priori whether the gas in the wind is opticallythin or thick, we derived the molecular mass range in A andB adopting a conversion factor αCO = 0.3 M�(K km/s pc2)−1
for the optically thin (Morganti et al. 2015; Dasyra et al. 2016),and αCO = 0.8 M�(K km/s pc2)−1 (Bolatto et al. 2013; Morgantiet al. 2015) for the optically thick case. These assumptions im-ply wind masses in the ranges MH2 = (2.1 − 5.6) × 106M� andMH2 = (2.0 − 5.4) × 106M�, thus a molecular outflow rate in therange Mo f = 5.5 − 14.7 M�/yr and Mo f = 0.86 − 2.30 M�/yrfor region A and B respectively. The lowest boundaries are per-tinent to optically thin gas and thus represent lower limits to themolecular mass and outflow rate. These estimates are derived as-suming AGN-driven winds because Ro f is the distance from theAGN. Should
We evaluated the escape velocity at A and B using the rela-tion
vesc =
√GMdyn
Ro f(2)
where we used the dynamical mass derived from the best fit discmodel (Fig. 3, right panel). We find that vesc ∼ 140 km/s at A,that is significantly smaller than the wind velocity, suggestingthat the outflowing gas can leave the innermost 300 pc region.
Article number, page 5 of 13

A&A proofs: manuscript no. main
Fig. 4. Left panel: PV plot along PA = 248 deg ( i.e. the kinematic major axis). Right panel: PV plot along PA = 338 deg (i.e. the kinematic minoraxis). The slit width is set to 0.45 arcsec (i.e. approximately the FWHM size of the synthetic beam major axis). The white contours refer to data,contours are drawn at (1,2,4,8,16,32)×σ, black dots mark the VLOS value from 3DBAROLO model.
AD
C
Fig. 5. Left panel: The velocity map generated from the residual cube obtained subtracting the disc model from the data-cube (a mask with a 2σthreshold on the residual intensity map has been applied). The black contours show the CO(2-1) emission in residual intensity map at (3, 4, 5, 6,7)×σ. The black dashed lines represent the slice adopted for the PV diagram (right panel) and comprise the two main kinematic perturbations inthe residual intensity map, along PA = 330 deg. The black cross marks the AGN position. Right panel: PV diagram along PA = 330 deg (kinematicmajor axis). Red contours and yellow points represent the disc model of this inner region, blue contours represent the data (contours are drawn at(2,4,6)×σ). A, C and D mark the main dynamical perturbations.
The escape velocity at B is ∼ 227 km/s, similar to wind B veloc-ity. Computing the time needed for the gas to travel from the cen-ter to the wind position and assuming a constant velocity equalto v98, we obtain 1.16 Myr to reach A, and 6.85 Myr to reach B.Therefore these two outflowing gas components might representtwo consecutive episodes of winds launched at different times, orthe same event with a decelerating wind (e.g. Fischer et al. 2013;Veilleux et al. 2020). Current data cannot discriminate betweenthese two scenarios.
6. Discussion
Mrk509 is classified as a spheroid based on optical imaging (Ho& Kim 2014), and it hosts a ionised gas ring and disc, where starformation is currently active (Kriss et al. 2011; Fischer et al.2015). With its SFR of 5.1 ± 0.5 M�/yr and the stellar massof M∗ = (1.2 ± 0.1) × 1011 M� (Gruppioni et al. 2016, Ap-pendix A), it sits on the Main Sequence of star-forming galax-
ies. Our observations show that Mrk509 hosts a molecular gasreservoir of MH2 = (1.7 ± 0.1)×109 M� within 5.2 kpc. Thestellar mass within the same region has been derived by scal-ing the total stellar mass assuming an exponential profile andthe size of the galaxy in K band (33 kpc, NED). It turns outM∗(R < 2.6kpc) ∼ 3 × 10¹⁰M�. The molecular gas fractionµ = MH2/M∗, in the inner ∼ 5.2 kpc, is then µ ∼ 5%, con-sistent with that derived for local star-forming galaxies with thesame stellar mass (e.g. Saintonge et al. 2011, 2017). We findthat the CO(2-1) moment 1 map shows a velocity gradient con-sistent with a inclined rotating disc with inclination consistentwith that derived from UV imaging of the host galaxy. The de-rived dynamical mass is Mdyn = (2.0 ± 1.1) × 1010 M� withina ∼2.6 kpc radius. The uncertainty is dominated by the uncer-tainty on the inclination. The dynamical mass is thus consistentwith the M∗(R < 2.6kpc). Our dynamical modeling also sug-gests a possible warp in the disc towards the center, as reportedby Combes (2020) in other nearby Seyfert galaxies. This nuclear
Article number, page 6 of 13

M.V. Zanchettin et al.: The IBISCO survey
Table 2. Parameters of the molecular wind components.
Region v98 Rof S CO MH2 Mo f Ekin Po f /Prad vesc[km/s] [kpc] [Jy km/s] [106 M�] [M�/yr] [1040 erg/s] [km/s]
(1) (2) (3) (4) (5) (6) (7) (8)A 250 0.3 0.51±0.05 2.1-5.6 5.5-14.7 11-30 0.5 ± 0.2 140B 200 1.4 0.49±0.05 2.0-5.4 0.86-2.30 1.1-2.9 0.06 ± 0.03 227
Notes.(1) wind velocity v98, (2) projected wind radius in kpc, (3) integrated CO(2-1) flux density in Jy km/s , (4) the molecular gas mass in unitsof 106 M�, (5) mass outflow rate in M�/yr, (6) kinetic power of the wind in erg/s, (7) wind momentum load, and (8) escape velocity in km/s, atregion A and B.
Fig. 6. Top panel: the CO(2-1) residual intensity map after the best-fitdisc model has been subtracted from the data-cube. The red and bluecircles indicate Regions A and B respectively. The black contours showthe emission at (2, 3, 4, 5)×σ. Bottom panels: spectra extracted fromregion A (red histogram) and B (blue histogram). The dashed black linesindicate the value of the disc rotational velocity at A and B based on ourbest-fit dynamical model( vdisc = 75 km/s around region A, and vdisc =210 km/s around region B).
region, however, remains marginally resolved in current obser-vations, and we cannot exclude more complex structures, suchas bars or rings.The molecular disc kinematics and inclination are consistentwith those reported for the ionised gas phase by Fischer et al.(2015) and Liu et al. (2015), who mapped the ionised disc onscales of up to 4 kpc, see Fig. 6 in Liu et al. (2015). We compareour CO(2-1) moment 0 map with the HST image in FQ508N
filter, which traces ionised gas emitting in the [OIII]λ5007Å, toinvestigate the relation between cold molecular and ionised gasdistributions. Figure 7 left panel shows that the molecular gas(red contours) is detected at the position of the starburst ring.The [OIII] image shows a linear tail extending out from the star-burst ring toward north-west. The "jut" of tail that seems to bendtowards the nucleus is also visible. These two structures havebeen interpreted as due to a minor merger with a gas-rich dwarfgalaxy (Fischer et al. 2015). In our ALMA data we do not de-tect CO-emitting gas at the position and velocity of the lineartail. The 3σ upper limit on the H2 mass in the tail is < 107
M�, based on the r.m.s. of our observation, adopting a MilkyWay conversion factor and FWHM = 50 km/s for the CO line(see Aalto et al. 2001). The limit appears consistent with a mi-nor merger scenario (Knierman et al. 2013; van de Voort et al.2018). Both the tidal feature and the presence of a moleculardisc with an ongoing starburst are in agreement with the scenariowhere galaxy interactions and mergers produce gas destabiliza-tion, and feed both star-formation and AGN activity (e.g. Menciet al. 2014, and refs therein) . Assuming that most SFR occurswithin the starburst ring, we derive a star-formation efficiencyS FE = S FR/MH2 = 6.2 × 10⁻⁹yr−1, consistent with that foundfor local early-type galaxies with recent minor mergers (Sain-tonge et al. 2012; Davis et al. 2015).We quantify the disc stability against gravitational fragmenta-tion, by deriving a map of the Toomre Q-parameter (Toomre1964) for the cold molecular gas component, Qgas. The Toomreparameter is related to the local gas velocity dispersion σdisp,the circular velocity vrot, and the gas surface density Σgas at anygiven radius R, through the relation
Qgas =avrotσdisp
πRGΣgas, (3)
where a is a constant that varies from 1 (for a Keplerian ro-tation curve), 1.4 (for a flat rotation curve), to 2 (for a solid-body rotation curve), see Genzel et al. (2011, 2014) and refstherein. To obtain a map of Qgas we use vrot, derived through the3DBAROLO model of the whole disc, using the assumed incli-nation and best fit PA. We adopt a=1 up to R=1.1 arcsec, wherethe rotation curve is steep, and a=1.4 at larger radii. The ve-locity dispersion and Σgas are calculated pixel by pixel from themoment 2 and 0 maps, respectively; the radius R is deprojected.The map of Qgas is shown in Fig. 7 right panel, while in Table3 we report σdisp, Σgas, and Qgas in 5 annulii between R=0.3and 0.8 arcsec, 0.8 and 1.4 arcsec, 1.4 and 2.2 arcsec (that in-cludes a ring-like feature of enhanced σdisp visible in Fig. 2),R > 2.2 arcsec, and in the whole disc excluding the central re-gion of 0.3 arcsec radius, to avoid the beam-smearing effect. Wefind values that range from Qgas ≈ 0.5 up to 10 and we note thatQgas exceeds 1 across most of the molecular disc. A similar Qgasrange was reported by e.g. García-Burillo et al. (2003); Sani et al.
Article number, page 7 of 13

A&A proofs: manuscript no. main
Fig. 7. Right panel: HST image in the FQ508N filter, probing rest-frame [OIII]λ5007Å emission (greyscale). Red contours represent CO(2-1)emission (Figure 1 center panel, contours are drawn at (1, 2, 3, 4, 5, 7, 10, 15, 20, 25, 30, 37)×σ). Blue contours represent CO(2-1) emission inRegion A and B (Figure 6 top panel, contours are drawn at (3, 4, 5)×σ). Image from the Mikulski Archive for Space Telescopes (MAST), HSTProposal 12212. Right panel: the Toomre Q-parameter map for the cold molecular gas component. The black contours represent the moment 0 COemission at (2, 5, 15, 30, 45)×σ. The white cross marks the continuum peak position. The white dashed ellipses mark projected annuli with radiusR = 0.3, 0.8, 1.4, 2.2 arcsec, respectively (see Table 3).
Table 3. Average Qgas and velocity dispersion in 4 annulii.
Annulus σdisp Σgas Qgas[km/s] [M�/pc2]
(1) (2) (3) (4)0.3 < R < 0.8 46.1 475 5.00.8 < R < 1.4 28.4 318 3.51.4 < R < 2.2 18.3 118 4.8
R > 2.2 7.6 42 2.4R > 0.3 12.6 94 3.0
Notes.(1) Annulus region with deprojected radius R in arcsec, (2)average velocity dispersion, (3) average gas mass surface density inM�/pc2 (4) average Toomre parameter.
(2012) in nearby Seyfert galaxies, and Hitschfeld et al. (2009) inM51. Where the value of the Q-parameter is higher than the crit-ical value Qcrit the disc is unstable against gravitational collapse.The commonly adopted critical value of Qgas is in the range 1-3(Genzel et al. 2014; Leroy et al. 2008), whereas if one considersthe total Q−1
tot = Q−1gas + Q−1
star, including both the gas and stellarcontribution, the critical value is ∼ 1 (Aumer et al. 2010). TheQgas we find in Mrk 509 implies that the disc is unstable in itsouter regions, across the starburst ring, whereas is stable againstfragmentation at nucleus and in a lopsided ring-like structure lo-cated at R ∼ 2 arcsec from the AGN.We find significant kinematic perturbations at different locationsacross the disc, where the molecular gas shows deviations fromthe disc rotation pattern. The first (Region A) is located at a dis-tance of ∼300 pc from the nucleus, the second (Region B) furtherout at a distance of about 1.4 kpc. In the proximity of Region Bwe detect a CO-depleted region (Fig. 6). This is close (in pro-
jection) to the location where the linear tail related to the mergerevent observed with HST crosses the disc. The CO-depleted re-gion may be related to the merger event locally decreasing theCO in the disc, however the optical image does not show anylack of ionised gas there. In Section 5, we showed that bothA and B regions show non-circular gas motions, that are likelydue to outflowing gas. Regarding Region A, integral field spec-troscopy (IFS) spectroscopy shows a [OIII] wind with velocitysimilar (Liu et al. 2015) to the molecular one, supporting the no-tion that this region hosts a multiphase wind. The ionised andmolecular winds are co-spatial, within the accuracy allowed bythe angular resolution of the data, suggesting a cooling sequence(Richings & Faucher-Giguere 2017; Menci et al. 2019). RegionB has a small projected distance from the tidal tail seen in [OIII].The ionised gas velocity in the tidal tail is −100 km/s, accordingto Liu et al. (2015), while it is 200 km/s for the molecular gas inB, and 250 km/s in A. Therefore it is unlikely that the moleculargas in A and B is related to the tidal tail.It is likely that molecular gas in A and B is involved in an AGN-driven wind, whose total molecular outflow rate is in the range6.4 - 17.0 M�/yr, for the optically thin and thick cases respec-tively. The contribution of Region B to the global outflow bud-get is a factor of ∼10 smaller than Region A, therefore includingor excluding region B, does not change the main result of thework. We computed the wind momentum load, that is the ratiobetween the outflow momentum flux, Po f = Mo f · v98, and theradiative momentum flux, Prad = Lbol/c. We adopt a bolometricluminosity LBol = 1044.99 erg s−1 derived by Duras et al. (2020)from SED fitting and consistent with that derived by Gruppi-oni et al. (2016). The wind momentum load values obtained arereported in Fig. 8 for the different wind components: the threeUltra-fast Ouflow (UFO) components from Tombesi et al. (2010,
Article number, page 8 of 13

M.V. Zanchettin et al.: The IBISCO survey
Fig. 8. The wind momentum load, Po f /Prad, as a function of the windvelocity for Mrk 509 (Tombesi et al. 2011, 2012; Liu et al. 2015,and this work), and a compilation of local AGN (PDS456: (Nardiniet al. 2015; Bischetti et al. 2019), Mrk231 (Feruglio et al. 2015),IRASF11119+3257 (Tombesi et al. 2015). Red symbols are UFOs; thegreen star symbol is the ionised [OIII] wind for Mrk509; blue sym-bols are molecular winds, and magenta star symbol is the total wind(ionised plus molecular phases) for Mrk509. The black dashed linemarks the expectation for momentum conserving wind driven by theAGN in Mrk 509. The red shaded area represents the prediction for anenergy-conserving wind with Pmol/Prad = vUFO/v.
2011, 2012), the ionised gas winds from Liu et al. (2015), andthe molecular winds from this work. The molecular wind A andthe ionised gas wind show similar velocity and arise from ap-proximately the same region, and also show similar mass out-flow rates, suggesting that they might be part of a multiphasewind. The molecular wind A and the ionised wind are consis-tent with a momentum conserving driving (black dashed line),and are well below the expectation for energy conserving winds.Wind B has a much lower mass outflow rate. From current datawe cannot discriminate if A and B components of the molecu-lar wind are due to consecutive episodes or to the same event.Assuming that both the molecular components and the ionisedwind detected by Liu et al. (2015) are part of the same multi-phase wind, we derive a total mass outflow rate, molecular plusionised, of ∼ 22 M�/yr. For comparison, the accretion rate ontothe SMBH is Macc = LBol/εc2 ∼ 0.176 M�/yr, assuming an ef-ficiency ε = 10%. The total wind momentum load, POF/Prad ∼
1.4 ± 0.6 (magenta point) is below the energy conserving windexpectation, and compatible with a momentum conserving windpowered by the nuclear semi-relativistic wind probed by theUFOs. These momentum boost can also be attained by radiationpressure on dust (Ishibashi et al. 2021). The wind mass-loadingfactor is η = Mo f /S FR = 4.4, in agreement with what found formolecular winds in other Seyfert galaxies (e.g. Fiore et al. 2017).In the following we discuss the possibility that the outflows aredriven by energy injected by supernova (SN) explosion occur-ring in the starburst ring. To derive the mass outflow rate at Bin this case, we adopt a radius R = 0.4 kpc, that is half the pro-
Fig. 9. The wind mass outflow rate versus AGN bolometric luminosityfor Mrk509 and a compilation of AGN from (Fiore et al. 2017). For Mrk509 we plot the Mo f of the total molecular wind (this work, light bluecircle), the ionised wind (Liu et al. 2015, green circle), and the UFO(Tombesi et al. 2010, 2011, 2012, red circle). The size of the circlesrepresents the uncertainty in Mo f . Small blue symbols: molecular gaswinds. Small green symbols: ionised gas winds. Small red symbols:highly ionised gas winds detected in X-rays. The dashed blue, greenand red lines are the best fit correlations of the molecular, ionised andX-ray absorbers samples, respectively. Adapted from Fiore et al. (2017).
jected size of the starburst ring. This implies M = 3 − 8 M�/yrby adopting equation 1, and P = 0.4 − 1.0 × 1041erg/s. Assum-ing that the total SFR (5 M�/yr) is homogeneously distributedacross the ring, we consider a portion of the starburst ring equalto 1 tenth of the ring in area, and we estimate a kinetic powerof a SN-driven wind Ekin,S N = 3.5 × 1041 erg/s, assuming a SNrate of 0.02(SFR/M�/yr) (e.g. Veilleux et al. 2005). Outflow B isthen energetically consistent with a SN-driven wind originatingfrom the starburst ring (Venturi et al. 2018; Leaman et al. 2019).Regarding wind A, the SFR at its location cannot be resolved incurrent data, but it is most likely a small fraction of the total SFRwhich occurs mainly in the starburst ring. Therefore outflow Ais most likely driven by the AGN.Figure 9 shows the outflow rate, Mo f , versus the AGN bolomet-ric luminosity for Mrk 509 and a compilation of AGN adaptedfrom Fiore et al. (2017). Mrk 509 shows a ionised wind and X-ray winds that are broadly consistent with the correlations foundby Fiore et al. (2017), whereas its molecular outflow rate is sig-nificantly below the best-fit correlation of molecular winds. In-deed, the ionised outflow rate is similar to the molecular one, un-like the average AGN with similar Lbol. We note, however, thatthe correlation is derived from a biased sample which collectmainly high luminosity objects and known massive winds, andtherefore is probably biased towards positive detection, boostingthe outflow rates. This highlights the importance of performingstatistical studies on unbiased AGN samples to derive meaning-ful scaling relations. This study will be carried out by using thewhole IBISCO sample in a separate publication.
Article number, page 9 of 13

A&A proofs: manuscript no. main
7. Conclusions
We presented an analysis of the CO(2-1) line and 1.2 mm con-tinuum of Mrk509, a Seyfert 1.5 galaxy drawn from the IBISCOsample of hard-X-ray selected local AGN. Mrk509 is opticallyclassified as a spheroid and hosts ionised winds in different gasphases, from warm ionised gas wind traced by [OIII], to highlyionised UFOs seen in X-rays. We report the following findings:
1. The galaxy hosts a molecular gas reservoir of MH2 = (1.7 ±0.1),×109 M� within the inner 5.2 kpc, and partially over-lapping with the starburst ring seen in HST optical imaging.In this region we estimate a molecular gas fraction µ ∼ 5%,consistent with that of local star-forming galaxies with thesame stellar mass (e.g. Saintonge et al. 2011, 2017). Both thesignatures of a minor merger and the presence of a molec-ular disc with an ongoing starburst are in agreement withthe scenario where galaxy interactions and mergers producegas destabilization, and feed both star-formation and AGNactivity. The star formation efficiency across the moleculardisc and starburst ring, S FE = 6.2 × 10⁻⁹yr−1, is consistentwith that found for local early-type galaxies with recent mi-nor mergers.
2. We quantify the disc stability by estimating the spatially-resolved Toomre Q-parameter for the cold molecular gascomponent, Qgas. We find that Qgas varies across the molecu-lar disc in the range ∼ 0.5−10. The disk is unstable across thestarburst ring, and stable against fragmentation at nucleus, ina lopsided ring-like structure located at R ∼ 2 arcsec fromthe AGN, and at the location of the molecular winds.
3. The main velocity gradient detected in CO(2-1) is well mod-eled by a disc with Mdyn = (2.0±1.1) × 1010 M� within ∼ 5.2kpc and inclination 44 ± 10 deg with respect to the line ofsight. The CO kinematics in the nuclear region, r∼ 700 pc, isbarely resolved at the current angular resolution and may beaffected by a warped nuclear disc. Higher angular resolutionobservations may help to better constrain the gas distributionand kinematics in the nuclear region.
4. We find significant perturbations of the molecular gas kine-matics at two different locations in the disc, where the molec-ular gas shows deviations from the disc rotation, that we in-terpret as molecular winds. The wind A has a velocity ofv98 = 250 km/s and is located at a distance of ∼300 pc fromthe AGN, in the same region where a ionised gas wind is de-tected. The wind B is found at a distance of about 1.4 kpc,overlapping on the line of sight with the starburst ring, andat a small projected distance from the tidal tail. Its velocityv98 = 200 km/s suggests that B is not related to the tidal tail.The total molecular outflow rate for A and B is in the range6.4 − 17.0 M�/yr, for the optically thin and thick cases re-spectively, with outflow B constituting only a small fractionof the total outflow rate (about 10 %). The wind kinetic en-ergy is consistent with a momentum-conserving wind drivenby the AGN. The spatial overlap of the ionised and molecu-lar winds in A, and their similar velocity, suggest a coolingsequence within a multi-phase AGN-driven wind. Whereasoutflow B is consistent with a SN-driven wind originating inthe starburst ring.
Acknowledgements. We thank the referee for his/her careful reading and insight-ful suggestions that helped improving the paper. This paper makes use of theALMA data from project: ADS/JAO.ALMA#2017.1.01439.S. ALMA is a part-nership of ESO (representing its member states), NSF (USA) and NINS (Japan),together with NRC (Canada), MOST and ASIAA (Taiwan), and KASI (Republicof Korea), in cooperation with the Republic of Chile. The Joint ALMA Observa-tory is operated by ESO, AUI/NRAO and NAOJ. The National Radio Astronomy
Observatory is a facility of the National Science Foundation operated under co-operative agreement by Associated Universities, Inc. We acknowledge financialsupport from PRIN MIUR contract 2017PH3WAT, and PRIN MAIN STREAMINAF "Black hole winds and the baryon cycle".
ReferencesAalto, S., Falstad, N., Muller, S., et al. 2020, A&A, 640, A104Aalto, S., Hüttemeister, S., & Polatidis, A. G. 2001, A&A, 372, L29Accurso, G., Saintonge, A., Catinella, B., et al. 2017, MNRAS, 470, 4750Alonso-Herrero, A., Pereira-Santaella, M., Rigopoulou, D., et al. 2020, A&A,
639, A43Audibert, A., Combes, F., García-Burillo, S., & Dasyra, K. 2020, arXiv e-prints,
arXiv:2010.01974Aumer, M., Burkert, A., Johansson, P. H., & Genzel, R. 2010, ApJ, 719, 1230Bentz, M. C., Peterson, B. M., Netzer, H., Pogge, R. W., & Vestergaard, M. 2009,
ApJ, 697, 160Bischetti, M., Piconcelli, E., Feruglio, C., et al. 2019, A&A, 628, A118Bolatto, A. D., Wolfire, M., & Leroy, A. K. 2013, ARA&A, 51, 207Bruzual, G. & Charlot, S. 2003, MNRAS, 344, 1000Cappi, M., Tombesi, F., Bianchi, S., et al. 2009, A&A, 504, 401Cicone, C., Maiolino, R., Sturm, E., et al. 2014, A&A, 562, A21Combes, F. 2019b, arXiv e-prints, arXiv:1911.00707Combes, F. 2020, arXiv e-prints, arXiv:2003.13280Combes, F., García-Burillo, S., Audibert, A., et al. 2019a, A&A, 623, A79da Cunha, E., Charlot, S., & Elbaz, D. 2008, MNRAS, 388, 1595Dadina, M., Cappi, M., Malaguti, G., Ponti, G., & de Rosa, A. 2005, A&A, 442,
461Dasyra, K. M. & Combes, F. 2012, A&A, 541, L7Dasyra, K. M., Combes, F., Novak, G. S., et al. 2014, A&A, 565, A46Dasyra, K. M., Combes, F., Oosterloo, T., et al. 2016, A&A, 595, L7Davies, R., Förster Schreiber, N. M., Cresci, G., et al. 2011, ApJ, 741, 69Davis, T. A., Rowlands, K., Allison, J. R., et al. 2015, MNRAS, 449, 3503Detmers, R. G., Kaastra, J. S., Steenbrugge, K. C., et al. 2011, A&A, 534, A38Di Teodoro, E. M. & Fraternali, F. 2015, MNRAS, 451, 3021Duras, F., Bongiorno, A., Ricci, F., et al. 2020, A&A, 636, A73Ebrero, J., Kriss, G. A., Kaastra, J. S., et al. 2011, A&A, 534, A40Fabian, A. C. 1999, MNRAS, 308, L39Fabian, A. C. 2012, ARA&A, 50, 455Faucher-Giguère, C.-A. & Quataert, E. 2012, MNRAS, 425, 605Feltre, A., Hatziminaoglou, E., Fritz, J., & Franceschini, A. 2012, MNRAS, 426,
120Fernández-Ontiveros, J. A., Dasyra, K. M., Hatziminaoglou, E., et al. 2020,
A&A, 633, A127Ferrarese, L. & Ford, H. 2005, Space Sci. Rev., 116, 523Feruglio, C., Fabbiano, G., Bischetti, M., et al. 2020, ApJ, 890, 29Feruglio, C., Ferrara, A., Bischetti, M., et al. 2017, A&A, 608, A30Feruglio, C., Fiore, F., Carniani, S., et al. 2015, A&A, 583, A99Feruglio, C., Maiolino, R., Piconcelli, E., et al. 2010, A&A, 518, L155Fiore, F., Feruglio, C., Shankar, F., et al. 2017, A&A, 601, A143Fischer, T. C., Crenshaw, D. M., Kraemer, S. B., & Schmitt, H. R. 2013, ApJS,
209, 1Fischer, T. C., Crenshaw, D. M., Kraemer, S. B., et al. 2015, ApJ, 799, 234Fluetsch, A., Maiolino, R., Carniani, S., et al. 2019, MNRAS, 483, 4586Fritz, J., Franceschini, A., & Hatziminaoglou, E. 2006, MNRAS, 366, 767García-Burillo, S., Combes, F., Hunt, L. K., et al. 2003, A&A, 407, 485García-Burillo, S., Combes, F., Ramos Almeida, C., et al. 2019, A&A, 632, A61García-Burillo, S., Combes, F., Usero, A., et al. 2014, A&A, 567, A125García-Burillo, S., Viti, S., Combes, F., et al. 2017, A&A, 608, A56Gebhardt, K., Bender, R., Bower, G., et al. 2000, ApJ, 539, L13Genzel, R., Förster Schreiber, N. M., Lang, P., et al. 2014, ApJ, 785, 75Genzel, R., Newman, S., Jones, T., et al. 2011, ApJ, 733, 101Gruppioni, C., Berta, S., Spinoglio, L., et al. 2016, MNRAS, 458, 4297Hitschfeld, M., Kramer, C., Schuster, K. F., Garcia-Burillo, S., & Stutzki, J.
2009, A&A, 495, 795Ho, L. C. & Kim, M. 2014, ApJ, 789, 17Huchra, J., Latham, D. W., da Costa, L. N., Pellegrini, P. S., & Willmer, C. N. A.
1993, AJ, 105, 1637Ishibashi, W., Fabian, A. C., & Arakawa, N. 2021, arXiv e-prints,
arXiv:2101.11645King, A. 2003, ApJ, 596, L27King, A. & Pounds, K. 2015, ARA&A, 53, 115Knierman, K. A., Scowen, P., Veach, T., et al. 2013, ApJ, 774, 125Kormendy, J. & Ho, L. C. 2013, ARA&A, 51, 511Koss, M., Trakhtenbrot, B., Ricci, C., et al. 2017, ApJ, 850, 74Koss, M. J., Strittmatter, B., Lamperti, I., et al. 2020, arXiv e-prints,
arXiv:2010.15849Kriss, G. A., Arav, N., Edmonds, D., et al. 2019, A&A, 623, A82
Article number, page 10 of 13

M.V. Zanchettin et al.: The IBISCO survey
Kriss, G. A., Arav, N., Kaastra, J. S., et al. 2011, A&A, 534, A41Leaman, R., Fragkoudi, F., Querejeta, M., et al. 2019, MNRAS, 488, 3904Leroy, A. K., Walter, F., Brinks, E., et al. 2008, AJ, 136, 2782Liu, G., Arav, N., & Rupke, D. S. N. 2015, ApJS, 221, 9Longinotti, A. L., Vega, O., Krongold, Y., et al. 2018, ApJ, 867, L11Lutz, D., Sturm, E., Janssen, A., et al. 2020, A&A, 633, A134Malizia, A., Bassani, L., Bazzano, A., et al. 2012, MNRAS, 426, 1750Marasco, A., Cresci, G., Nardini, E., et al. 2020, A&A, 644, A15McMullin, J. P., Waters, B., Schiebel, D., Young, W., & Golap, K. 2007, in As-
tronomical Society of the Pacific Conference Series, Vol. 376, AstronomicalData Analysis Software and Systems XVI, ed. R. A. Shaw, F. Hill, & D. J.Bell, 127
Menci, N., Fiore, F., Feruglio, C., et al. 2019, ApJ, 877, 74Menci, N., Gatti, M., Fiore, F., & Lamastra, A. 2014, A&A, 569, A37Morganti, R., Holt, J., Saripalli, L., Oosterloo, T. A., & Tadhunter, C. N. 2007,
A&A, 476, 735Morganti, R., Oosterloo, T., Oonk, J. B. R., Frieswijk, W., & Tadhunter, C. 2015,
A&A, 580, A1Morganti, R., Veilleux, S., Oosterloo, T., Teng, S. H., & Rupke, D. 2016, A&A,
593, A30Nardini, E., Reeves, J. N., Gofford, J., et al. 2015, Science, 347, 860Oosterloo, T., Raymond Oonk, J. B., Morganti, R., et al. 2017, A&A, 608, A38Phillips, M. M., Baldwin, J. A., Atwood, B., & Carswell, R. F. 1983, ApJ, 274,
558Richings, A. J. & Faucher-Giguere, C.-A. 2017, in The Galaxy Ecosystem. Flow
of Baryons through Galaxies, 3Saintonge, A., Catinella, B., Tacconi, L. J., et al. 2017, ApJS, 233, 22Saintonge, A., Kauffmann, G., Kramer, C., et al. 2011, MNRAS, 415, 32Saintonge, A., Tacconi, L. J., Fabello, S., et al. 2012, ApJ, 758, 73Sani, E., Davies, R. I., Sternberg, A., et al. 2012, MNRAS, 424, 1963Shankar, F., Bernardi, M., & Sheth, R. K. 2017, MNRAS, 466, 4029Shankar, F., Bernardi, M., Sheth, R. K., et al. 2016, MNRAS, 460, 3119Shimizu, T. T., Davies, R. I., Lutz, D., et al. 2019, MNRAS, 490, 5860Shinozaki, K., Miyaji, T., Ishisaki, Y., Ueda, Y., & Ogasaka, Y. 2006, AJ, 131,
2843Silk, J. & Rees, M. J. 1998, A&A, 331, L1Smith, R. N., Tombesi, F., Veilleux, S., Lohfink, A. M., & Luminari, A. 2019,
ApJ, 887, 69Solomon, P. M. & Vanden Bout, P. A. 2005, ARA&A, 43, 677Tadhunter, C., Morganti, R., Rose, M., Oonk, J. B. R., & Oosterloo, T. 2014,
Nature, 511, 440Tombesi, F., Cappi, M., Reeves, J. N., & Braito, V. 2012, MNRAS, 422, L1Tombesi, F., Cappi, M., Reeves, J. N., et al. 2011, ApJ, 742, 44Tombesi, F., Cappi, M., Reeves, J. N., et al. 2010, A&A, 521, A57Tombesi, F., Meléndez, M., Veilleux, S., et al. 2015, Nature, 519, 436Toomre, A. 1964, ApJ, 139, 1217van de Voort, F., Davis, T. A., Matsushita, S., et al. 2018, MNRAS, 476, 122Veilleux, S., Cecil, G., & Bland-Hawthorn, J. 2005, ARA&A, 43, 769Veilleux, S., Maiolino, R., Bolatto, A. D., & Aalto, S. 2020, A&A Rev., 28, 2Venturi, G., Nardini, E., Marconi, A., et al. 2018, A&A, 619, A74Zubovas, K. & King, A. 2012, ApJ, 745, L34
Article number, page 11 of 13

A&A proofs: manuscript no. main
Fig. A.1. Mrk509 observed SED decomposed into stellar, AGN and SFcomponents using the technique described by Gruppioni et al. (2016).The black filled circles with error bars are data, blue dotted lines showthe unabsorbed stellar component, red dashed lines show the combi-nation of extinguished stars and dust IR emission, while long-dashedgreen lines show the dusty torus emission. Pale-blue dot–dashed linesshow the dust re-emission, while black solid lines are the sum of allcomponents (total emission).
Appendix A: Stellar Mass
The rest-frame SED is fitted with a three components modelusing the approach described in Gruppioni et al. (2016). Theadopted code combines three components simultaneously, i.e.the stellar component, the dusty star-formation part and theAGN/torus emission. The adopted libraries are the Bruzual &Charlot (2003) stellar library, the da Cunha et al. (2008) IRdust-emission library and the library of AGN tori by Fritz et al.(2006), updated by Feltre et al. (2012). The latter includes boththe emission of the dusty torus, heated by the central AGN en-gine, and the emission of the accretion disc. The consideredAGN models are based on a continuous distribution of dustacross the torus. The torus emission is shown as green dashedline. The decomposition code provides a probability distributionfunction (PDF) in each photometric band and for each fit com-ponent, allowing an estimate of the uncertainty related to eachdecomposed contribution. In Fig. A.1, we show the observedSED of Mrk509 with the galaxy and AGN components. We deferto Gruppioni et al. (2016) for further details about the SED de-composition method. This SED decomposition delivers the star-formation rate S FR = 5.1 ± 0.5 M�/yr (Gruppioni et al. 2016),and the stellar mass M∗ = (1.2 ± 0.1) × 1011 M� (this work).
Appendix B: Inner disc model
Based on the residual maps of the disc model (Section 3), weperform a dynamical modeling of the inner ∼ 1.5 kpc region,where the model of the large scale disc produces significant blue-and red-shifted residuals (Fig. 2). This nuclear region is barelyresolved with the current angular resolution but we attempt tomodel it with a nuclear disc using the same technique as ex-
plained in Section 3. Given the limited signal-to-noise ratio andangular resolution we fix the inclination to 66 deg, derived fromthe minor/major axis ratio of the inner emitting region measuredfrom the zeroth moment of the emission line data-cube. We fixthe PA value to 330 deg, i.e. across the two brightest emissionregions in the residual intensity map, Fig. 5. We allow two pa-rameters to vary: the rotational velocity vrot and the velocity dis-persion σgas with first guess values set to 80 and 50 km/s, re-spectively (Fig. 5 right panel). The moment 1 and 2 maps of thismodel are reported in Fig. B.1 central panels. The right panel ofFig.5 shows the position velocity diagrams cut along the kine-matic major axis (330 deg); where the grey-scale and blue con-tours refer to the data and the red contours to the model.
Article number, page 12 of 13

M.V. Zanchettin et al.: The IBISCO survey
Fig. B.1. Top panels: the CO(2-1) moment 1 (top-left) and moment 2 maps (top-right) computed from the data-cube, after subtraction of the discmodel (Section 3). A threshold of 3σ has been applied. The black cross marks the AGN position. Central panels: the moment 1 (central-left)and moment 2 (central-right) maps of the disc model of the inner r=700 pc region. Bottom panels: the moment 1 (bottom-left) and moment 2(bottom-right) maps of the residuals obtained by subtracting the model velocity and velocity dispersion maps (central panels) from the observedones (top panels). Article number, page 13 of 13