Embed Size (px)
Citation preview
The Impact of a Changing Southern Hemisphere Annular Mode on AntarcticPeninsula Summer Temperatures
GARETH J. MARSHALL
British Antarctic Survey, Natural Environment Research Council, Cambridge, United Kingdom
ANDREW ORR
Department of Space and Climate Physics, University College London, London, United Kingdom
NICOLE P. M. VAN LIPZIG
Physical and Regional Geography Research Group, K.U. Leuven, Leuven, Belgium
JOHN C. KING
British Antarctic Survey, Natural Environment Research Council, Cambridge, United Kingdom
(Manuscript received 30 May 2005, in final form 11 October 2005)
ABSTRACT
Since the mid-1960s, rapid regional summer warming has occurred on the east coast of the northernAntarctic Peninsula, with near-surface temperatures increasing by more than 2°C. This warming has con-tributed significantly to the collapse of the northern sections of the Larsen Ice Shelf. Coincident with thiswarming, the summer Southern Hemisphere Annular Mode (SAM) has exhibited a marked trend, sug-gested by modeling studies to be predominantly a response to anthropogenic forcing, resulting in increasedwesterlies across the northern peninsula.
Observations and reanalysis data are utilized to demonstrate that the changing SAM has played a key rolein driving this local summer warming. It is proposed that the stronger summer westerly winds reduce theblocking effect of the Antarctic Peninsula and lead to a higher frequency of air masses being advectedeastward over the orographic barrier of the northern Antarctic Peninsula. When this occurs, a combinationof a climatological temperature gradient across the barrier and the formation of a föhn wind on the lee sidetypically results in a summer near-surface temperature sensitivity to the SAM that is 3 times greater on theeastern side of the peninsula than on the west. SAM variability is also shown to play a less important rolein determining summer temperatures at stations west of the barrier in the northern peninsula (�62°S), bothat the surface and throughout the troposphere. This is in contrast to a station farther south (�65°S) wherethe SAM exerts little influence.
1. Introduction
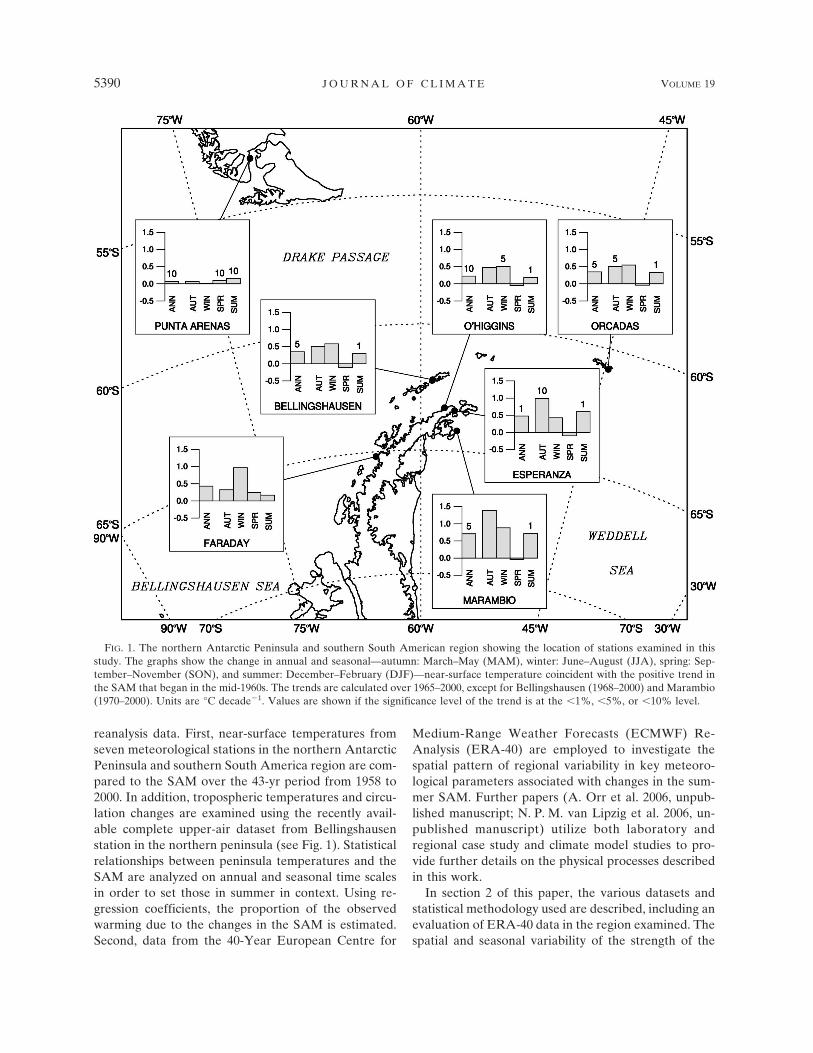
The temperature of the northern Antarctic Peninsularegion (as shown in Fig. 1) has undergone significantchange over the last 50 yr, the period of instrumentalrecord. In contrast to most of the Antarctic continent,which demonstrates very little significant change(Turner et al. 2005; more information available onlineat http://www.antarctica.ac.uk/met/gjma/temps.html),
annual near-surface temperatures in the central west-ern peninsula have increased at a much higher rate thanthe global average, and possibly higher than anywhereelse on the earth over this period. At the Faraday sta-tion (see Fig. 1; note that this station became Vernad-sky in 1996, when its operation passed to the Ukraine)the near-surface warming from 1951 to 2004 was2.94°C, significant at the �1% level, whereas the globalaverage was 0.52°C [based on the Goddard Institute forSpace Studies data; see Hansen et al. (2001) for details].Climate proxies suggest that this warming has led toregional temperatures that are unprecedented over thelast 2000 yr (Vaughan et al. 2003).
Although winter is the season of greatest warming at
Corresponding author address: Dr. Gareth Marshall, BritishAntarctic Survey, High Cross Madingley Rd., Cambridge CB30ET, United Kingdom.E-mail: [email protected]
5388 J O U R N A L O F C L I M A T E VOLUME 19
© 2006 American Meteorological Society
JCLI3844
Faraday, on the west coast (cf. Fig. 1), the southwardmigration of the 0°C isotherm during summer is respon-sible for the clearest signs of regional climate change: intotal more than 13 500 km2 of ice shelves have disinte-grated from the peninsula in the last 30 yr (Scambos etal. 2004). Most recent has been the collapse of thenorthern sections of the Larsen Ice Shelf on the easternside. Marine sediments from below where the farthestsouth of these sections, the Larsen B shelf, was for-merly located, indicate that its collapse is unique withinthe Holocene period (Domack et al. 2005). Althoughbasal melting may have played a role in the ice shelfbreakup (Shepherd et al. 2003), crevasse propagationdue to percolating surface meltwater is generallythought to be the primary mechanism involved (Scam-bos et al. 2000, 2003; van den Broeke 2005). This is adirect consequence of marked summer air temperatureincreases in the 1990s. Indeed, in recent decades thesummer warming at stations in the northeast of theregion has exceeded that in the west: between 1965 and2004 the summer near-surface temperature increase atEsperanza (see Fig. 1) and Faraday was 2.09° and0.84°C, respectively. Since the removal of the iceshelves, observations of regional glaciers have revealedboth surface lowering and acceleration, thus leading toa eustatic sea level rise (e.g., De Angelis and Skvarca2003; Rignot et al. 2004).
The atmospheric circulation of the peninsula regionhas also changed significantly during the last few de-cades. The principal mode of variability in the SouthernHemisphere (SH) circulation, the SH Annular Mode(SAM), began a positive phase shift in the mid-1960s(Marshall 2003), which has resulted in increased (re-duced) pressures in the SH midlatitudes (the Antarcticregion). The trends in the SAM are statistically signifi-cant annually, in autumn and especially in summer (cf.Table 1). Observation-based time series of the SAMindicate similarly high summer values in the early 1960s(Marshall et al. 2004; Jones and Widmann 2004), signi-fying that natural variability may have played a role indriving these trends. Indeed, recent studies have linkedENSO and SAM variability during the austral summer(Carvalho et al. 2005; L’Heureux and Thompson 2006).However, several model studies agree in suggestingthat anthropogenic change—through a combination ofgreenhouse gas increases and ozone depletion—is pri-
marily responsible for this climatic shift (e.g., Kushneret al. 2001; Gillett and Thompson 2003; Marshall et al.2004; Shindell and Schmidt 2004).
Changes in the meridional pressure gradient associ-ated with a more positive SAM have strengthened thecircumpolar vortex and intensified the westerlies thatencircle Antarctica and impinge upon the northwesternpeninsula (Marshall 2002). Statistical analysis by bothThompson and Solomon (2002) and Kwok and Comiso(2002), using independent temperature datasets, re-vealed strong positive correlations between the SAMand temperatures across the peninsula region, suggest-ing that the increasing westerlies have played a role inthe warming there. More recently, some studies havebegun to examine the possible physical mechanismslinking changes in the SAM and regional temperatures.Van den Broeke and van Lipzig (2003) proposed thatduring the positive phase of the winter SAM, the SouthAtlantic storm center is displaced, cutting off the atmo-spheric branch of the Weddell gyre, and leading sub-sequently to a rise in temperature over the Weddell Seaand the peninsula region. Liu et al. (2004) suggestedthat during the positive phase of the SAM a strongcyclonic circulation west of the peninsula results in anincreased poleward heat flux into the region, which,combined with sea ice divergence away from the coast,leads to warmer peninsula temperatures. Orr et al.(2004) proposed that the blocking effect of the penin-sula orography (a mountain chain typically 1.5–2.0 kmhigh) at lower levels increases with the strength of thewesterly flow, causing the wind to veer and becomemore northerly, again leading to greater transport ofrelatively warm air along the western side of the pen-insula. However, the authors of this last paper also sug-gested that beyond a critical threshold stronger wester-lies are more likely to pass over the peninsula. Thus,relatively warm maritime air from the west will reachthe colder continental east with more frequency, caus-ing warming on the eastern peninsula as well.
In this paper, we hypothesize that this latter physicalmechanism may explain why the recent summer warm-ing in the northeast peninsula is so large and, conse-quently, the recent disintegration of the northern sec-tions of the Larsen Ice Shelf. We examine the spatialand temporal relationships between the SAM and thepeninsula region temperatures using observations and
TABLE 1. Annual and seasonal trends in the SAM from 1965 to 2000. Units are decade�1. Significant trends (�1%) are shownby the asterisks.
Annual Autumn (MAM) Winter (JJA) Spring (SON) Summer (DJF)
�1.08 � 0.36* �0.93 � 0.29* –0.04 � 0.50 �0.32 � 0.52 �1.11 � 0.44*
15 OCTOBER 2006 M A R S H A L L E T A L . 5389
reanalysis data. First, near-surface temperatures fromseven meteorological stations in the northern AntarcticPeninsula and southern South America region are com-pared to the SAM over the 43-yr period from 1958 to2000. In addition, tropospheric temperatures and circu-lation changes are examined using the recently avail-able complete upper-air dataset from Bellingshausenstation in the northern peninsula (see Fig. 1). Statisticalrelationships between peninsula temperatures and theSAM are analyzed on annual and seasonal time scalesin order to set those in summer in context. Using re-gression coefficients, the proportion of the observedwarming due to the changes in the SAM is estimated.Second, data from the 40-Year European Centre for
Medium-Range Weather Forecasts (ECMWF) Re-Analysis (ERA-40) are employed to investigate thespatial pattern of regional variability in key meteoro-logical parameters associated with changes in the sum-mer SAM. Further papers (A. Orr et al. 2006, unpub-lished manuscript; N. P. M. van Lipzig et al. 2006, un-published manuscript) utilize both laboratory andregional case study and climate model studies to pro-vide further details on the physical processes describedin this work.
In section 2 of this paper, the various datasets andstatistical methodology used are described, including anevaluation of ERA-40 data in the region examined. Thespatial and seasonal variability of the strength of the
FIG. 1. The northern Antarctic Peninsula and southern South American region showing the location of stations examined in thisstudy. The graphs show the change in annual and seasonal—autumn: March–May (MAM), winter: June–August (JJA), spring: Sep-tember–November (SON), and summer: December–February (DJF)—near-surface temperature coincident with the positive trend inthe SAM that began in the mid-1960s. The trends are calculated over 1965–2000, except for Bellingshausen (1968–2000) and Marambio(1970–2000). Units are °C decade�1. Values are shown if the significance level of the trend is at the �1%, �5%, or �10% level.
5390 J O U R N A L O F C L I M A T E VOLUME 19
statistical relationships between the SAM and northernpeninsula temperatures are documented in section 3. Insection 4 they are discussed with reference to the re-gional climate anomalies associated with high (stronglypositive) or low (strongly negative) SAM as revealed bythe ERA-40 fields. Finally, in section 5, we present adiscussion of the work: the proposed mechanisms link-ing changes in the SAM to the rapid rise in northeastpeninsula summer temperatures are examined furtherusing additional surface observations. In addition, theprincipal conclusions are outlined in this section.
2. Data and methodology
a. The SAM index
The principal SAM index utilized in this study wasdeveloped by Marshall (2003) from monthly mean sealevel pressure (MSLP) data at 12 stations in the SHextratropics. It is currently available for the period1958–2000 (although a slightly altered up-to-date ver-sion can now be obtained online at http://www.nerc-bas.ac.uk/icd/gjma/sam.html). Note that there are sev-eral definitions of the SAM available (e.g., Gong andWang 1999; Thompson and Wallace 2000; Thompsonand Solomon 2002; Jones and Widmann 2004). Mar-shall (2003) used the basic definition of Gong andWang (1999), which is the normalized zonal pressuredifference between 40° and 65°S (representing mid- andhigh southern latitudes, respectively). However, be-cause of known spurious temporal trends in reanalysisMSLP data around Antarctica, he utilized data fromappropriately located stations—six each at approxi-mately 40° and 65°S—to produce observation-basedzonal mean MSLP values with which to compute theSAM index. The principal advantages of the Marshall(2003) index are its simplicity and temporal consistencyacross its entire time span and between different sea-sons. The main disadvantage compared to (empiricalorthogonal function) EOF-based SAM indices is that itdoes not account for the changing nonzonal spatialSAM variability across different seasons. However, asthis study is primarily concerned with only one season
(summer), this is not a significant issue here. In addi-tion, the temporal extent of the Marshall (2003) index islimited to the period from the late 1950s, when mostAntarctic observations began. Once again, this is not aproblem in the present study where we concentrate onthe period of the recent positive trend in the summerSAM, from 1965 onward.
In addition a monthly SAM index produced by theUS National Weather Service Climate Prediction Cen-ter (CPC; available online at http://www.cpc.ncep.noaa.gov/products/precip/CWlink/daily_ao_index/aao/month_aao_index.shtml.) is used to test correlationsagainst more recent data (see section 5). This index isbased on the first EOF of the 700-hPa geopotentialheight field obtained from the National Centers for En-vironmental Prediction–National Center for Atmo-spheric Research (NCEP–NCAR) reanalysis. It beginsin 1979 and is updated monthly.
b. Surface station observations
The locations of the seven meteorological stationsfrom which near-surface temperature data were exam-ined are shown in Fig. 1. Station coordinates and dataavailability are summarized in Table 2. Antarctic datawere taken principally from the Scientific Committeefor Antarctic Research (SCAR) Reference AntarcticData for Environmental Research (READER) project(Turner et al. 2004), which produced a definitive set ofmonthly mean values of basic meteorological param-eters at Antarctic stations. (This dataset is availableonline at http://www.antarctica.ac.uk/met/READER/).Six-hourly synoptic data from Esperanza were obtainedfrom the Global Telecommunication System (GTS) viathe Met Office. Data from Punta Arenas were kindlysupplied by Dr. Phil Jones of the Climatic ResearchUnit, University of East Anglia.
c. Bellingshausen free-air observations
The complete free-air temperature dataset from Bell-ingshausen, where the upper-air program commencedin May 1969 and stopped in January 1999, were alsoacquired as part of the READER project. Data were
TABLE 2. Location and near-surface temperature data availability of the northern peninsula region stations analyzed in this study.
Station Lat Lon Data availability Missing months
Bellingshausen 62°12’S 58°58’W Mar 1968–Dec 2000 0Esperanza 63°24’S 56°59’W Jan 1958–Dec 2000 6Faraday 65°15’S 64°16’W Jan 1958–Dec 2000 0Marambio 64°15’S 56°39’W Sep 1970–Dec 2000 27O’Higgins 63°18’S 57°54’W Jan 1963–Dec 2000 18Orcadas 60°45’S 44°43’W Jan 1958–Dec 2000 1Punta Arenas 53°00’S 70°51’W Jan 1958–Dec 2000 13
15 OCTOBER 2006 M A R S H A L L E T A L . 5391
examined at standard levels from 850 to 20 hPa. Ran-dom errors (outliers) were removed from the daily datausing methodology from the fields of resistant, robust,and nonparametric techniques (Lanzante 1996). Typi-cally, this reduced the available observations at eachpressure level by �0.2%. Monthly mean values wereproduced following the procedures laid down by theMet Office (1979) whereby the calculated mean is con-sidered representative for the entire month providedthat at least ten observations exist for that month andthat no gap between observations exceeds 4 days. Rea-sonably complete monthly time series were producedfor the troposphere, but with an increasing number ofmissing data in the stratosphere, especially during theaustral winter. Reference is also made to a free-air tem-perature record from Faraday from 1956 to 1999; thisdataset is a synthesis of observations and reanalysisdata and its construction is described in Marshall et al.(2002).
d. Sea ice concentration data
Monthly sea ice concentration data were acquiredfrom the National Snow and Ice Data Center (NSIDC).These data were produced using a modified version ofthe Bootstrap algorithm (Comiso 1995) with revised tiepoints improving the temporal consistency of thedataset. An ice concentration of 0.15 was used to definethe ice edge.
e. ERA-40 reanalysis data
ERA-40 is the recently completed ECMWF reanaly-sis covering the 45-yr period from mid-1957 to mid-2002Uppala et al. 2005; more information available onlineat http://www.ecmwf.int/research/era/). Marshall (2003)demonstrated that ERA-40 is currently the reanalysisthat best represents MSLP at SH high latitudes, al-though significant biases may occur in individualmonths prior to the assimilation of satellite sounderdata. This first occurred in 1973, with temperaturesfrom the Vertical Temperature Profile Radiometer(VTPR) being utilized. A subsequent further improve-ment took place in 1979, with the assimilation of bothtemperature and humidity from the Television InfraredObservational Satellite (TIROS) Operational VerticalSounder (TOVS) instrument.
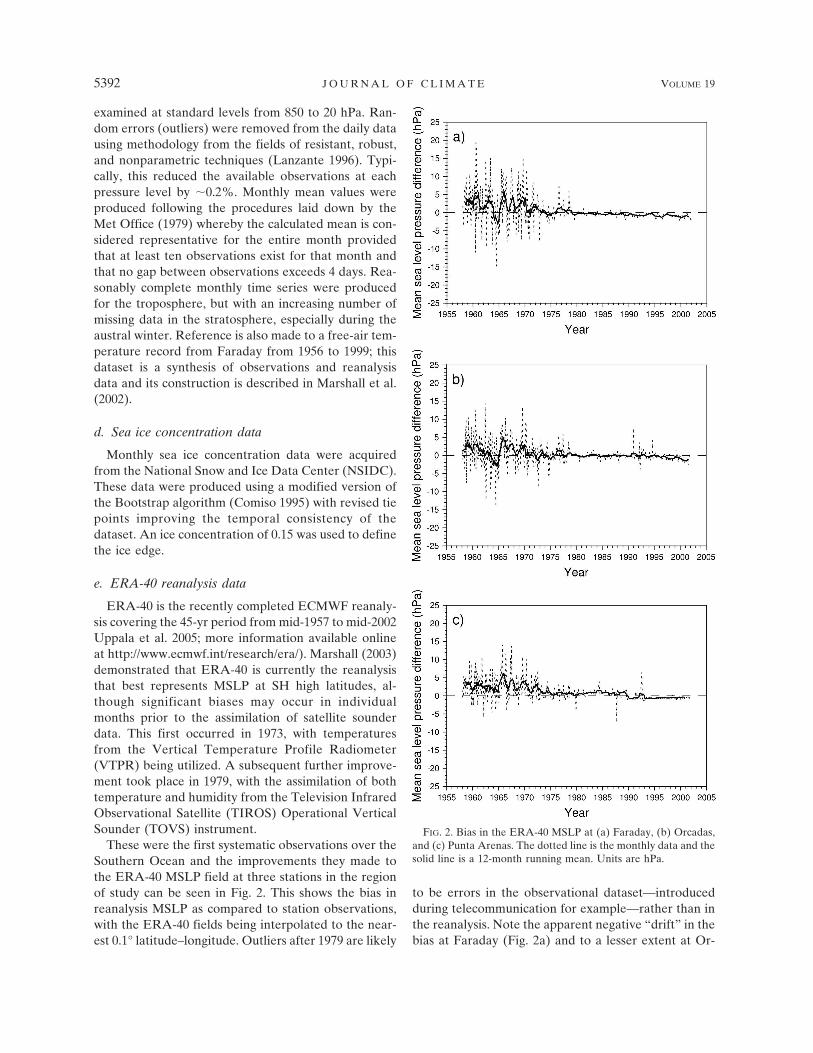
These were the first systematic observations over theSouthern Ocean and the improvements they made tothe ERA-40 MSLP field at three stations in the regionof study can be seen in Fig. 2. This shows the bias inreanalysis MSLP as compared to station observations,with the ERA-40 fields being interpolated to the near-est 0.1° latitude–longitude. Outliers after 1979 are likely
to be errors in the observational dataset—introducedduring telecommunication for example—rather than inthe reanalysis. Note the apparent negative “drift” in thebias at Faraday (Fig. 2a) and to a lesser extent at Or-
FIG. 2. Bias in the ERA-40 MSLP at (a) Faraday, (b) Orcadas,and (c) Punta Arenas. The dotted line is the monthly data and thesolid line is a 12-month running mean. Units are hPa.
5392 J O U R N A L O F C L I M A T E VOLUME 19
cadas (Fig. 2b). Although this suggests an instrumentproblem, we know that the barometer at Faraday iscalibrated regularly (J. Shanklin 2004, British AntarcticSurvey, personal communication). At Punta Arenas(Fig. 2c), a step jump can be seen in 1989, when theERA-40 bias switches from positive to negative. Thejump does not exist at other stations, so is unlikely to bean artifact of the reanalysis, and is too small to be a shiftfrom station to sea level pressure. Therefore, it mayhave resulted from a change in instrument, station lo-cation, and/or a calibration error.
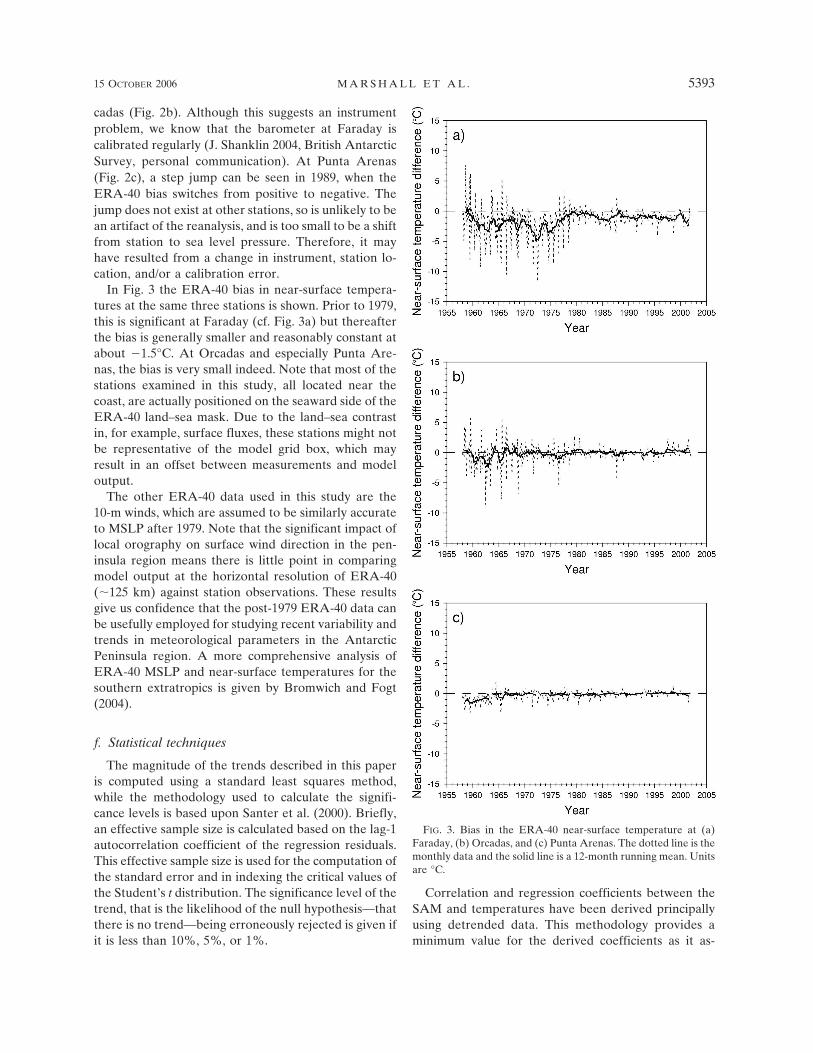
In Fig. 3 the ERA-40 bias in near-surface tempera-tures at the same three stations is shown. Prior to 1979,this is significant at Faraday (cf. Fig. 3a) but thereafterthe bias is generally smaller and reasonably constant atabout �1.5°C. At Orcadas and especially Punta Are-nas, the bias is very small indeed. Note that most of thestations examined in this study, all located near thecoast, are actually positioned on the seaward side of theERA-40 land–sea mask. Due to the land–sea contrastin, for example, surface fluxes, these stations might notbe representative of the model grid box, which mayresult in an offset between measurements and modeloutput.
The other ERA-40 data used in this study are the10-m winds, which are assumed to be similarly accurateto MSLP after 1979. Note that the significant impact oflocal orography on surface wind direction in the pen-insula region means there is little point in comparingmodel output at the horizontal resolution of ERA-40(�125 km) against station observations. These resultsgive us confidence that the post-1979 ERA-40 data canbe usefully employed for studying recent variability andtrends in meteorological parameters in the AntarcticPeninsula region. A more comprehensive analysis ofERA-40 MSLP and near-surface temperatures for thesouthern extratropics is given by Bromwich and Fogt(2004).
f. Statistical techniques
The magnitude of the trends described in this paperis computed using a standard least squares method,while the methodology used to calculate the signifi-cance levels is based upon Santer et al. (2000). Briefly,an effective sample size is calculated based on the lag-1autocorrelation coefficient of the regression residuals.This effective sample size is used for the computation ofthe standard error and in indexing the critical values ofthe Student’s t distribution. The significance level of thetrend, that is the likelihood of the null hypothesis—thatthere is no trend—being erroneously rejected is given ifit is less than 10%, 5%, or 1%.
Correlation and regression coefficients between theSAM and temperatures have been derived principallyusing detrended data. This methodology provides aminimum value for the derived coefficients as it as-
FIG. 3. Bias in the ERA-40 near-surface temperature at (a)Faraday, (b) Orcadas, and (c) Punta Arenas. The dotted line is themonthly data and the solid line is a 12-month running mean. Unitsare °C.
15 OCTOBER 2006 M A R S H A L L E T A L . 5393
sumes that there is no link between linear trends in thepredictor (SAM) and predictand (temperature). Usingthe original, undetrended data assumes that the entiretrend in the predictand that covaries with the predictoris due to the latter, and hence derived coefficients aremaximum possible values. We consider that this paperprovides a plausible physical mechanism linking theSAM and summer temperatures in some regions of thepeninsula: therefore, we believe that actual statisticalvalues will be greater than the minimum possible. Thus,while we generally take a “conservative” approach inusing the detrended data to calculate correlation andregression coefficients, we sometimes provide a rangeof possible values, using the detrended and originaldata to provide minimum and maximum limits, respec-tively.
Statistical coefficients between the SAM and tem-peratures were determined for a SAM computed onlyfrom those periods when temperature data were avail-able. However, when calculating the contribution tochanging temperatures attributable to the SAM, thenthe complete time series was used. Regression coeffi-cients are calculated for a positive unit change in theSAM index [i.e., a regression coefficient of 0.5 (�0.5)means that if the SAM index increases by 1 then thetemperature warms (cools) by 0.5°C].
3. Results
a. Correlation and regression statistics between theSAM and regional near-surface temperatures
Annual and seasonal correlation and regression co-efficients between the detrended SAM index and de-trended near-surface temperatures at the seven meteo-rological stations are given in Table 3. With the excep-tion of Faraday (r � 0.00), the annual correlationcoefficients (r � 0.28–0.49) indicate statistically signifi-cant relationships exist between the mean annual SAMindex and near-surface temperatures in the northernpeninsula region. Equivalent coefficients between the
original time series reveal, as expected, higher values ofr, up to 0.57, with all the correlations (apart from atFaraday) being significant at the �1% level.
The majority of the stations examined demonstratestatistically significant relationships between the SAMand temperatures in autumn and most of these havetheir largest correlation coefficient in this season (cf.Table 3). However, only the two stations on the south-eastern side of the barrier—but situated in the north-east of the region—(Esperanza and Marambio, the“east coast” stations: see Fig. 1) reveal strong relation-ships during summer. Esperanza actually has a highercorrelation to the SAM in this season (0.47) than inautumn (0.40). Recent trends in the SAM have beenlargest in these two seasons and are also both statisti-cally significant (cf. Table 1). Thus, these statistical re-lationships are indicative of the major role that thechanging SAM is playing in driving climate changewithin the region.
Regression coefficients are larger in autumn thansummer at all six peninsula stations (e.g., at Esperanza,0.52° and 0.21°C, respectively, from the detrended dataor 0.67° and 0.28°C, respectively from the originaldata). Those associated with the two stations east of thebarrier are higher than the others in both seasons. How-ever, the impact of the topographic barrier on control-ling relative temperatures on either side of it is mostpronounced in summer. In this season, the standarddeviation of mean temperatures at the east coast sta-tions is markedly greater than those immediately to thenorthwest, meaning that the ratio between their asso-ciated regression coefficients is larger than between theequivalent correlation coefficients. Values of the re-gression coefficients at Esperanza (east) and O’Higgins(northwest) are 0.21° and 0.07°C, respectively (0.28°and 0.10°C, respectively from the original data), indi-cating a threefold increase in the sensitivity of tempera-tures to changes in the SAM on crossing the barrierfrom west to east. This result is particularly striking asEsperanza and O’Higgins are situated only 50 km apart
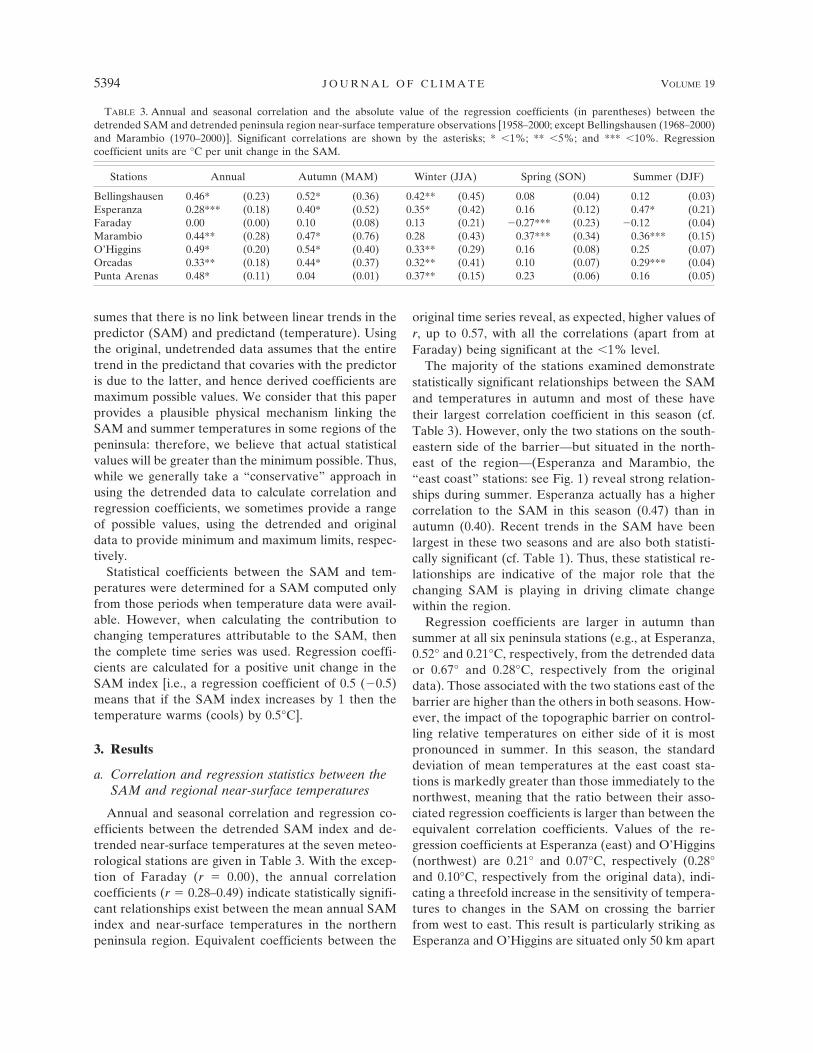
TABLE 3. Annual and seasonal correlation and the absolute value of the regression coefficients (in parentheses) between thedetrended SAM and detrended peninsula region near-surface temperature observations [1958–2000; except Bellingshausen (1968–2000)and Marambio (1970–2000)]. Significant correlations are shown by the asterisks; * �1%; ** �5%; and *** �10%. Regressioncoefficient units are °C per unit change in the SAM.
Stations Annual Autumn (MAM) Winter (JJA) Spring (SON) Summer (DJF)
Bellingshausen 0.46* (0.23) 0.52* (0.36) 0.42** (0.45) 0.08 (0.04) 0.12 (0.03)Esperanza 0.28*** (0.18) 0.40* (0.52) 0.35* (0.42) 0.16 (0.12) 0.47* (0.21)Faraday 0.00 (0.00) 0.10 (0.08) 0.13 (0.21) �0.27*** (0.23) �0.12 (0.04)Marambio 0.44** (0.28) 0.47* (0.76) 0.28 (0.43) 0.37*** (0.34) 0.36*** (0.15)O’Higgins 0.49* (0.20) 0.54* (0.40) 0.33** (0.29) 0.16 (0.08) 0.25 (0.07)Orcadas 0.33** (0.18) 0.44* (0.37) 0.32** (0.41) 0.10 (0.07) 0.29*** (0.04)Punta Arenas 0.48* (0.11) 0.04 (0.01) 0.37** (0.15) 0.23 (0.06) 0.16 (0.05)
5394 J O U R N A L O F C L I M A T E VOLUME 19
and the elevation of the orography between them doesnot exceed 500 m. Moreover, at Orcadas, to the north-east of the peninsula (see Fig. 1), the relative magnitudeof the seasonal relationships between the SAM andnear-surface temperatures more closely resembles thetwo stations to the northwest rather than those to theeast. Again, this suggests that the presence of the bar-rier plays a very important role in determining the mag-nitude that changes in the SAM have on summer tem-peratures across the peninsula region.
Note that in winter there are strong correlations be-tween the SAM and temperatures at five stations but,interestingly, not at Faraday (cf. Table 3), the mostsoutherly of the stations examined here where thewarming in this season exceeds 5.8°C since 1950. Thisindicates succinctly that the trend in the SAM hasnot played a significant role in driving the exceptionalwinter warming observed there. Indeed, given the neg-ligible change in the winter SAM (cf. Table 1), thenthis finding is true for all stations in the region (cf.section 3b).
Similar statistical coefficients (based on monthlydata) were computed for the entire Antarctic continentby Kwok and Comiso (2002), using undetrended data,and by Schneider et al. (2004). Both studies used iden-tical surface temperature datasets derived from infra-red satellite data from 1982 to 1998 (1999 in the laterstudy). Kwok and Comiso (2002) employed a SAM in-dex based on the first EOF of 850-hPa geopotentialheight from the NCEP–NCAR reanalysis (Thompsonand Wallace 2000), while Schneider et al. (2004) used asimilar SAM index based on 500-hPa geopotentialheight.
The correlation coefficients obtained by Kwok andComiso (2002) and those from the longer annualdataset of this study are of broadly similar magnitude,with maximum values of �0.5–0.6 in the north andnortheast peninsula and lower values on the west coastat the latitude of Faraday. However, we note that theregression coefficients in the peninsula region indicatedin Fig. 3a of Kwok and Comiso (2002), with maximumvalues close to 2°C per unit change in the SAM, aresignificantly larger than both those derived in this study(cf. Table 3) and those depicted in Fig. 7a of Schneideret al. (2004), where maximum values in the northernpeninsula are less than 1°C. Repeating the analysis ofmonthly data using the Marshall (2003) SAM indexproduces values similar to the Schneider et al. (2004)results. Equivalent regression coefficients derived frommonthly station observations are also of similar magni-tude to those of Schneider et al. (2004).
Furthermore, we note that van den Broeke (2000)demonstrated a significant correlation between cloud
cover and surface pressure at some Antarctic stations.Therefore, it is likely that the magnitude of the SAMwill have some influence on cloud cover and this will beexamined further in the forthcoming modeling paper(N. P. M. van Lipzig et al. 2006, unpublished manu-script). The satellite-derived surface temperatures inthe peninsula region are a highly conditionally sampledrecord (King and Comiso 2003), because the region isvery cloudy—77% of Faraday observations report acloud cover of 7 octas or greater for 1982–98—and tem-peratures can only be determined from cloud-free im-agery. Thus, we suggest that the temperature datasetutilized by Kwok and Comiso (2002) is poorly suited forstudying the relationship between the SAM and penin-sula temperatures unless data gaps can be suitably filled(see Schneider et al. 2004).
b. The contribution of changes in the SAM toregional near-surface warming
The current positive trend in the summer SAM com-menced in the mid-1960s (Marshall 2003): Fig. 1 showsthe regional near-surface temperature trends contem-poraneous with this change (1965–2000). In autumn,summer and, as a consequence annually, the two eastcoast stations, Esperanza and Marambio, underwentthe largest warming in the peninsula region during thisperiod. The other four Antarctic stations examined hadtheir largest seasonal warming in winter, indicative ofthe far greater role that sea ice variability plays in de-termining temperatures on the north and, especially,the west coasts of the peninsula (e.g., King 1994; Kinget al. 2003; Jacobs and Comiso 1997).
Based on the observed changes in the SAM (Table1), trends in near-surface temperatures (Fig. 1), and thecomputed regression coefficients (Table 3), Table 4 liststhe estimated annual and seasonal temperature contri-butions of the SAM for 1965–2000. As the regressioncoefficients are derived from detrended data, these sta-tistical results represent an estimate of the minimumcontribution of changes in the SAM to near-surfacetemperature trends.
Annually, the recent trend in the SAM has causedsimilar temperature rises east and (north) west of thebarrier (e.g., 0.19°C decade�1 at Esperanza and 0.21°Cdecade�1 at O’Higgins), but has in fact contributed agreater percentage of the total warming to the latterregion. However, with the exception of Faraday, at allstations the annual contribution is greater than 40%and at Punta Arenas exceeds 100%, implying that someother form of climate change is having an opposite,cooling effect here. Given that in general the largestregression coefficients are calculated in autumn, it isnot surprising that the biggest contribution by the SAM
15 OCTOBER 2006 M A R S H A L L E T A L . 5395
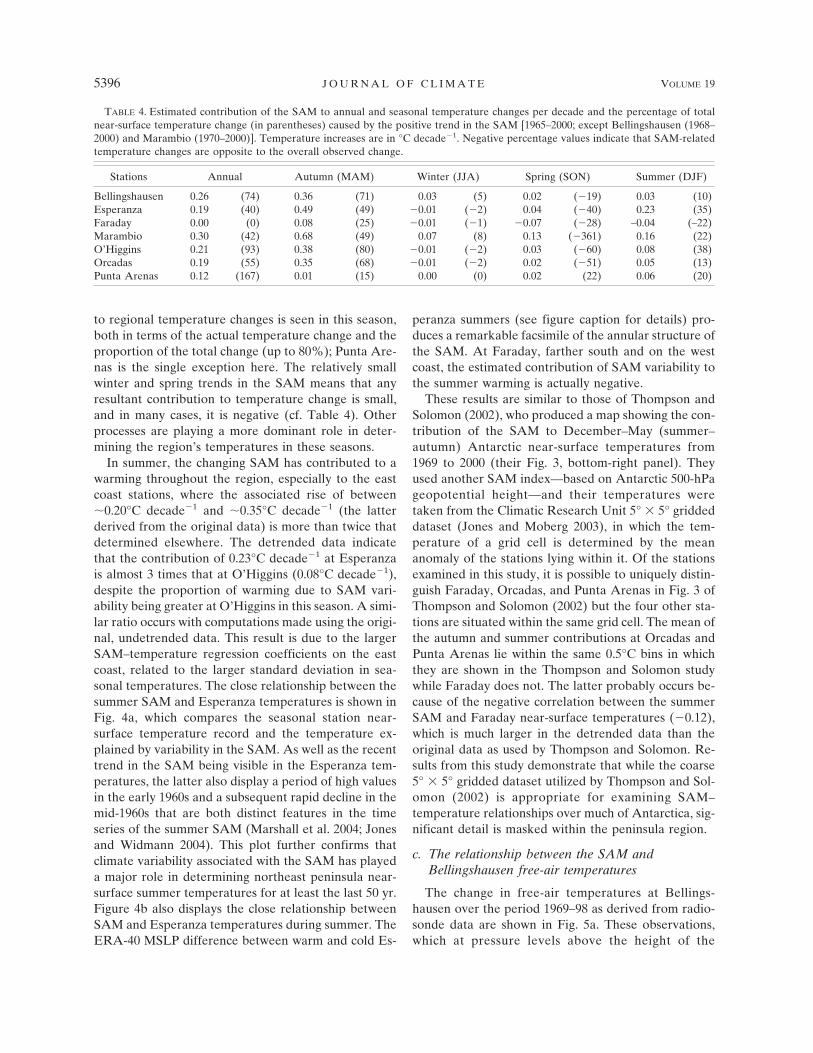
to regional temperature changes is seen in this season,both in terms of the actual temperature change and theproportion of the total change (up to 80%); Punta Are-nas is the single exception here. The relatively smallwinter and spring trends in the SAM means that anyresultant contribution to temperature change is small,and in many cases, it is negative (cf. Table 4). Otherprocesses are playing a more dominant role in deter-mining the region’s temperatures in these seasons.
In summer, the changing SAM has contributed to awarming throughout the region, especially to the eastcoast stations, where the associated rise of between�0.20°C decade�1 and �0.35°C decade�1 (the latterderived from the original data) is more than twice thatdetermined elsewhere. The detrended data indicatethat the contribution of 0.23°C decade�1 at Esperanzais almost 3 times that at O’Higgins (0.08°C decade�1),despite the proportion of warming due to SAM vari-ability being greater at O’Higgins in this season. A simi-lar ratio occurs with computations made using the origi-nal, undetrended data. This result is due to the largerSAM–temperature regression coefficients on the eastcoast, related to the larger standard deviation in sea-sonal temperatures. The close relationship between thesummer SAM and Esperanza temperatures is shown inFig. 4a, which compares the seasonal station near-surface temperature record and the temperature ex-plained by variability in the SAM. As well as the recenttrend in the SAM being visible in the Esperanza tem-peratures, the latter also display a period of high valuesin the early 1960s and a subsequent rapid decline in themid-1960s that are both distinct features in the timeseries of the summer SAM (Marshall et al. 2004; Jonesand Widmann 2004). This plot further confirms thatclimate variability associated with the SAM has playeda major role in determining northeast peninsula near-surface summer temperatures for at least the last 50 yr.Figure 4b also displays the close relationship betweenSAM and Esperanza temperatures during summer. TheERA-40 MSLP difference between warm and cold Es-
peranza summers (see figure caption for details) pro-duces a remarkable facsimile of the annular structure ofthe SAM. At Faraday, farther south and on the westcoast, the estimated contribution of SAM variability tothe summer warming is actually negative.
These results are similar to those of Thompson andSolomon (2002), who produced a map showing the con-tribution of the SAM to December–May (summer–autumn) Antarctic near-surface temperatures from1969 to 2000 (their Fig. 3, bottom-right panel). Theyused another SAM index—based on Antarctic 500-hPageopotential height—and their temperatures weretaken from the Climatic Research Unit 5° � 5° griddeddataset (Jones and Moberg 2003), in which the tem-perature of a grid cell is determined by the meananomaly of the stations lying within it. Of the stationsexamined in this study, it is possible to uniquely distin-guish Faraday, Orcadas, and Punta Arenas in Fig. 3 ofThompson and Solomon (2002) but the four other sta-tions are situated within the same grid cell. The mean ofthe autumn and summer contributions at Orcadas andPunta Arenas lie within the same 0.5°C bins in whichthey are shown in the Thompson and Solomon studywhile Faraday does not. The latter probably occurs be-cause of the negative correlation between the summerSAM and Faraday near-surface temperatures (�0.12),which is much larger in the detrended data than theoriginal data as used by Thompson and Solomon. Re-sults from this study demonstrate that while the coarse5° � 5° gridded dataset utilized by Thompson and Sol-omon (2002) is appropriate for examining SAM–temperature relationships over much of Antarctica, sig-nificant detail is masked within the peninsula region.
c. The relationship between the SAM andBellingshausen free-air temperatures
The change in free-air temperatures at Bellings-hausen over the period 1969–98 as derived from radio-sonde data are shown in Fig. 5a. These observations,which at pressure levels above the height of the
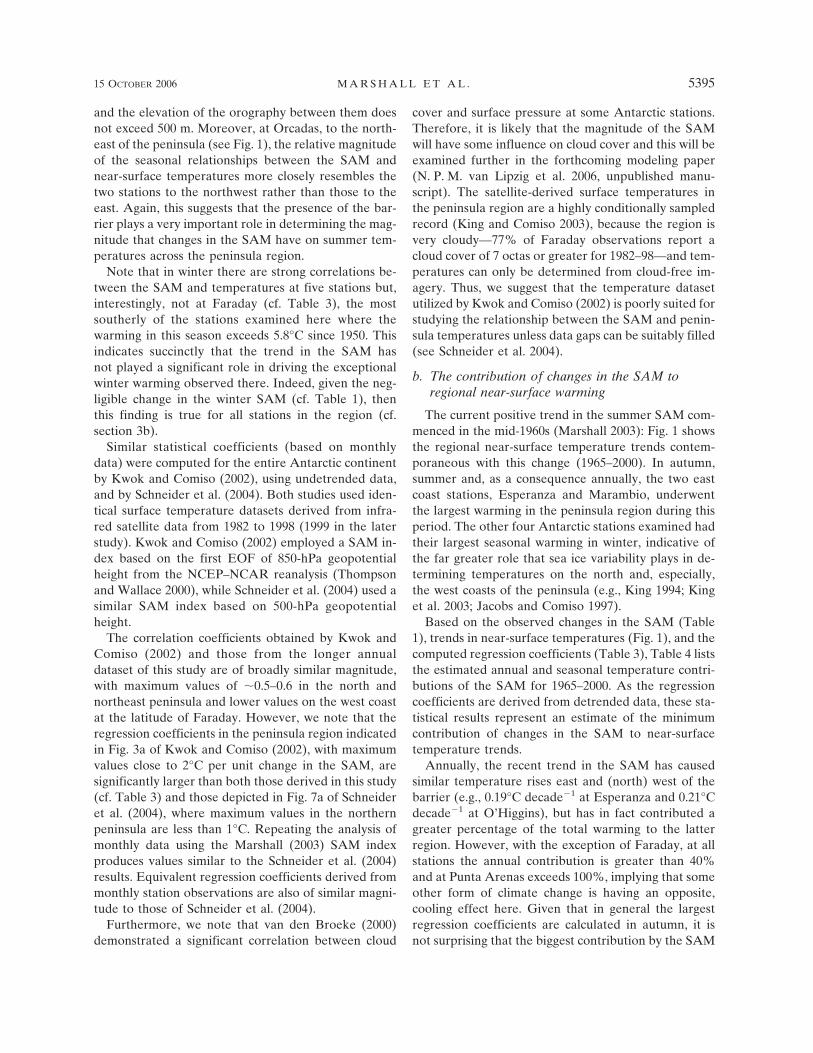
TABLE 4. Estimated contribution of the SAM to annual and seasonal temperature changes per decade and the percentage of totalnear-surface temperature change (in parentheses) caused by the positive trend in the SAM [1965–2000; except Bellingshausen (1968–2000) and Marambio (1970–2000)]. Temperature increases are in °C decade�1. Negative percentage values indicate that SAM-relatedtemperature changes are opposite to the overall observed change.
Stations Annual Autumn (MAM) Winter (JJA) Spring (SON) Summer (DJF)
Bellingshausen 0.26 (74) 0.36 (71) 0.03 (5) 0.02 (�19) 0.03 (10)Esperanza 0.19 (40) 0.49 (49) �0.01 (�2) 0.04 (�40) 0.23 (35)Faraday 0.00 (0) 0.08 (25) �0.01 (�1) �0.07 (�28) –0.04 (–22)Marambio 0.30 (42) 0.68 (49) 0.07 (8) 0.13 (�361) 0.16 (22)O’Higgins 0.21 (93) 0.38 (80) �0.01 (�2) 0.03 (�60) 0.08 (38)Orcadas 0.19 (55) 0.35 (68) �0.01 (�2) 0.02 (�51) 0.05 (13)Punta Arenas 0.12 (167) 0.01 (15) 0.00 (0) 0.02 (22) 0.06 (20)
5396 J O U R N A L O F C L I M A T E VOLUME 19
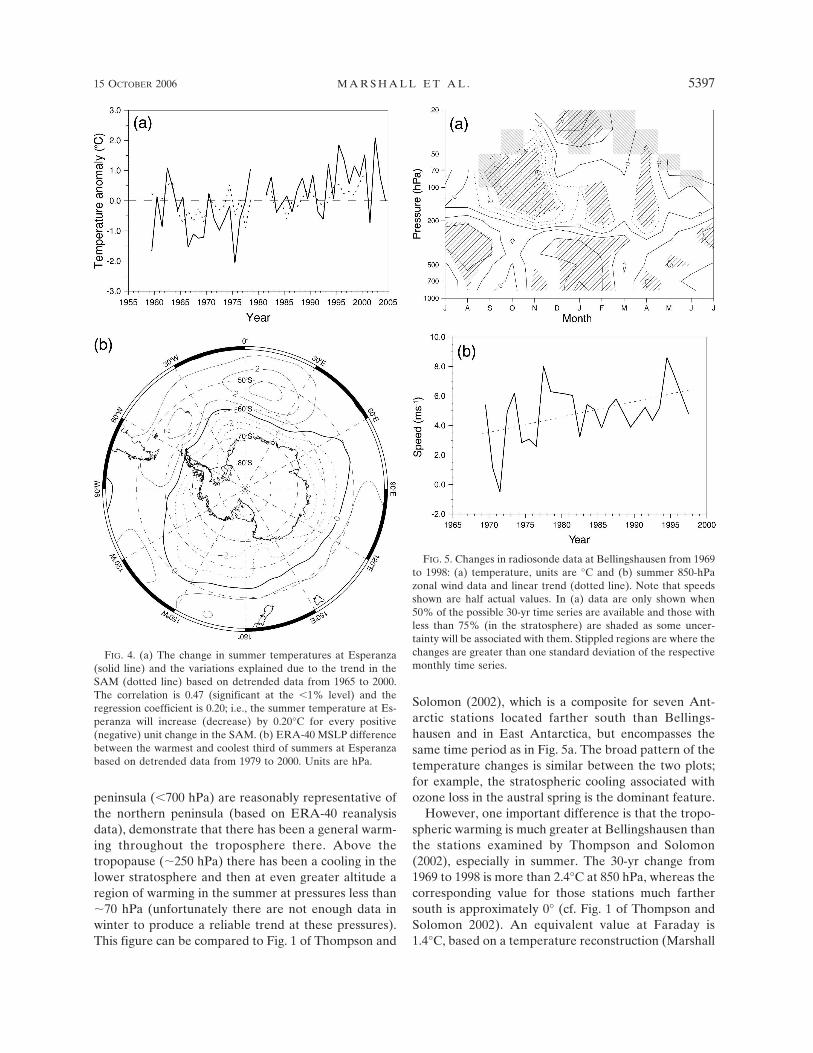
peninsula (�700 hPa) are reasonably representative ofthe northern peninsula (based on ERA-40 reanalysisdata), demonstrate that there has been a general warm-ing throughout the troposphere there. Above thetropopause (�250 hPa) there has been a cooling in thelower stratosphere and then at even greater altitude aregion of warming in the summer at pressures less than�70 hPa (unfortunately there are not enough data inwinter to produce a reliable trend at these pressures).This figure can be compared to Fig. 1 of Thompson and
Solomon (2002), which is a composite for seven Ant-arctic stations located farther south than Bellings-hausen and in East Antarctica, but encompasses thesame time period as in Fig. 5a. The broad pattern of thetemperature changes is similar between the two plots;for example, the stratospheric cooling associated withozone loss in the austral spring is the dominant feature.
However, one important difference is that the tropo-spheric warming is much greater at Bellingshausen thanthe stations examined by Thompson and Solomon(2002), especially in summer. The 30-yr change from1969 to 1998 is more than 2.4°C at 850 hPa, whereas thecorresponding value for those stations much farthersouth is approximately 0° (cf. Fig. 1 of Thompson andSolomon 2002). An equivalent value at Faraday is1.4°C, based on a temperature reconstruction (Marshall
FIG. 4. (a) The change in summer temperatures at Esperanza(solid line) and the variations explained due to the trend in theSAM (dotted line) based on detrended data from 1965 to 2000.The correlation is 0.47 (significant at the �1% level) and theregression coefficient is 0.20; i.e., the summer temperature at Es-peranza will increase (decrease) by 0.20°C for every positive(negative) unit change in the SAM. (b) ERA-40 MSLP differencebetween the warmest and coolest third of summers at Esperanzabased on detrended data from 1979 to 2000. Units are hPa.
FIG. 5. Changes in radiosonde data at Bellingshausen from 1969to 1998: (a) temperature, units are °C and (b) summer 850-hPazonal wind data and linear trend (dotted line). Note that speedsshown are half actual values. In (a) data are only shown when50% of the possible 30-yr time series are available and those withless than 75% (in the stratosphere) are shaded as some uncer-tainty will be associated with them. Stippled regions are where thechanges are greater than one standard deviation of the respectivemonthly time series.
15 OCTOBER 2006 M A R S H A L L E T A L . 5397
et al. 2002). These results show a similar spatial patternto the near-surface summer temperatures in that thepositive impact of the SAM is reduced as one movespoleward (cf. the Bellingshausen and Faraday data inTable 4). Thus, it seems likely that the SAM is alsoplaying a significant role in determining free-air sum-mer temperatures at Bellingshausen.
The maximum correlation between northern penin-sula free-air temperatures and the SAM occurs at theheight of the jet streams (250–300 hPa). This heightcorresponds to the greatest contemporaneous increasein the tropospheric zonal winds above Bellingshausenin most months and reflects the southward movementof the main storm tracks during a positive SAM (e.g.,Sinclair et al. 1997). However, within the general in-crease in tropospheric westerlies the summer trends inthe lower troposphere (�500 hPa) are the most statis-tically significant. As an example, the trend in the sum-mer zonal wind component above Bellingshausen at850 hPa is shown in Fig. 5b.
4. Climatology of summers with high and lowSAM values
It is clear from the results described in section 3 thatthe impact that the recent positive trend in the summerSAM has had on near-surface temperatures varies con-siderably, even over such a relatively small area as thenorthern Antarctic Peninsula region. In this section,composite ERA-40 reanalysis fields are used to helpexplain why these regional differences exist by compar-ing summers with high and low SAM values. Compositeanalysis of the detrended data is employed because itallows for the nonlinear aspects of climate linkages—unlike linear regression—and is a convenient way ofshowing differences in the wind field between high andlow SAM summers. Note that because of the smallnumber of samples in the two categories, appropriatestatistics (e.g., Student’s t test) have not been calculatedto determine how well separated they are. Instead, themain features described are common to all the summersin one category unless mentioned otherwise.
Examination of the bias in the MSLP and near-surface temperature fields (Figs. 2 and 3) indicates thatit is not until 1979 that all significant trends in the biasend (e.g., near-surface temperatures at Faraday; Fig.3a). Therefore, the SAM was recalculated for summerdata from 1979 to 2000 using the methodology de-scribed by Marshall (2003). Those summers with a de-trended SAM index greater than 2 were considered tobe “high SAM” years (1981, 1982, and 2000) and thosewith an index less than �2 were considered to be “lowSAM” years (1985 and 1992) with the year referring tothe January–February of the summer. The ERA-40
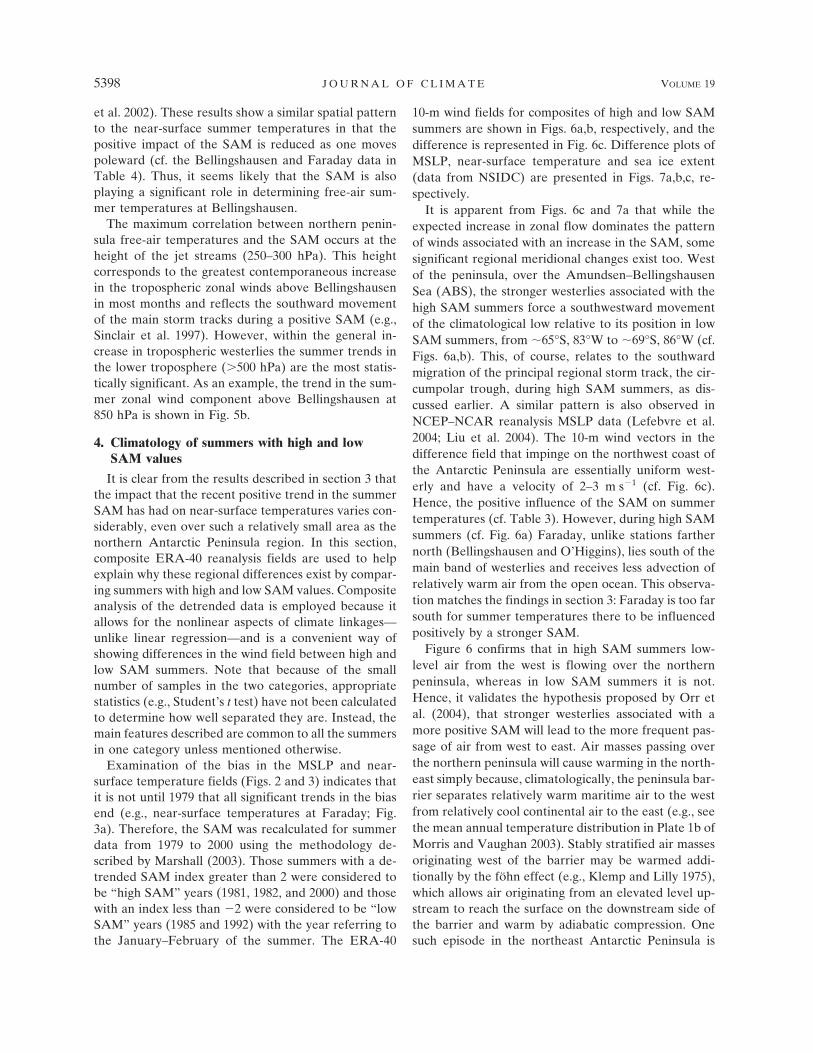
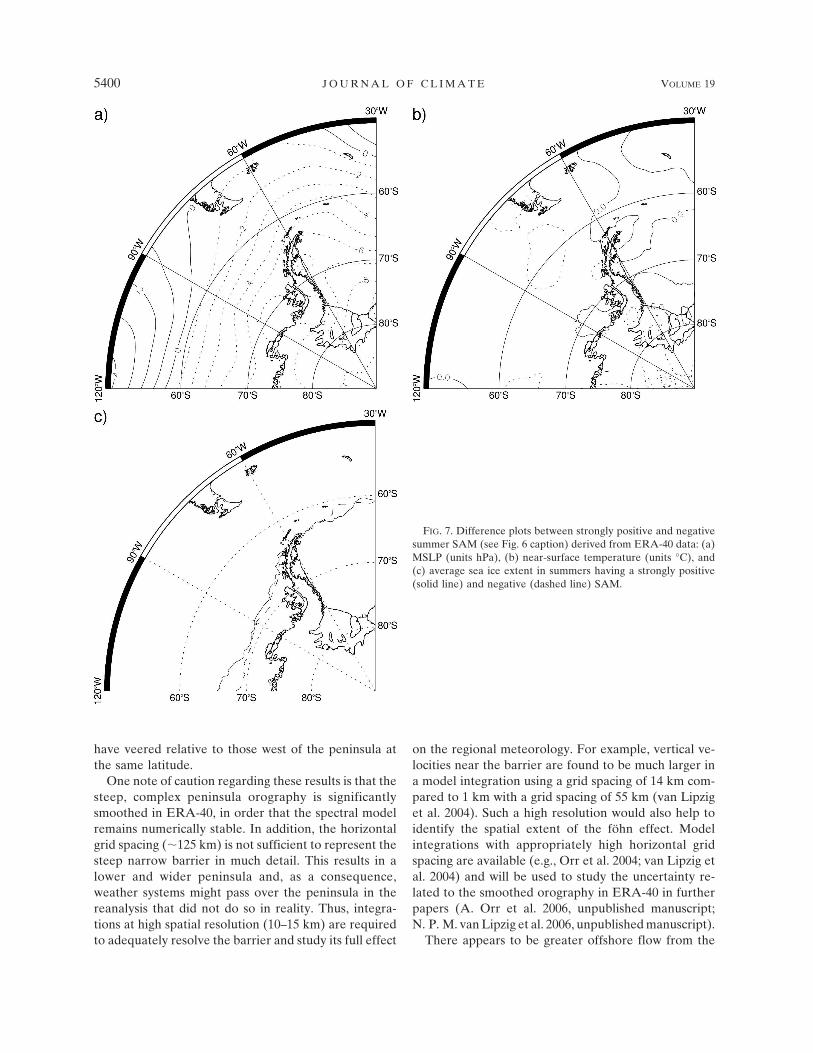
10-m wind fields for composites of high and low SAMsummers are shown in Figs. 6a,b, respectively, and thedifference is represented in Fig. 6c. Difference plots ofMSLP, near-surface temperature and sea ice extent(data from NSIDC) are presented in Figs. 7a,b,c, re-spectively.
It is apparent from Figs. 6c and 7a that while theexpected increase in zonal flow dominates the patternof winds associated with an increase in the SAM, somesignificant regional meridional changes exist too. Westof the peninsula, over the Amundsen–BellingshausenSea (ABS), the stronger westerlies associated with thehigh SAM summers force a southwestward movementof the climatological low relative to its position in lowSAM summers, from �65°S, 83°W to �69°S, 86°W (cf.Figs. 6a,b). This, of course, relates to the southwardmigration of the principal regional storm track, the cir-cumpolar trough, during high SAM summers, as dis-cussed earlier. A similar pattern is also observed inNCEP–NCAR reanalysis MSLP data (Lefebvre et al.2004; Liu et al. 2004). The 10-m wind vectors in thedifference field that impinge on the northwest coast ofthe Antarctic Peninsula are essentially uniform west-erly and have a velocity of 2–3 m s�1 (cf. Fig. 6c).Hence, the positive influence of the SAM on summertemperatures (cf. Table 3). However, during high SAMsummers (cf. Fig. 6a) Faraday, unlike stations farthernorth (Bellingshausen and O’Higgins), lies south of themain band of westerlies and receives less advection ofrelatively warm air from the open ocean. This observa-tion matches the findings in section 3: Faraday is too farsouth for summer temperatures there to be influencedpositively by a stronger SAM.
Figure 6 confirms that in high SAM summers low-level air from the west is flowing over the northernpeninsula, whereas in low SAM summers it is not.Hence, it validates the hypothesis proposed by Orr etal. (2004), that stronger westerlies associated with amore positive SAM will lead to the more frequent pas-sage of air from west to east. Air masses passing overthe northern peninsula will cause warming in the north-east simply because, climatologically, the peninsula bar-rier separates relatively warm maritime air to the westfrom relatively cool continental air to the east (e.g., seethe mean annual temperature distribution in Plate 1b ofMorris and Vaughan 2003). Stably stratified air massesoriginating west of the barrier may be warmed addi-tionally by the föhn effect (e.g., Klemp and Lilly 1975),which allows air originating from an elevated level up-stream to reach the surface on the downstream side ofthe barrier and warm by adiabatic compression. Onesuch episode in the northeast Antarctic Peninsula is
5398 J O U R N A L O F C L I M A T E VOLUME 19
reported in detail in Schwerdtfeger (1984). The impactthat air passing over the peninsula has on near-surfacetemperatures east of the barrier is confirmed by Fig. 7b,which illustrates the difference in near-surface tem-peratures between high and low SAM summers, andreveals a positive “bull’s-eye” in the northeast penin-sula that exceeds 0.5°C. This feature, which is commonto all high SAM summers, is further examined in sec-tion 5 using observations from Esperanza.
An interesting feature in Fig. 6a is the small cyclonicregion located east of the Larsen Ice Shelf (68°S,58°W), which is only apparent in high SAM summers(but can also be seen in Fig. 7a, the MSLP difference
plot). Note that it is weak in 1982 and particularly pro-nounced in 2000. As it is located east of a major topo-graphic barrier and associated with the passage of airover this barrier it seems highly likely that it representslee cyclogenesis, a process known to occur in this areabecause of its associated cloud signature in satellite im-agery (Turner et al. 1998). The conservation of poten-tial vorticity means that once an air mass has passedover a barrier its trajectory will have cyclonic curvatureand thus be deflected poleward (Holton 1992). This issuggested in the difference plot (Fig. 6c), which showsthat the 10-m winds immediately east of the peninsulaand north of the location of the area of lee cyclogenesis
FIG. 6. ERA-40 10-m winds associated with (a) strongly positiveSAM in summer (1981, 1982, and 2000); (b) strongly negativeSAM in summer (1985 and 1992), and (c) the resultant differenceplot. Strongly positive (negative) years (referring to the January–February) are defined as being greater than (less than) �2 (�2)based on a definition of the SAM from 1979 to 2000 that has beendetrended. Units are m s�1.
15 OCTOBER 2006 M A R S H A L L E T A L . 5399
have veered relative to those west of the peninsula atthe same latitude.
One note of caution regarding these results is that thesteep, complex peninsula orography is significantlysmoothed in ERA-40, in order that the spectral modelremains numerically stable. In addition, the horizontalgrid spacing (�125 km) is not sufficient to represent thesteep narrow barrier in much detail. This results in alower and wider peninsula and, as a consequence,weather systems might pass over the peninsula in thereanalysis that did not do so in reality. Thus, integra-tions at high spatial resolution (10–15 km) are requiredto adequately resolve the barrier and study its full effect
on the regional meteorology. For example, vertical ve-locities near the barrier are found to be much larger ina model integration using a grid spacing of 14 km com-pared to 1 km with a grid spacing of 55 km (van Lipziget al. 2004). Such a high resolution would also help toidentify the spatial extent of the föhn effect. Modelintegrations with appropriately high horizontal gridspacing are available (e.g., Orr et al. 2004; van Lipzig etal. 2004) and will be used to study the uncertainty re-lated to the smoothed orography in ERA-40 in furtherpapers (A. Orr et al. 2006, unpublished manuscript;N. P. M. van Lipzig et al. 2006, unpublished manuscript).
There appears to be greater offshore flow from the
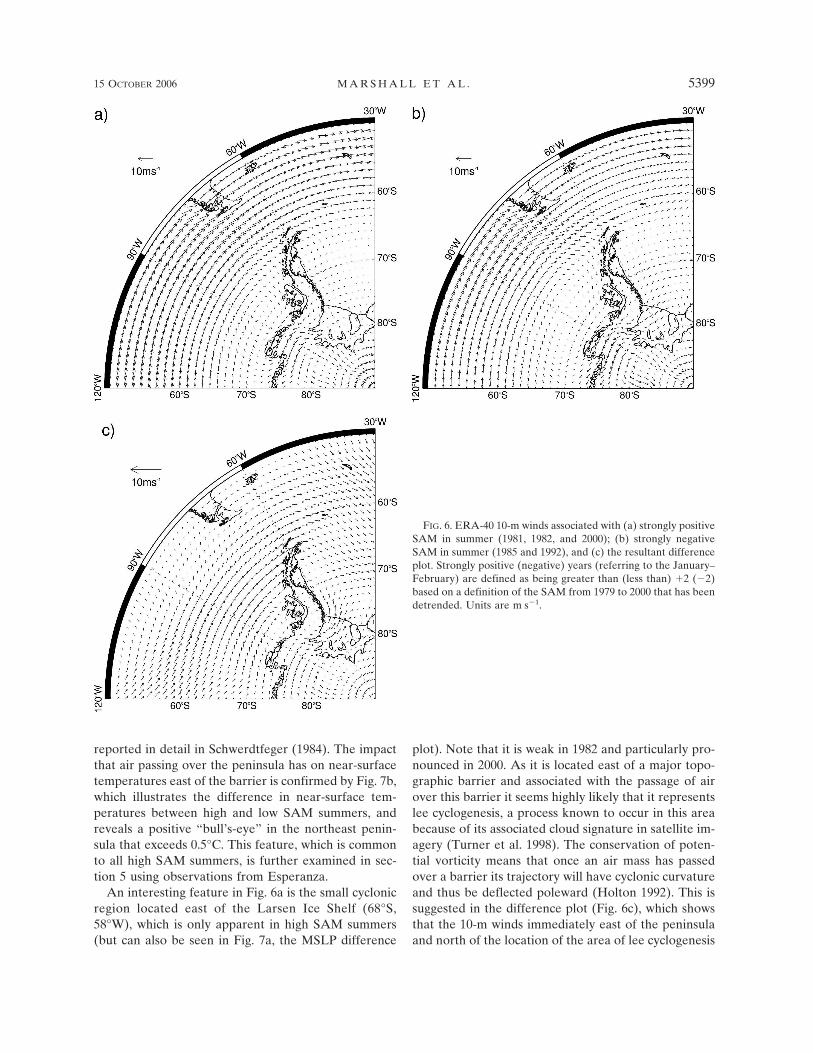
FIG. 7. Difference plots between strongly positive and negativesummer SAM (see Fig. 6 caption) derived from ERA-40 data: (a)MSLP (units hPa), (b) near-surface temperature (units °C), and(c) average sea ice extent in summers having a strongly positive(solid line) and negative (dashed line) SAM.
5400 J O U R N A L O F C L I M A T E VOLUME 19
Ronne Ice Shelf (76°S, 55°W) in the difference plot(Fig. 6c). Hence, in high SAM summers there is greateradvection of cold continental air northward over thesoutheastern peninsula in direct contrast to what ishappening in the northeast, as described previously.With the exceptions of this latter region and coastalEllsworth Land, situated in the far southwest, much ofthe Antarctic Peninsula shows a slight summer coolingassociated with high SAM, as revealed by the negativecorrelation at Faraday in Table 3.
Liu et al. (2004) showed that the circulation patternsassociated with a positive SAM produce a strong pole-ward mean heat flux into the Bellingshausen Sea thatlimits sea ice growth. Similarly, Lefebvre et al. (2004)demonstrated a negative correlation between the SAMand Bellingshausen Sea sea-ice concentration takenfrom the First Hadley Centre Sea Ice and Sea SurfaceTemperature (HadISST1) dataset in the January–March period for 1980–99. There is no evidence of thisrelationship from the limited years used to produce Fig.7c, with very similar mean summer sea ice extent im-mediately west of the peninsula in high and low SAMsummers. Moreover, differences in extent immediatelyeast of the peninsula, in the western Weddell Sea, aresimilarly small. The duration of the summer minimumin sea ice was also examined but, within the limitationsof the monthly resolution of the NSIDC data, againthere does not appear to be any significant differencesrelated to the magnitude of the detrended SAM. Therelatively small differences suggest that, in terms ofgoverning the summer temperatures in the very north-ern part of the peninsula, SAM-related changes in theregional surface energy balance due to variations in seaice extent and duration are less important than the in-crease in warm air advection due to stronger westerlies.
5. Discussion and conclusions
The two northernmost sections of the Larsen IceShelf collapsed in January 1995 and February–March2002, respectively, and these 2 yr had the warmest sum-mer temperatures on record at nearby Esperanza sta-tion (cf. Fig. 4a). This association provides a persuasiveargument that rising summer temperatures in thenortheast Antarctic Peninsula have played the majorrole in the breakup of the Larsen, by providing thesurface meltwater necessary for crevasse propagation(Scambos et al. 2000, 2003; van den Broeke 2005). Fur-thermore, recent papers have suggested that, as a con-sequence of the ice shelf collapse, regional glaciers haveaccelerated, at least temporarily, leading to a minor risein sea level (De Angelis and Skvarca 2003; Rignot et al.2004).
In this study we have demonstrated that the recentpositive change in the summer SAM and the resultantincrease in the circumpolar westerlies are physicalmechanisms responsible for increases in northern pen-insula temperatures in this season. Near-surface sum-mer temperatures at Esperanza are highly correlatedwith the SAM (r � 0.47–0.57, significant at �1% level)with 35%–60% of the summer warming at Esperanzabetween 1965 and 2000 (0.8°–1.3°C) estimated as beingdue to changes in the SAM.
A comparison of similar statistics at other stations inthe northern peninsula region demonstrates that theSAM has a far greater impact on near-surface tempera-tures on the eastern side than those on the west. Insummer the regression coefficient between the SAMand Esperanza (east) temperatures is 3 times theequivalent value for O’Higgins (west), despite thesetwo stations being separated by only 50 km and byorography less than 500 m MSL. The reasons for thismarked variation in the sensitivity of regional tempera-tures to the SAM are linked to the higher standarddeviation of temperatures east of the barrier, which, inturn, can be related to the hypothesis proposed by Orret al. (2004). They suggested that (i) beyond a criticalthreshold velocity, low-level westerlies will pass overthe peninsula rather than be blocked; and hence (ii)with the stronger summer westerlies associated with apositive trend in the SAM, this scenario has occurredmore frequently. Some indication of this can be seen inthe ERA-40 surface wind fields (Fig. 6), which showevidence of winds passing over the barrier—cycloniccurvature of winds east of the peninsula and lee cyclo-genesis—only in “high SAM” summers. There are twoprincipal reasons why the westerly advection of an airmass across the peninsula will lead to greater tempera-ture increases on the eastern side. First, climatologi-cally, temperatures at a given latitude tend to be ap-proximately 1°–2°C warmer on the western side(warmer maritime air) than on the east (cooler conti-nental air) so the warming in the east will be similarlygreater. Second, a föhn effect may cause further warm-ing of air masses crossing the barrier and descending,and this has been linked to enhanced surface melting onthe Larsen Ice Shelf (van den Broeke 2005).
To quantify the effect that the passage of air over thepeninsula has on near-surface temperatures east of thebarrier we compare near-surface observations of windsand temperature during the summer at Esperanza. Thedata comprise 6-hourly SYNOP observations and en-compass 16 summers from 1989 to 2004. Figure 8 showswind roses associated with temperatures above and be-low 1.1°C, the long-term (1945–present) upper-quartilesummer temperature at Esperanza. Strong downslope
15 OCTOBER 2006 M A R S H A L L E T A L . 5401
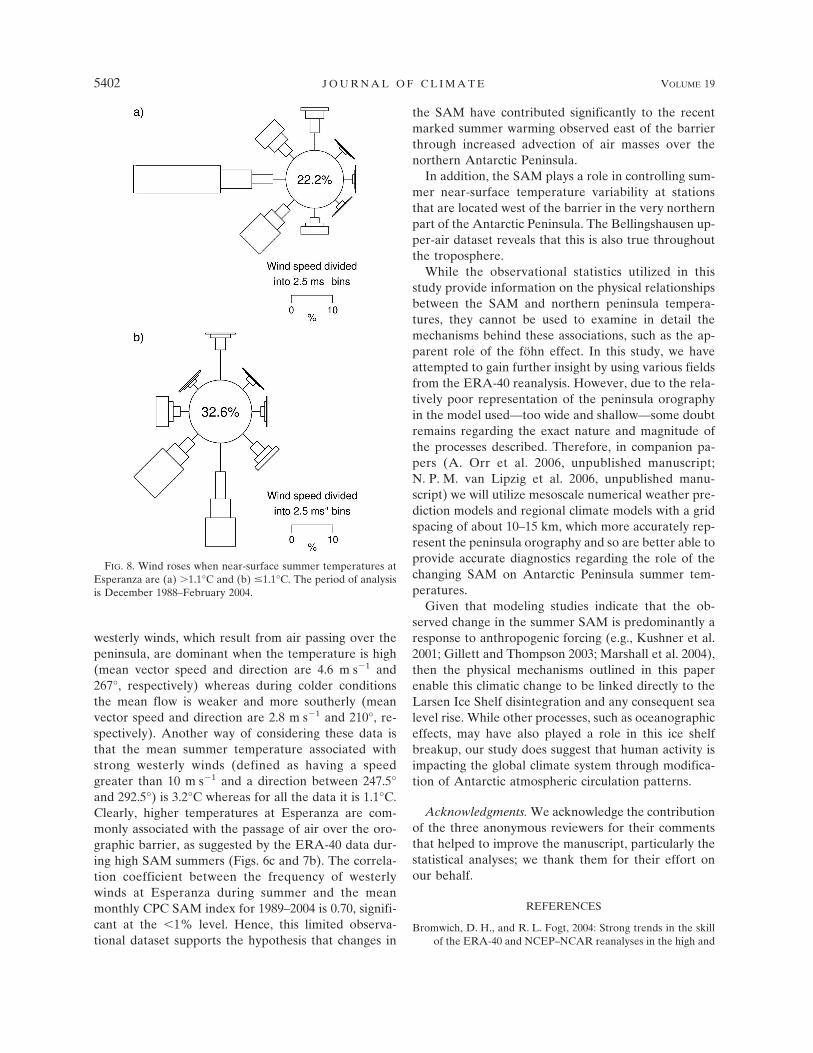
westerly winds, which result from air passing over thepeninsula, are dominant when the temperature is high(mean vector speed and direction are 4.6 m s�1 and267°, respectively) whereas during colder conditionsthe mean flow is weaker and more southerly (meanvector speed and direction are 2.8 m s�1 and 210°, re-spectively). Another way of considering these data isthat the mean summer temperature associated withstrong westerly winds (defined as having a speedgreater than 10 m s�1 and a direction between 247.5°and 292.5°) is 3.2°C whereas for all the data it is 1.1°C.Clearly, higher temperatures at Esperanza are com-monly associated with the passage of air over the oro-graphic barrier, as suggested by the ERA-40 data dur-ing high SAM summers (Figs. 6c and 7b). The correla-tion coefficient between the frequency of westerlywinds at Esperanza during summer and the meanmonthly CPC SAM index for 1989–2004 is 0.70, signifi-cant at the �1% level. Hence, this limited observa-tional dataset supports the hypothesis that changes in
the SAM have contributed significantly to the recentmarked summer warming observed east of the barrierthrough increased advection of air masses over thenorthern Antarctic Peninsula.
In addition, the SAM plays a role in controlling sum-mer near-surface temperature variability at stationsthat are located west of the barrier in the very northernpart of the Antarctic Peninsula. The Bellingshausen up-per-air dataset reveals that this is also true throughoutthe troposphere.
While the observational statistics utilized in thisstudy provide information on the physical relationshipsbetween the SAM and northern peninsula tempera-tures, they cannot be used to examine in detail themechanisms behind these associations, such as the ap-parent role of the föhn effect. In this study, we haveattempted to gain further insight by using various fieldsfrom the ERA-40 reanalysis. However, due to the rela-tively poor representation of the peninsula orographyin the model used—too wide and shallow—some doubtremains regarding the exact nature and magnitude ofthe processes described. Therefore, in companion pa-pers (A. Orr et al. 2006, unpublished manuscript;N. P. M. van Lipzig et al. 2006, unpublished manu-script) we will utilize mesoscale numerical weather pre-diction models and regional climate models with a gridspacing of about 10–15 km, which more accurately rep-resent the peninsula orography and so are better able toprovide accurate diagnostics regarding the role of thechanging SAM on Antarctic Peninsula summer tem-peratures.
Given that modeling studies indicate that the ob-served change in the summer SAM is predominantly aresponse to anthropogenic forcing (e.g., Kushner et al.2001; Gillett and Thompson 2003; Marshall et al. 2004),then the physical mechanisms outlined in this paperenable this climatic change to be linked directly to theLarsen Ice Shelf disintegration and any consequent sealevel rise. While other processes, such as oceanographiceffects, may have also played a role in this ice shelfbreakup, our study does suggest that human activity isimpacting the global climate system through modifica-tion of Antarctic atmospheric circulation patterns.
Acknowledgments. We acknowledge the contributionof the three anonymous reviewers for their commentsthat helped to improve the manuscript, particularly thestatistical analyses; we thank them for their effort onour behalf.
REFERENCES
Bromwich, D. H., and R. L. Fogt, 2004: Strong trends in the skillof the ERA-40 and NCEP–NCAR reanalyses in the high and
FIG. 8. Wind roses when near-surface summer temperatures atEsperanza are (a) �1.1°C and (b) �1.1°C. The period of analysisis December 1988–February 2004.
5402 J O U R N A L O F C L I M A T E VOLUME 19
middle latitudes of the Southern Hemisphere. J. Climate, 17,4603–4619.
Carvalho, L. M. V., C. Jones, and T. Ambrizzi, 2005: Oppositephases of the Antarctic Oscillation and relationships withintraseasonal to interannual activity in the Tropics during theaustral summer. J. Climate, 18, 702–718.
Comiso, J. C., 1995: SSM/I concentrations using the BootstrapAlgorithm. NASA Ref. Publ. 1380, 49 pp.
De Angelis, H., and P. Skvarca, 2003: Glacier surge after ice shelfcollapse. Science, 299, 1560–1562.
Domack, E., and Coauthors, 2005: Stability of the Larsen B iceshelf on the Antarctic Peninsula during the Holocene epoch.Nature, 436, 681–685.
Gillett, N. P., and D. W. J. Thompson, 2003: Simulation of recentSouthern Hemisphere climate change. Science, 302, 273–275.
Gong, D., and S. Wang, 1999: Definition of Antarctic oscillationindex. Geophys. Res. Lett., 26, 459–462.
Hansen, J., R. Ruedy, M. Sato, M. Imhoff, W. Lawrence, D. East-erling, T. Peterson, and T. Karl, 2001: A closer look at UnitedStates and global surface temperature change. J. Geophys.Res., 106, 23 947–23 963.
Holton, J. R., 1992: An Introduction to Dynamic Meteorology. 3ded. Academic Press, 511 pp.
Jacobs, S. S., and J. C. Comiso, 1997: Climate variability in theAmundsen and Bellingshausen Seas. J. Climate, 10, 697–709.
Jones, J. M., and M. Widmann, 2004: Early peak in Antarcticoscillation index. Nature, 432, 290–291.
Jones, P. D., and A. Moberg, 2003: Hemispheric and large-scalesurface air temperature variations: An extensive revision andan update to 2001. J. Climate, 16, 206–223.
King, J. C., 1994: Recent climate variability in the vicinity of theAntarctic Peninsula. Int. J. Climatol., 14, 357–369.
——, and J. C. Comiso, 2003: The spatial coherence of interannualtemperature variations in the Antarctic Peninsula. Geophys.Res. Lett., 30, 1040, doi:10.1029/2002GL015580.
——, J. Turner, G. J. Marshall, W. M. Connolley, and T. A.Lachlan-Cope, 2003: Antarctic Peninsula climate variabilityand its causes as revealed by instrumental records. AntarcticPeninsula Climate Variability, E. Domack et al., Eds., Ant-arctic Research Series, Vol. 79, Amer. Geophys. Union,17�30.
Klemp, J. B., and D. R. Lilly, 1975: The dynamics of wave-induceddownslope winds. J. Atmos. Sci., 32, 320–339.
Kushner, P. J., I. M. Held, and T. L. Delworth, 2001: SouthernHemisphere atmospheric circulation response to globalwarming. J. Climate, 14, 2238–2249.
Kwok, R., and J. C. Comiso, 2002: Spatial patterns of variability inAntarctic surface temperature: Connections to the SouthernHemisphere Annular Mode and the Southern Oscillation.Geophys. Res. Lett., 29, 1705, doi:10.1029/2002GL015415.
Lanzante, J. R., 1996: Resistant, robust and non-parametric tech-niques for the analysis of climate data: Theory and examplesincluding applications to historical radiosonde station data.Int. J. Climatol., 16, 1197–1226.
Lefebvre, W., H. Goosse, R. Timmermann, and T. Fichefet, 2004:Influence of the Southern Annular Mode on the sea ice-ocean system. J. Geophys. Res., 109, C09005, doi:10.1029/2004JC002403.
L’Heureux, M. L., and D. W. J. Thompson, 2006: Observed rela-tionships between the El Niño–Southern Oscillation and theextratropical zonal-mean circulation. J. Climate, 19, 276–287.
Liu, J., J. A. Curry, and D. G. Martinson, 2004: Interpretation of
recent Antarctic sea ice variability. Geophys. Res. Lett., 31,L02205, doi:10.1029/2003GL018732.
Marshall, G. J., 2002: Analysis of recent circulation and thermaladvection change in the northern Antarctic Peninsula. Int. J.Climatol., 22, 1557–1567.
——, 2003: Trends in the Southern Annular Mode from observa-tions and reanalyses. J. Climate, 16, 4134–4143.
——, V. Lagun, and T. A. Lachlan-Cope, 2002: Changes in Ant-arctic Peninsula tropospheric temperatures from 1956 to1999: A synthesis of observations and reanalysis data. Int. J.Climatol., 22, 291–310.
——, P. A. Stott, J. Turner, W. M. Connolley, J. C. King, andT. A. Lachlan-Cope, 2004: Causes of exceptional circulationchanges in the Southern Hemisphere. Geophys. Res. Lett., 31,L14205, doi:10.1029/2004GL0199952.
Met Office, 1979: Handbook of Weather Messages Part III Coding.6th ed. Her Majesty’s Stationary Office, 136 pp.
Morris, E. M., and D. G. Vaughan, 2003: Spatial and temporalvariation of surface temperature on the Antarctic Peninsulaand the limit of viability of ice shelves. Antarctic PeninsulaClimate Variability, E. Domack et al., Eds., Antarctic Re-search Series, Vol. 79, Amer. Geophys. Union, 61�68.
Orr, A., D. Cresswell, G. J. Marshall, J. C. R. Hunt, J. Sommeria,C. G. Wang, and M. Light, 2004: A “low-level” explanationfor the recent large warming trend over the western AntarcticPeninsula involving blocked winds and changes in zonal cir-culation. Geophys. Res. Lett., 31, L06204, doi:10.1029/2003GL019160.
Rignot, E., G. Casassa, P. Gogineni, W. Krabill, A. Rivera, and R.Thomas, 2004: Accelerated ice discharge from the AntarcticPeninsula following the collapse of Larsen B ice shelf. Geo-phys. Res. Lett., 31, L18401, doi:10.1029/2004GL020697.
Santer, B. D., T. M. L. Wigley, J. S. Boyle, D. J. Gaffen, J. J.Hnilo, D. Nychka, D. E. Parker, and K. E. Taylor, 2000: Sta-tistical significance of trends and trend differences in layer-average atmospheric temperature time series. J. Geophys.Res., 105, 7337–7356.
Scambos, T. A., C. Hulbe, M. Fahnestock, and J. Bohlander, 2000:The link between climate warming and break-up of iceshelves in the Antarctic Peninsula. J. Glaciol., 46, 516–530.
——, ——, and ——, 2003: Climate-induced ice shelf disintegra-tion in the Antarctic Peninsula. Antarctic Peninsula ClimateVariability, E. Domack et al., Eds., Antarctic Research Se-ries, Vol. 79, Amer. Geophys. Union, 79–92.
——, J. A. Bohlander, C. A. Shuman, and P. Skvarca, 2004: Gla-cier acceleration and thinning after ice shelf collapse in theLarsen B embayment, Antarctica. Geophys. Res. Lett., 31,L18402, doi:10.1029/2004GL020670.
Schneider, D. P., E. J. Steig, and J. C. Comiso, 2004: Recent cli-mate variability in Antarctica from satellite-derived tempera-ture data. J. Climate, 17, 1569–1583.
Schwerdtfeger, W., 1984: Weather and Climate of the Antarctic.Elsevier, 261 pp.
Shepherd, A., D. Wingham, T. Payne, and P. Skvarca, 2003:Larsen Ice Shelf has progressively thinned. Science, 302, 856–859.
Shindell, D. T., and G. A. Schmidt, 2004: Southern Hemisphereclimate response to ozone changes and greenhouse gas in-creases. Geophys. Res. Lett., 31, L18209, doi:10.1029/2004GL020724.
Sinclair, M. R., J. A. Renwick, and J. W. Kidson, 1997: Low-frequency variability of Southern Hemisphere sea level pres-
15 OCTOBER 2006 M A R S H A L L E T A L . 5403
sure and weather system activity. Mon. Wea. Rev., 125, 2531–2543.
Thompson, D. W. J., and J. M. Wallace, 2000: Annular modes inthe extratropical circulation. Part I: Month-to-month vari-ability. J. Climate, 13, 1000–1016.
——, and S. Solomon, 2002: Interpretation of recent SouthernHemisphere climate change. Science, 296, 895–899.
Turner, J., G. J. Marshall, and T. A. Lachlan-Cope, 1998: Analysisof synoptic-scale low pressure systems within the AntarcticPeninsula sector of the circumpolar trough. Int. J. Climatol.,18, 253–280.
——, and Coauthors, 2004: The SCAR READER project: To-ward a high-quality data base of mean Antarctic meteoro-logical observations. J. Climate, 17, 2890–2898.
——, and Coauthors, 2005: Antarctic climate change during thelast 50 years. Int. J. Climatol., 25, 279–294.
Uppala, S. M., and Coauthors, 2005. The ERA-40 re-analysis.Quart. J. Roy. Meteor. Soc., 131, 2961–3012.
van den Broeke, M. R., 2000: The semi-annual oscillation and
Antarctic climate. Part 3: The role of near-surface wind speedand cloudiness. Int. J. Climatol., 20, 117–130.
——, 2005: Strong surface melting preceded collapse of AntarcticPeninsula ice shelf. Geophys. Res. Lett., 32, L12815,doi:10.1029/2005GL023247.
——, and N. P. M. van Lipzig, 2003: Response of wintertimeAntarctic temperatures to the Antarctic Oscillation: Resultsof a regional climate model. Antarctic Peninsula ClimateVariability, E. Domack et al., Eds., Antarctic Research Se-ries, Vol. 79, Amer. Geophys. Union, 43�58.
van Lipzig, N. P. M., J. C. King, T. A. Lachlan-Cope, and M. R.van den Broeke, 2004: Precipitation, sublimation and snow-drift in the Antarctic Peninsula region from a regional atmo-spheric model. J. Geophys. Res., 109, D24106, doi:10.1029/2004JD004701.
Vaughan, D. G., and Coauthors, 2003: Recent rapid regional cli-mate warming on the Antarctic Peninsula. Climate Change,60, 243–274.
5404 J O U R N A L O F C L I M A T E VOLUME 19