Embed Size (px)
Citation preview
Ts
Aa
b
c
a
ARRAA
KCCT
1
mhacenI
sHobfaS
etTTho
0d
Journal of Health Economics 30 (2011) 695– 706
Contents lists available at ScienceDirect
Journal of Health Economics
j ourna l ho me page: www.elsev ier .com/ locate /econbase
he impact of comparative effectiveness research on health and health carepending�,��
nirban Basua, Anupam B. Jenab, Tomas J. Philipsonc,∗
University of Washington, United StatesHarvard University, United StatesUniversity of Chicago, Chicago, United States
r t i c l e i n f o
rticle history:eceived 28 December 2009eceived in revised form 23 May 2011
a b s t r a c t
Comparative effectiveness research (CER) is thought to identify what works and does not work in healthcare. We interpret CER as infusing evidence on product quality into markets, shifting the relative demandfor products in CER studies. We analyze how shifts in demand affect health and health care spending and
ccepted 25 May 2011vailable online 1 June 2011
eywords:ost-effectiveness analysis
demonstrate that CER may raise or lower overall health when treatments have heterogeneous effects, butpayers respond with product-specific coverage policies. Among patients with schizophrenia, we calibratethat subsidy policies based on the clinical trial CATIE may have reduced overall health by inducing somepatients to switch away from schizophrenia treatments that were effective for them towards winners ofthe CER.
tynA2a
omparative effectiveness analysisechnology assessment
. Introduction
Driven by rising costs of health care and growing concern thatuch of this spending could be reduced without detriment to
ealth, comparative effectiveness research (CER) has been offereds a means to identify what works and does not work in healthare. Although not explicitly inclusive of costs, proponents of CER
nvision better value in health care by eliminating care which iso more effective than cheaper alternatives (FCCCER Report, 2009;OM, 2009). Indeed, although public technology assessments in
� We are thankful for comments from the referees, Editor Tom McGuire, andeminar participants at the 2009 Annual Health Economics Meeting, 2010 NBERealth Care Meetings, 2010 ASHE Meetings, 2010 AdvaMed Meetings, Universityf Chicago, Rice University, University of Houston, and the Wharton School. Weenefited from research assistance by Cindy Yuan. Dr. Basu acknowledges supportrom the National Institute of Mental Health (1R01MH083706 – 01). Dr. Philipsoncknowledges support from the Stigler Center for Study of the Economy and thetate at the University of Chicago as well as the National Pharmaceutical Council.�� The statements, findings, conclusions, views, and opinions contained andxpressed in this article are based in part on data obtained under license fromhe following IMS Health Incorporated information service(s): National Disease andherapeutic IndexTM (2003–2008), IMS Health Incorporated. All Rights Reserved.he statements, findings, conclusions, views, and opinions contained and expressederein are not necessarily those of IMS Health Incorporated or any of its affiliatedr subsidiary entities.∗ Corresponding author. Tel.: +1 773 702 9128; fax: +1 773 702 0926.
E-mail address: [email protected] (T.J. Philipson).
arhAsmbaa
apar
1Od
(
167-6296/$ – see front matter © 2011 Elsevier B.V. All rights reserved.oi:10.1016/j.jhealeco.2011.05.012
© 2011 Elsevier B.V. All rights reserved.
he US have been heavily debated in the past,1 the last severalears have witnessed unprecedented public support for CER, mostotably through the 2009 American Recovery and Reinvestmentct which allocated about $1 billion towards this research and the010 Patient Protection and Affordable Care Act which established
national center to support CER (Clancy and Collins, 2010).Although CER has been positioned as a means to improve health
nd potentially lower health care costs, how the market itself willespond to this information and what those responses will mean forealth care spending and patient health has not been fully explored.t a first pass, the dissemination of CER may be viewed as an infu-ion of quality evidence into the market place with predictablearket consequences. Winners and losers of CER studies would
e expected to face higher and lower demand, respectively, withn impact on total spending that depends on the subsequent pricesnd quantities of the product and its competitors.
In addition, CER may not only impact market demand of patientsnd doctors, but may also affect payer coverage policy. For exam-
le, health plans may choose to cover only those treatments whichre shown to be comparatively effective on average in CER studies,esulting in co-pay or coverage differences between treatments.21 Debates on public technology assessment in the US date back to at least the970s with the National Center for Health Services Research and the US Congressffice of Technology Assessment. See Malani and Philipson (2011) for a moreetailed discussion.2 The Affordable Care Act of 2009 does allow for such provisions in Section 1182
a).
6 lth Eco
Hcc
soaThtUtteC
tmhlsawo
thiraednsttte
mcufmfit
tpetmsbian
sppodao
cehctpttv
td
2a
2
fhbwhm
2aarc
nvipp
ddnonecotaf
uc
z
wedence (wi).3 New evidence may be CER demonstrating higher lifeexpectancy associated with one treatment relative to its compara-tor in a randomized controlled trial. Eq. (1) states that new evidence
96 A. Basu et al. / Journal of Hea
ow producers of treatments evaluated by CER will respond to suchoverage policies makes the expected market response to CER moreomplex than previously recognized.
The impact of CER on overall patient health, as opposed to healthpending, is equally important to understand. By eliminating usef treatments which are ineffective, proponents of CER intuitivelyrgue that health will be improved by CER, or at least not worsened.his seemingly straightforward point fails to consider, however,ow overall patient health is affected when patients respond toreatments differently and coverage decisions are product-specific.nder some CER designs, coverage policies responding to average
reatment responses may be useful in identifying which treatmentso attempt first. However they may preclude important health ben-fits from accruing to patients for which the losing treatments ofER studies are most appropriate.
In this paper, we develop a quantitative framework to studyhe impact of CER on patient health and health care spending. Our
ain contributions are to recognize that the infusion of CER intoealth care markets will be met by market responses and to ana-
yze the implications of those responses for health and health carepending. These responses will depend on how patients, doctors,nd payers react to the new quality evidence generated by CER andhether coverage decisions are based on average effectiveness or
ther summary statistics that mask individual differences.The paper may be briefly outlined as follows. Section 2 specifies
he model that allows us to explore how the infusion of CER intoealth care markets will affect the prices, quantities, and spend-
ng associated with products evaluated by CER. We first consideresponses by patients and doctors to new quality evidence gener-ted by CER studies. Generally, sales of winners of CER studies arexpected to rise and sales of losers expected to fall, implying unpre-ictable effects on total spending. While in competitive markets,ew CER evidence will raise overall health by leading patients toubstitute towards more effective treatments, the opposite may berue when there is monopoly power. New CER evidence may leado increases in market power that result in restrictions in quan-ity that dominate the expansion in demand arising from favorablevidence.
Section 3 extends this analysis to the dissemination of CER inarkets with third party payers, where the extent of coverage or
o-pays is based on the results of CER. Treatments that fare betternder CER would receive better coverage through either less strictormulary restrictions, fewer or no prior authorization require-
ents, or better tiering. CER now impacts the market in two ways:rst, by affecting patients and doctors and second, by impactinghird-party payers.
Section 4 explores how overall patient health is impacted whenreatments have heterogeneous effects but coverage decisions areroduct-specific and based on averages which mask those differ-nces. For example, a CER study may favor one treatment, deemedhe “winner” by average effectiveness, even though the best treat-
ent varies across patients. When coverage responds to new CERummary statistics, some patients may face higher prices for theirest therapy while others will see price reductions. This can have an
ndeterminate effect on health outcomes which depends on howppropriately patients were matched to treatments prior to theew CER.
Section 5 provides an illustrative empirical simulation ofpending and health responses to new CER in the market for anti-sychotic drugs, among the top spending classes overall and, inarticular, in Medicaid. The 2006 Clinical Anti-psychotic Trials
f Intervention Effectiveness (CATIE trial) generated considerableebate in Medicaid about coverage of second-generation (atypical)nti-psychotics which were shown in the trial to be as effectiven average but not more so than cheaper first-generation (typi-wo
nomics 30 (2011) 695– 706
al) anti-psychotics. Using the observed heterogeneity in treatmentffects demonstrated by the CATIE trial, we simulate the impact onealth outcomes and spending of a Medicaid policy which wouldover only the most cost-effective anti-psychotic in the CATIErial rather than allow patients and physicians to choose the anti-sychotic best suited for a given patient. In this case, we find thathe negative impact on health of incorrectly matching patients toreatments outweighs the reduction in spending by an amountalued at 5% of class spending.
Section 6 concludes by discussing future research in quanti-ative evaluation of CER and how such analysis may inform theevelopment of improved methods for CER.
. Impact of comparative effectiveness research on doctorsnd patients
.1. Basic framework
To illustrate ideas, this section specifies an economic frameworkor analyzing the impact of CER on health care spending and overallealth when treatments are privately purchased and not subsidizedy insurance. Our main result is that in competitive markets, CERill increase overall health but will have ambiguous effects on totalealth spending. In a subsequent section, we extend our theory toarkets with insurance.As a basic setup, consider two competing treatments (i = 1,
) with effectiveness q1 and q2, where effectiveness is defineds average effectiveness (e.g. average increase in life-expectancy)ssociated with use of a treatment. These treatments may rep-esent first and second generation treatments for a given clinicalondition.
We initially assume that a treatment’s true effectiveness doesot vary across patients, but that expectations of effectiveness doary. For example, a treatment may lead to identical improvementsn life expectancy across patients but may be perceived by bothatients and physicians as having different effectiveness based onrior beliefs and new evidence.
In this framework, demand for a given treatment i can beepicted Di(p, e) where p = (p1, p2) and e = (e1, e2) are price and evi-ence vectors. Market demand for a given treatment will dependot only on its own price and the price of its comparators, butn available quality evidence for all treatments. For example,ew favorable evidence on the benefits of a treatment would bexpected to increase its own demand while lowering that of itsompetitors, i.e. dDi(p, e)/dei > 0 and dDj(p, e)/dei < 0. The impactf favorable new evidence on treatment demand is analogous tohe impact of shifts in quality on product demand more gener-lly; demand for higher quality products will rise while demandor competitors will fall.
An example of such a demand function would be a Bayesianpdating model of population mean treatment effects. In such aase, the expected effectiveness of treatment i is given by:
i = (1 − wi)z0i + wiei (1)
here zi is expected effectiveness based on prior beliefs (z0i), new
vidence (ei), and the weight placed on prior beliefs versus new evi-
3 Specifically, under normal prior data likelihood conjugacy, w = (�2)/(�2 + s2/n),here �2 is the prior uncertainty about the mean effect, s2 is the standard deviation
f effect in the data (evidence) and n is the sample size for the data.
lth Eco
((
tcii
(
Tbc(s
puwav
2
datdaoIcbwc
2
ifias
tr
e
Tecuwa1
me(
(a
Thmws
g
d
(qioWsCl
r
d
Tgltctaseww
t(scsSWtsco
2m
When a producer of one treatment has market power, the intro-
A. Basu et al. / Journal of Hea
e) about a treatment will raise expectations about its effectivenessif ei > z0
i) as would more precise evidence (higher w).
Consider when patients care about perceived effectiveness of areatment net of price (pi) when making a decision between twoompeting treatments. Assume effectiveness can be denominatedn dollars. Treatment 1 would be chosen over treatment 2 wheneverts expected effectiveness net of price is greater: z1 − p1 ≥ z2 − p2 or
1 − w1)z01 + w1e1 − p1 ≥ (1 − w2)z0
2 + w2e2 − p2 (2)
reatments are more likely to be chosen when the prior expectedenefit is high (e.g. due to direct to consumer advertising or physi-ian detailing), new evidence is more favorable (e) or more precisew), or prices are low (p). We assume patients are always treatedo that the total volume of treatment is fixed.
If there is a population of patients who differs in unobservablerior beliefs and weights according to the distribution H(z0, w), thetility maximizing treatment choices of patients in this populationill generate market demands for each treatment given by D1(p, e)
nd D2(p, e), both a function of the observable price and evidenceectors.
.2. Impact of CER on health care spending and health
The infusion of new quality evidence through CER shifts theemand for treatments, D(p, e), and these demand shifts in turnffect health care spending and overall health.4 As in any market,he impact of shifts in demand on total spending and quantity willepend on how equilibrium quantities and prices of treatmentsre affected. Thus, changes in prices and quantities depend notnly on the demand response but also on the structure of supply.mportantly, the impact of shifts in demand for treatments that areompetitively supplied at marginal cost (e.g. generic drugs) maye different than for treatments that are supplied by producersith potential market power (e.g. branded drugs or devices). We
onsider each of these cases below.
.2.1. CER in competitive marketsEquilibrium prices and quantities will be determined by the
ntersection of supply and demand for each treatment. Recall werst consider the no-insurance case. Denoting equilibrium pricesnd quantities by (P1, P2) and (Y1, Y2), respectively, aggregatepending (S) and health (Q) will be given by:
S = S1 + S2 = Y1P1 + Y2P2Q = Q1 + Q2 = Y1q1 + Y2q2
(3)
Now suppose that the true quality of treatment 1 is greater thanreatment 2 (q1 > q2) and that new CER evidence e′ is generated inelative favor of treatment 1 so that:
′1 ≥ e1 and e′
2 ≤ e2 (4)
his evidence is assumed valid in the sense that the newly gen-rated evidence on the comparative effectiveness of treatmentsonforms with the true comparative effectiveness, though this wasnknown to the market previously. The introduction of this CERill impact equilibrium quantities of treatments, total spending,
nd total health. By increasing the relative demand for treatment, both the equilibrium quantity of treatment 1 that is demanded
4 Changes in demand and sales due to new quality information are common inedical product markets. For example, following the reports of the potential side
ffects of Avandia in 2007, it was reported that new prescriptions fell by about 40%Nissen and Wolsky, 2007).
dew
t
nomics 30 (2011) 695– 706 697
Y ′1) and spending on treatment 1 (S′
1) will rise, whereas quantitynd sales of treatment 2 (Y ′
2 and S′2, respectively) will fall:
Y ′1 > Y1 and Y ′
2 < Y2S′
1 > S1 and S′2 < S2
(5)
his will have two general effects. First, because q1 > q2, aggregateealth will rise (Q′ > Q) as patients switch from less effective treat-ent 2 to more effective treatment 1. Second, because sales of theinner of CER will rise while sales of the loser will fall, overall
pending will be ambiguously affected.If evidence is measured continuously, the total effect on aggre-
ate health of new CER evidence will be5:
Q =∑i=1,2
qi
∑j=1,2
dYi
dejdej =
∑i=1,2
qi
∑j=1,2
∑k=1,2
[∂Di
∂Pk
∂Pk
∂ej+ ∂Di
∂ej
]dej (6)
In competitive markets, overall health will generally risedQ > 0), with the size of the impact depending on the relativeualities of treatments, the direct effects of new evidence on shift-
ng relative demand (∂D/∂e), and the indirect effects of evidencen demand through changing equilibrium prices, (∂D/∂P)(∂P/∂e).hen marginal costs are increasing, so that supply is upward
loping, demand shifts due to new evidence will be moderated.onsequently, the overall demand response to evidence should be
ower in markets with less elastic supply.Similarly, the total derivative of aggregate spending with
espect to CER evidence will be:
S =∑i=1,2
Yi
∑j=1,2
∂Pi
∂ejdej +
∑i=1,2
Pi
∑j=1,2
∂Yi
∂ejdej (7)
his implies CER will generally have an ambiguous effect on aggre-ate spending because the sales of winners rise and the sales ofosers fall in response to new CER evidence. Under certain condi-ions, however, one can sign this effect. Consider when marginalosts are constant with free entry so that supply is perfectly elas-ic. Consequently, demand shifts due to new evidence will not haveny price effects ∂P/∂e = 0. Thus if the first treatment is more expen-ive, aggregate spending will rise as patients switch to the moreffective, but also more expensive, treatment. Similarly, when theinner of CER is also cheaper, the shift in demand towards theinner will reduce aggregate spending.
As a general rule, under perfectly elastic supply, when expensivereatments are shown to be more effective than previously believedthe first instance considered), total health will rise as will totalpending. An illustration of this may be automated implantableardiac defibrillators (AICDs), expensive devices which have beenhown to improve mortality in patients with severe heart failure.uch devices are expensive and cost-effective, but not cost-saving.hen treatments that are inexpensive are shown to be more effec-
ive than previously thought, total health will again rise but totalpending will fall. Generic medications which demonstrate effi-acy over expensive branded medications would be an examplef treatments that are both effective and cost-saving.
.2.2. CER in markets with differentiated products andarket-power
uction of new CER evidence will continue to have ambiguousffects on total spending but contrary to the competitive scenario,ill have ambiguous effects on total health as well. This occurs
5 Note that Yi = Di (P(e),e) where e and P are evidence and equilibrium price vec-ors, respectively.
6 lth Eco
wt
w2(a
Y
Hdlt
nq(
d
Iftida
w
d
at
dt
Y
wp
diuet1s
dqetlb(
3w
pdkt
tpirAgisogeprl
3d
crffosra
Wdptd
sRisttoLii
‘mstt(ai
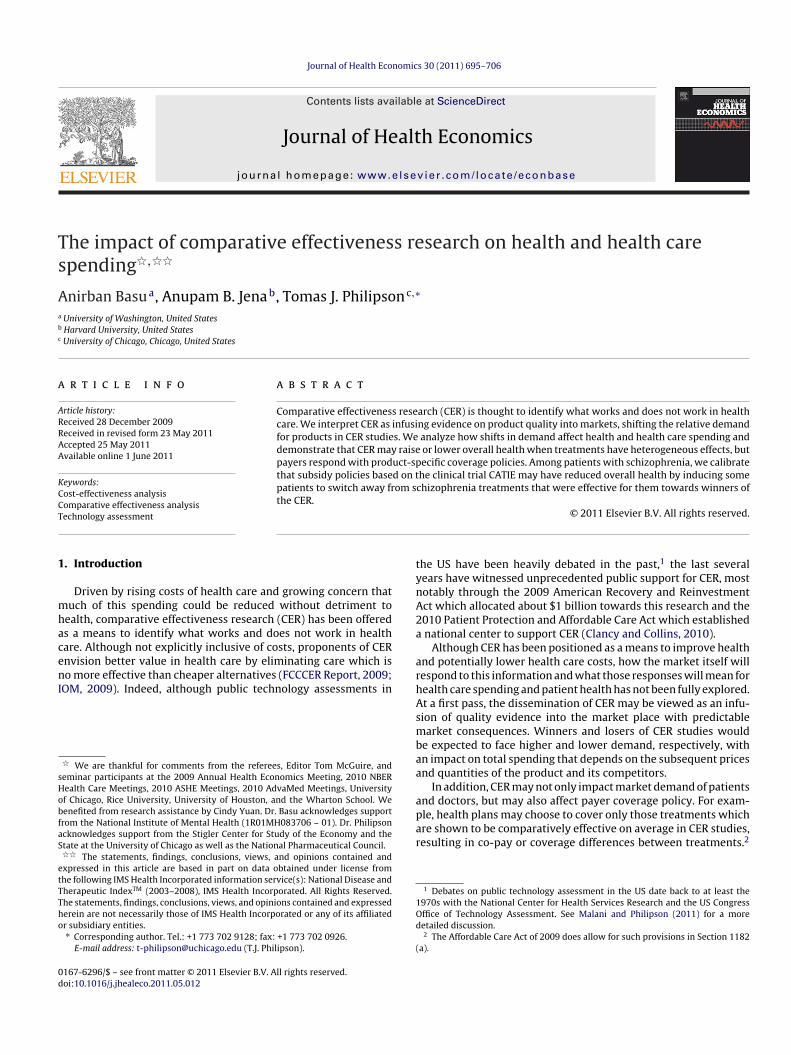
arincrease overall health compared to private responses alone.
98 A. Basu et al. / Journal of Hea
hen CER evidence increases demand for the winner of the CER,hereby potentially leading to restrictions in its quantity.
To illustrate, consider two treatments for a given disease, one ofhich is a second-generation medication under patent (treatment
) and the other of which is a first-generation medication off patenttreatment 1). At equilibrium prices P1(e) and P2(e), the quantitiesre:
1 = D1(P1(e), e) and Y2 = D2(P2(e), e) (8)
ere, equilibrium in the competitive market for treatment 1 isetermined by the intersection of supply and demand, and equi-
ibrium in the monopoly market for treatment 2 is determined byhe intersection of marginal revenue and marginal cost.
Unlike the case in which treatment 2 is competitively supplied,ew CER evidence favoring the treatment may lead to reductions inuantity if the effect on demand inelasticty generated by the CERprice effect) offsets the direct demand effect of new evidence:
Y2 =∑j=1,2
∑k=1,2
∂D2
∂Pk
∂Pk
∂ejdej +
∑j=1,2
∂D2
∂ejdej < 0 (9)
ntuitively, if new CER evidence confers additional market poweror the producer of treatment 2 (thereby making demand forreatment 2 more inelastic and raising price through dP2/de), thencrease in market power may lead to restrictions in quantity thatominate the expansion due to the demand-shift from new favor-ble CER evidence.
A reduction in the equilibrium quantity of treatment 2 (dY2 < 0)ill reduce overall health according to:
Q = q1dY1 + q2dY2 (10)
s patients substitute from the more-effective treatment 2 towardshe less-effective treatment 1 (dY1 + dY2 = 0 and q1 < q2).
This ambiguous impact of CER on aggregate health can be easilyemonstrated under constant marginal costs c = (c1, c2) for eachreatment, in which case equilibrium demand would be given by:
1 = D1(c1, e) and Y2 = D2(m(e)c2, e) (11)
here m(e) is the mark-up of price above costs and could dependositively on own-evidence and negatively on cross-evidence.
New CER evidence supporting treatment 2 would shift outemand for treatment 2 and shift in demand for treatment 1, rais-
ng the price of treatment 2 and leaving the price of treatment 1nchanged. If the mark-up were unchanged (i.e. not dependent onvidence), we would obtain our earlier result that the quantity ofreatment 2 demanded would rise and the quantity of treatment
demanded would fall, thereby raising overall health as patientsubstitute towards the more effective treatment 2.
If, however, new evidence supporting treatment 2 makesemand more inelastic and raises the mark-up, the equilibriumuantity of treatment 2 may fall. Intuitively, the demand-xpanding effect of CER may be dominated by the increase inhe monopolist mark-up. In this case, new CER evidence wouldower total health by shifting patients away from the more effectiveranded treatment (2) towards the less effective generic treatment1).
. Impact of comparative effectiveness research in marketsith insurance
In most countries, including the US, health care is subsidized;
roducers of treatments receive supply prices that exceed theemand prices paid by patients (e.g. co-pays). In subsidized mar-ets, CER may impact health care spending and health not onlyhrough the basic demand shifts of doctors and patients but also snomics 30 (2011) 695– 706
hrough changes in third party subsidies or coverage. For exam-le, treatments that are shown to be more effective than others
n CER may be subject to lower co-pays, fewer prior authorizationequirements, or more generous reimbursement of manufacturers.lthough the American Recovery and Reinvestment Act of 2009enerally discourages the use of CER in guiding Medicare coverage,t does not prohibit it completely (see footnote 4). Moreover, bothtate Medicaid programs and private insurers have routinely reliedn current evidence and costs to determine drug formularies. Moreenerally, the premise of value based insurance design (Fendrickt al., 2001) is to improve overall health by increasing access toroven effective therapies through lower co-payments or fewerestrictions. Such value based designs are therefore intimatelyinked to the impact of quality evidence generated on therapies.
.1. CER in competitive markets with value based insuranceesign
When the ‘winners’ of CER are subsidized, the previously dis-ussed impacts of CER on health care spending and health may beeinforced. For example, reconsider the perfectly competitive caserom earlier but now allow for third-party payer subsidies s = (s1, s2)or each treatment. For given subsidy levels s(e) that may dependn CER, let the equilibrium quantity be denoted by Y(s(e),e), whileupply and demand prices are denoted by PS(s(e),e) and PD(s(e),e),espectively. For each treatment, equilibrium is defined by demandnd supply prices and quantity that satisfy:
PS(s(e), e) = PD(s(e), e) + s(e)Y(s(e), e) = D(PD(s(e)), e) = S(PS(s(e)))
(12)
e here assume that supply does not depend on evidence as itoes not alter the cost of production. It is well known that, ceterisaribus, increasing the subsidy raises the supply price, lowershe demand price, and raises the equilibrium quantity: dPS/ds ≥ 0,PD/ds ≤ 0, dY/ds ≥ 0.
Now suppose that new CER evidence is published which demon-trates a greater effectiveness of treatment 1 over treatment 2.esponding to this information, suppose that third party payers
ncrease the subsidy towards treatment 1 (s′1 > s1) and lower the
ubsidy towards treatment 2 (s′2 < s2) in attempt to steer patients
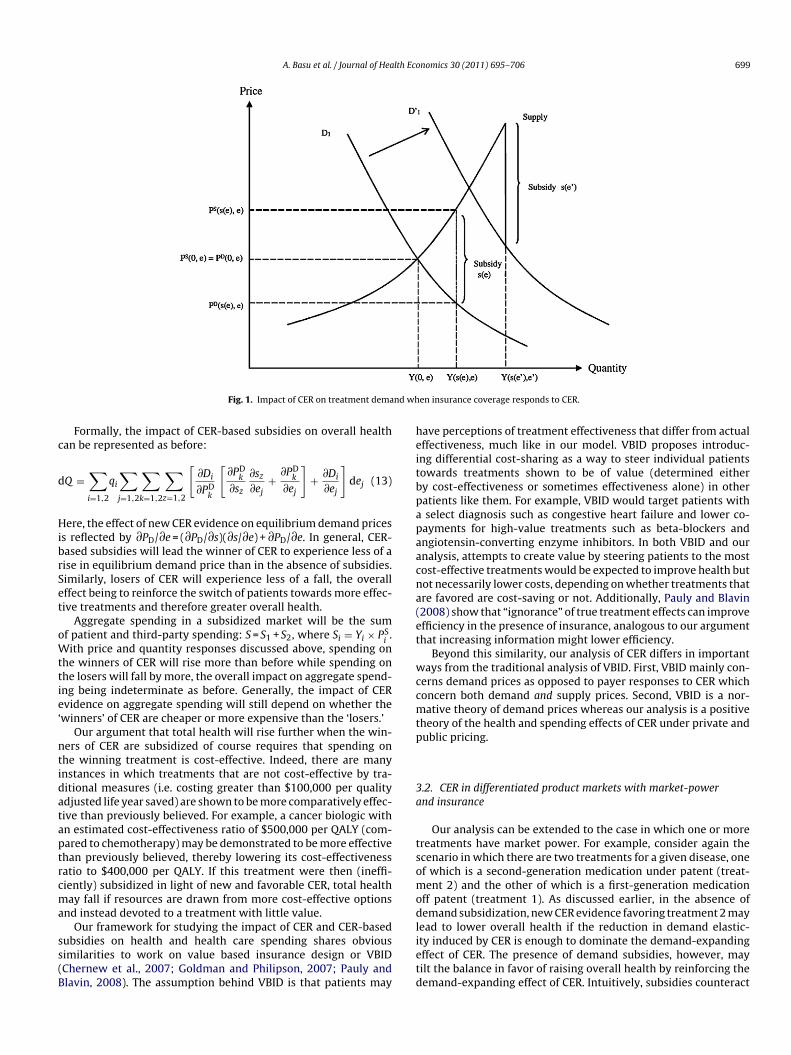
owards the newly demonstrated more effective treatment 1. Forreatment 1, the ‘winner’ of the CER, not only will demand shiftutwards as before, but the subsidy for the treatment will also rise.ikewise, for the ‘losing’ treatment 2, not only will demand shiftnwards as before, but the subsidy will also fall. These effects arellustrated in Fig. 1.
Fig. 1 demonstrates the impact on demand and supply for thewinning’ treatment of a CER study. Demand for the winning treat-
ent shift outwards, thereby increasing price and quantity, and theubsidy level also increases, reinforcing the effect on price and quan-ity. More precisely, under common models of the supply side,6
he effect on the quantity and supply price of winning treatment 1Y ′
1 − Y1 and P ′S1 − PS
1, respectively) will be larger when subsidies, inddition to demand, respond to CER evidence. Analogously, the falln the quantity and supply price of the losing treatment 2 (Y2 − Y ′
2nd PS
2 − P ′S2, respectively) will be larger with a negative subsidy
esponse as well. Subsidies which respond to CER will therefore
6 For example, this will be the case under competitive supply conditions whenupply prices satisfy Sk(PkS) = Dk(PS − s, e), k = 1, 2.
A. Basu et al. / Journal of Health Economics 30 (2011) 695– 706 699
nd wh
c
d
HibrSet
oWttie‘
ntidataptrcma
ss(B
heitbpapaacna(et
wccmtp
3a
tsomodl
Fig. 1. Impact of CER on treatment dema
Formally, the impact of CER-based subsidies on overall healthan be represented as before:
Q =∑i=1,2
qi
∑j=1,2
∑k=1,2
∑z=1,2
[∂Di
∂PDk
[∂PD
k
∂sz
∂sz
∂ej+ ∂PD
k
∂ej
]+ ∂Di
∂ej
]dej (13)
ere, the effect of new CER evidence on equilibrium demand pricess reflected by ∂PD/∂e = (∂PD/∂s)(∂s/∂e) + ∂PD/∂e. In general, CER-ased subsidies will lead the winner of CER to experience less of aise in equilibrium demand price than in the absence of subsidies.imilarly, losers of CER will experience less of a fall, the overallffect being to reinforce the switch of patients towards more effec-ive treatments and therefore greater overall health.
Aggregate spending in a subsidized market will be the sumf patient and third-party spending: S = S1 + S2, where Si = Yi × PS
i.
ith price and quantity responses discussed above, spending onhe winners of CER will rise more than before while spending onhe losers will fall by more, the overall impact on aggregate spend-ng being indeterminate as before. Generally, the impact of CERvidence on aggregate spending will still depend on whether the
winners’ of CER are cheaper or more expensive than the ‘losers.’Our argument that total health will rise further when the win-
ers of CER are subsidized of course requires that spending onhe winning treatment is cost-effective. Indeed, there are manynstances in which treatments that are not cost-effective by tra-itional measures (i.e. costing greater than $100,000 per qualitydjusted life year saved) are shown to be more comparatively effec-ive than previously believed. For example, a cancer biologic withn estimated cost-effectiveness ratio of $500,000 per QALY (com-ared to chemotherapy) may be demonstrated to be more effectivehan previously believed, thereby lowering its cost-effectivenessatio to $400,000 per QALY. If this treatment were then (ineffi-iently) subsidized in light of new and favorable CER, total healthay fall if resources are drawn from more cost-effective options
nd instead devoted to a treatment with little value.Our framework for studying the impact of CER and CER-based
ubsidies on health and health care spending shares obviousimilarities to work on value based insurance design or VBIDChernew et al., 2007; Goldman and Philipson, 2007; Pauly andlavin, 2008). The assumption behind VBID is that patients may
ietd
en insurance coverage responds to CER.
ave perceptions of treatment effectiveness that differ from actualffectiveness, much like in our model. VBID proposes introduc-ng differential cost-sharing as a way to steer individual patientsowards treatments shown to be of value (determined eithery cost-effectiveness or sometimes effectiveness alone) in otheratients like them. For example, VBID would target patients with
select diagnosis such as congestive heart failure and lower co-ayments for high-value treatments such as beta-blockers andngiotensin-converting enzyme inhibitors. In both VBID and ournalysis, attempts to create value by steering patients to the mostost-effective treatments would be expected to improve health butot necessarily lower costs, depending on whether treatments thatre favored are cost-saving or not. Additionally, Pauly and Blavin2008) show that “ignorance” of true treatment effects can improvefficiency in the presence of insurance, analogous to our argumenthat increasing information might lower efficiency.
Beyond this similarity, our analysis of CER differs in importantays from the traditional analysis of VBID. First, VBID mainly con-
erns demand prices as opposed to payer responses to CER whichoncern both demand and supply prices. Second, VBID is a nor-ative theory of demand prices whereas our analysis is a positive
heory of the health and spending effects of CER under private andublic pricing.
.2. CER in differentiated product markets with market-powernd insurance
Our analysis can be extended to the case in which one or morereatments have market power. For example, consider again thecenario in which there are two treatments for a given disease, onef which is a second-generation medication under patent (treat-ent 2) and the other of which is a first-generation medication
ff patent (treatment 1). As discussed earlier, in the absence ofemand subsidization, new CER evidence favoring treatment 2 may
ead to lower overall health if the reduction in demand elastic-
ty induced by CER is enough to dominate the demand-expandingffect of CER. The presence of demand subsidies, however, mayilt the balance in favor of raising overall health by reinforcing theemand-expanding effect of CER. Intuitively, subsidies counteract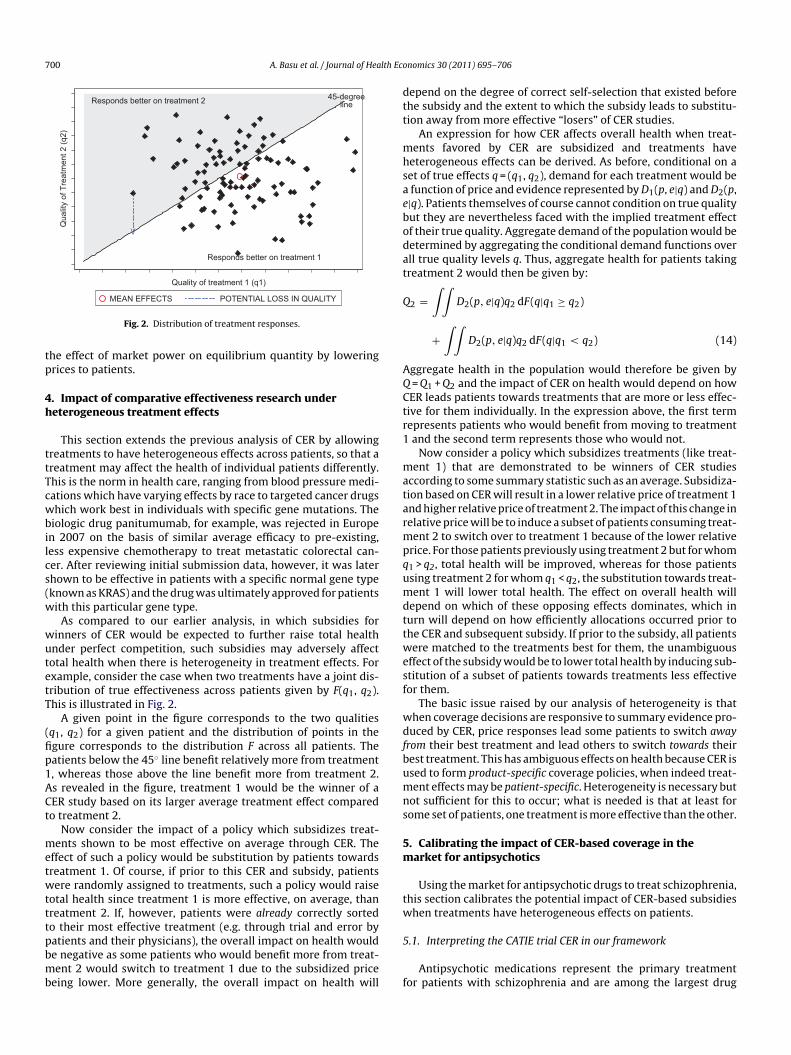
700 A. Basu et al. / Journal of Health Eco
Responds better on treatment 2
Responds better on treatment 1
45-degreeline
\/
Qua
lity
of T
reat
men
t 2 (q
2)
Quality of treatment 1 (q1)
tp
4h
ttTcwbilcs(w
wutetT
(fip1ACt
metwtttpbmb
dtt
mhsaebodat
Q
AQCtr1
matarmpqumdttwesf
wdfbumns
5m
tw
POTENTIAL LOSS IN QUALITYMEAN EFFECTS
Fig. 2. Distribution of treatment responses.
he effect of market power on equilibrium quantity by loweringrices to patients.
. Impact of comparative effectiveness research undereterogeneous treatment effects
This section extends the previous analysis of CER by allowingreatments to have heterogeneous effects across patients, so that areatment may affect the health of individual patients differently.his is the norm in health care, ranging from blood pressure medi-ations which have varying effects by race to targeted cancer drugshich work best in individuals with specific gene mutations. The
iologic drug panitumumab, for example, was rejected in Europen 2007 on the basis of similar average efficacy to pre-existing,ess expensive chemotherapy to treat metastatic colorectal can-er. After reviewing initial submission data, however, it was laterhown to be effective in patients with a specific normal gene typeknown as KRAS) and the drug was ultimately approved for patientsith this particular gene type.
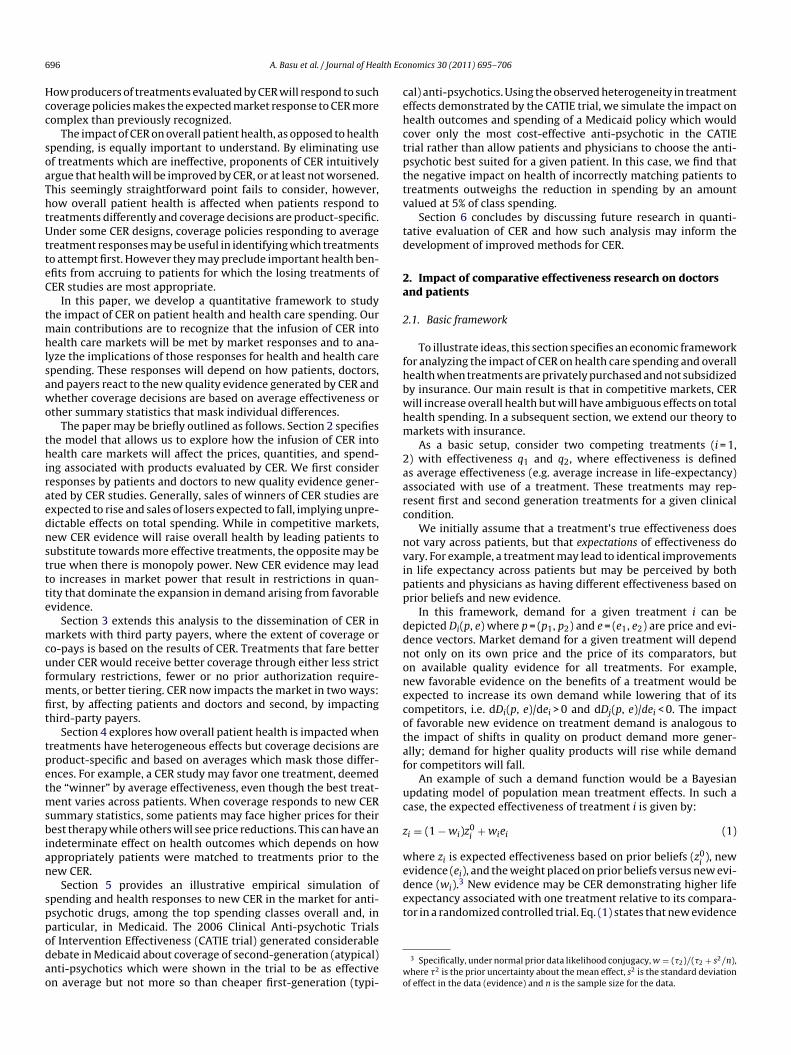
As compared to our earlier analysis, in which subsidies forinners of CER would be expected to further raise total healthnder perfect competition, such subsidies may adversely affectotal health when there is heterogeneity in treatment effects. Forxample, consider the case when two treatments have a joint dis-ribution of true effectiveness across patients given by F(q1, q2).his is illustrated in Fig. 2.
A given point in the figure corresponds to the two qualitiesq1, q2) for a given patient and the distribution of points in thegure corresponds to the distribution F across all patients. Theatients below the 45◦ line benefit relatively more from treatment, whereas those above the line benefit more from treatment 2.s revealed in the figure, treatment 1 would be the winner of aER study based on its larger average treatment effect comparedo treatment 2.
Now consider the impact of a policy which subsidizes treat-ents shown to be most effective on average through CER. The
ffect of such a policy would be substitution by patients towardsreatment 1. Of course, if prior to this CER and subsidy, patientsere randomly assigned to treatments, such a policy would raise
otal health since treatment 1 is more effective, on average, thanreatment 2. If, however, patients were already correctly sortedo their most effective treatment (e.g. through trial and error by
atients and their physicians), the overall impact on health woulde negative as some patients who would benefit more from treat-ent 2 would switch to treatment 1 due to the subsidized priceeing lower. More generally, the overall impact on health will
5
f
nomics 30 (2011) 695– 706
epend on the degree of correct self-selection that existed beforehe subsidy and the extent to which the subsidy leads to substitu-ion away from more effective “losers” of CER studies.
An expression for how CER affects overall health when treat-ents favored by CER are subsidized and treatments have
eterogeneous effects can be derived. As before, conditional on aet of true effects q = (q1, q2), demand for each treatment would be
function of price and evidence represented by D1(p, e|q) and D2(p,|q). Patients themselves of course cannot condition on true qualityut they are nevertheless faced with the implied treatment effectf their true quality. Aggregate demand of the population would beetermined by aggregating the conditional demand functions overll true quality levels q. Thus, aggregate health for patients takingreatment 2 would then be given by:
2 =∫ ∫
D2(p, e|q)q2 dF(q|q1 ≥ q2)
+∫ ∫
D2(p, e|q)q2 dF(q|q1 < q2) (14)
ggregate health in the population would therefore be given by = Q1 + Q2 and the impact of CER on health would depend on howER leads patients towards treatments that are more or less effec-ive for them individually. In the expression above, the first termepresents patients who would benefit from moving to treatment
and the second term represents those who would not.Now consider a policy which subsidizes treatments (like treat-
ent 1) that are demonstrated to be winners of CER studiesccording to some summary statistic such as an average. Subsidiza-ion based on CER will result in a lower relative price of treatment 1nd higher relative price of treatment 2. The impact of this change inelative price will be to induce a subset of patients consuming treat-ent 2 to switch over to treatment 1 because of the lower relative
rice. For those patients previously using treatment 2 but for whom1 > q2, total health will be improved, whereas for those patientssing treatment 2 for whom q1 < q2, the substitution towards treat-ent 1 will lower total health. The effect on overall health will
epend on which of these opposing effects dominates, which inurn will depend on how efficiently allocations occurred prior tohe CER and subsequent subsidy. If prior to the subsidy, all patientsere matched to the treatments best for them, the unambiguous
ffect of the subsidy would be to lower total health by inducing sub-titution of a subset of patients towards treatments less effectiveor them.
The basic issue raised by our analysis of heterogeneity is thathen coverage decisions are responsive to summary evidence pro-uced by CER, price responses lead some patients to switch away
rom their best treatment and lead others to switch towards theirest treatment. This has ambiguous effects on health because CER issed to form product-specific coverage policies, when indeed treat-ent effects may be patient-specific. Heterogeneity is necessary but
ot sufficient for this to occur; what is needed is that at least forome set of patients, one treatment is more effective than the other.
. Calibrating the impact of CER-based coverage in thearket for antipsychotics
Using the market for antipsychotic drugs to treat schizophrenia,his section calibrates the potential impact of CER-based subsidieshen treatments have heterogeneous effects on patients.
.1. Interpreting the CATIE trial CER in our framework
Antipsychotic medications represent the primary treatmentor patients with schizophrenia and are among the largest drug
lth Eco
csattnsi(
ievafatRMaaaa
chihcpcrbc
bSoaostcswcp
cttSeptralt
aia
optfitawp
5
epbib
gteigowoe
hnpwfiWtta
dptWtmbh
5
pozperphenazine. These comprise nearly 70% of the market of antipsy-chotic prescriptions written in the United States. In order to
A. Basu et al. / Journal of Hea
lasses in Medicaid (Bruen and Ghosh, 2004). Beginning in 1990, aecond generation of antipsychotic drugs, also known as atypicalntipsychotics (AA), was introduced. These drugs were believedo cause less side effects (such as movement disorders) comparedo the first generation antipsychotics (also known as “typicals” oreuroleptics) (Kane, 2004; Meltzer, 2009) though more recently,ome of the second generation antipsychotics have been linked toncreased metabolic side-effects such as weight gain and diabetesMeltzer, 2005).
Following a series of small comparative effectiveness stud-es (Polsky et al., 2006; Leucht et al., 2009), a large comparativeffectiveness trial – the Clinical Anti-psychotic Trials of Inter-ention Effectiveness (CATIE trial) – was conducted to evaluatentipsychotics in the U.S. (Lieberman et al., 2005). The CATIE trialound equivalence between the effectiveness of first generationntipsychotic drugs (typical or FGA) and all second genera-ion antipsychotics (atypicals or SGAs) (Lieberman et al., 2005;osenheck et al., 2006). Based on these results, many argued thatedicaid should preferentially subsidize FGAs over SGAs (Banthin
nd Miller, 2006; Rosenheck et al., 2007; NY Times, 2005; Soumeraind Law, 2007). Subsequent to the publication of the CATIE trial,pproximately 40% of state-run Medicaid programs instituted prioruthorization restrictions on some SGAs (Polinski et al., 2007).
Despite the large impact of the CATIE trial on coverage poli-ies towards antipsychotics, little is known about the quantitativeealth and spending impacts of these policies. As such, we cal-
brate how the CER generated by the CATIE trial impacted theealth of Medicaid beneficiaries and Medicaid spending on antipsy-hotics. Our calibration compares overall health and spending in are-CATIE environment in which patients and physicians togetherhose treatments felt to be most effective to a post-CATIE envi-onment in which these same decisions were allowed to occurut atypical antipsychotics were provided either partial or nooverage.7
In the context of our prior framework, FGAs are representedy treatment 1 and SGAs are represented by treatment 2. BecauseGAs were initially felt to be superior to FGAs on average, the resultsf the CATIE trial could be construed as FGAs being the ‘winners’nd SGAs the ‘losers’ of the CER. For simplicity and given the povertyf the Medicaid patient population, we assume that without sub-idies for either FGAs or SGAs there would be no demand for theseherapies, i.e. D1(c, e) = D2(c, e) = 0 where c is the vector of marginalosts (c1, c2). In this case, all utilization would be determined byubsidy policy and any viable Medicaid market for treatment iould need supply prices pS
i(provider reimbursement) at or above
osts and demand prices pDi
(patient co-pays) at or below costs. i.e.Si
≥ ci ≥ pDi
= pSi
− si, where si is the subsidy for treatment i.Given a set of subsidy levels s = (s1, s2) for both classes of antipsy-
hotic treatments prior to the CATIE trial, suppose Medicaid wereo respond to the new CER produced by the trial by only coveringhe winner (in this case, FGAs). This would raise demand prices forGAs relative to FGAs, thereby reducing the market for the SGAs andxpanding the market for the FGAs. Depending on how accuratelyatients were matched to treatments most effective for them prioro the CATIE trial, the expansion in the market for FGAs and theeduction in the market for SGAs could increase or decrease over-
ll health. Specifically, if pre-CATIE, patients and physicians were atiberty to switch between drugs with ease so that patients could set-le on the drug most cost-effective for them, subsidizing one drug7 A no-coverage reimbursement response to CER is inconsistent with current lawnd therefore the partial coverage scenario is our primary counterfactual policy. Wenclude the no-coverage scenario to understand the desirability of future policiesnd laws that may potentially alter those currently in place.
c
mhb2ta
nomics 30 (2011) 695– 706 701
ver another could lower overall health by artificially lowering therice of a drug that is less effective for some patients. This nega-ive impact on overall health relies, of course, on two assumptions:rst, in a pre-CATIE environment, patients were matched with thereatment most effective for them (perhaps through repeated tri-ls of medication options) and second, that the subsidized priceould not attract new patients into the antipsychotic market whoreviously would have utilized no treatment at all.
.2. Policy scenarios
We calibrate the impact on average health of Medicaid ben-ficiaries with schizophrenia of alternative CER-based subsidyolicies. Based on our prior analysis, differences in overall healthetween alternative subsidy policies are determined by those Med-
caid patients for whom SGA therapy was most effective pre-CATIEut who switched to FGA post-CATIE due to subsidies for this class.
The first policy that we consider is one in which bothenerations of antipsychotic drugs are fully reimbursed sohat the demand prices faced by patients are zero (pre-CATIEnvironment).8 Since the supply price of second-generation drugss higher, the size of the subsidy for this class is larger than for firsteneration drugs (s2 ≥ s1). Under this policy, demand for each classf drugs is fully determined by heterogeneity in treatment effects:ith unrestricted coverage physicians and patients are able to try
ut alternative drugs and settle on a drug that appears to be mostffective for an individual patient.
We compare overall health in this pre-CATIE scenario to twoypothetical post-CATIE scenarios: a partial coverage policy ando-coverage policy for the loser of the CATIE trial (SGAs). Under theartial coverage scenario, only risperidone (a SGA) is covered alongith all FGAs, thereby allowing equilibrium quantity demanded
or SGAs to be positive. All other second generation drugs are notncluded in the Medicaid formulary and are therefore not covered.
e consider risperidone to be the only atypical reimbursed underhe partial coverage policy as it is the only generic SGA available inhe market and is consistently in the top tier of preferred drug listscross Medicaid programs.
Under the no-coverage scenario, none of the second generationrugs are covered, i.e. s2 = 0. Given the low income of the Medicaidopulation, this is assumed to eliminate demand in this popula-ion so that the post-CATIE quantity of SGAs demanded is zero.
e include this case not because of its likelihood of adoption, buto trace out the implications of a policy that reimburses only the
ost effective care. When care that is less effective is not reim-ursed, poor individuals cannot access it and this has importantealth effects under heterogeneity.
.3. Methods
We evaluate each policy described above over an 18-montheriod, corresponding to the length of the CATIE trial. We focusn three second generation antipsychotic drugs (risperidone, olan-apine, and quetiapine), as well as one first generation drug,
alculate the number of Medicaid beneficiaries impacted by these
8 Total Medicaid expenditures on antipsychotic medication increased from $484illion in 1995 to $1.3 billion in 1998 (Lewin Group, 2000). In 2004, the annual
ealth care costs for patients with schizophrenia were estimated to be about $28illion, of which nearly one-third was attributable to pharmacy costs (Gilmer et al.,004). More recent estimates suggest that expenditures on antipsychotic medica-ions across all payers have crossed $10 billion annually and account for a third to
half of all mental health expenditures (NIMH, 2006).
702 A. Basu et al. / Journal of Health Economics 30 (2011) 695– 706
outco
aaWce
iwuootcWuolauwQ
e(
5
pspusmiCftlt
toQ
atQmtt
iop9ca
mtatT1(s
5
atie
aiduppdofr1
eQco
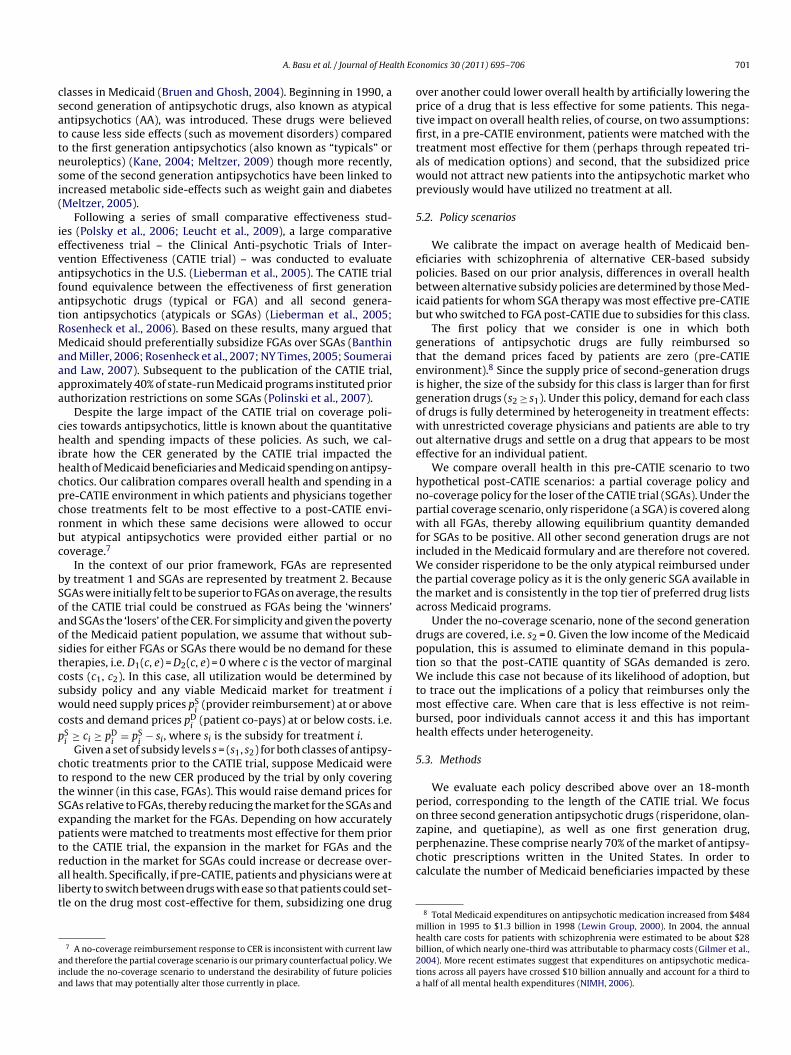
Fig. 3. Patterns of utilization and
lternative policies, we assume the prevalence of schizophreniamong non-elderly Medicaid patients to be 1.66% (Wu et al., 2006).e apply this estimate to the 15 million non-elderly adult Medi-
aid enrollees to obtain a total number of 250,000 non-elderly adultnrollees with schizophrenia.
In order to calculate overall health in the pre-CATIE era andn both policy scenarios, we begin with a baseline quality of life
eight equal to 0.68 for patients with schizophrenia who are notnder active relapse. If baseline status-quo could be maintainedver the 18-month period considered, there would be an accrualf 1.02 (=0.68 × 1.5) QALYs per patient. Obviously, receipt of effec-ive medications could help improve QALYs, while absence of suchould result in decreases in QALYs (via relapse) during this period.
e model changes in QALYs during the same 18-month periodnder alternative policies and add the additional QALYs gainedr lost to this baseline accrual level. These additional gains orosses in QALYs are calculated using an area-under-the-curve (AUC)pproach based on the time trajectory of quality of life weightsnder different scenarios. Specifically, we approximate this areaith a triangle whose slope is determined by the rate of change inOL weight over time in each scenario.
Total costs under each policy are calculated from monthly coststimates from CATIE data and those reported by Rosenheck et al.2006).
.3.1. Pre-CATIE scenarioIn the pre-CATIE environment, irrespective of the first drug a
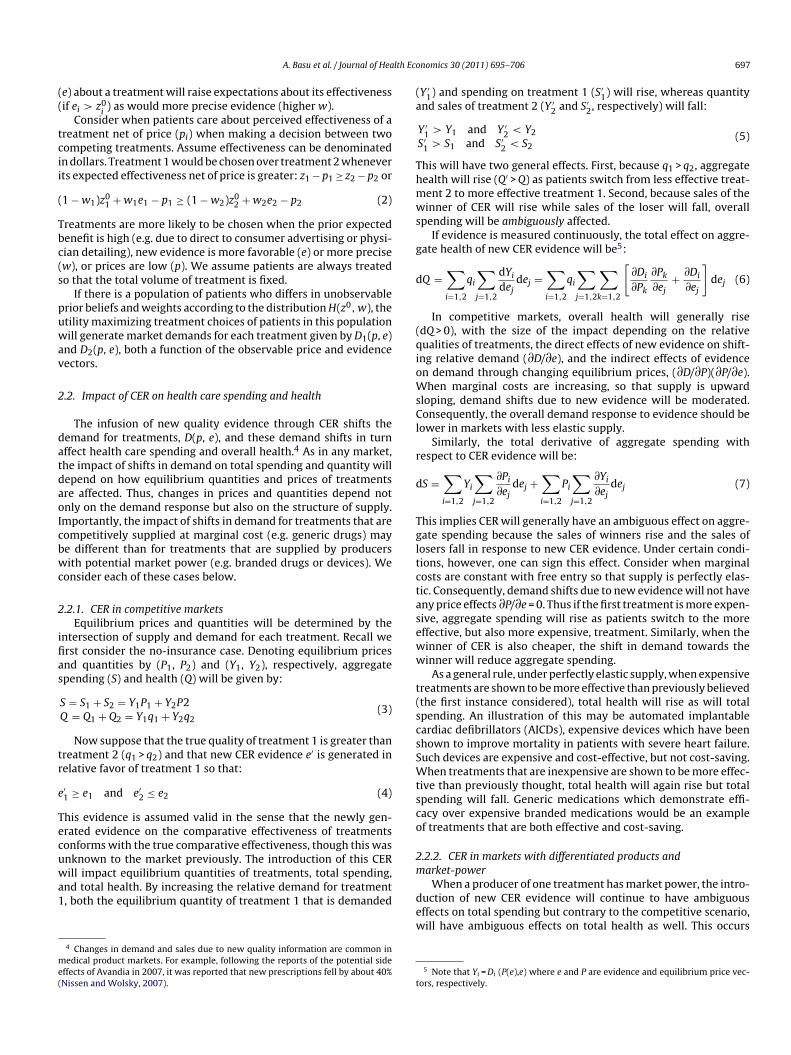
atient tries, physicians and patients are assumed to be able towitch to alternative drugs that may be more efficacious for thatarticular patient. We capture the overall effect of these switchessing the intention-to-treat rate of change in QOL over time forpecific drug initiations from CATIE data (shown in Fig. 3 and sum-arized in Table A1).9 We calculate the proportion of patients
nitiating antipsychotic treatment with a given drug in the pre-ATIE era using drug-specific prescription shares in 2005 (obtainedrom IMS Health), a year prior to the CATIE trial. For each drug,his proportion is multiplied by the 250,000 patients in our simu-ation to arrive at the number of patients initiating antipsychoticreatment with a given drug (Fig. 3).
The total health effect generated by a specific drug initia-ion is calculated by multiplying the number of patients initiatedn the drug with the sum of: (1) the baseline QALYs (1.02ALYs per patient) and (2) the AUC representing deviations
9 Intention-to-treat effects represent average quality levels for a given initial drugssignment after incorporating the effect of trial-and-error selection into the bestreatment. We apply mixed-effects linear models to individual-level longitudinalOL data from CATIE and estimate the intention-to-treat effects of the initial assign-ent of a drug. Specifically, we look at the coefficients on treatment-time interaction
o compare the average rate of change in QOL weight under alterative first-linereatments.
T
endTnmamid
mes under the Pre-CATIE policy.
n QALYs from baseline = 0.5 × (intention-to-treat monthly ratef change in QOL × 18) × 1.5 years. For example, the 90,000atients initiated on quetiapine are expected to experience0,000 × (1.02 + (0.5 × (0.003 × 18) × 1.5)) = 95,445 QALYs. Similaralculations are made for each drug initiation and the total benefitsre summed across all the drug initiations.
Total costs in the pre-CATIE environment are calculated byultiplying the number of patients initiated on a drug with
he corresponding intention-to-treat monthly costs of total drugsnd services costs, as reported by Rosenheck et al. (2006) inheir Supplemental Table C (reproduced here in Fig. 3 andable A1), and summing over 18 months. Of these costs, about8–34% is due to the use of the antipsychotic medicationsTable A1) and the remainder due to utilization of psychiatricervices.
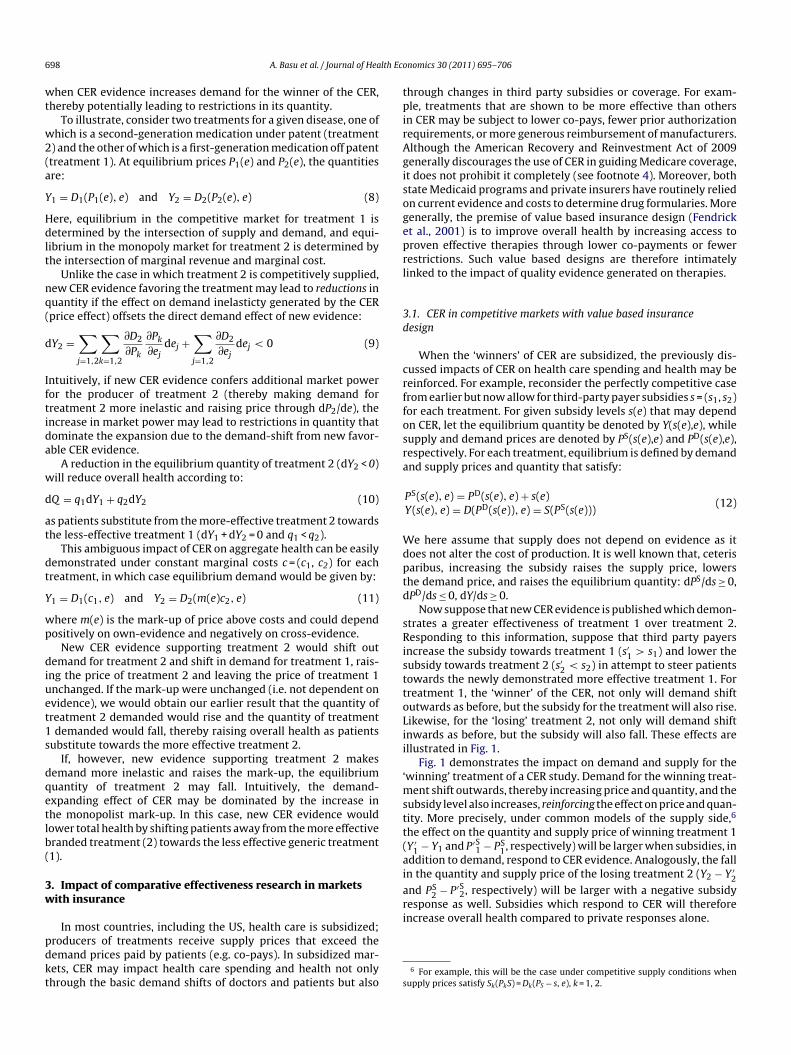
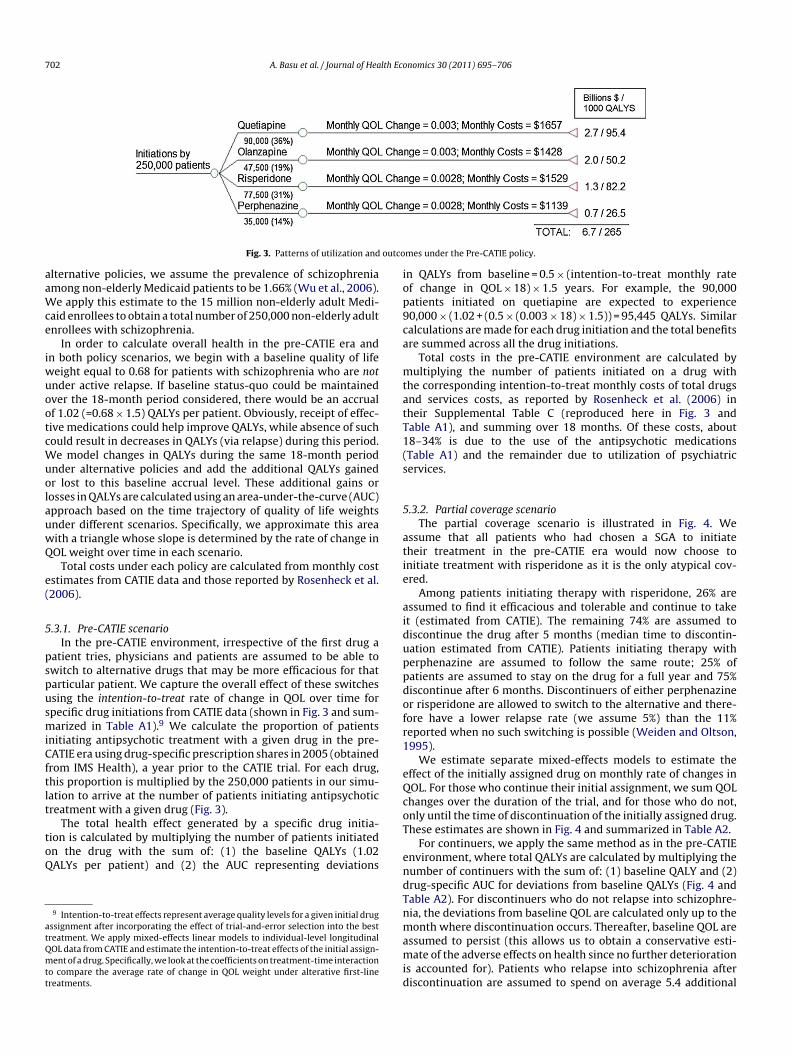
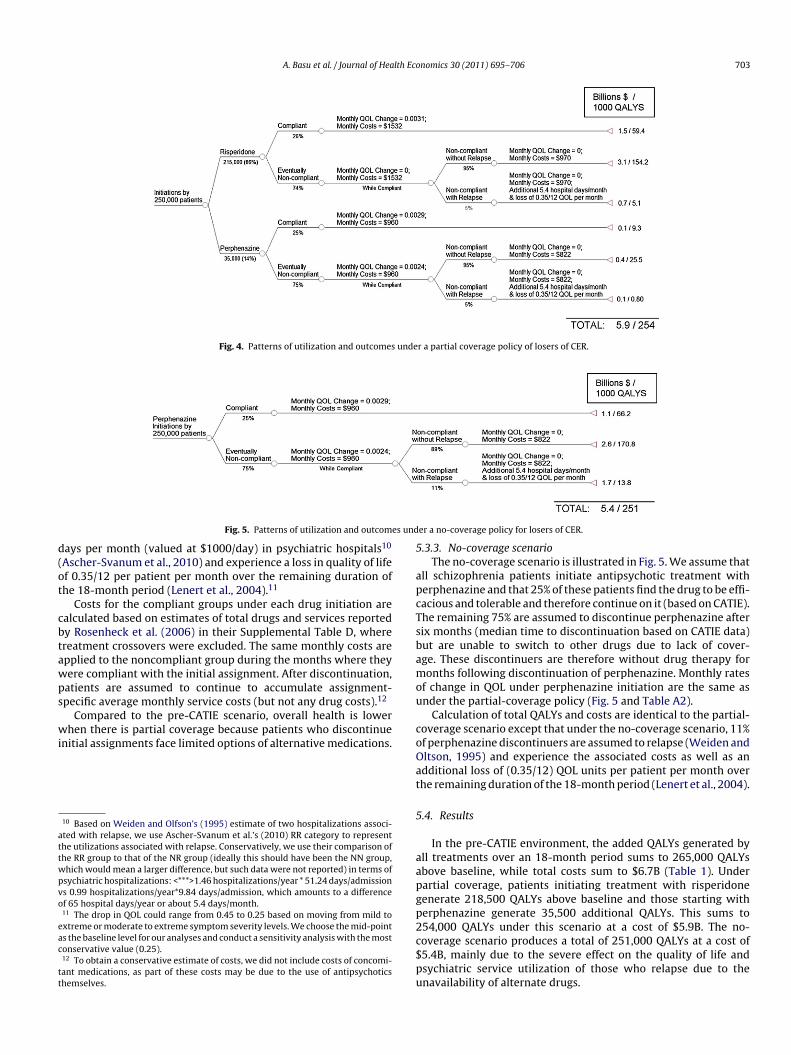
.3.2. Partial coverage scenarioThe partial coverage scenario is illustrated in Fig. 4. We
ssume that all patients who had chosen a SGA to initiateheir treatment in the pre-CATIE era would now choose tonitiate treatment with risperidone as it is the only atypical cov-red.
Among patients initiating therapy with risperidone, 26% aressumed to find it efficacious and tolerable and continue to taket (estimated from CATIE). The remaining 74% are assumed toiscontinue the drug after 5 months (median time to discontin-ation estimated from CATIE). Patients initiating therapy witherphenazine are assumed to follow the same route; 25% ofatients are assumed to stay on the drug for a full year and 75%iscontinue after 6 months. Discontinuers of either perphenaziner risperidone are allowed to switch to the alternative and there-ore have a lower relapse rate (we assume 5%) than the 11%eported when no such switching is possible (Weiden and Oltson,995).
We estimate separate mixed-effects models to estimate theffect of the initially assigned drug on monthly rate of changes inOL. For those who continue their initial assignment, we sum QOLhanges over the duration of the trial, and for those who do not,nly until the time of discontinuation of the initially assigned drug.hese estimates are shown in Fig. 4 and summarized in Table A2.
For continuers, we apply the same method as in the pre-CATIEnvironment, where total QALYs are calculated by multiplying theumber of continuers with the sum of: (1) baseline QALY and (2)rug-specific AUC for deviations from baseline QALYs (Fig. 4 andable A2). For discontinuers who do not relapse into schizophre-ia, the deviations from baseline QOL are calculated only up to theonth where discontinuation occurs. Thereafter, baseline QOL are
ssumed to persist (this allows us to obtain a conservative esti-ate of the adverse effects on health since no further deterioration
s accounted for). Patients who relapse into schizophrenia afteriscontinuation are assumed to spend on average 5.4 additional
A. Basu et al. / Journal of Health Economics 30 (2011) 695– 706 703
Fig. 4. Patterns of utilization and outcomes under a partial coverage policy of losers of CER.
s und
d(ot
cbtawps
wi
attwpvo
eac
tt
5
apcTsbamou
c
Fig. 5. Patterns of utilization and outcome
ays per month (valued at $1000/day) in psychiatric hospitals10
Ascher-Svanum et al., 2010) and experience a loss in quality of lifef 0.35/12 per patient per month over the remaining duration ofhe 18-month period (Lenert et al., 2004).11
Costs for the compliant groups under each drug initiation arealculated based on estimates of total drugs and services reportedy Rosenheck et al. (2006) in their Supplemental Table D, wherereatment crossovers were excluded. The same monthly costs arepplied to the noncompliant group during the months where theyere compliant with the initial assignment. After discontinuation,atients are assumed to continue to accumulate assignment-pecific average monthly service costs (but not any drug costs).12
Compared to the pre-CATIE scenario, overall health is lowerhen there is partial coverage because patients who discontinue
nitial assignments face limited options of alternative medications.
10 Based on Weiden and Olfson’s (1995) estimate of two hospitalizations associ-ted with relapse, we use Ascher-Svanum et al.’s (2010) RR category to representhe utilizations associated with relapse. Conservatively, we use their comparison ofhe RR group to that of the NR group (ideally this should have been the NN group,hich would mean a larger difference, but such data were not reported) in terms ofsychiatric hospitalizations: <***>1.46 hospitalizations/year * 51.24 days/admissions 0.99 hospitalizations/year*9.84 days/admission, which amounts to a differencef 65 hospital days/year or about 5.4 days/month.11 The drop in QOL could range from 0.45 to 0.25 based on moving from mild toxtreme or moderate to extreme symptom severity levels. We choose the mid-points the baseline level for our analyses and conduct a sensitivity analysis with the mostonservative value (0.25).12 To obtain a conservative estimate of costs, we did not include costs of concomi-ant medications, as part of these costs may be due to the use of antipsychoticshemselves.
oOat
5
aapgp2c$pu
er a no-coverage policy for losers of CER.
.3.3. No-coverage scenarioThe no-coverage scenario is illustrated in Fig. 5. We assume that
ll schizophrenia patients initiate antipsychotic treatment witherphenazine and that 25% of these patients find the drug to be effi-acious and tolerable and therefore continue on it (based on CATIE).he remaining 75% are assumed to discontinue perphenazine afterix months (median time to discontinuation based on CATIE data)ut are unable to switch to other drugs due to lack of cover-ge. These discontinuers are therefore without drug therapy foronths following discontinuation of perphenazine. Monthly rates
f change in QOL under perphenazine initiation are the same asnder the partial-coverage policy (Fig. 5 and Table A2).
Calculation of total QALYs and costs are identical to the partial-overage scenario except that under the no-coverage scenario, 11%f perphenazine discontinuers are assumed to relapse (Weiden andltson, 1995) and experience the associated costs as well as andditional loss of (0.35/12) QOL units per patient per month overhe remaining duration of the 18-month period (Lenert et al., 2004).
.4. Results
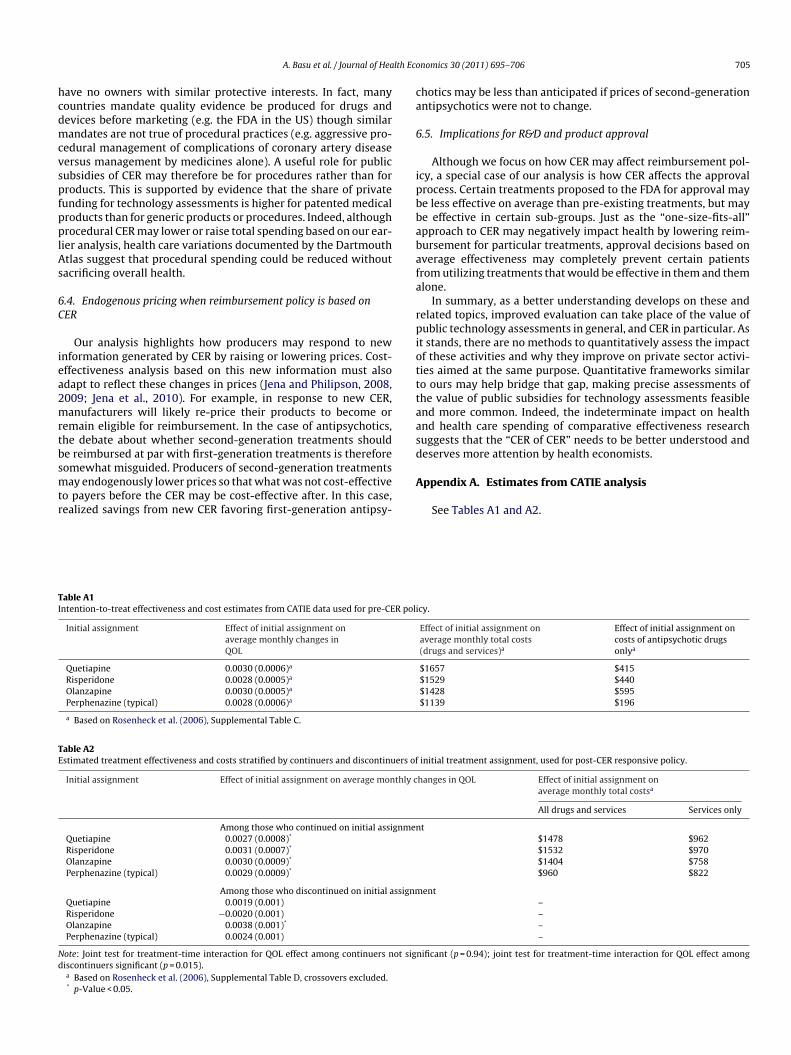
In the pre-CATIE environment, the added QALYs generated byll treatments over an 18-month period sums to 265,000 QALYsbove baseline, while total costs sum to $6.7B (Table 1). Underartial coverage, patients initiating treatment with risperidoneenerate 218,500 QALYs above baseline and those starting witherphenazine generate 35,500 additional QALYs. This sums to54,000 QALYs under this scenario at a cost of $5.9B. The no-
overage scenario produces a total of 251,000 QALYs at a cost of5.4B, mainly due to the severe effect on the quality of life andsychiatric service utilization of those who relapse due to thenavailability of alternate drugs.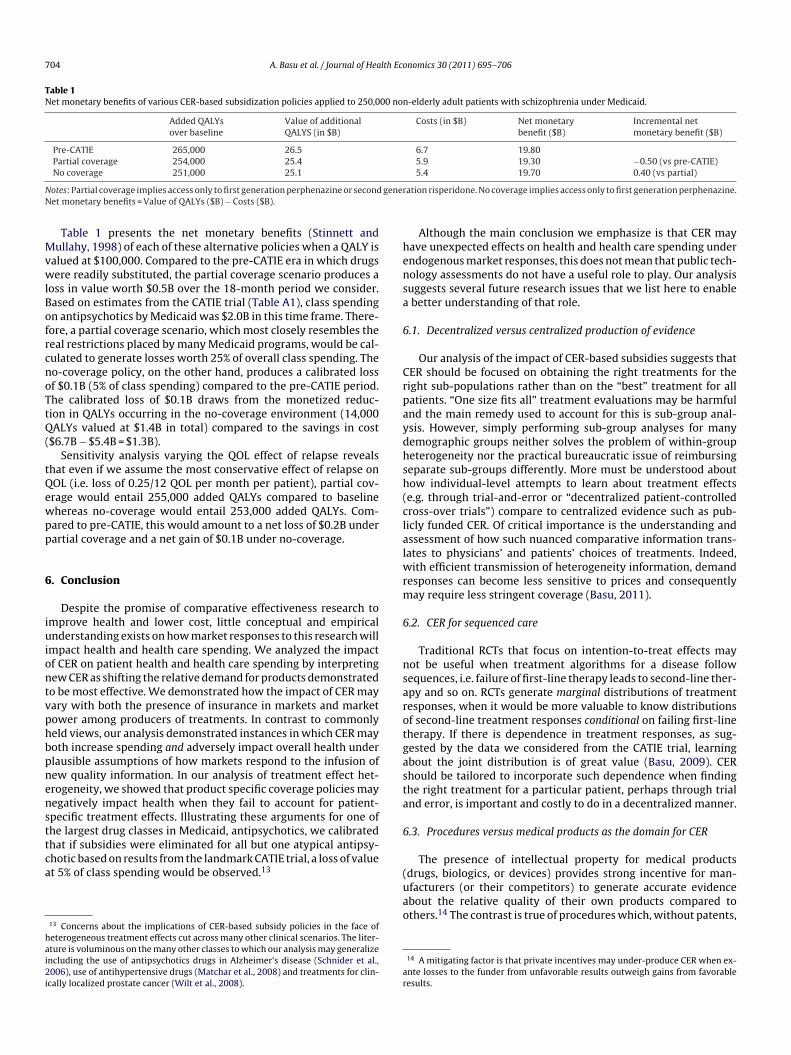
704 A. Basu et al. / Journal of Health Economics 30 (2011) 695– 706
Table 1Net monetary benefits of various CER-based subsidization policies applied to 250,000 non-elderly adult patients with schizophrenia under Medicaid.
Added QALYsover baseline
Value of additionalQALYS (in $B)
Costs (in $B) Net monetarybenefit ($B)
Incremental netmonetary benefit ($B)
Pre-CATIE 265,000 26.5 6.7 19.80Partial coverage 254,000 25.4 5.9 19.30 −0.50 (vs pre-CATIE)No coverage 251,000 25.1 5.4 19.70 0.40 (vs partial)
N generN
MvwlBofrcnoTtQ(
tQewpp
6
iuiontvphbpnensttca
hai2i
hensa
6
Crpaydhsh(clalwrm
6
nsarotgasta
6
otes: Partial coverage implies access only to first generation perphenazine or secondet monetary benefits = Value of QALYs ($B) − Costs ($B).
Table 1 presents the net monetary benefits (Stinnett andullahy, 1998) of each of these alternative policies when a QALY is
alued at $100,000. Compared to the pre-CATIE era in which drugsere readily substituted, the partial coverage scenario produces a
oss in value worth $0.5B over the 18-month period we consider.ased on estimates from the CATIE trial (Table A1), class spendingn antipsychotics by Medicaid was $2.0B in this time frame. There-ore, a partial coverage scenario, which most closely resembles theeal restrictions placed by many Medicaid programs, would be cal-ulated to generate losses worth 25% of overall class spending. Theo-coverage policy, on the other hand, produces a calibrated lossf $0.1B (5% of class spending) compared to the pre-CATIE period.he calibrated loss of $0.1B draws from the monetized reduc-ion in QALYs occurring in the no-coverage environment (14,000ALYs valued at $1.4B in total) compared to the savings in cost
$6.7B − $5.4B = $1.3B).Sensitivity analysis varying the QOL effect of relapse reveals
hat even if we assume the most conservative effect of relapse onOL (i.e. loss of 0.25/12 QOL per month per patient), partial cov-rage would entail 255,000 added QALYs compared to baselinehereas no-coverage would entail 253,000 added QALYs. Com-ared to pre-CATIE, this would amount to a net loss of $0.2B underartial coverage and a net gain of $0.1B under no-coverage.
. Conclusion
Despite the promise of comparative effectiveness research tomprove health and lower cost, little conceptual and empiricalnderstanding exists on how market responses to this research will
mpact health and health care spending. We analyzed the impactf CER on patient health and health care spending by interpretingew CER as shifting the relative demand for products demonstratedo be most effective. We demonstrated how the impact of CER mayary with both the presence of insurance in markets and marketower among producers of treatments. In contrast to commonlyeld views, our analysis demonstrated instances in which CER mayoth increase spending and adversely impact overall health underlausible assumptions of how markets respond to the infusion ofew quality information. In our analysis of treatment effect het-rogeneity, we showed that product specific coverage policies mayegatively impact health when they fail to account for patient-pecific treatment effects. Illustrating these arguments for one ofhe largest drug classes in Medicaid, antipsychotics, we calibrated
hat if subsidies were eliminated for all but one atypical antipsy-hotic based on results from the landmark CATIE trial, a loss of valuet 5% of class spending would be observed.1313 Concerns about the implications of CER-based subsidy policies in the face ofeterogeneous treatment effects cut across many other clinical scenarios. The liter-ture is voluminous on the many other classes to which our analysis may generalizencluding the use of antipsychotics drugs in Alzheimer’s disease (Schnider et al.,006), use of antihypertensive drugs (Matchar et al., 2008) and treatments for clin-
cally localized prostate cancer (Wilt et al., 2008).
(uao
ar
ation risperidone. No coverage implies access only to first generation perphenazine.
Although the main conclusion we emphasize is that CER mayave unexpected effects on health and health care spending underndogenous market responses, this does not mean that public tech-ology assessments do not have a useful role to play. Our analysisuggests several future research issues that we list here to enable
better understanding of that role.
.1. Decentralized versus centralized production of evidence
Our analysis of the impact of CER-based subsidies suggests thatER should be focused on obtaining the right treatments for theight sub-populations rather than on the “best” treatment for allatients. “One size fits all” treatment evaluations may be harmfulnd the main remedy used to account for this is sub-group anal-sis. However, simply performing sub-group analyses for manyemographic groups neither solves the problem of within-groupeterogeneity nor the practical bureaucratic issue of reimbursingeparate sub-groups differently. More must be understood aboutow individual-level attempts to learn about treatment effectse.g. through trial-and-error or “decentralized patient-controlledross-over trials”) compare to centralized evidence such as pub-icly funded CER. Of critical importance is the understanding andssessment of how such nuanced comparative information trans-ates to physicians’ and patients’ choices of treatments. Indeed,
ith efficient transmission of heterogeneity information, demandesponses can become less sensitive to prices and consequentlyay require less stringent coverage (Basu, 2011).
.2. CER for sequenced care
Traditional RCTs that focus on intention-to-treat effects mayot be useful when treatment algorithms for a disease followequences, i.e. failure of first-line therapy leads to second-line ther-py and so on. RCTs generate marginal distributions of treatmentesponses, when it would be more valuable to know distributionsf second-line treatment responses conditional on failing first-lineherapy. If there is dependence in treatment responses, as sug-ested by the data we considered from the CATIE trial, learningbout the joint distribution is of great value (Basu, 2009). CERhould be tailored to incorporate such dependence when findinghe right treatment for a particular patient, perhaps through trialnd error, is important and costly to do in a decentralized manner.
.3. Procedures versus medical products as the domain for CER
The presence of intellectual property for medical productsdrugs, biologics, or devices) provides strong incentive for man-
facturers (or their competitors) to generate accurate evidencebout the relative quality of their own products compared tothers.14 The contrast is true of procedures which, without patents,14 A mitigating factor is that private incentives may under-produce CER when ex-nte losses to the funder from unfavorable results outweigh gains from favorableesults.
lth Eco
hcdmcvspfpplAs
6C
iea2mrtbsmtr
ca
6
ipbbabafa
rpiotttaasd
TI
TE
Nd
A. Basu et al. / Journal of Hea
ave no owners with similar protective interests. In fact, manyountries mandate quality evidence be produced for drugs andevices before marketing (e.g. the FDA in the US) though similarandates are not true of procedural practices (e.g. aggressive pro-
edural management of complications of coronary artery diseaseersus management by medicines alone). A useful role for publicubsidies of CER may therefore be for procedures rather than forroducts. This is supported by evidence that the share of privateunding for technology assessments is higher for patented medicalroducts than for generic products or procedures. Indeed, althoughrocedural CER may lower or raise total spending based on our ear-
ier analysis, health care variations documented by the Dartmouthtlas suggest that procedural spending could be reduced withoutacrificing overall health.
.4. Endogenous pricing when reimbursement policy is based onER
Our analysis highlights how producers may respond to newnformation generated by CER by raising or lowering prices. Cost-ffectiveness analysis based on this new information must alsodapt to reflect these changes in prices (Jena and Philipson, 2008,009; Jena et al., 2010). For example, in response to new CER,anufacturers will likely re-price their products to become or
emain eligible for reimbursement. In the case of antipsychotics,he debate about whether second-generation treatments shoulde reimbursed at par with first-generation treatments is therefore
omewhat misguided. Producers of second-generation treatmentsay endogenously lower prices so that what was not cost-effectiveo payers before the CER may be cost-effective after. In this case,ealized savings from new CER favoring first-generation antipsy-
A
able A1ntention-to-treat effectiveness and cost estimates from CATIE data used for pre-CER poli
Initial assignment Effect of initial assignment onaverage monthly changes inQOL
Quetiapine 0.0030 (0.0006)a
Risperidone 0.0028 (0.0005)a
Olanzapine 0.0030 (0.0005)a
Perphenazine (typical) 0.0028 (0.0006)a
a Based on Rosenheck et al. (2006), Supplemental Table C.
able A2stimated treatment effectiveness and costs stratified by continuers and discontinuers of
Initial assignment Effect of initial assignment on average monthly c
Among those who continued on initial assignmenQuetiapine 0.0027 (0.0008)*
Risperidone 0.0031 (0.0007)*
Olanzapine 0.0030 (0.0009)*
Perphenazine (typical) 0.0029 (0.0009)*
Among those who discontinued on initial assignmQuetiapine 0.0019 (0.001)
Risperidone −0.0020 (0.001)
Olanzapine 0.0038 (0.001)*
Perphenazine (typical) 0.0024 (0.001)
ote: Joint test for treatment-time interaction for QOL effect among continuers not sigiscontinuers significant (p = 0.015).a Based on Rosenheck et al. (2006), Supplemental Table D, crossovers excluded.* p-Value < 0.05.
nomics 30 (2011) 695– 706 705
hotics may be less than anticipated if prices of second-generationntipsychotics were not to change.
.5. Implications for R&D and product approval
Although we focus on how CER may affect reimbursement pol-cy, a special case of our analysis is how CER affects the approvalrocess. Certain treatments proposed to the FDA for approval maye less effective on average than pre-existing treatments, but maye effective in certain sub-groups. Just as the “one-size-fits-all”pproach to CER may negatively impact health by lowering reim-ursement for particular treatments, approval decisions based onverage effectiveness may completely prevent certain patientsrom utilizing treatments that would be effective in them and themlone.
In summary, as a better understanding develops on these andelated topics, improved evaluation can take place of the value ofublic technology assessments in general, and CER in particular. As
t stands, there are no methods to quantitatively assess the impactf these activities and why they improve on private sector activi-ies aimed at the same purpose. Quantitative frameworks similaro ours may help bridge that gap, making precise assessments ofhe value of public subsidies for technology assessments feasiblend more common. Indeed, the indeterminate impact on healthnd health care spending of comparative effectiveness researchuggests that the “CER of CER” needs to be better understood andeserves more attention by health economists.
ppendix A. Estimates from CATIE analysis
See Tables A1 and A2.
cy.
Effect of initial assignment onaverage monthly total costs(drugs and services)a
Effect of initial assignment oncosts of antipsychotic drugsonlya
$1657 $415$1529 $440$1428 $595$1139 $196
initial treatment assignment, used for post-CER responsive policy.
hanges in QOL Effect of initial assignment onaverage monthly total costsa
All drugs and services Services only
t$1478 $962$1532 $970$1404 $758$960 $822
ent––––
nificant (p = 0.94); joint test for treatment-time interaction for QOL effect among
7 lth Eco
R
A
B
B
B
B
C
C
F
F
G
G
I
J
A
J
K
L
L
L
L
M
M
M
MN
NN
P
P
P
RR
S
S
S
W
06 A. Basu et al. / Journal of Hea
eferences
scher-Svanum, H., Zhu, B., Faries, D.E., et al., 2010. The cost of relapse and thepredictors of relapse in the treatment of schizophrenia. BMC Psychiatry 10 (2),1–7.
anthin, J.S., Miller, G.E., 2006. Trends in prescription drug expenditures by medicaidenrollees. Medical Care 44, I-27–I-35.
asu, A., 2009. Individualization at the heart of comparative effectiveness research:the time for i-CER has come. Medical Decision Making 29 (6), N9–N11.
asu, A., 2011. Economics of individualization in comparative effectiveness researchand a basis for a patient-centered healthcare. Journal of Health Economics 30(3), 549–559.
ruen, B., Ghosh, A., 2004. Medicaid prescription drug spending anduse. Kaiser commission on Medicaid and the uninsured issue paper.http://www.kff.org/medicaid/upload/Medicaid-Prescription-Drug-Spending-and-Use.pdf (accessed 21.12.09).
hernew, M.E., Rosen, A., Fendrick, A.M., 2007. Value-based insurance design. HealthAffairs 26 (2), w195–w203.
lancy, C., Collins, F.S., 2010. Patient-centered outcomes research Institute: TheIntersection of Science and Health Care. Science Translational Medicine 2 (7),1–3.
ederal Coordinating Council for Comparative Effectiveness Research. 2009. Reportto the President and the Congress. June 30.
endrick, A.M., Smith, D.G., Chernew, M.E., Shah, S.N., 2001. A benefit-based copayfor prescription drugs: patient contribution based on total benefits, not drugacquisition cost. The American Journal of Managed Care 7, 861–867.
ilmer, T.P., Dolder, C.R., Lacro, J.P., Folsom, D.P., Lindamer, L., Garcia, P., Jeste, D.V.,2004. Adherence to treatment with antipsychotic medication and health carecosts among Medicaid beneficiaries with schizophrenia. The American Journalof Psychiatry 161 (4), 692–699.
oldman, D., Philipson, T.J., 2007. Integrated insurance design in the presence ofmultiple medical technologies. American Economic Review 97 (2), 427–432.
OM Initial National Priorities for Comparative Effectiveness Research: Commit-tee on Comparative Effectiveness Research Prioritization Board on Health CareServices, June 2009.
ena, A., Philipson, T., 2008. Cost-effectiveness analysis and innovation. Journal ofHealth Economics 27 (5), 1224–1236.
. Jena, T. Philipson, 2009. Endogenous cost-effectiveness analysis in health caretechnology adoption, NBER Working Paper 15032, Cambridge, MA.
ena, A., Mechoulan, S., Philipson, T., 2010. Altruism and innovation in health care.Journal of Law and Economics 53 (3), 497–518.
ane, J.M., 2004. Tardive dyskinesia rates with atypical antipsychotics in adults:prevalence and incidence. Journal Clinical Psychiatry 65 (Suppl. 9), 16–20.
eucht, S., Corves, C., Arbter, D., Engel, R.R., Li, C., Davis, J.M., 2009. Second-generationversus first-generation antipsychotic drugs for schizophrenia: a meta-analysis.Lancet 373, 31–41.
ewin Group, 2000. Access and utilization of new antidepressant andantipsychotic medications. Report submitted to The Office of the Assis-tant Secretary for Planning and Evaluation and The National Instituteof Mental Health, U.S. Department of Health and Human Services.
http://aspe.hhs.gov/health/reports/Psychmedaccess/.enert, L., Sturley, A.P., Rapaport, M.H., Chavez, S., Mohr, P., Rupnow, M., 2004. Publicpreferences for health states with schizophrenia and a mapping function to esti-mate utilities from positive and negative syndrome scale scores. SchizophreniaResearch 71, 155–165.
W
W
nomics 30 (2011) 695– 706
ieberman, J.A., Stroup, T.S., McEvoy, J.P., Swartz, M.S., Rosenheck, R.A., Perkins, D.O.,Keefe, R.S., Davis, S.M., Davis, C.E., Lebowitz, B.D., Severe, J., Hsiao, J.K., 2005.Effectiveness of antipsychotic drugs in patients with chronic schizophrenia. NewEngland Journal of Medicine 353, 1209–1223.
alani, A., Philipson, T., 2011. Government regulation of medical product safety andinnovation, Handbook of Pharmaceuticals Markets, edited by P Danzon and S.Nicholson, Oxford University Press, forthcoming.
atchar, D.B., McCrory, D.C., Orlando, L.A., Patel, M.R., Patel, U.D., Patwardhan,M.B., Powers, B., Samsa, G.P., Gray, R.N., 2008. Systematic review: compara-tive effectiveness of angiotensin-converting enzyme inhibitors and angiotensinii receptor blockers for treating essential hypertension. Annals of InternalMedicine 148 (1), 16–29.
eltzer, H.Y., 2005. The metabolic consequences of long-term treatment with olan-zapine, quetiapine and risperidone: are there differences? International Journalof Neuropsychopharmacology 8, 153–156.
eltzer, H.Y., 2009. Atypical antipsychotic drugs have their merits. Lancet 373, 1007.IMH Perspective on Antipsychotic Reimbursement: Using Results from
CATIE. http://www.nimh.nih.gov/about/director/updates/2006/nimh-perspective-on-antipsychotic-reimbursement-using-results-from-the-catie-cost-effectiveness-study.shtml (accessed 17.09.09).
ew York Times Editorial, 2005. Comparing schizophrenia drugs. September 21.issen, S.E., Wolsky, K., 2007. Effect of rosiglitazone on the risk of myocardial infarc-
tion and death from cardiovascular causes. New England Journal of Medicine 356(24), 2457–2471.
auly, M.V., Blavin, F.E., 2008. Moral hazard in insurance, value-based cost shar-ing, and the benefits of blissful ignorance. Journal of Health Economics 27,1407–1417.
olinski, J.M., Wang, P.S., Fisher, M.A., 2007. Medicaid’s prior authorization programand access to atypical antipsychotic medications. Health Affairs 26 (3), 750–760.
olsky, D., Doshi, J.A., Bauer, M.S., Glick, H.A., 2006. Clinical trial-based cost-effectiveness analyses of antipsychotic use. The American Journal of Psychiatry163, 2047–2056.
osenheck, R.A., et al., 2007. CATIE Investigator’s Educations Series.osenheck, R.A., et al., 2006. Cost-effectiveness of second generation antipsychotics
and perphenazine in a randomized trial of treatment for chronic schizophrenia.American Journal of Psychiatry 163 (12), 2080–2089.
chnider, L.S., Tariot, P.N., Dagerman, K.S., Davis, S.M., Hsiao, J.K., Ismail, M.S.,Lebowitz, B.D., Lyketsos, C.G., Ryan, J.M., Stroup, T.S., Sultzer, D.L., Weintraub, D.,Lieberman, J.A., 2006. for the CATIE-AD Study Group. Effectiveness of atypicalantipsychotic drugs in patients with Alzheimer’s disease. New England Journalof Medicine 355 (15), 1525–1538.
tinnett, A., Mullahy, J., 1998. Net health benefits: a new framework for the anal-ysis of uncertainty in cost-effectiveness analysis. Medical Decision Making 18,S68–S80.
oumerai, S.B., Law, M.R., 2007. Cost-effectiveness of schizophrenia pharmacother-apy. American Journal Psychiatry 164, 678.
ilt, T.J., MacDonald, R., Rutks, I., Shamliyan, T.A., Taylor, B.C., Kane, R.L., 2008.Systematic review: comparative effectiveness and harms of treatments forclinically localized prostate cancer. Annals of Internal Medicine 148 (6),435–448.
eiden, P.J., Oltson, M., 1995. Cost of relapse in schizophrenia. Schizophrenia Bul-letin 21 (3), 419–429.
u, E.Q., Shi, L., Birnbaum, H., Hudson, T., Kessler, R., 2006. Annual prevalence ofdiagnosed schizophrenia in the USA: a claims data analysis approach. Psycho-logical Medicine 36, 1535–1540.