Embed Size (px)
Citation preview
The Impact of High-Stakes Test Results on Teachers' Instructional
and Classroom Assessment Practices
James H. McMillan
Virginia Commonwealth University
Metropolitan Educational Research Consortium, Virginia Commonwealth University
Impact of High-Stakes Test Results
The Impact of High-Stakes Test Results on Teachers' Instructional
and Classroom Assessment Practices
Abstract
This study investigates relationships between teachers' receipt of high-stakes test score
results of their students and subsequent changes in instructional and classroom assessment
practices the following year. The sample consisted of 722 elementary, middle, and high school
teachers. The results indicate that most teachers reported using the results to make instructional
and assessment changes, especially those who emphasized depth of learning and higher-level
cognition. Greater collaboration among teachers was reported, as well as more formative
classroom assessment. Elementary teachers changed more than secondary teachers. Small to
moderate effect sizes suggest important impacts on a moderate number of teachers that are more
positive than previously reported for high-stakes minimum competency testing.
1
Impact of High-Stakes Test Results
An important assumption of state-mandated, high-stakes testing is that it will result in
improved instructional practices. While many such changes will result from a general
understanding of the test and standards that are emphasized on the tests, other changes may result
from teacher receipt and use of specific test scores of individual students and classes. While
there is no doubt that high-stakes tests affect teachers and instruction, we are only beginning to
understand the dynamics of these relationships. This study examines some factors that appear to
be related to positive use of the results.
The literature on the influence of high-stakes testing and teacher practices is mixed,
showing that high-stakes tests can have both positive and negative impacts on instruction
(Abrams & Madaus, 2003). Many researchers and teachers have reported that high-stakes
testing has had a detrimental effect on teaching as well as student learning (Amrein & Berliner,
2002). Teaching in tested subjects tends to be altered to more closely resemble test formats
(Abrams & Madaus, 2003; Haney, 2000). Research suggests that tests emphasizing low-level
learning have produced low-level learning (Shepard, 2002). In an early study of the deleterious
effects of high-stakes testing, Smith (1991) found that elementary teachers reduced the amount
of time devoted to reading and long-term projects and increased time devoted to word
recognition, punctuation, and spelling, all of which were emphasized on the test. Teacher
anecdotes and research document a narrowing of the curriculum and inordinate amounts of time
drilling students in test preparation or emphasizing classroom testing formats that are consistent
with the item formats from large-scale tests (Abrams & Madaus, 2003; Amrein & Berliner, 2002;
Glasnapp, Poggio, & Miller, 1991). This is particularly harmful if the content on the test is
based on narrow, specific, low-level standards (Shepard, 2002). Performance on such tests do
not generalize well to other tests of student learning (Amrein & Berliner, 2002; Shepard, 2002).
2

Impact of High-Stakes Test Results
Smith, Edelsky, Draper, Rottenburg, and Cherland (1989) and Smith (1991) identified six
detrimental consequences of “external” testing in elementary schools: 1) reduced time in the
classroom for ordinary instruction; 2) less teaching of material that was not covered on the test;
3) change of teaching methods and classroom assessments to match those of the tests; 4) more
limited instructional opportunities; 5) detrimental effects on teacher morale; and 6) the
imposition of unwarranted negative consequences for student failure. More recently, Haney
(2000), in a study of high-stakes testing consequences in Texas, found harmful effects on both
teaching and student learning. Cizek (2001) indicates that of 59 entries in the literature
concerning the effect of high-stakes testing, only 2 reported positive effects.
While the above studies suggest overall negative impacts of high-stakes state tests on
instruction, there is also some evidence that the effects are positive. Cizek (2001) argues that
high-stakes accountability testing has had several positive consequences, including more focused
teacher professional development, more appropriate classroom assessments, and more in-depth
teacher knowledge of the subjects taught. He also argues that, contrary to earlier experiences
with standardized testing, state-mandated tests do not, in the main, assess “low-level” or recall
knowledge. Rather, recent tests tend to measure application of knowledge. Roderick and Engel
(2001) found evidence that accountability testing has resulted in more focus on learning for all
students and more individualized instruction. Mehrens (1998), in a review of purported negative
consequences of external testing, concluded that there is little strong evidence of such negative
impacts.
Additional literature has reported little influence of external testing on teaching practices
and pedagogical decision-making (Grant, 2000, 2001; Zancanella, 1992). Cimbricz (2002)
recently reviewed studies that examined the relationship between state-mandated accountability
3
Impact of High-Stakes Test Results
tests and teachers’ beliefs and practices. Her review showed that while such tests do influence
what teachers say and do, the relationship is not simple, clear, or direct. Rather, factors such as
grade level, subject, teaching experience, building-level expectations, and local context seem to
moderate the effects of the testing.
While the literature suggests a mix of positive and negative effects, there is little research on
how specific results of state mandated testing influence teacher beliefs and practices, and factors
that may be related to use of the scores. There is a need for more research that documents how
teachers are impacted when they receive high-stakes test results of their students. One possible
reason for the mixed literature is that central aspects of the testing program in each state are
related to specific consequences. In Virginia, the high-stakes state testing program is based on
established Standards of Learning (SOL). The completely objective tests (with the exception of
writing) are administered in grades 3, 5, 8, and in high school, in major content areas.
More specifically, to examine the effects of receipt of SOL test scores, this study addressed
the following questions:
1. What is the nature and extent of teacher use of SOL test score data?
2. To what extent has usage differed according to grade level (elementary, middle, and
secondary) and subject (English, mathematics, science, and social studies)?
3. What procedural factors influence test usage (e.g., whether last year or current year
students are included; role of the principal, lead teacher, specialist, and department/grade
level chair; when data are obtained; and, format of test data)?
4
Impact of High-Stakes Test Results
Methodology
Sample The sample of teachers was obtained from seven Richmond Virginia school districts.
One-half of all schools in the districts were selected randomly and asked to distribute the survey
to individuals with the following teaching assignments:
• Elementary – all full time regular and special education teachers in grades 3, 4, and 5 • Middle - all full time regular and special education teachers in grade 8 science,
mathematics, English, and social studies
• High School - all full time regular and special education teachers who taught an end-
of-course SOL test class in English, Earth Science, Algebra I, Geometry, World
History I, and US History
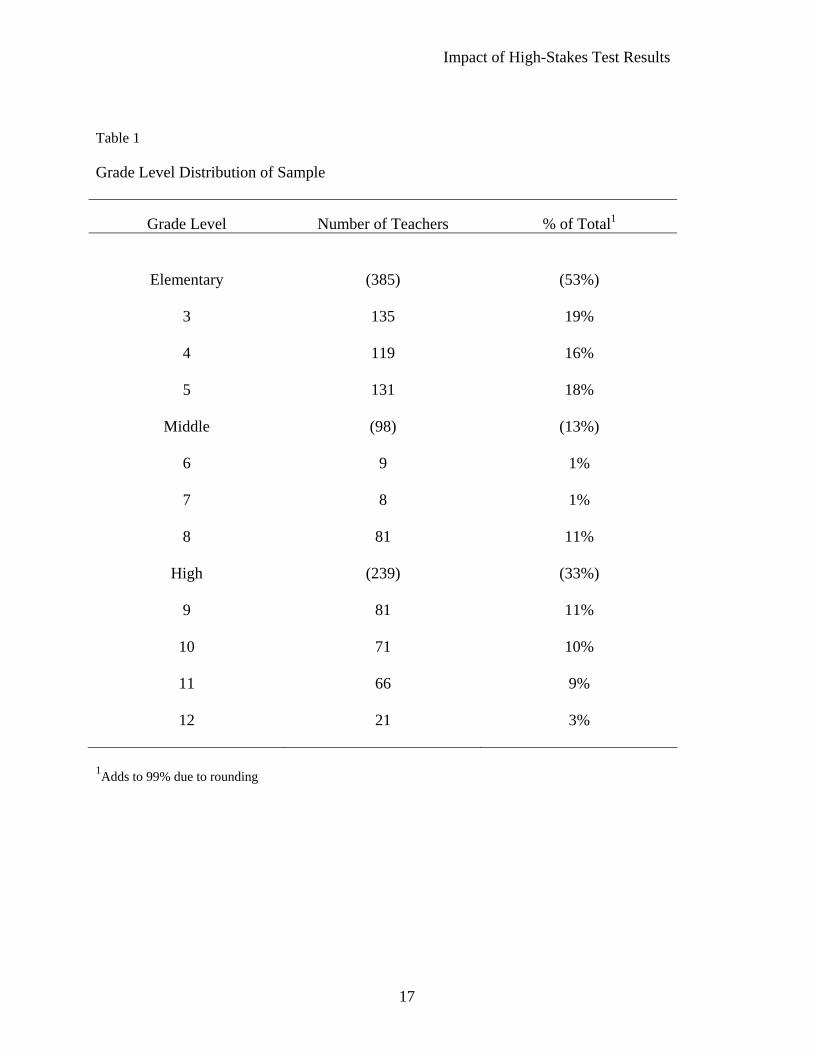
In all, 1,640 surveys were distributed and 722 returned for an overall response rate of
44%. The return rate for elementary teachers was highest at 58%, and elementary teachers
comprised 53% of the final sample. Table 1 provides further details of the sample according
grade level. There were slightly more English and math teachers (29%) than social studies
(22%) or science teachers (20%).
[insert Table 1]
Instrumentation
Data were collected by a written survey that was based on an earlier study by McMillan
(2001), in which it was reported that the survey had an alpha reliability of .80. The questions on
the survey were developed on the basis of previous literature on the effect of high-stakes testing
and the survey in the McMillan (2001) study, and confirmed with a study team consisting of
5
Impact of High-Stakes Test Results
eight public school educators. The survey was pilot-tested for clarity with 33 teachers,
representing elementary, middle, and high school levels. All questions on the survey were
closed-end. The teachers were asked to complete the survey and were then asked, question by
question, if changes would improve clarity. Following this input from teachers, revisions were
made to the survey and it was distributed to teachers through local mail services within the
districts. Completed surveys were returned to principals' offices. There was no information on
the survey that could be used to identify individual teachers.
Demographic data were collected on each teacher's grade level, and primary subject if
middle or high school. A second set of questions asked teachers to indicate which test scores
were received (this year's students, last year's students, or both groups), the format in which the
scores were received (e.g., by individual item or subscales), and the nature of assistance provided
when receiving the scores. The third section asked teachers to indicate, on a five point scale,
whether there will be much more, more, less, much less, or no change in the emphasis on 19
teaching and grading practices during the current academic year that were based on receipt and
analysis of SOL test scores from the previous year.
Findings
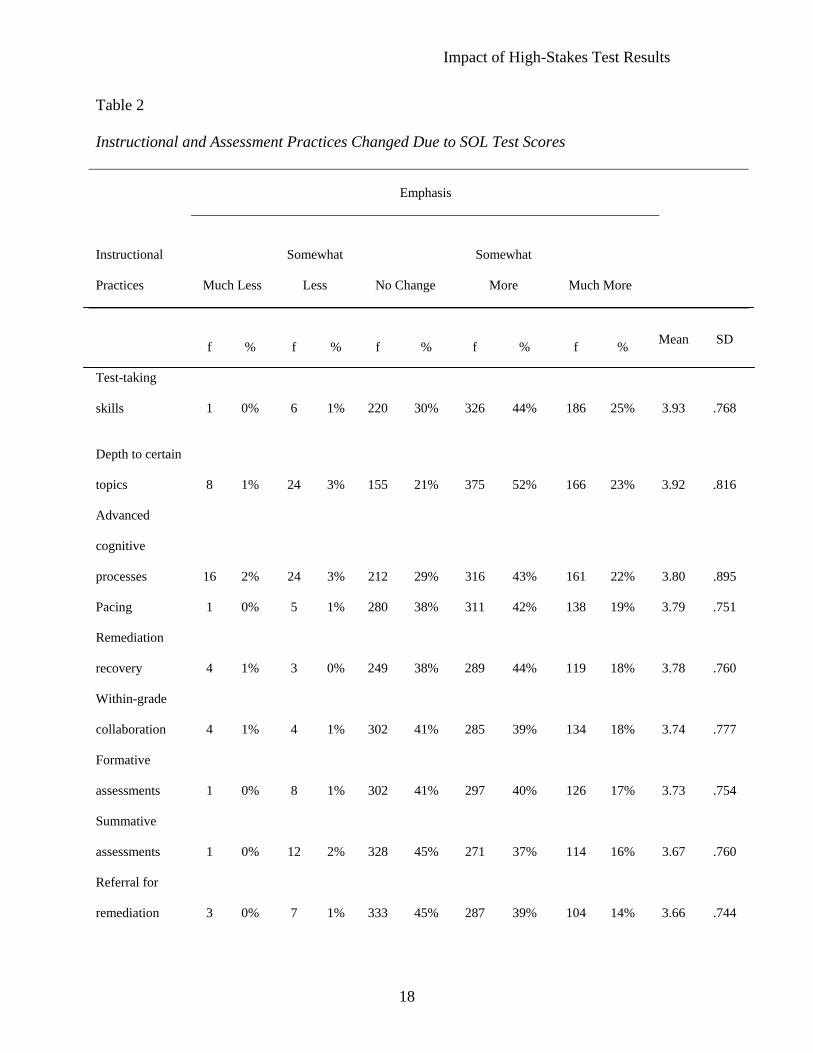
The number and percentages of teachers in each response category for the 19
instructional and assessment practices are presented in Table 2 and rank-ordered by item means.
The results show that the ranking by the means is generally consistent with the percentages of
teachers indicating "much more" change. Instructional and assessment practices with higher
means tend to have higher percentages of teachers changing "much more." Very few teachers
indicated "much less" to any of the practices. For seven of the practices more than 50% of the
respondents indicated "no change." Twelve of the practices showed that more than 50%
6
Impact of High-Stakes Test Results
responded "somewhat more" or "more," with greatest percentages for depth to certain topics
(75%), test-taking skills (69%), and advanced cognitive processes (65%). There were several
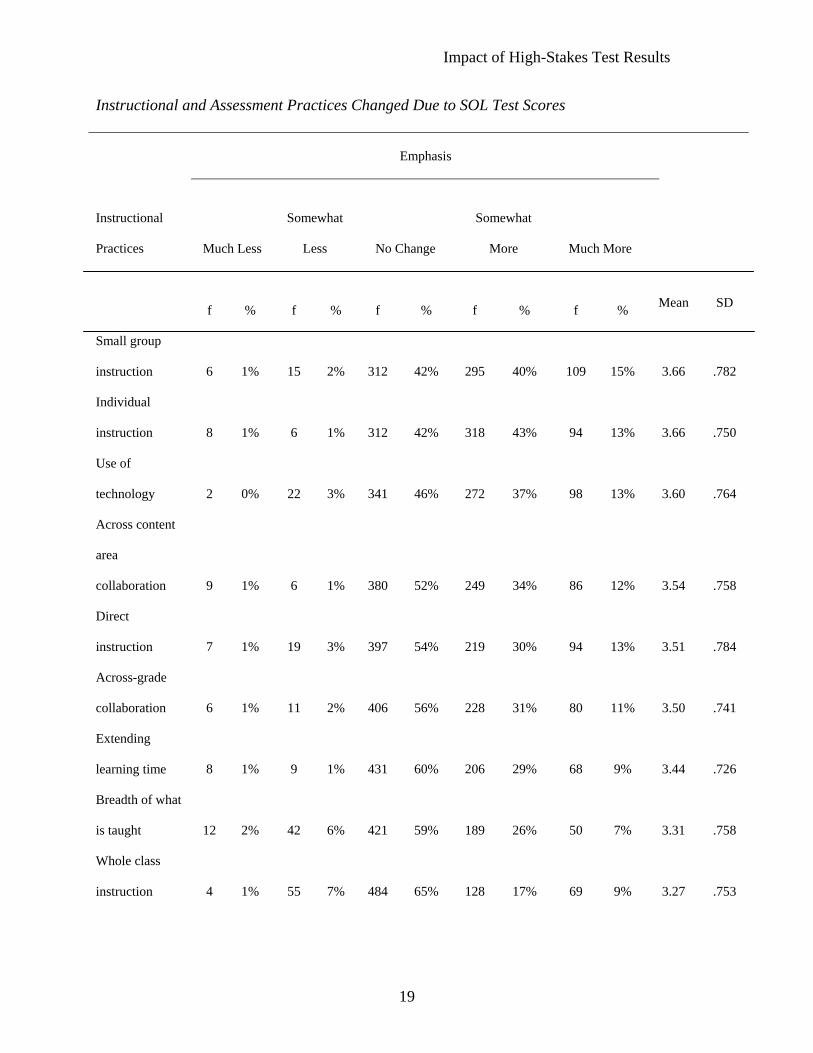
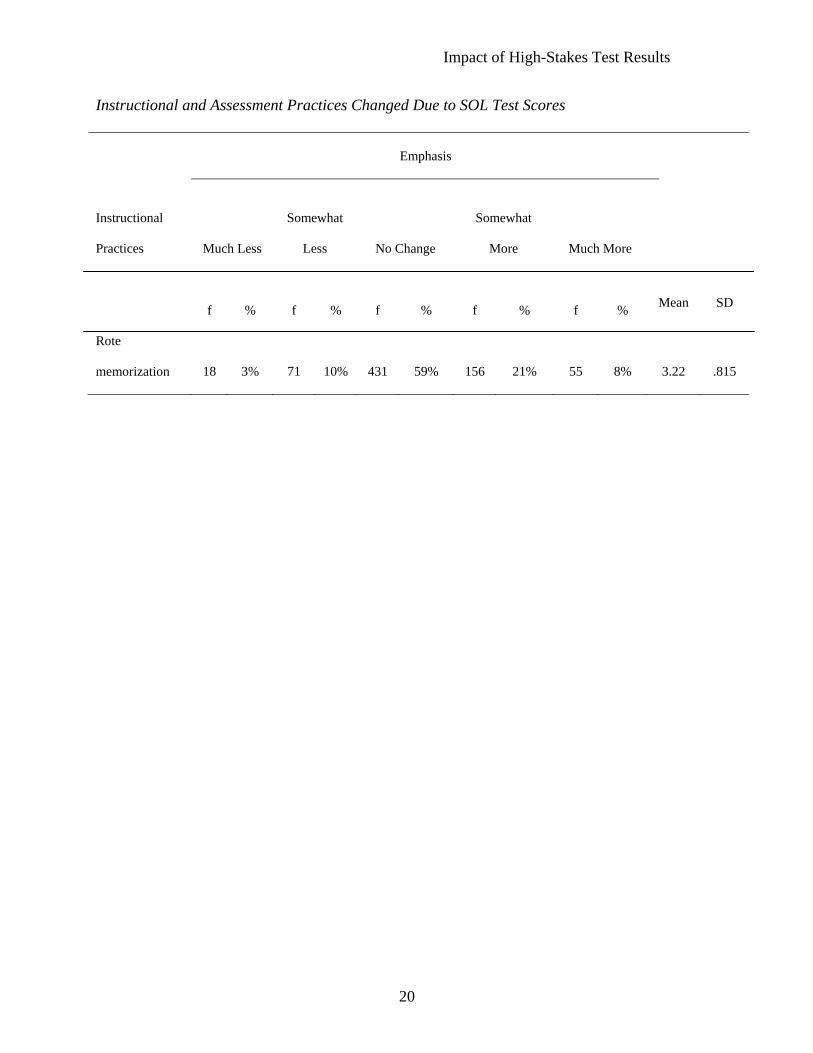
practices which showed a majority of teachers indicating "no change," "somewhat less," or
"somewhat more:" breadth of what is taught (67%), rote memorization (72%), whole class
instruction (73%), extending learning time (62%), across grade collaboration (59%), direct
instruction (58%), and across content area collaboration (54%). It was positive to find that there
is increased within-grade level collaboration and increased use of individualized and small group
instruction.
[insert Table 2]
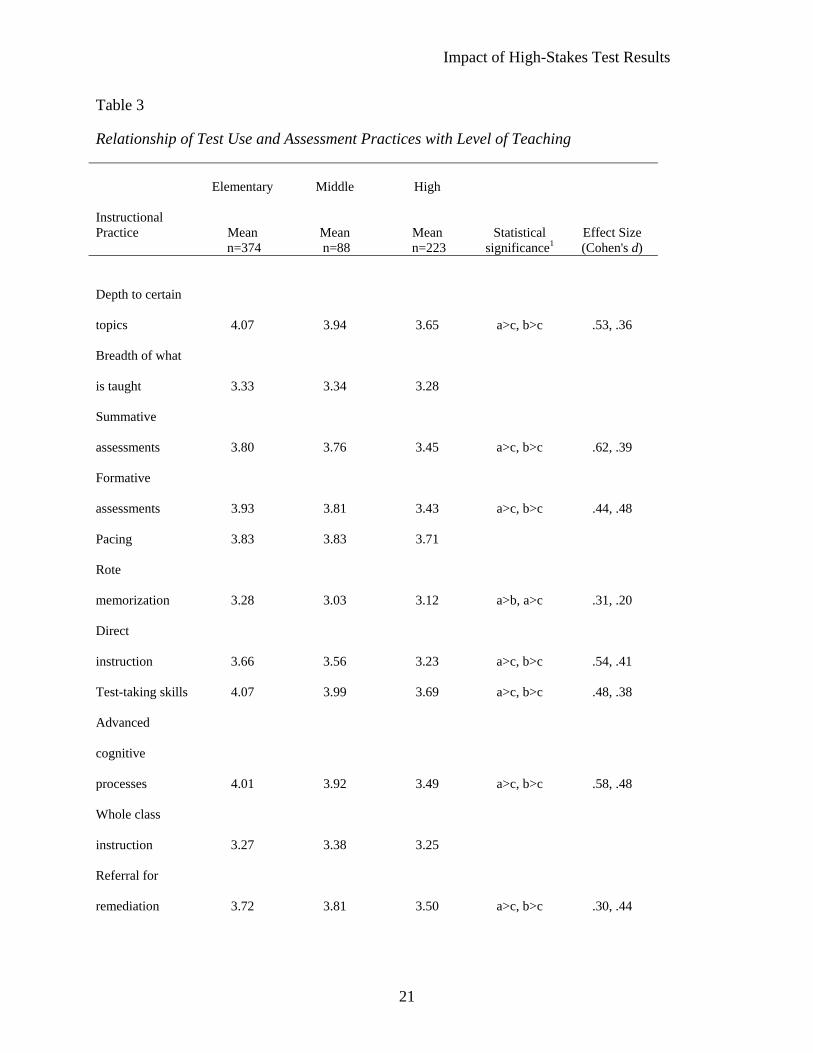
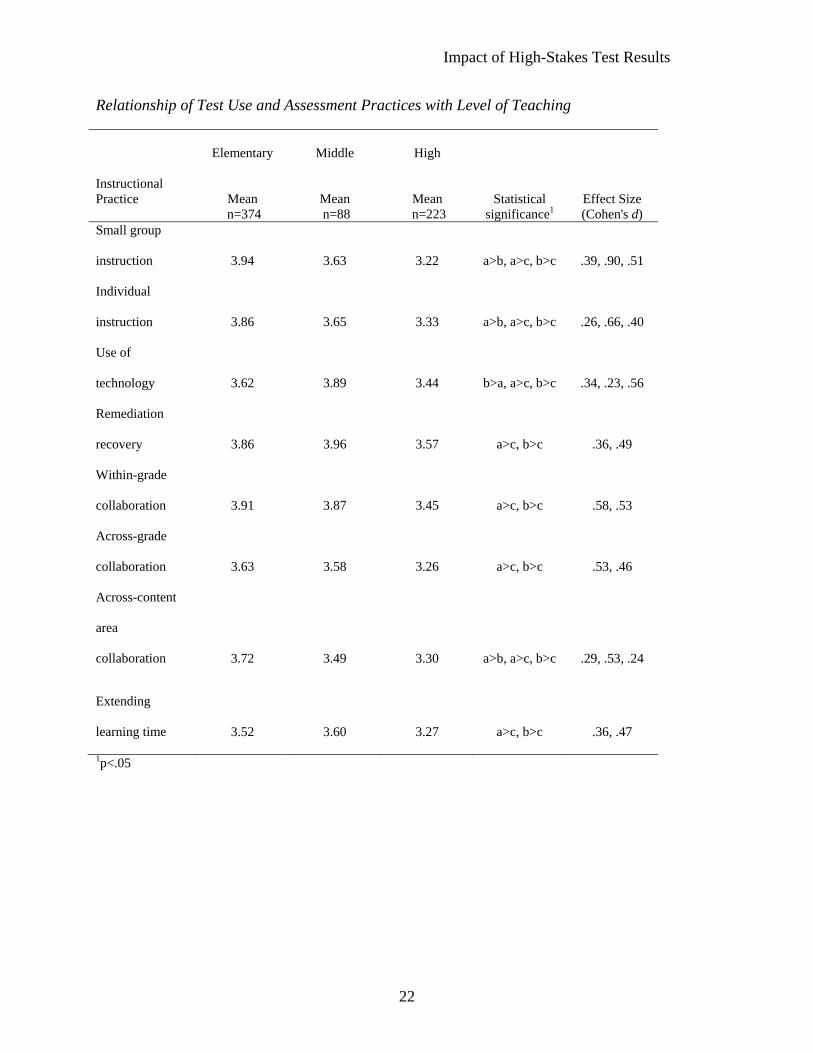
Analysis of variance procedures were used to examine the relationships between changes
in instructional and assessment practices and grade level, and practices and subject taught. Table
3 shows the results of 1 X 3 ANOVAs for each instructional and assessment practice according
to grade level, along with corresponding effect size estimates, using Cohen's d. Overall, these
data showed that there was generally a negative relationship between grade level and changes in
instructional and assessment practices. Clearly, elementary teachers changed more than
secondary teachers. For 15 areas rated, elementary teachers changed more than middle school
and/or high school teachers. The areas showing no difference among the levels of teaching
include breadth of what is taught, pacing, whole class instruction, and use of technology. Use of
technology was the only area that showed elementary teachers changing significantly less than
middle school teachers. The data also consistently show that high school teachers report the least
amount of change. Effect size estimates are generally in the small to moderate level. The effect
size was .90 for the difference between elementary and high school small group instruction,
showing greater use of small groups by elementary teachers. The next largest effect sizes
7
Impact of High-Stakes Test Results
indicated that there was greater use of summative assessments and individualized instruction for
elementary teachers compared to changes of these practices by high school teachers. Slightly
more than one-third of the effect sizes were approximately one-half of a unit of standard
deviation (.5). The remaining effect sizes ranged from .20 to .46, with most of these
approximately one-third to three-eighths of a unit of standard deviation.
[insert Table 3]
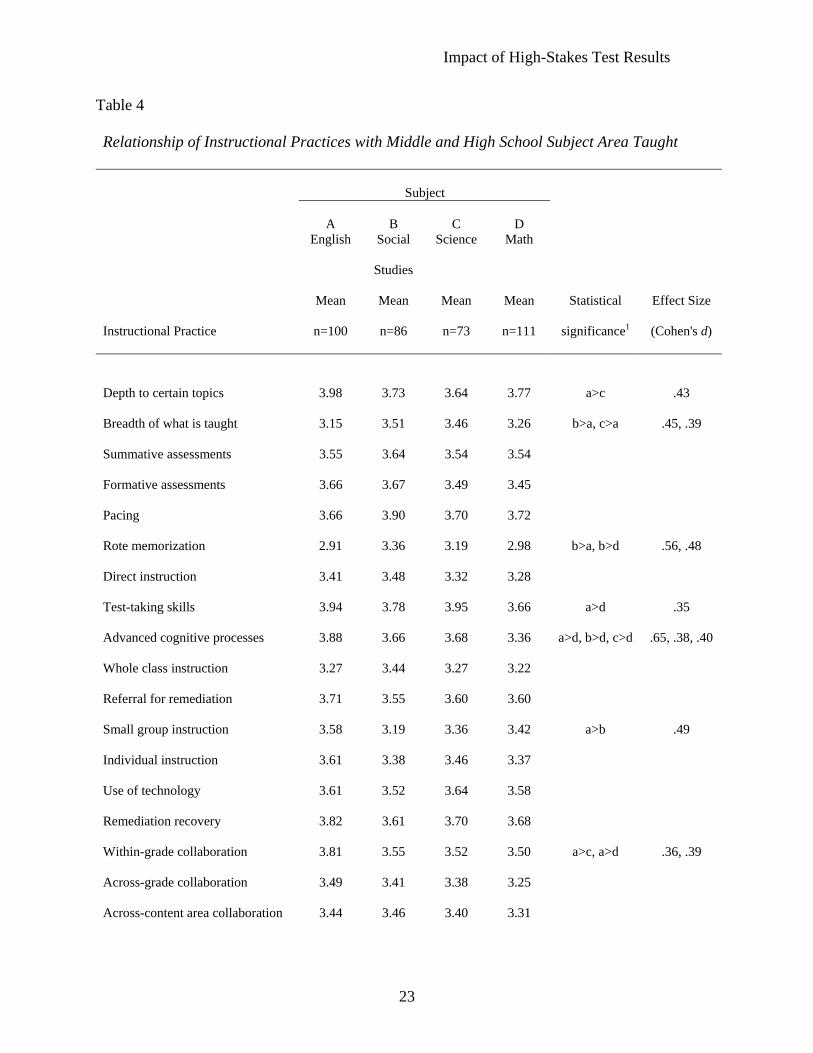
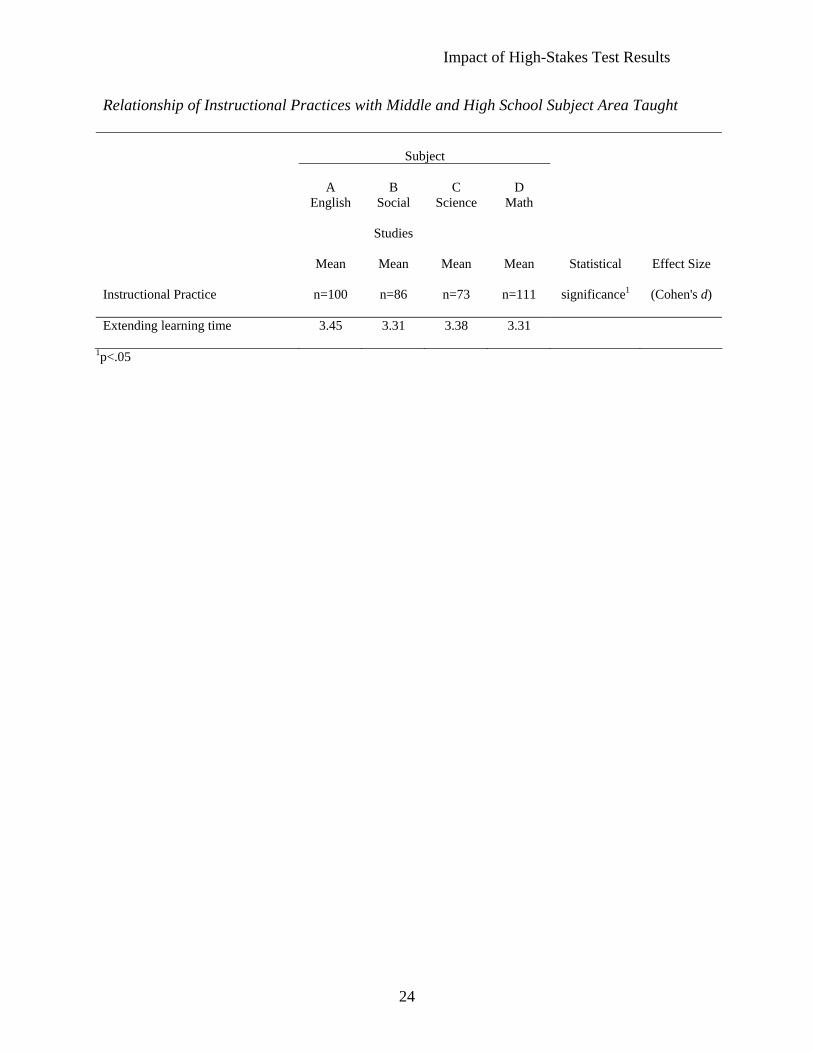
Table 4 summarizes mean scores on changes in instructional practices of middle and high
school teachers in different subject areas. Generally, English teachers reported more change than
the other three subjects in depth to certain topics, test-taking skills, advanced cognitive
processes, small group instruction, and within-grade collaboration. Exceptions were rote
memorization and breadth of coverage, where more change was reported by social studies
teachers. Moderate effect sizes were reported, with the largest difference showing English
teachers using more advanced cognitive processes than social studies teachers (d = .65). Not
surprisingly, social studies teachers indicated significantly more use of rote memorization
compared to English teachers (d = .56).
[insert Table 4]
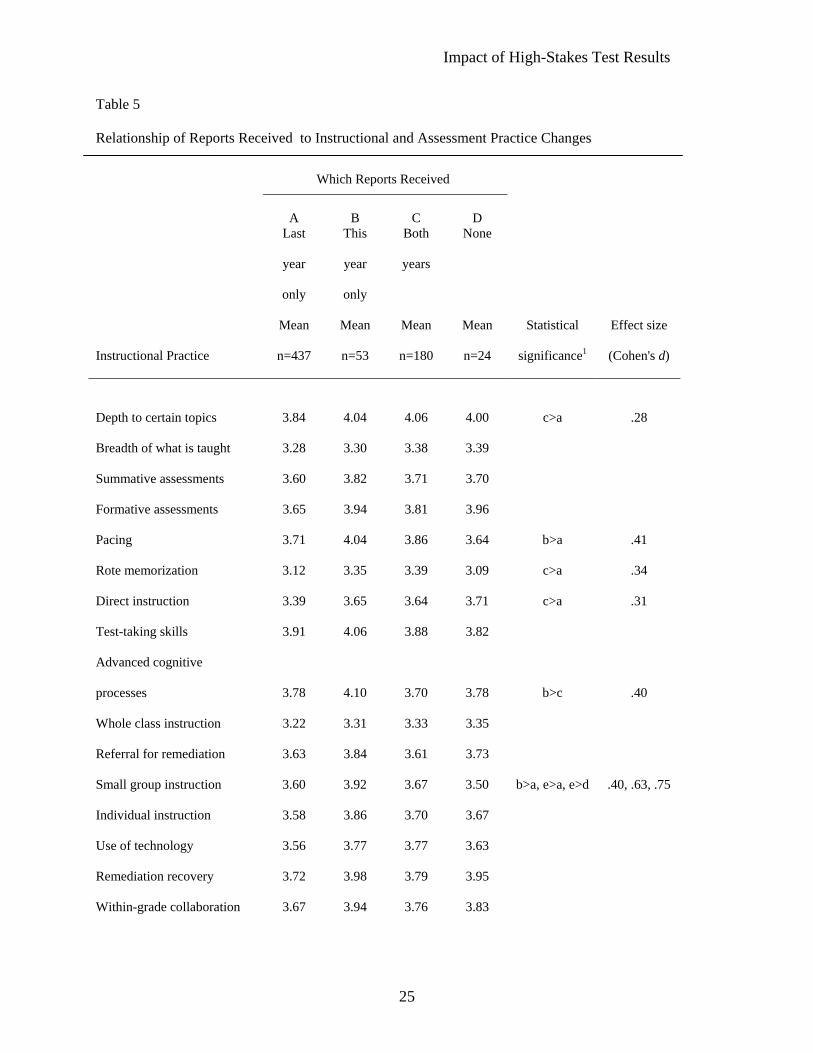
The first procedural factor investigated was to examine differences in instructional and
assessment practices and whether teachers received scores of students they taught in the previous
year changed more than teachers who received scores of current students and/or scores of
students in the prior year. Generally, very few statistically significant differences are reported.
While there is some indication that teachers receiving both this year’s and last year’s student
results changed more for a few instructional practices (depth to certain topics, pacing, rote
memorization, direct instruction, and small group instruction), this trend in the data is tentative.
8
Impact of High-Stakes Test Results
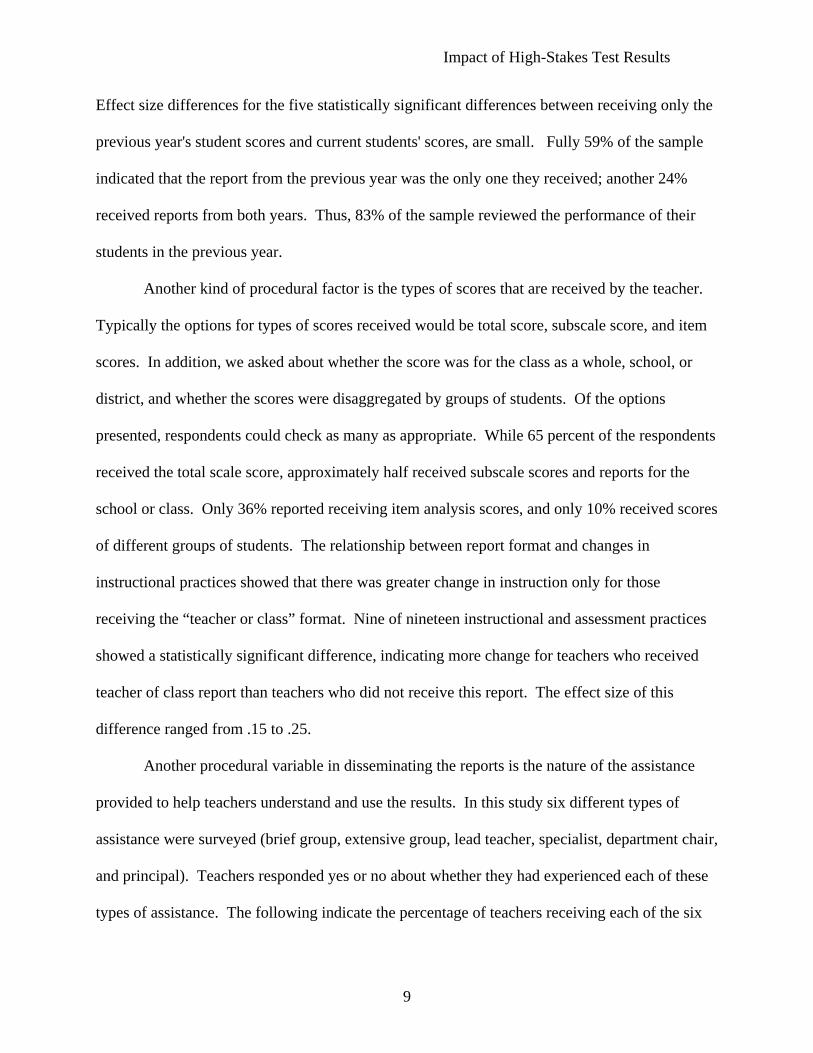
Effect size differences for the five statistically significant differences between receiving only the
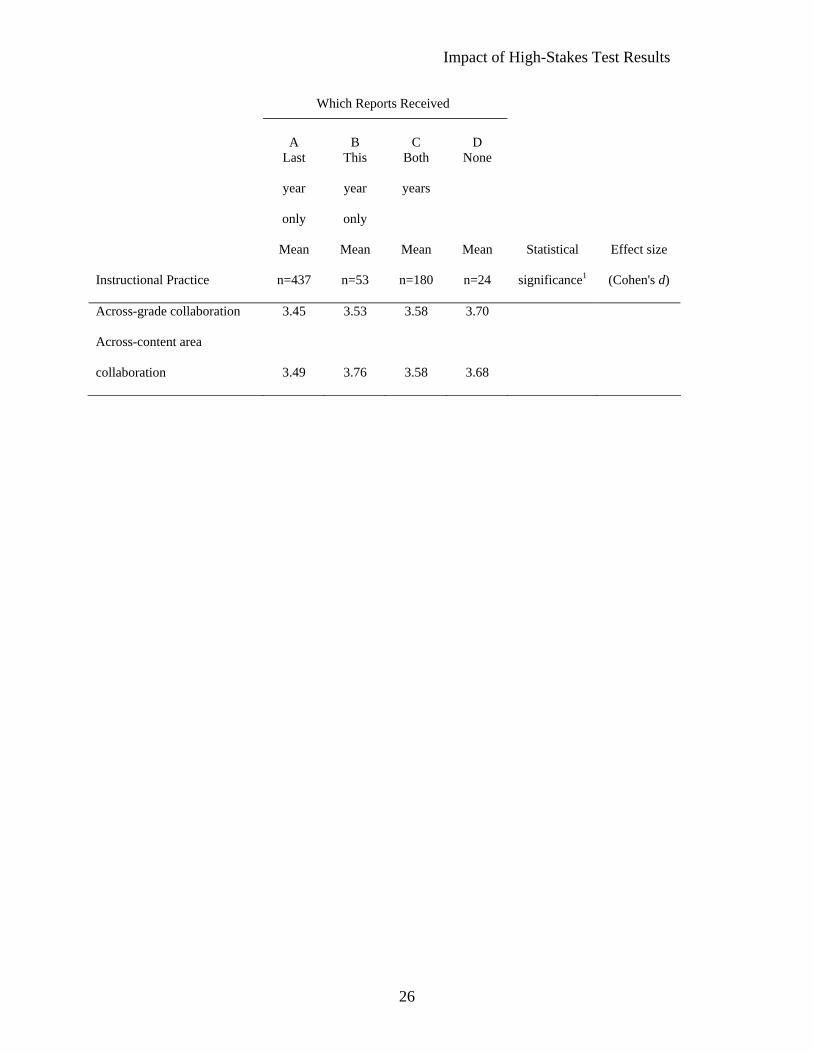
previous year's student scores and current students' scores, are small. Fully 59% of the sample
indicated that the report from the previous year was the only one they received; another 24%
received reports from both years. Thus, 83% of the sample reviewed the performance of their
students in the previous year.
Another kind of procedural factor is the types of scores that are received by the teacher.
Typically the options for types of scores received would be total score, subscale score, and item
scores. In addition, we asked about whether the score was for the class as a whole, school, or
district, and whether the scores were disaggregated by groups of students. Of the options
presented, respondents could check as many as appropriate. While 65 percent of the respondents
received the total scale score, approximately half received subscale scores and reports for the
school or class. Only 36% reported receiving item analysis scores, and only 10% received scores
of different groups of students. The relationship between report format and changes in
instructional practices showed that there was greater change in instruction only for those
receiving the “teacher or class” format. Nine of nineteen instructional and assessment practices
showed a statistically significant difference, indicating more change for teachers who received
teacher of class report than teachers who did not receive this report. The effect size of this
difference ranged from .15 to .25.
Another procedural variable in disseminating the reports is the nature of the assistance
provided to help teachers understand and use the results. In this study six different types of
assistance were surveyed (brief group, extensive group, lead teacher, specialist, department chair,
and principal). Teachers responded yes or no about whether they had experienced each of these
types of assistance. The following indicate the percentage of teachers receiving each of the six
9
Impact of High-Stakes Test Results
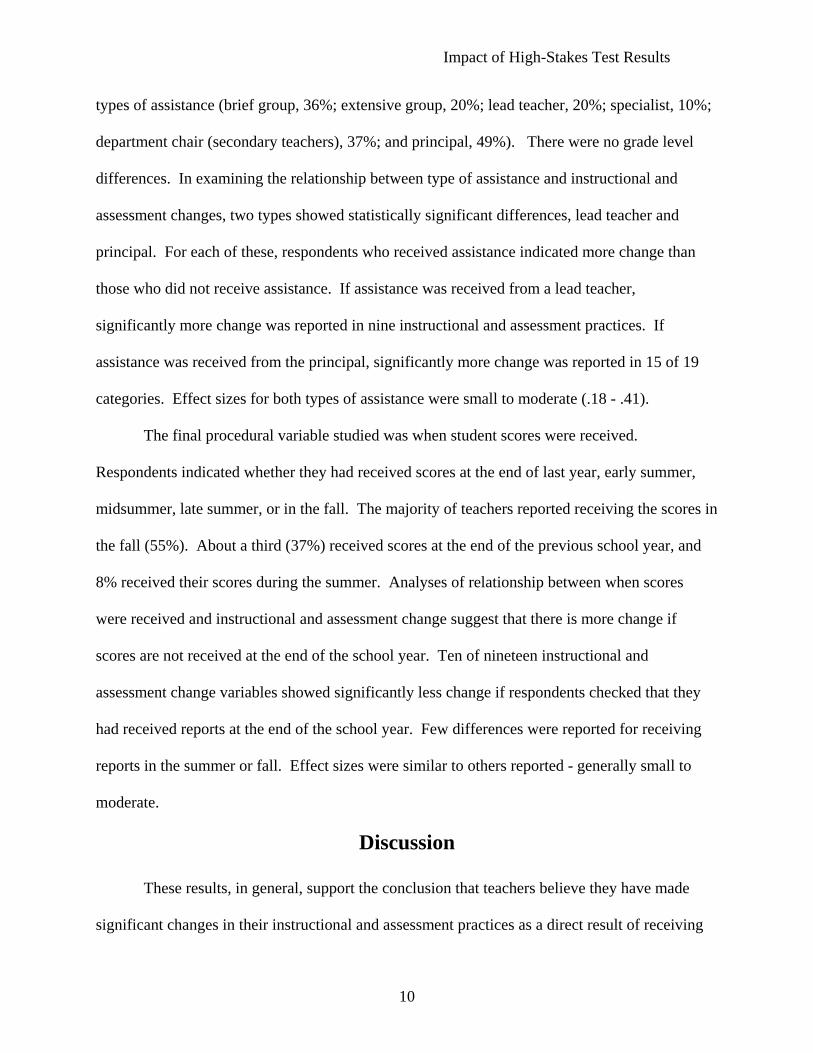
types of assistance (brief group, 36%; extensive group, 20%; lead teacher, 20%; specialist, 10%;
department chair (secondary teachers), 37%; and principal, 49%). There were no grade level
differences. In examining the relationship between type of assistance and instructional and
assessment changes, two types showed statistically significant differences, lead teacher and
principal. For each of these, respondents who received assistance indicated more change than
those who did not receive assistance. If assistance was received from a lead teacher,
significantly more change was reported in nine instructional and assessment practices. If
assistance was received from the principal, significantly more change was reported in 15 of 19
categories. Effect sizes for both types of assistance were small to moderate (.18 - .41).
The final procedural variable studied was when student scores were received.
Respondents indicated whether they had received scores at the end of last year, early summer,
midsummer, late summer, or in the fall. The majority of teachers reported receiving the scores in
the fall (55%). About a third (37%) received scores at the end of the previous school year, and
8% received their scores during the summer. Analyses of relationship between when scores
were received and instructional and assessment change suggest that there is more change if
scores are not received at the end of the school year. Ten of nineteen instructional and
assessment change variables showed significantly less change if respondents checked that they
had received reports at the end of the school year. Few differences were reported for receiving
reports in the summer or fall. Effect sizes were similar to others reported - generally small to
moderate.
Discussion
These results, in general, support the conclusion that teachers believe they have made
significant changes in their instructional and assessment practices as a direct result of receiving
10
Impact of High-Stakes Test Results
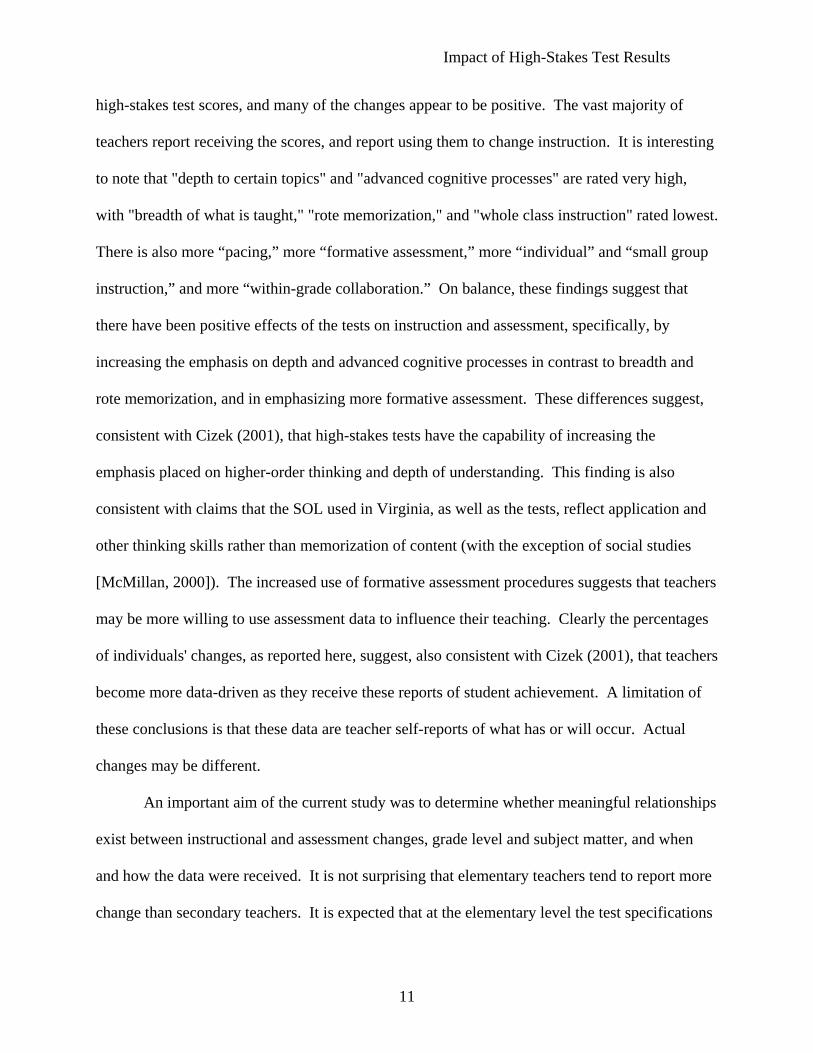
high-stakes test scores, and many of the changes appear to be positive. The vast majority of
teachers report receiving the scores, and report using them to change instruction. It is interesting
to note that "depth to certain topics" and "advanced cognitive processes" are rated very high,
with "breadth of what is taught," "rote memorization," and "whole class instruction" rated lowest.
There is also more “pacing,” more “formative assessment,” more “individual” and “small group
instruction,” and more “within-grade collaboration.” On balance, these findings suggest that
there have been positive effects of the tests on instruction and assessment, specifically, by
increasing the emphasis on depth and advanced cognitive processes in contrast to breadth and
rote memorization, and in emphasizing more formative assessment. These differences suggest,
consistent with Cizek (2001), that high-stakes tests have the capability of increasing the
emphasis placed on higher-order thinking and depth of understanding. This finding is also
consistent with claims that the SOL used in Virginia, as well as the tests, reflect application and
other thinking skills rather than memorization of content (with the exception of social studies
[McMillan, 2000]). The increased use of formative assessment procedures suggests that teachers
may be more willing to use assessment data to influence their teaching. Clearly the percentages
of individuals' changes, as reported here, suggest, also consistent with Cizek (2001), that teachers
become more data-driven as they receive these reports of student achievement. A limitation of
these conclusions is that these data are teacher self-reports of what has or will occur. Actual
changes may be different.
An important aim of the current study was to determine whether meaningful relationships
exist between instructional and assessment changes, grade level and subject matter, and when
and how the data were received. It is not surprising that elementary teachers tend to report more
change than secondary teachers. It is expected that at the elementary level the test specifications
11
Impact of High-Stakes Test Results
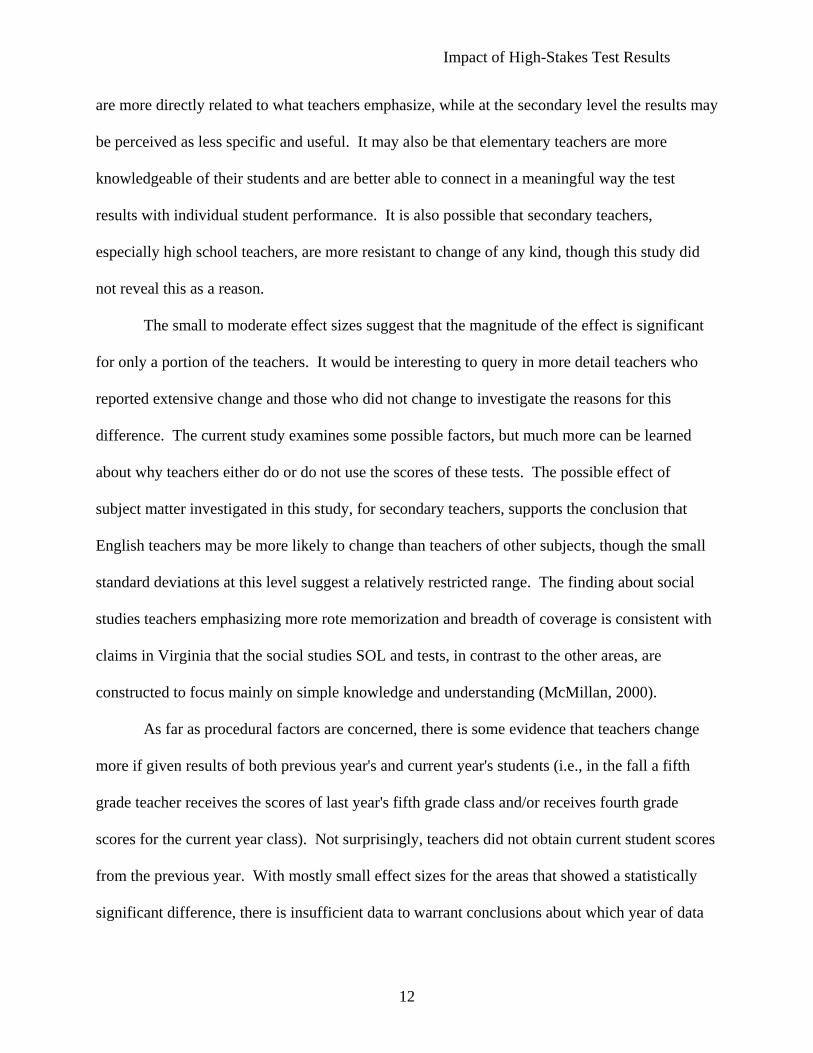
are more directly related to what teachers emphasize, while at the secondary level the results may
be perceived as less specific and useful. It may also be that elementary teachers are more
knowledgeable of their students and are better able to connect in a meaningful way the test
results with individual student performance. It is also possible that secondary teachers,
especially high school teachers, are more resistant to change of any kind, though this study did
not reveal this as a reason.
The small to moderate effect sizes suggest that the magnitude of the effect is significant
for only a portion of the teachers. It would be interesting to query in more detail teachers who
reported extensive change and those who did not change to investigate the reasons for this
difference. The current study examines some possible factors, but much more can be learned
about why teachers either do or do not use the scores of these tests. The possible effect of
subject matter investigated in this study, for secondary teachers, supports the conclusion that
English teachers may be more likely to change than teachers of other subjects, though the small
standard deviations at this level suggest a relatively restricted range. The finding about social
studies teachers emphasizing more rote memorization and breadth of coverage is consistent with
claims in Virginia that the social studies SOL and tests, in contrast to the other areas, are
constructed to focus mainly on simple knowledge and understanding (McMillan, 2000).
As far as procedural factors are concerned, there is some evidence that teachers change
more if given results of both previous year's and current year's students (i.e., in the fall a fifth
grade teacher receives the scores of last year's fifth grade class and/or receives fourth grade
scores for the current year class). Not surprisingly, teachers did not obtain current student scores
from the previous year. With mostly small effect sizes for the areas that showed a statistically
significant difference, there is insufficient data to warrant conclusions about which year of data
12
Impact of High-Stakes Test Results
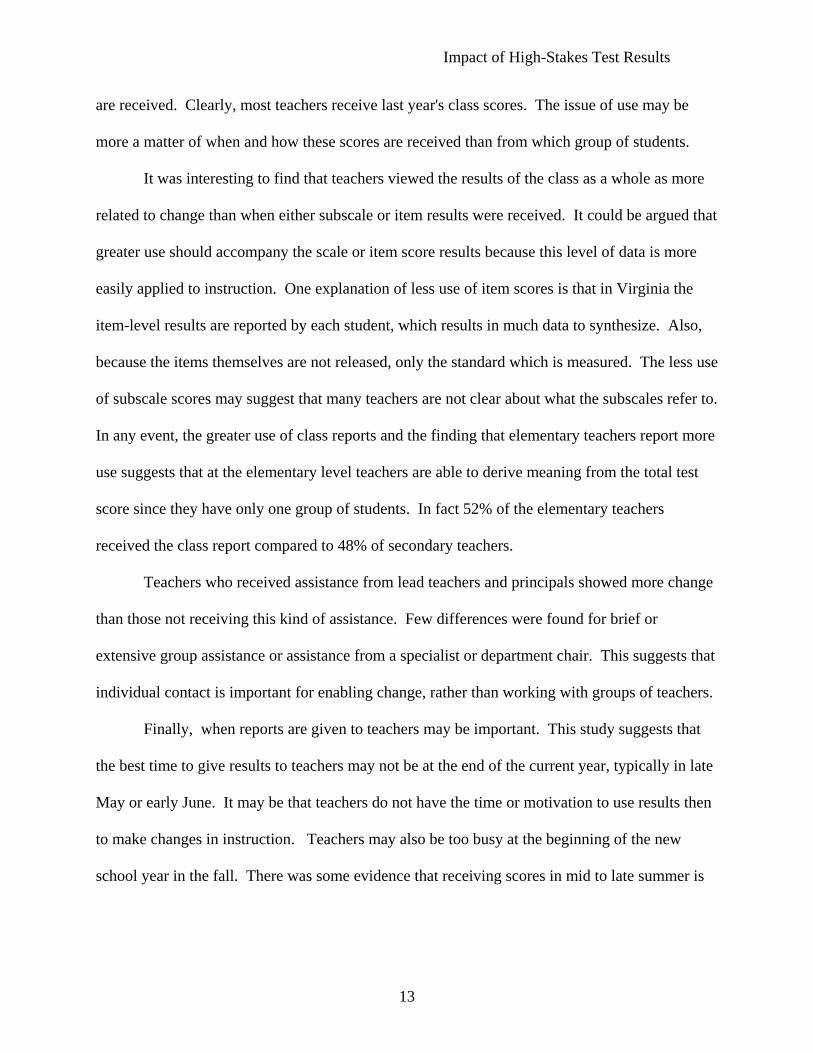
are received. Clearly, most teachers receive last year's class scores. The issue of use may be
more a matter of when and how these scores are received than from which group of students.
It was interesting to find that teachers viewed the results of the class as a whole as more
related to change than when either subscale or item results were received. It could be argued that
greater use should accompany the scale or item score results because this level of data is more
easily applied to instruction. One explanation of less use of item scores is that in Virginia the
item-level results are reported by each student, which results in much data to synthesize. Also,
because the items themselves are not released, only the standard which is measured. The less use
of subscale scores may suggest that many teachers are not clear about what the subscales refer to.
In any event, the greater use of class reports and the finding that elementary teachers report more
use suggests that at the elementary level teachers are able to derive meaning from the total test
score since they have only one group of students. In fact 52% of the elementary teachers
received the class report compared to 48% of secondary teachers.
Teachers who received assistance from lead teachers and principals showed more change
than those not receiving this kind of assistance. Few differences were found for brief or
extensive group assistance or assistance from a specialist or department chair. This suggests that
individual contact is important for enabling change, rather than working with groups of teachers.
Finally, when reports are given to teachers may be important. This study suggests that
the best time to give results to teachers may not be at the end of the current year, typically in late
May or early June. It may be that teachers do not have the time or motivation to use results then
to make changes in instruction. Teachers may also be too busy at the beginning of the new
school year in the fall. There was some evidence that receiving scores in mid to late summer is
13
Impact of High-Stakes Test Results
related to more change in instruction. Perhaps this is during a time period when teachers can
seriously study the results and think about implications of the results for their students.
The data gathered in this study suggest a number of conclusions and implications
concerning the effective use of high-stakes test results by teachers to change instruction and
assessment. It should be noted, however, that the data are descriptive and correlational; hence,
causal conclusions and implications should not be made. This study suggests that high-stakes
tests may encourage teachers to provide more depth in teaching subjects, to focus more on higher
level cognition, to use more formative assessments, and to use more individualized and small
group instruction, rather than to emphasize rote learning, direct teaching for English, science,
and mathematics, and whole class instruction. In Virginia, this is consistent with the rigorous
nature of standards upon which the high-stakes tests are based. Also, increased use of test results
may be related to when the results are obtained by the teachers, who assists them in interpreting
the results, and the type of scores reported. This study found that most teachers used the scores
and changed in positive ways, in ways that have not been found for teaching in the context of
high-stakes minimum competency testing. Further research on how results of high-stakes tests
are used to change instruction and assessment is needed to formulate formatting and distribution
procedures that will maximize appropriate use of the scores.
14
Impact of High-Stakes Test Results
References
Abrams, L. M., & Madaus, G. F. (2003). The lessons of high-stakes testing. Educational
Leadership, 61(3), 31-35.
Amrein, A L., & Berliner, D. C. (2002). High-stakes testing, uncertainty, and student learning.
Educational Policy Analysis Archives, 10(18). Available:
http://epaa.asu.edu/epaa/v10n18.html
Cimbricz, S. (2002). State-Mandated Testing and Teachers’ Beliefs and Practice. Educational
Policy Analysis Archives [On-line serial], 10(2). Available:
http://epaa.asu.edu/epaa/v10n2.html
Cizek, G. J. (2001). More unintended consequences of high-stakes testing. Educational
Measurement: Issues and Practice. 20 (4), 19-27.
Glasnapp, D. R., Poggio, J. P., & Miller, D. M. (1991). Impact of a “low stakes” state minimum
competency testing program on policy, attitudes, and achievement. In R. E. Stake (Ed.),
Advances in program evaluation: Vol. 1. Effects of mandated assessment on teaching (pp. 101
-140). Greenwich, CT: JAI press Ltd.
Grant, S. G. (2000). Teachers and tests: Exploring teachers’ perceptions of changes in the New
York State-mandated testing Program. Educational Policy Analysis Archives [On-line
serial], 8(14). Available: http://epaa.asu/edi/epaa/v8n14.html
Grant, S. G. (2001). An uncertain lever: Exploring the influence of state-level testing on
teaching social studies. Teachers College Record, 103(3), 398-426.
Haney, W. (2000). The myth of the Texas miracle in education. Educational Policy Analysis
Archives [On-line serial], 8(14). Available:
15
Impact of High-Stakes Test Results
http://epaa.asu.edu/epaa/v8n41.html
McMillan, J. H. (2000). Raising SOL test scores through improved classroom assessment.
Presentation at the Annual Meeting of the Virginia Association of Test Directors,
Richmond, VA.
McMillan, J. H. (2001). Secondary teachers’ classroom assessment and grading practices.
Educational Measurement: Issues and Practice, 20(1), p. 20-32.
Mehrens, W. A. (1998). Consequences of assessment: What is the evidence? Education Policy
Analysis Archives, 6(13). Available: http://epaa.asu.edu/epaa/v6n13.html
Roderick, M., & Engel, M. (2001) The grasshopper and the ant: Motivational responses of low
achieving students to high-stakes testing. Educational Evaluation and Policy Analysis,
23(3), 197-228.
Shepard, L. A. (2002). The hazards of high-stakes testing. Issues in Science and Technology
Online. 19(2). Available: http://www.nap.edu/issues/19/2/shepard
Smith, M. L. (1991). Put to the test: The effects of external testing on teachers. Educational
Researcher, 20(5), 8-11.
Smith, M. L., Edelsky, C., Draper, K., Rottenberg, C., & Cherland, M. (1989). The role of
testing in elementary schools. Los Angeles, CA: Center for Research on Educational
Standards and Student Tests, Graduate School of Education, UCLA.
Zancanella, D. (1992). The influence of state-mandated testing on teachers of literature.
Educational Evaluation and Policy Analysis, 14(3), 283-295.
16
Impact of High-Stakes Test Results
Table 1 Grade Level Distribution of Sample
Grade Level Number of Teachers % of Total1
Elementary (385) (53%)
3 135 19%
4 119 16%
5 131 18%
Middle (98) (13%)
6 9 1%
7 8 1%
8 81 11%
High (239) (33%)
9 81 11%
10 71 10%
11 66 9%
12 21 3%
1Adds to 99% due to rounding
17
Impact of High-Stakes Test Results
Table 2
Instructional and Assessment Practices Changed Due to SOL Test Scores Emphasis
Instructional
Practices
Somewhat
Less
Somewhat
More
Much Less No Change Much More
Mean SD f % f % f % f % f %
Test-taking
skills 1 0% 6 1% 220 30% 326 44% 186 25% 3.93 .768
Depth to certain
topics
8 1% 24 3% 155 21% 375 52% 166 23% 3.92 .816
Advanced
cognitive
processes 16 2% 24 3% 212 29% 316 43% 161 22% 3.80 .895
Pacing 1 0% 5 1% 280 38% 311 42% 138 19% 3.79 .751
Remediation
recovery 4 1% 3 0% 249 38% 289 44% 119 18% 3.78 .760
Within-grade
collaboration 4 1% 4 1% 302 41% 285 39% 134 18% 3.74 .777
Formative
assessments 1 0% 8 1% 302 41% 297 40% 126 17% 3.73 .754
Summative
assessments 1 0% 12 2% 328 45% 271 37% 114 16% 3.67 .760
Referral for
remediation 3 0% 7 1% 333 45% 287 39% 104 14% 3.66 .744
18
Impact of High-Stakes Test Results
Instructional and Assessment Practices Changed Due to SOL Test Scores Emphasis
Instructional
Practices
Somewhat
Less
Somewhat
More
Much Less No Change Much More
Mean SD f % f % f % f % f %
Small group
instruction 6 1% 15 2% 312 42% 295 40% 109 15% 3.66 .782
Individual
instruction 8 1% 6 1% 312 42% 318 43% 94 13% 3.66 .750
Use of
technology 2 0% 22 3% 341 46% 272 37% 98 13% 3.60 .764
Across content
area
collaboration 9 1% 6 1% 380 52% 249 34% 86 12% 3.54 .758
Direct
instruction 7 1% 19 3% 397 54% 219 30% 94 13% 3.51 .784
Across-grade
collaboration 6 1% 11 2% 406 56% 228 31% 80 11% 3.50 .741
Extending
learning time 8 1% 9 1% 431 60% 206 29% 68 9% 3.44 .726
Breadth of what
is taught 12 2% 42 6% 421 59% 189 26% 50 7% 3.31 .758
Whole class
instruction 4 1% 55 7% 484 65% 128 17% 69 9% 3.27 .753
19
Impact of High-Stakes Test Results
Instructional and Assessment Practices Changed Due to SOL Test Scores Emphasis
Instructional
Practices
Somewhat
Less
Somewhat
More
Much Less No Change Much More
Mean SD f % f % f % f % f %
Rote
memorization 18 3% 71 10% 431 59% 156 21% 55 8% 3.22 .815
20
Impact of High-Stakes Test Results
Table 3 Relationship of Test Use and Assessment Practices with Level of Teaching
Elementary Middle High Instructional Practice
Mean Mean Mean Statistical
significanceEffect Size
1 (Cohen's d) n=374 n=88 n=223
Depth to certain
topics
.53, .36 4.07 3.94 3.65 a>c, b>c
Breadth of what
is taught 3.33 3.34 3.28
Summative
assessments 3.80 3.76 3.45 a>c, b>c .62, .39
Formative
assessments 3.93 3.81 3.43 a>c, b>c .44, .48
Pacing 3.83 3.83 3.71
Rote
memorization 3.28 3.03 3.12 a>b, a>c .31, .20
Direct
instruction 3.66 3.56 3.23 a>c, b>c .54, .41
Test-taking skills 4.07 3.99 3.69 a>c, b>c .48, .38
Advanced
cognitive
processes 4.01 3.92 3.49 a>c, b>c .58, .48
Whole class
instruction 3.27 3.38 3.25
Referral for
remediation 3.72 3.81 3.50 a>c, b>c .30, .44
21
Impact of High-Stakes Test Results
Relationship of Test Use and Assessment Practices with Level of Teaching
Elementary Middle High Instructional Practice
Mean Mean Mean Statistical
significanceEffect Size
1 (Cohen's d) n=374 n=88 n=223 Small group
instruction 3.94 3.63 3.22 a>b, a>c, b>c .39, .90, .51
Individual
instruction 3.86 3.65 3.33 a>b, a>c, b>c .26, .66, .40
Use of
technology 3.62 3.89 3.44 b>a, a>c, b>c .34, .23, .56
Remediation
recovery 3.86 3.96 3.57 a>c, b>c .36, .49
Within-grade
collaboration 3.91 3.87 3.45 a>c, b>c .58, .53
Across-grade
collaboration 3.63 3.58 3.26 a>c, b>c .53, .46
Across-content
area
collaboration 3.72 3.49 3.30 a>b, a>c, b>c .29, .53, .24
Extending
learning time 3.52 3.60 3.27 a>c, b>c .36, .47
1p<.05
22
Impact of High-Stakes Test Results
Table 4 Relationship of Instructional Practices with Middle and High School Subject Area Taught Subject
A B C D English Social
Studies
Science Math
Mean Mean Mean Mean Statistical
significance
Effect Size
1 (Cohen's d) n=111 Instructional Practice n=100 n=86 n=73
Depth to certain topics 3.98 3.73 3.64 3.77 a>c .43
Breadth of what is taught 3.15 3.51 3.46 3.26 b>a, c>a .45, .39
Summative assessments 3.55 3.64 3.54 3.54
Formative assessments 3.66 3.67 3.49 3.45
Pacing 3.66 3.90 3.70 3.72
Rote memorization 2.91 3.36 3.19 2.98 b>a, b>d .56, .48
Direct instruction 3.41 3.48 3.32 3.28
Test-taking skills 3.94 3.78 3.95 3.66 a>d .35
Advanced cognitive processes 3.88 3.66 3.68 3.36 a>d, b>d, c>d .65, .38, .40
Whole class instruction 3.27 3.44 3.27 3.22
Referral for remediation 3.71 3.55 3.60 3.60
Small group instruction 3.58 3.19 3.36 3.42 a>b .49
Individual instruction 3.61 3.38 3.46 3.37
Use of technology 3.61 3.52 3.64 3.58
Remediation recovery 3.82 3.61 3.70 3.68
Within-grade collaboration 3.81 3.55 3.52 3.50 a>c, a>d .36, .39
Across-grade collaboration 3.49 3.41 3.38 3.25
Across-content area collaboration 3.44 3.46 3.40 3.31
23
Impact of High-Stakes Test Results
Relationship of Instructional Practices with Middle and High School Subject Area Taught Subject
A B C D English Social
Studies
Science Math
Mean Mean Mean Mean Statistical
significance
Effect Size
1 (Cohen's d) n=111 Instructional Practice n=100 n=86 n=73
Extending learning time 3.45 3.31 3.38 3.31
1p<.05
24
Impact of High-Stakes Test Results
Table 5 Relationship of Reports Received to Instructional and Assessment Practice Changes Which Reports Received
A B C D
Last
year
only
This
year
only
Both
years
None
Mean Mean Mean Mean Statistical
significance
Effect size
1 (Cohen's d) Instructional Practice n=437 n=53 n=180 n=24
Depth to certain topics 3.84 4.04 4.06 4.00 c>a .28
Breadth of what is taught 3.28 3.30 3.38 3.39
Summative assessments 3.60 3.82 3.71 3.70
Formative assessments 3.65 3.94 3.81 3.96
Pacing 3.71 4.04 3.86 3.64 b>a .41
Rote memorization 3.12 3.35 3.39 3.09 c>a .34
Direct instruction 3.39 3.65 3.64 3.71 c>a .31
Test-taking skills 3.91 4.06 3.88 3.82
Advanced cognitive
processes 3.78 4.10 3.70 3.78 b>c .40
Whole class instruction 3.22 3.31 3.33 3.35
Referral for remediation 3.63 3.84 3.61 3.73
Small group instruction 3.60 3.92 3.67 3.50 b>a, e>a, e>d .40, .63, .75
Individual instruction 3.58 3.86 3.70 3.67
Use of technology 3.56 3.77 3.77 3.63
Remediation recovery 3.72 3.98 3.79 3.95
Within-grade collaboration 3.67 3.94 3.76 3.83
25
Impact of High-Stakes Test Results
Which Reports Received
A B C D
Last
year
only
This
year
only
Both
years
None
Mean Mean Mean Mean Statistical
significance
Effect size
1 (Cohen's d) Instructional Practice n=437 n=53 n=180 n=24
Across-grade collaboration 3.45 3.53 3.58 3.70
Across-content area
collaboration 3.49 3.76 3.58 3.68
26