Embed Size (px)
Citation preview
The Impact of Land Use Regulation on RacialSegregation: Evidence from Massachusetts Zoning
Borders
Matthew Resseger
Harvard University
November 26, 2013
Abstract
Local zoning regulations such as minimum lot size requirements and restric-tions on the permitting of multi-family housing may exacerbate racial segrega-tion by reducing in some neighborhoods the construction of units that appeal toprospective minority residents. Although this hypothesis has long been recog-nized by urban economists and other social scientists, the lack of uniform landuse data across jurisdictions has made empirical progress difficult. Using de-tailed spatial data available for all municipalities in Massachusetts I investigatethe impact of density zoning regulation on location choices by race. Capital-izing on the geographic detail in the data, I focus on variation in block-levelracial composition within narrow bands around zone borders within jurisdic-tions, mitigating omitted variable concerns that arise in studies focusing onlarger geographic units. My results imply a large role for local zoning regula-tion, particularly the permitting of dense multi-family structures, in explainingdisparate racial location patterns. Blocks zoned for multi-family housing haveblack population shares 3.36 percentage points higher and Hispanic populationshares 5.77 percentage points higher than single-family zoned blocks directlyacross a border from them. Using the results to simulate an equalization ofzoning regulation across the metro area suggests that over half the differencebetween levels of segregation in the stringently zoned Boston and lightly zonedHouston metro areas can be explained by zoning regulation alone.
1
1 Introduction
Since the advent of mass suburbanization in the middle of the 20th century, the racial
geography of most American metropolitan areas has followed a familiar pattern. Black
and Hispanic households reside in neighborhoods proximate to the dense urban core,
with the population of each subsequent ring of suburbs becoming whiter and more
sparsely populated. Even as racial segregation may have peaked (Glaeser and Vigdor,
2012) and minority suburbanization has drawn increased attention (Weise, 2004), the
relationship between the black population and residential density remains striking,
particularly in Northern and Midwestern cities.
Density is not merely the outcome of a decentralized housing market. Local
zoning regulations have played a key role in keeping lot sizes large and multi-family
housing rare in many jurisdictions. As the prevalence of restrictive zoning regulations
increased in the 1960s and 1970s, the question arose among economists and other
urban scholars whether such laws were causing increased racial segregation. While the
letter of the law was exclusionary only towards certain classes of residential land use,
many hypothesized that the true impact extended towards exclusion of classes and
races of people. In some cases historians have documented that such outcomes were
in fact the intent of the laws, pointing towards jurisdictions enacting such regulation
in the wake of Supreme Court cases striking down communities’ abilities to enforce
racial segregation through public regulation in 1917 or private restrictive covenants
in 1948 (Danielson, 1976).
Regardless of the intent of such laws, the causal impact of zoning regulation on
residential segregation remains an open empirical question. Though the strong corre-
lation between density and minority concentration is readily apparent in population
data, the relative scarcity of comprehensive zoning datasets has made gaining traction
on the question difficult. The types of statutes used to restrict building differ con-
siderably across jurisdictions, leaving researchers with a maze of lot size restrictions,
2
frontage and setback regulations, floor to area ratios, and specific use prohibitions cou-
pled with procedures for negotiating allowances through layers of local bureaucracy.
Fortunately, in recent years researchers and government agencies have compiled com-
prehensive and navigable land use restriction datasets that make progress on this
question achievable.
Taking advantage of particularly detailed spatial data made available to the public
by the Massachusetts Office of Geographic Information (MassGIS) I am able here to
assess the impact of zoning restrictions on minority population shares at the block
level within jurisdictions in the major metropolitan areas of Massachusetts. The
geographic detail of the data allows me to conduct an analysis of the impact of
zoning regulation on minority population shares on either side of borders where land
use regulation changes.
My focus on the impact of narrow spatial variation in land use restriction allows
me to circumvent many of the omitted variable concerns that arise at higher levels of
geographic aggregation. While zoning regulation may be one of the driving forces of
racial segregation, there are many other factors that drive minorities and whites to live
in different communities. Racial residential location could be influenced by historical
settlement patterns that developed in the aftermath of the great black migration of
the early 20th century and subsequent white suburbanization, by access to public
transportation, differing willingness and ability to pay for local amenities and public
goods, housing discrimination or decentralized racism. To the extent these factors
differ between places with high and low levels of land use regulation, estimates of the
impact of such laws may be confounded.
By zeroing in on differences in racial population shares along narrow bands on
either side of within jurisdiction zoning borders I am able to minimize the impact
of these other city and neighborhood factors that should vary more continuously
across the boundary. Though some caution is warranted in taking these boundaries
3
as exogenous to racial population shares, I argue that such concerns are lessened given
the consistency of these laws over long time periods, and my ability to restrict the
dataset to boundaries not coincident with other natural and manmade features.
Using this border design I find robust evidence that land use regulation does
negatively impact minority population shares on more restrictively zoned blocks in
the 2010 Census. Increasing the allowable density by ten dwelling units per acre,
roughly the standard deviation in the Massachusetts metropolitan areas, increases the
block’s black share by 3.8 percentage points and the Hispanic share by 5 percentage
points, roughly doubling the base share for both groups. The impact of by right
allowance of multi-family housing is particularly strong for both groups, and this is
as true in the suburbs as the urban core. Permitting multi-family housing leads to a
3.36 percentage point higher black share and a 5.77 percentage point increase in the
Hispanic share.
The impact, particularly for Hispanics, has grown stronger over the last 20 years
and land use regulation is strongly predictive of growth in block-level minority shares
between 1990 and 2010. I conclude by extrapolating these findings to the metro
area level, finding that equalizing zoning across the Boston Metro Area could more
than halve the gap between heavily zoned Boston and lightly zoned Houston on a
common segregation measure. These results strongly confirm the hypothesis that
zoning negatively impacts racial integration, while suggesting caution in interpreting
the even larger impacts found in cross-MSA studies.
The paper proceeds as follows: In Section 2 I discuss two previous empirical
contributions to this literature. Section 3 discusses the MassGIS and Census data
used here. In Section 4 I provide a simple model to motivate the empirical work and
suggest the mechanisms by which land use regulation might affect segregation. Section
5 presents the main results, Section 6 offers discussion and Section 7 concludes.
4
2 Literature Review
The hypothesis that restrictive zoning may lead to decreased minority residence in
more prohibitive areas and greater overall segregation has long been present in the
economics literature (e.g. Downs (1973); Fischel (1985)). Rigorous empirical exami-
nation of the hypothesis has only been undertaken more recently. Pendall (2000) com-
piled a dataset with the intent of examining this question, gathering survey responses
from planning directors in 1168 jurisdictions across the 25 largest US metropolitan
areas. He estimates that jurisdictions allowing only what he defined as low-density
housing (no more than 8 units per acre) had less than half the black populations of
those without such controls and only 60 percent as large a Hispanic populations in
1980. Furthermore, the growth in minority populations was lower for jurisdictions
allowing only low-density housing, with the black and Hispanic populations growing
0.8 and 0.5 percentage points more slowly, respectively.
Building on an updated version of Pendall’s data (Pendall, Puentes, and Martin,
2006) as well as incorporating data from the Wharton Land Use Regulation Index
(Gyourko, Saiz, and Summers, 2008), Rothwell and Massey (2009) study the impact
of zoning restrictions on metro area level segregation across the largest 49 US metro
areas. They find that increasing the maximum allowable density by one standard
deviation increases the dissimilarity index in a metro area, a measure of what per-
centage of a population would need to move to ensure a uniform share of that group
across the area, by between four and seven percentage points in the 1990 and 2000
cross-sections, depending on the OLS specification. Their point estimate implies that
moving from one end of the distribution to the other would lower the dissimilarity
index by 25 percentage points. Instrumental variables show a slightly larger effect,
with a point estimate of 8 percentage points for a standard deviation change. They
also show that a standard deviation higher level of maximum density is associated
with an 8 percentage point higher (less negative) change in the dissimilarity index
5
between 1980 and 2000 with most of the effect concentrated in the earlier part of the
period, and this is fairly similar between the OLS and the IV regressions.
These findings lend credence to the hypothesis that restrictive zoning might have
quite large effects on racial segregation, but some caution is warranted. While both
sets of authors are well aware that other differences may exist between places with
strict and lax zoning regimes, their data allow limited investigation of potential omit-
ted variables bias. In the case of Rothwell and Massey, one might worry that the
instrument of year of statehood, which is nearly collinear with region effects, might
be acting on segregation through any number of mechanisms beyond density zoning.
In fact the regional patterns in the dissimilarity index are striking - for instance, the
top 9 most segregated metro areas in the 2010 Census are all in the “rust belt” region
of the upper Midwest (Glaeser and Vigdor, 2012), suggesting a role for other channels
such as disparate impacts of the Great Migration of blacks from the South in the early
20th century (see, for instance, Boustan (2010)). While Rothwell and Massey argue
that the density result holds within regions when they run the regressions separately,
isolating the effect of zoning across metro areas remains challenging.
3 Data
The data for this project come from the State of Massachusetts’s Office of Geographic
Information (MassGIS). The spatial data available from MassGIS span a broad set of
topics including economic and housing development, transportation, natural features,
local governmental boundaries and the environment. This study focuses primarily on
the zoning data, which was compiled by MassGIS from maps sent in by each town’s
government or planning agency around the year 2000 . The data include polygons
with the precise boundaries of each zone as well as the written bylaws corresponding
to that zone and a series of coded variables derived from these bylaws. As town
zoning bylaws can differ substantially in intent and wording between jurisdictions,
6
compiling uniform spatial data with this level of detail and geographic scope is quite
rare - in fact I know of no other state that makes such data available. The data is
described extensively and explored by Wheaton and Evenson (2003) and has been
used by Zabel and Dalton (2011) to examine the effect of zoning on housing prices.
The main variables used in this study are derived from the “primary use” variable,
which classifies zones to one of 21 categories including 9 residential categories, 5
commercial categories, 2 industrial categories, 2 institutional categories, a mixed use
category, an unzoned category and a category for land preserved for conservation or
recreation. Within residential, the primary focus here, three multi-family housing
categories separate land zoned for multi-family structures with densities of 3 to 8
dwelling units, 9 to 20 units and greater than 20 units per acre. The remaining six
categories break down single family or duplex housing by minimum lot size, varying
from a low category of 5,000 to 15,000 square feet (3 to 8 units per acre) to the largest
category of 80,000 square feet and above (at least 2 acres per lot) as well as a category
for mixed low density agricultural and residential. Importantly, residential areas are
coded by their densest possible use by right, that is, the densest structures that can be
built without special permitting. In practice some local zoning boards are more lenient
than others in granting allowances, but this coding allows an exploration of the effect
of zoning laws as written, rather than as they’re being interpreted contemporaneously,
a variable more likely to be exogenous to current local conditions.
The main dependent variables come from race data at the block level taken from
2010 US Census 100 percent sample (Summary File 1) geocoded using the Census
Tiger shapefiles. Census blocks are the smallest unit of geography available to the
public and data are available at this level for only a small set of variables: populations
by age, sex, race, Hispanic origin, household type and whether the housing unit is
owned or rented. Blocks are delineated by roads or geographic features, and vary
in size depending on population density. Urban blocks tend to encompass literal
7
blocks, surrounded on all four sides by adjacent roads, whereas rural blocks can be
substantially larger. Not all blocks are populated - some, for instance, are entirely
covered by water. These unpopulated blocks are dropped from the analysis. Of those
with non-zero populations, the blocks in Massachusetts metropolitan areas used here
range from 1 to 4025 people with a median of 44 people and correspond to land areas
between 0.02 and 5157 acres, with a median of 5.62 acres.
I overlay the blocks onto the zone data and classify each block by primary use if
at least 90 percent of the block shares the same designated land use. I have probed
the robustness of cutoffs from 75 percent up to 99 percent and the results are broadly
similar. The threshold presents a tradeoff - a lower threshold introduces measure-
ment error biasing the results downwards, but a higher threshold lowers sample size,
reducing power. The 90 percent threshold tends to yield similar point estimates to
higher values without compromising power, whereas lower thresholds show more se-
vere attenuation. With the 90 percent threshold about 23 percent of blocks cannot be
categorized as having a single use, with 70 percent falling into one of the nine residen-
tial categories and the remaining seven percent having either commercial, industrial,
institutional or conservation uses.
The first column of Table 1 shows summary statistics for populated blocks in
Massachusetts metropolitan areas. The majority (63.13 percent) of the blocks are in
the Boston metro area, but blocks from Worcester, Springfield and the Massachusetts
portion of the Providence metro area are also included. The population is 6.96 percent
percent black, 10.08 percent Hispanic, and 75.05 percent non-Hispanic white.1 The
three races have strikingly different rates of renting versus owning, with blacks (66.53
percent) and Hispanics (75.44 percent) renting at over twice the rate of whites (31.67
percent).
In terms of land use, 6.52 percent of blocks are zoned for multi-family residential
1Black here is defined as black alone, not in combination with other races, and includes BlackHispanics. This is the subgroup for which the most data is available on Census Summary File 1.
8
use with most of that being denser than 8 units per acre. The 63.25 percent of land
zoned for single family use is spilt roughly evenly between what I define as low (lot
sizes over an acre), medium, and high (less than 3/8 of an acre lot sizes) density
uses. I construct a linear measure of zoning by taking the 9 categorical measures of
residential zoning and assigning each the average dwelling units per acre observed in
the data for that category. This measure varies from 0.5 to 22 units per acre with a
mean of 4.21 and a median of 4.73.
To ensure comparability between blocks in my sample, I employ several selection
criteria. Starting with 82,071 blocks, I drop those with non-residential or split land use
(23,079 blocks), with anyone housed in group quarters population (2,724 blocks), with
any public housing (687 blocks), with land areas greater than 160 acres, equivalent
to a square quarter mile (3,074 blocks) and where more than ten percent of the land
area is covered by water (146 blocks). It is from this remaining set of 52,359 blocks
that I draw the border samples.
To construct my border samples I classify a block as falling on a zoning border if
it intersects a 50 meter band drawn around a boundary where the type of permitted
residential land use changes. I use only borders within towns, and omit those that
fall along highways, streams or railroad tracks, as such barriers may serve as natural
neighborhood dividing lines, and I want to ensure that blocks on both sides of the bor-
der have similar neighborhood characteristics (see, for instance, Ananat (2011) for an
exploration of the role of historical railroad lines in demarcating racial neighborhood
boundaries.)
As an example, Figure 1 shows zoning regulation for Cambridge, Massachusetts
and blocks identified as being on zoning borders. Like most inner suburban areas,
Cambridge residential land use is split between multi-family housing and high density
single-family housing. From the map we can see that the south and east of the
city are largely zoned for multi-family housing and commercial while the north and
9
west have mostly single-family zoning. Given that differences may exist between
the two regions of the city, such as historic settlement patterns, access to popular
commercial areas, parks and universities, and proximity to heavier industry, we would
not expect differences in composition between the two to be driven entirely by land
use regulation. However, focusing on the outlined blocks, it is more plausible that the
differences in block composition one sees when crossing one of the dark black borders
is a result of the differential land use on either side.2
Figure 2 shows the distribution of the black population in Cambridge, and simi-
larities between the two figures do suggest that the black population is more heavily
concentrated in areas with multi-family zoning. However, focusing on variation across
borders where neighborhood characteristics are held constant, patterns are harder to
discern from cursory inspection.
Returning to Table 1, three main border samples are used in the analysis. Col-
umn 2 shows descriptive statistics for blocks that lie on any zoning border where
residential land use changes. These blocks are broadly similar to the full set of metro
Massachusetts blocks, though somewhat more black (10.05 percent), more concen-
trated in the Boston metro area and more likely to be zoned for multi-family housing.
The third and fourth columns look at two important subsets of the border sample.
Column 3 shows blocks on either side of boundaries where land use changes between
single-family residential and multi-family residential. These blocks have considerably
larger minority populations, both for blacks (15.37 percent) and Hispanics (13.56
percent). They are also more densely populated, have more rental units per acre,
are smaller in land area, closer to major city centers and particularly concentrated in
Boston’s urban core, defined here as Boston and the 9 suburban communities that lie
within 5 miles of the city center.3 The fourth column gives statistics for the sample
2Not all blocks surrounding borders are outlined due to those blocks failing one of the sampleselection criteria. Generally these blocks either have zero population, a positive group quarterspopulation, or are split between two land use categories.
3See Appendix A for the set of towns located in each sub-region of Greater Boston.
10
comprised of blocks that lie on borders between single-family residential zones with
different minimum lot sizes. These blocks have very small minority populations (1.93
percent black and 3.24 percent Hispanic), lower population densities, few rental units,
and are more likely to be located along the Route 128 corridor in suburban Boston
than in the urban core.
Along with the 2010 Census data, I also use past census block data to examine
changes in racial composition over time. Because the spatial scope of census blocks is
not consistent across decades, I geographically match blocks using the Census’s Tiger
Shapefiles. The need for this match limits the analysis to the time period of 1990
to 2010 as spatial data at the block level is not available before 1990. I keep blocks
where I can find a set of 1990 blocks that are completely contained within a 2010
block and comprise more than 75 percent percent of the land area of that block, or
meet the same criteria fitting 2010 blocks into 1990 blocks. This yields a match rate
of about 60 percent for populated blocks.
Finally, I make use of individual tax parcel data from MassGIS to investigate the
types of structures present on each block. As with the land use regulations, these
data were compiled by MassGIS through submissions from local officials. I use data
for the entire Boston metro area with the notable exception of Boston itself, where
data is not available.
4 Model
Consider the housing market in the Boston metro area (or analogously, the Springfield
or Worcester metro areas.) I assume that the market is in static spatial equilibrium
such that at price vector P* everybody is living in their preferred home; that is, they
are maximizing their indirect utility function:
(1)Vi(Hj) = f(P ∗j (Xj, Zn) , Xj, Zn
)11
where Xj is a vector of attributes of the property such as structure type, hous-
ing tenure, lot size, interior amenities and distance to business districts, and Zn is
a vector of neighborhood characteristics such as local amenities and public goods,
neighbors and the neighborhood’s built environment. Though the functional form of
this relationship will not be crucial for the estimation in this paper, to fix ideas I will
assume this takes the linear form:
(2)Vi(Hj) = −αiP∗j (Xj, Zn) +Xjβi + Znωi + εij
where the coefficients are allowed to differ across individuals. If housing within
a block is relatively comparable, we could think of the j subscripts as referencing
blocks rather than housing units, and think of this as a function describing people’s
preferences over consuming a unit of housing on a given block in the Boston area. The
land use density restrictions that are of interest here are unlikely to enter the utility
function directly. Rather, they affect individual well-being through their equilibrium
impacts on the other variables in the utility function. This can be seen in the equation
by introducing a small perturbation in density zoning:
(3)Vi(Hj) = −αi
(P̃ ∗j +
(∂Pj
∂Dj+
∂Pj
∂Xj
∂Xj
∂Dj+
∂Pj
∂Zj
∂Zj
∂Dj
)dDj
)+(X̃j +
∂Xj
∂DjdDj
)′βi +
(Z̃n + ∂Zn
∂DjdDj
)′ωi + εij
Rearranging and assuming that the derivatives take a linear form over the relevant
range of zoning regulations yields
(4)Vi(Hj) = (−αiδpd + δxd (βi − αiδpx))Dj
+ δzd (ωi − αiδpz)Dj − αiP̃∗j + X̃jβi + Z̃nωi + εij
One could in principal use a structural approach to modeling these preference
parameters by race based on observed racial location patterns (see Bajari and Kahn
(2005) for a strategy in this spirit in the context of racial residential preferences)
but this would require data from multiple markets with zoning data, or individual
12
level housing data that allowed geographic identification at the zone level. Instead,
following Black (1999), I pursue a reduced form strategy taking advantage of the
sharp spatial discontinuities created by within-town zoning borders. Underlying this
strategy is the assumption that density zoning regulation is the only thing changing
at the border. The neighborhood characteristics and residual attributes and price of
the housing stock should remain fixed. Under this assumption, the indirect utility
function simplifies to:
(5)Vi(Hj) = (−αiδpd + δxd (βi − αiδpx))Dj + θb + εij
where θb is a fixed border effect that absorbs all terms constant at the neighbor-
hood level. Estimating this directly would require assumptions on the error terms
that would allow me to convert this into an equation about the observed data, which
are racial shares at the block level. Since I’m less interested in the specific preference
parameters than I am in the aggregate impact of density zoning, I estimate the simple
linear specification:
(6)Srj = γDj + θb + µj
where Srj is the share of block j that is of race r, γ will be some function of the
differences by race in the distributions of the preference parameters αi and βi and the
zoning impacts on price and housing attributes δpd, δxd, and δpx, θb represents a zone
border fixed effect and µj is a mean zero error term that I will allow to be correlated
within town but is assumed to be independent across towns.
Although the preference parameters within the γ function cannot be separately
identified with this strategy, their presence in the indirect utility function provides a
nice summation of the potential mechanisms through which zoning regulation might
lead to changes in racial composition. Looking at equation 5, the first term, −αiδpd
is the direct impact of zoning on price holding other housing and neighborhood char-
acteristics fixed multiplied by a measure of individual price sensitivity that could
differ on average across races. In theory this direct impact should be small if units
13
are highly substitutable across blocks, though estimates of the direct price impact of
zoning vary in the literature ((Glaeser and Ward, 2009; Zabel and Dalton, 2011)).
The second term, δxd(βi−αiδpx) shows the two channels through which changes in
the housing stock that result from zoning regulations affect racial shares. Races might
have different preferences βi, on average, for attributes of housing such as structure
type, tenure or lot size. Alternatively, it might be that the types of housing built
on the strictly zoned block differ in price from those on the surrounding more less
strictly zoned blocks, and that races might be differentially sensitive to that change.
Given the differences in average income and wealth across racial groups, it seems quite
plausible that this price channel might play a significant role. A common argument
for why density zoning is exclusionary is that it prices out poorer people who would
like to live on the block but desire a quantity of land below the minimum threshold.
A third term, δzd(ω − αiδpz) appeared in equation 4, but it is absorbed by the
border effect in the regression specification. This term represents the impact of zon-
ing induced changes in equilibrium neighborhood characteristics on the racial com-
position of the neighborhood, first through differing preferences between races for
neighborhood characteristics, and second through a price channel if zoning induces
neighborhood level changes that alter the price of housing in the neighborhood. Cru-
cially here, any neighborhood changes induced by zoning on one block are assumed
to be felt on neighboring blocks regardless of on which side of the zoning border they
fall. Therefore, the border design will not identify this mechanism as part of the
effect of density zoning regulation. A much studied dimension on which blacks and
whites might differ is preferences for the racial makeup of the neighborhood itself.
The failure of the border design to detect this effect is one of the main weaknesses of
applying the approach in this context, and suggests that the estimates here might be
biased downwards compared to the true long run impact of zoning regulation. I will
return to a discussion of this issue in the section 6.
14
5 Results
Table 2 shows the results of regressions of the black share of the block population
on permitted density, as measure by dwelling units per acre. Column 1 provides
the estimate of equation 6 above, a linear regression of the share of the population
that is black on dwelling units per acre with border fixed effects included in the
regression, run on the sample of blocks that fall on a zoning border. Standard errors
are clustered at the town level, as they are in all subsequent regressions unless noted.
The coefficient, significant at the 1 percent level, indicates that an extra unit of
density, measured in units permitted per acre, increases the black share on the block
by 0.38 percentage points, where the baseline average black share is 7 percent in the
overall population and 10 percent in the border sample. This suggests quite large
effects of shifts in zoning of plausible magnitudes. For instance, lowering lot sizes
from half acre lots to 8000-square foot lots (similar to the average in the densest
single family zoning category) would increase the black share by 1.14 percentage
points. Permitting of high-density multi-family housing, with densities of over 20
units per acre, would be expected to have extremely large impacts.
In column two I add controls for distance in miles to the metro area’s main city
center (Boston, Worcester or Springfield) and whether any body of water is present
on the block. Both are strong negative predictors of black population in the full
sample, but the impact of density zoning on the black population is unaffected by
their inclusion in the border regression. Neither show up as significant predictors
of the black share, suggesting that the sample is reasonably well-balanced on these
dimensions.
My theory gives me little guidance as to the shape of the relationship between race
and zoning, so I next fit a logarithmic model to the data. Unfortunately the black
population at the block level is frequently zero, so I divide this into two regressions
- one to predict the zeros and the other a regression in logs on the non-zero data.
15
Column 3 reports the marginal effects from a probit model of the impact of density
zoning on the having no black population. Not surprisingly, more densely zoned
places are less likely to have zero black population than less densely zoned blocks
across the border from them, though the coefficient of 2.35 percentage points is small
when compared to the fact that over 60 percent of blocks in the sample have no black
population.
Given this prevalence of zeros, the number of observations in column 4 shrinks
considerably. The coefficient I get from regressing the log of the black share on the
log of the density measure implies that doubling zoned density increases the black
population by 17.46 percent on blocks with positive black populations. This may be
a better fit for the data than the linear measure, though interpretation is complicated
by the large number of dropped blocks. Zeroing in on the impact at certain points in
the distribution is likely to be more illuminating, as I will explore in the next table.
Before turning to that, in columns 5 and 6, I illustrate the impact of the use of the
border design by running ordinary least squares in the full sample of Massachusetts
metro areas with and without town fixed effects to benchmark the results. The
coefficient in standard OLS is over twice the size of the border estimate from column
1, emphasizing that these blocks differ in more than just how they are zoned. Not
surprisingly, much of the variation in the share black of the block population can
be explained by the tendency of blacks to live disproportionately in jurisdictions
clustered in highly urbanized areas with lax density restrictions, as we see by moving
to the town fixed effect regression.
However, it is surprising that the town fixed effects estimator shrinks the effect to
half the size of the border fixed effects estimator and that this effect is insignificant
at conventional levels. This is driven largely by the city of Boston, where the black
population is highly concentrated in the south and west of the city which are zoned
mostly for low density multi-family and high density single-family housing, whereas
16
the whiter areas closer to the city center are zoned for denser multi-unit high rises.
After dropping Boston in column 7 the town fixed effects estimate looks similar to
the one from the border design.
Taking Boston on its own in columns 8 and 9, using Huber-White robust standard
errors and running OLS in the full sample shows a strong and significant negative
coefficient, but the border regressions shows a small and insignificant positive effect.
This illustrates the need to focus on narrow variation within neighborhoods rather
than within town variation that may be confounded by omitted neighborhood level
variables. The confidence interval for the border regression in Boston alone is certainly
too large to rule out that the effect may be equal to that of the full sample, though
the smaller effect would be consistent with the hypothesis that upzoning in the urban
cores of expensive cities may have negative rather than positive effects on the size
of minority populations. With only one major city center, I lack the data to say
anything about this hypothesis.
In Table 3 I decompose the effect of the linear zoning measure by focusing specifi-
cally on the effect of allowing the construction of multi-family housing by right on the
share of black residents on the block. Limiting the sample to borders across which
use changes from single to multi-family dwellings leaves 1959 blocks that fall on 414
borders within 61 towns. The blocks are largely concentrated in the major cities of
Boston, Springfield and Worcester, in smaller satellite cities such as Brockton, Fall
River, Lowell and in inner ring suburbs like Cambridge, Brookline and Quincy. The
land use regulation on the single-family blocks is predominately in the highest density
category.
Column 1 shows the estimated coefficient of a border fixed effects regression which
finds an impact of 3.36 percentage points that is significant at the 1 percent level.
This is just over a fifth of the average black population for blocks in this sample.
We can break down multi-family housing into low density (up to 8 units per acre),
17
medium density (9 to 20 units per acre) and high density (20 and above.) Column 2
shows that the point estimate is much larger when crossing from single family housing
to medium and especially high density multi-family housing compared to low density
multi-family, though Wald tests can only reject equality of the high and low density
coefficients at the 10 percent level. Column 3 instead uses the sample of borders
between different classes of multi-family zoned housing and finds that moving from
low density multi-family housing (the omitted category) to medium and high density
multi-family housing yields sizable positive coefficients, though only the difference
between low and high density is significant. These results suggest that the largest
differences in racial composition exist not between single and multi-family blocks of
similar densities, but rather between low-density multi-family blocks of triple-decker
houses and those with medium and high density apartment buildings.
Columns 4 and 5 turn to single family housing borders. A regression of the black
share on allowing single family housing in the highest density category (lot size under
15,000 square feet) yields an insignificant coefficient, as does a regression of the black
share on the linear density per acre measure used above taken only in the single-family
border sample. The confidence interval allows me to rule out an effect in excess of 1.3
percentage points from permitting the densest form of multi-family housing versus
lot sizes of over an acre, though given the small average black population in this
sample of blocks (1.93 percent) that is not a very restrictive upper bound. Running a
regression of the log share on log density in only the single-family sample also yields
an insignificant coefficient, though the point estimate of 0.16 log points is very similar
to the one found in the full sample. Though I cannot rule out substantial percentage
gains as a result of changes in density regulation, given the small initial share of
blacks in the sample, even at the upper end of the confidence interval, large changes
in minimum lot size regulations are likely to have at most modest impacts on the
overall segregation of the black population.
18
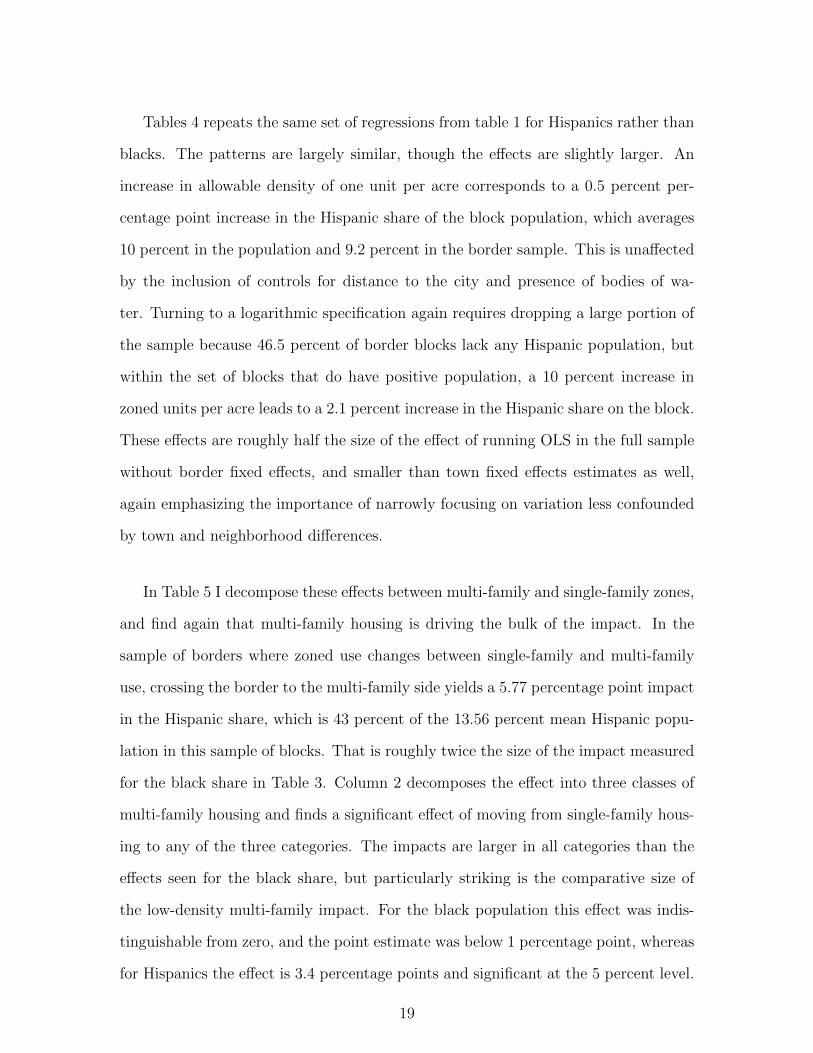
Tables 4 repeats the same set of regressions from table 1 for Hispanics rather than
blacks. The patterns are largely similar, though the effects are slightly larger. An
increase in allowable density of one unit per acre corresponds to a 0.5 percent per-
centage point increase in the Hispanic share of the block population, which averages
10 percent in the population and 9.2 percent in the border sample. This is unaffected
by the inclusion of controls for distance to the city and presence of bodies of wa-
ter. Turning to a logarithmic specification again requires dropping a large portion of
the sample because 46.5 percent of border blocks lack any Hispanic population, but
within the set of blocks that do have positive population, a 10 percent increase in
zoned units per acre leads to a 2.1 percent increase in the Hispanic share on the block.
These effects are roughly half the size of the effect of running OLS in the full sample
without border fixed effects, and smaller than town fixed effects estimates as well,
again emphasizing the importance of narrowly focusing on variation less confounded
by town and neighborhood differences.
In Table 5 I decompose these effects between multi-family and single-family zones,
and find again that multi-family housing is driving the bulk of the impact. In the
sample of borders where zoned use changes between single-family and multi-family
use, crossing the border to the multi-family side yields a 5.77 percentage point impact
in the Hispanic share, which is 43 percent of the 13.56 percent mean Hispanic popu-
lation in this sample of blocks. That is roughly twice the size of the impact measured
for the black share in Table 3. Column 2 decomposes the effect into three classes of
multi-family housing and finds a significant effect of moving from single-family hous-
ing to any of the three categories. The impacts are larger in all categories than the
effects seen for the black share, but particularly striking is the comparative size of
the low-density multi-family impact. For the black population this effect was indis-
tinguishable from zero, and the point estimate was below 1 percentage point, whereas
for Hispanics the effect is 3.4 percentage points and significant at the 5 percent level.
19

The coefficients for medium and high density multi-family housing are higher, though
a Wald test cannot reject equality between any pair of coefficients. Column 3 shows
that at borders where multi-family use changes I can detect an impact of moving
from low-density to high-density multi-family housing. Again, these results suggest
that permitting medium and high density multi-family housing leads to particularly
large increases in the Hispanic share, but for the Hispanic population, in contrast to
blacks, zoning for low-density multi-family neighborhoods, which in Massachusetts
generally means triple-decker three-family housing, also leads to significant increases
in the share.
Turning to single-family housing, Column 4 shows the impact of moving from
low-density (lot sizes one acre or larger) single-family zoning to medium and high-
density (lot size less than 3/8 of an acre) single-family housing. The coefficient for
high-density single-family is approaching significance at the 5 percent level (p-value
of .064) and the point estimate suggests an impact of 1.37 percentage points where
the average Hispanic share in this sample of blocks is 3.24 percent. Again, com-
paring the magnitude to the impacts seen for the black population, the size of the
Hispanic coefficients suggest that changes in land use regulation can have impacts
on the Hispanic share at lower density levels than would be expected for the black
population. Nonetheless, given the small initial Hispanic populations on blocks bor-
dering low-density single-family zoning, it seems unlikely that changes in minimum
lot size regulations would have large impacts on the overall levels of segregation in
Massachusetts metro areas.
Some fair housing advocates have pointed to the restrictive land use regulation
along the relatively affluent Route 128 corridor in Boston as having had particularly
strong effects in limiting the growth of suburban minority populations (Morse, 1975).
Of course it could be that even in the absence of restrictive land use regulation
these towns would have low minority populations. To investigate, I break the Boston
20
portion of my sample down into four sub-regions, one Boston and 9 inner ring suburbs
comprising the urban core, one for the Route 128 Corridor covering the west and
northwest suburbs, and one each for suburbs north and south of the city excluding
some of the more distant shoreline communities that share little in common with the
neighboring jurisdictions. For a list of the cities included and a brief discussion of the
construction of each region see Appendix 1.
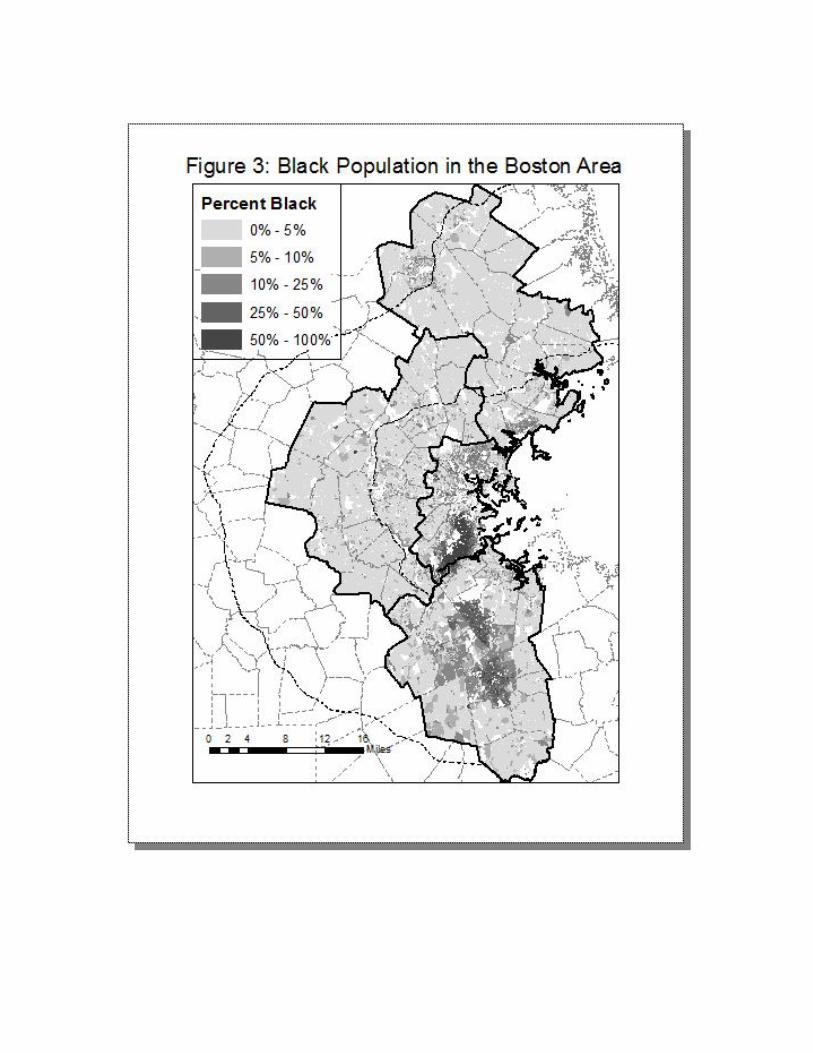
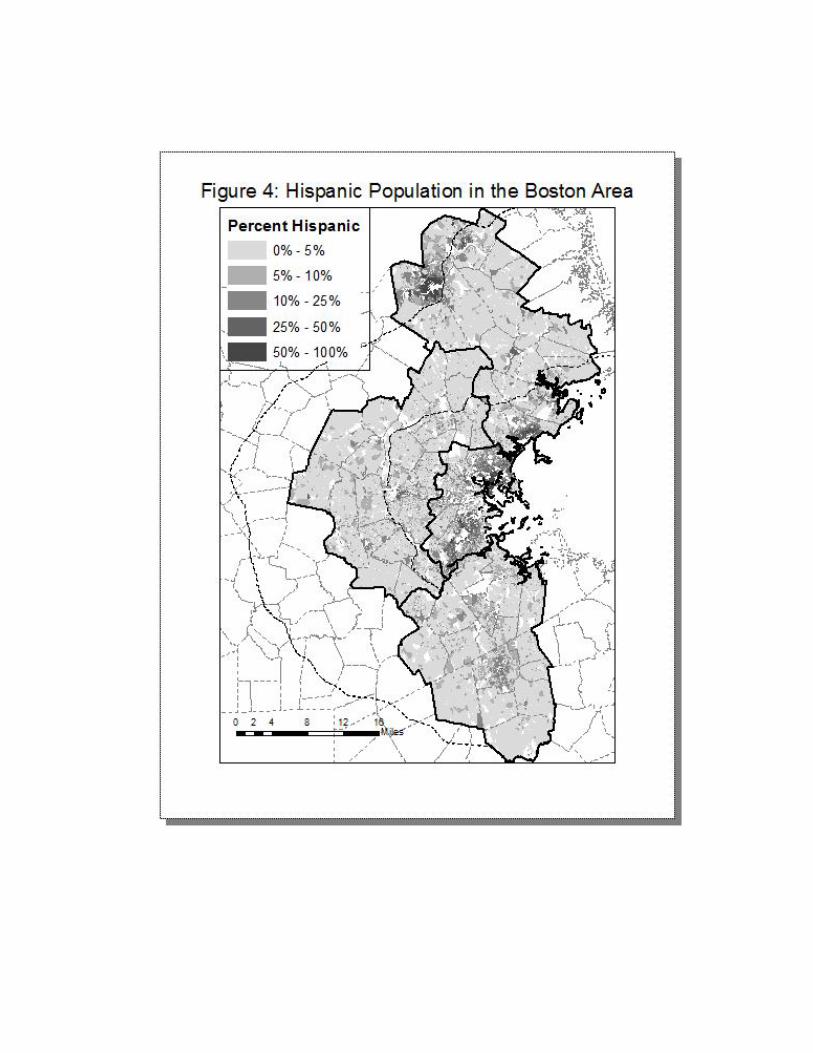
Figures 3 and 4 show how the black and Hispanic populations are spread across
the four regions. Along with a heavy concentration in the urban core, many of the
southern suburbs reaching down from the city limits to the smaller city of Brockton
have high densities of black residents. Hispanic populations are more heavily concen-
trated in the northern suburbs with Lawrence, Massachusetts, an old mill town near
the New Hampshire border having a population that is 70 percent Hispanic.
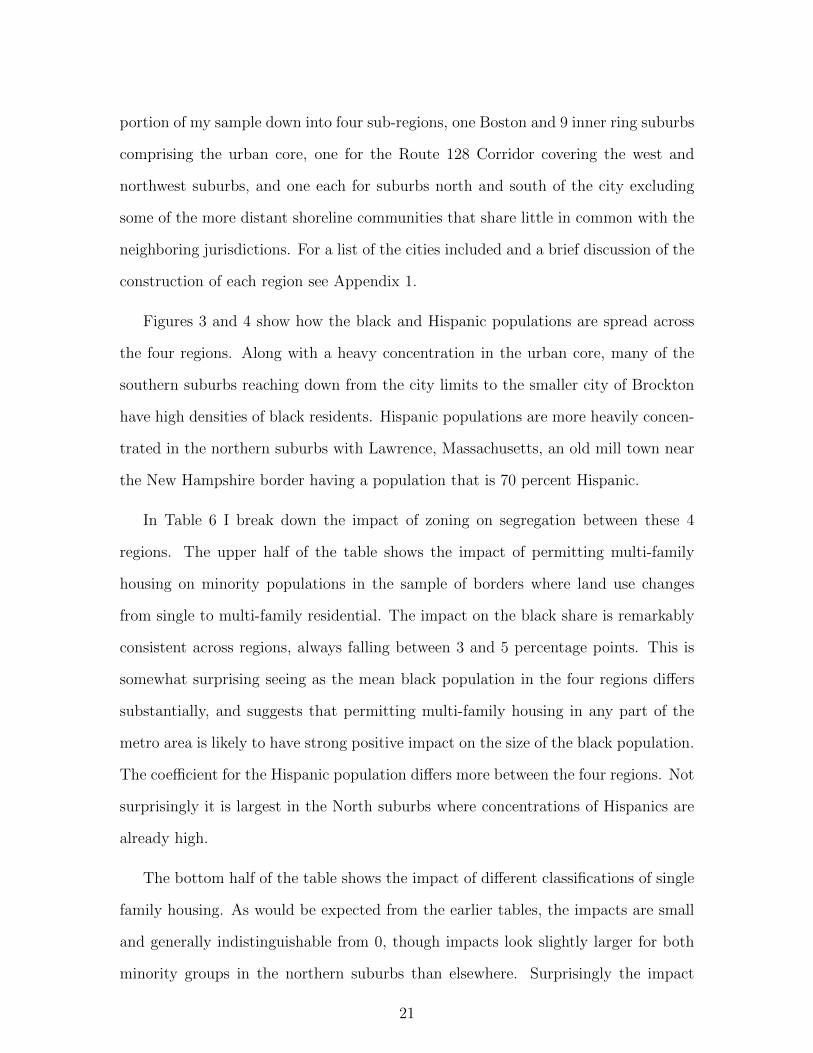
In Table 6 I break down the impact of zoning on segregation between these 4
regions. The upper half of the table shows the impact of permitting multi-family
housing on minority populations in the sample of borders where land use changes
from single to multi-family residential. The impact on the black share is remarkably
consistent across regions, always falling between 3 and 5 percentage points. This is
somewhat surprising seeing as the mean black population in the four regions differs
substantially, and suggests that permitting multi-family housing in any part of the
metro area is likely to have strong positive impact on the size of the black population.
The coefficient for the Hispanic population differs more between the four regions. Not
surprisingly it is largest in the North suburbs where concentrations of Hispanics are
already high.
The bottom half of the table shows the impact of different classifications of single
family housing. As would be expected from the earlier tables, the impacts are small
and generally indistinguishable from 0, though impacts look slightly larger for both
minority groups in the northern suburbs than elsewhere. Surprisingly the impact
21

of dense single family housing on the Hispanic share in the Route 128 Corridor ap-
proaches significance at the 5 percent level (p-value of .052). The results for any given
subgroup are imprecise, but as a whole they are suggestive that the estimates from
the main regressions apply not only to areas close to the city center, but to whiter
and more affluent suburban areas as well.
To better understand how land use regulation affects block racial composition,
tables 7 through 9 explore the impact of zoning on the types of residential structures
on the block in the Boston metro area, omitting Boston where data is not available.
Though block-level census data is only informative about the total number of dwelling
units and whether they are owned or rented, parcel level assessment data subdivides
the residential structures into six categories: single-family, two-family, three-family
detached housing, small (4 to 8 unit) and large (9 or more unit) apartment buildings
and condominiums.
Because taxes are assessed to the owners of properties, houses and apartment
buildings are listed by building, whereas condos, where units are separately owned, are
listed by unit. Some towns report the number of units within an apartment building,
but many do not. I can impute the number of units in a building of a given type by
regressing the total number of dwelling units counted in the census on counts of each
of the six building types at the block level in the full block sample. Reassuringly, the
coefficients for 1, 2, and 3 family houses from this regression are almost exactly 1, 2
and 3 respectively, so that building a single family house on a block corresponds to
adding one dwelling unit to the block. The coefficient is roughly 5 for small apartment
buildings and 30 for large apartment buildings. For condominiums the coefficient is
around 0.75 indicating that there is some measurement error in that variable likely
caused by different buildings having different ownership structures. This suggests
caution in interpreting the condominium results. In general these imputations will
lead to understated results if the size of apartment buildings within categories is
22
correlated with the prevalence of buildings across categories, as is likely to be the
case. For instance, if larger apartment buildings tend to be built on blocks where
more apartment buildings are built the imputation will understate the impact of
zoning regulations on the number of apartment units. Nonetheless, these regressions
can be informative about the underlying trends in building type connecting zoning
regulation to racial shares.
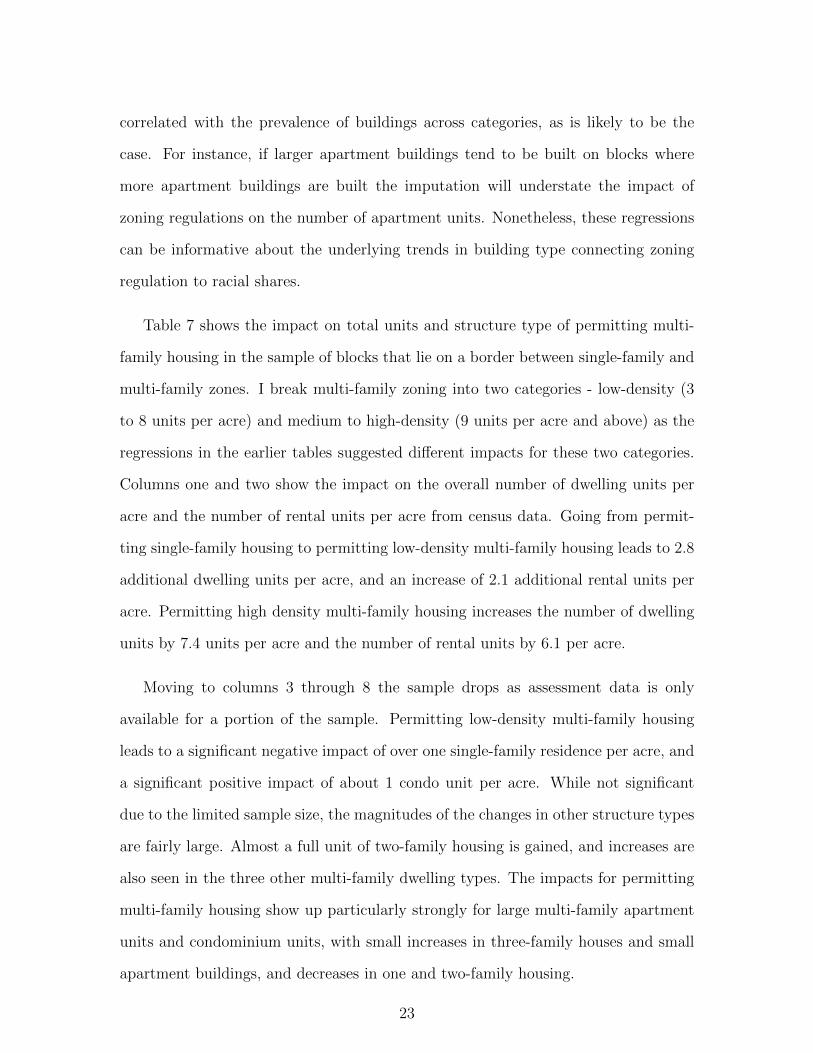
Table 7 shows the impact on total units and structure type of permitting multi-
family housing in the sample of blocks that lie on a border between single-family and
multi-family zones. I break multi-family zoning into two categories - low-density (3
to 8 units per acre) and medium to high-density (9 units per acre and above) as the
regressions in the earlier tables suggested different impacts for these two categories.
Columns one and two show the impact on the overall number of dwelling units per
acre and the number of rental units per acre from census data. Going from permit-
ting single-family housing to permitting low-density multi-family housing leads to 2.8
additional dwelling units per acre, and an increase of 2.1 additional rental units per
acre. Permitting high density multi-family housing increases the number of dwelling
units by 7.4 units per acre and the number of rental units by 6.1 per acre.
Moving to columns 3 through 8 the sample drops as assessment data is only
available for a portion of the sample. Permitting low-density multi-family housing
leads to a significant negative impact of over one single-family residence per acre, and
a significant positive impact of about 1 condo unit per acre. While not significant
due to the limited sample size, the magnitudes of the changes in other structure types
are fairly large. Almost a full unit of two-family housing is gained, and increases are
also seen in the three other multi-family dwelling types. The impacts for permitting
multi-family housing show up particularly strongly for large multi-family apartment
units and condominium units, with small increases in three-family houses and small
apartment buildings, and decreases in one and two-family housing.
23
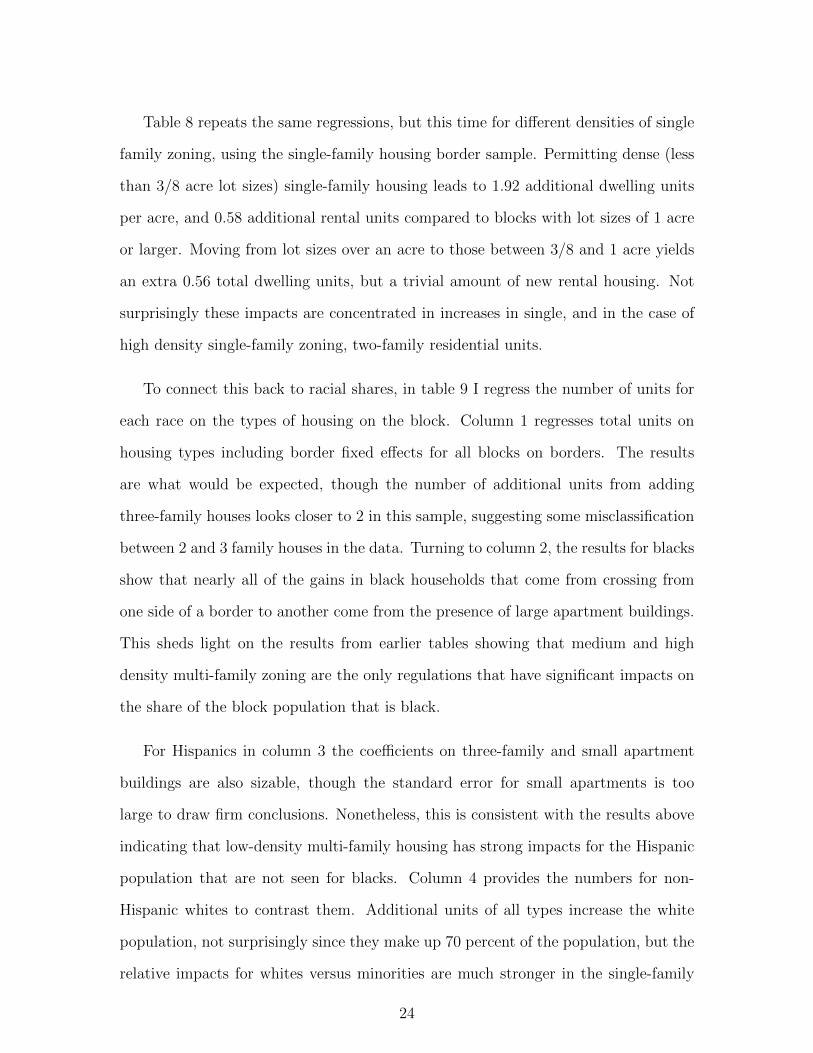
Table 8 repeats the same regressions, but this time for different densities of single
family zoning, using the single-family housing border sample. Permitting dense (less
than 3/8 acre lot sizes) single-family housing leads to 1.92 additional dwelling units
per acre, and 0.58 additional rental units compared to blocks with lot sizes of 1 acre
or larger. Moving from lot sizes over an acre to those between 3/8 and 1 acre yields
an extra 0.56 total dwelling units, but a trivial amount of new rental housing. Not
surprisingly these impacts are concentrated in increases in single, and in the case of
high density single-family zoning, two-family residential units.
To connect this back to racial shares, in table 9 I regress the number of units for
each race on the types of housing on the block. Column 1 regresses total units on
housing types including border fixed effects for all blocks on borders. The results
are what would be expected, though the number of additional units from adding
three-family houses looks closer to 2 in this sample, suggesting some misclassification
between 2 and 3 family houses in the data. Turning to column 2, the results for blacks
show that nearly all of the gains in black households that come from crossing from
one side of a border to another come from the presence of large apartment buildings.
This sheds light on the results from earlier tables showing that medium and high
density multi-family zoning are the only regulations that have significant impacts on
the share of the block population that is black.
For Hispanics in column 3 the coefficients on three-family and small apartment
buildings are also sizable, though the standard error for small apartments is too
large to draw firm conclusions. Nonetheless, this is consistent with the results above
indicating that low-density multi-family housing has strong impacts for the Hispanic
population that are not seen for blacks. Column 4 provides the numbers for non-
Hispanic whites to contrast them. Additional units of all types increase the white
population, not surprisingly since they make up 70 percent of the population, but the
relative impacts for whites versus minorities are much stronger in the single-family
24
and condominium categories than for apartment units.
We might again worry that these impacts of structure type on the size of minority
populations are driven by only the urban portion of the sample, and that building
multi-family units might have smaller impacts in more suburban locations. I rerun
the same regressions in columns 5 through 8 for just the Route 128 corridor. Column 5
shows that the gains in units for each category are roughly equal, but columns 6 and 7
show somewhat smaller increases for minority groups than the ones in columns 2 and
3. Nonetheless, additional large apartment buildings increase the black population,
as do additional small and large apartments for Hispanics. The impact of additional
three-family houses, while still positive for Hispanics is smaller and not distinguishable
from zero with the power I have in this sample. Nonetheless, these results suggest
that building more multi-family housing, especially large apartment buildings, in the
suburbs does increase minority populations.
Finally, I turn to data from the 1990 census to assess the impact of zoning regula-
tions on block-level racial composition changes over this period. Because I am using
a single cross-section of zoning regulations that are presumed to stay constant over
the period it is not clear we should expect much change in the impact of zoning on
racial residential location patterns. However, there are a few reasons to expect that
there might be differences. First, it could be that even if zoning regulations were
put in place years earlier, that the composition of neighborhoods adjusts slowly and
that even by 1990 blocks had not reached their steady state equilibria. In this case
the primary interest would be in the 2010 level estimates, and the 1990 estimates
would merely serve to illustrate how slowly the process unfolds. Alternatively, it
could be that as housing demand by race changes over the period that the adjust-
ment process differs between more and less stringently zoned blocks. For instance,
consider an influx of minorities to the area. It could be that less stringently zoned
neighborhoods are able to rapidly expand the stock of housing to accommodate new
25
migrants, whereas more restrictive blocks have a largely static population of longer
tenured residents.
First I examine the impact of zoning regulation on the share of the population
that is black at the block level for 1990. Even though the geographic definition of
blocks does not stay constant over the period I can perform the same match for
1990 blocks to land use zones as I did for 2010. Using the sample of border blocks
in 1990 I attain an identical coefficient, 0.38 percentage points, for the impact of
zoned units per acre on the share of the population that is black as I did in the
2010 data. Column 3 shows that, among blocks with positive black populations this
represents a somewhat higher percentage increase, 25.9 percent versus 17.5 percent
found in 1990. Columns 4 through 6 repeat regressions from table 3 looking at the
impact of multi-family and single-family zoning independently for the 1990 sample.
The 2.57 percentage point impact of permitting any type of multi-family housing is
similar, though slightly smaller than the 2010 coefficient, and the difference seems
particularly apparent in the impact of high-density multi-family housing in column
5. The impact of different minimum lot size restrictions among single-family zones is
negligible.
Repeating the same set of regressions for the Hispanic population in Table 11, I
find that, while the differences between Tables 4 and 11 imply that the impact of the
linear density measure has only grown modestly between 1990 and 2010, the impact of
permitting multi-family housing has doubled over the two decades. Comparing Table
5 to 11, the coefficient on allowing multi-family housing jumps from 2.8 percentage
points in 1990 (column 11.4) to 5.77 percentage points in 2010 (column 5.1). The
coefficients for all three density classes of multi-family housing see similar growth. The
impacts of changing the density of single-family housing is small and insignificant in
1990, though the confidence intervals are large enough compared to the effect that
little can be said about any changes in the impact over time.
26
Along with comparing the magnitudes of the coefficients estimated separately for
the two censuses, I can estimate the impacts of density on block-level changes over the
period for the sample of blocks I am able to match across censuses. Column 1 shows
a regression of the 2010 log share of the block’s population that is black on logged
zoned units per acre and the logged 1990 black population share with border fixed
effects in the border sample. A log point increase in zoned units per acre increases
the black share by 0.169 log points, with a p-value of 0.053, even controlling for the
logged 1990 black share. This suggests that for blocks with black populations in 1990,
less restrictive land use regulation predicted somewhat quicker growth in the black
share of the population going forward.
The coefficient of 0.425 on the 1990 black share itself suggests that a 10 percent
higher black share in 1990 led to a little over a 4 percent higher black share in 2010.
The fact that this coefficient is not closer to one likely reflects two things. First, given
that both sides of the border are similar along many neighborhood dimensions we
would not necessarily expect the concentration of blacks on one side of the border in
1990 to be a strong predictor of the concentration of blacks 20 years later, controlling
for the impact of land use regulation. Second, since the geographic block match
leads to some measurement error we would expect this coefficient to be attenuated
compared to the true impact. Reassuringly, running a simple regression of the logged
2010 black share on the 1990 black share without controls in the full matched block
sample yields a coefficient close to one, suggesting that measurement error is not the
only contributing factor.
Turning to columns 2 through 4, I find no significant impact of dummies for either
permitting of multi-family housing or higher densities of single family housing. There
is not enough power to distinguish what is driving the increase seen in column 1.
Turning to columns 5 through 8, the impacts of land use restrictions on the growth
in the Hispanic share at the block level between 1990 and 2010 are much larger. Col-
27
umn 5 shows that a 10 percent increase in zoned units per acre leads to a 3.15 percent
increase in the Hispanic share, conditional on the logged 1990 Hispanic share. This
coefficient is actually higher than the coefficient on the logged 1990 Hispanic share
itself, suggesting that there was substantial movement of the Hispanic population
across blocks on the same border. This is not surprising given the substantial growth
in the overall Hispanic population over the period. Even if incumbent Hispanic resi-
dents stayed relatively immobile, if new residents’ location decisions are driven more
by attributes of the housing stock on either side of the border than the block-level
Hispanic share, then this is the pattern of coefficients we would expect.
Breaking down this impact, permitting of multi-family housing has a large and
significant impact, and the impacts of different density class of single family housing
a large, but too imprecisely estimated to be significant. Using the log zoned units
per acre measure in the sample of single-family borders approaches significance at
the 5 percent level (p-value 0.061), suggesting that zoning regulation along the entire
spectrum of densities had some effect on Hispanic housing choices.
Finally, in Column 9 I test whether blocks with less stringent zoning were able to
add more housing than more stringently zoned blocks across the border. Regressing
the log of dwelling units per acre in 2010 on log zoned units per acre and log dwelling
units per acre in 1990, I find that a 10 percent increase in allowed units per acre
led to a 1.5 percent increase in dwelling units per acre over the time period. This
lends some support to the hypothesis that if minority populations are growing in the
area as a whole, more densely zoned blocks may be able to build new housing more
quickly to attract new minority residents. Probing this hypothesis further would
require individual level migration data.
28
6 Discussion
While the border design helps to reduce omitted variable bias, endogeneity may con-
tinue to be a concern. It may be that places that had small black populations to begin
with were precisely the places where more restrictive zoning laws were put in place,
as historians cited above have argued. Any model that looks within towns, whether
using town fixed effects or the more restrictive border design, will mitigate this con-
cern since the town is the level of government writing zoning restrictions. In addition,
some models motivating zoning legislation, such as excluding those of lower incomes
to avoid drain on local public finances, act at the town rather than the neighborhood
level. However, the concern might remain that the residents of certain neighborhoods
might lobby their local governments to preserve those neighborhoods with zoning
restrictions while allowing members of other races to move into other parts of the
jurisdiction that already had more minorities. However, given the narrow spatial fo-
cus here, in order to violate the assumptions of the design there would need to be
some reason why, in the absence of zoning regulation, block-level racial shares would
not converge towards those of directly adjacent blocks over time. Certainly when
major roads, railroad lines or streams mark the border between zones there is cause
for concern that such boundaries would demarcate racially segregated neighborhoods
on their own. Given that I am dropping these borders from the analysis the concern
is somewhat lessened.
Also reassuring is that historical zoning maps for communities in the area such as
Arlington, Newton, Quincy and Sudbury show remarkable consistency over time. In
Newton, though the rules governing land use within each zone has changed over time,
the borders themselves are nearly identical to those that appear on a 1921 zoning
map. Similarly, the boundaries of Sudbury’s residential zones remain unchanged
since they were originally drawn in 1955. The list of zone changes since 1976 in
Quincy numbers in the hundreds, but in nearly all cases these are not changes from
29
one residential classification to another, but rather changes in zoning for commercial
and conservation purposes that are not part of this analysis. Though a more rigorous
historical examination is surely a worthy endeavor, the relative stability of these
regulations over long time periods in the subset of towns for which data is readily
available lends credibility to the approach taken here.
Along with the strengths of the border design come a couple of caveats about the
local average treatment effects estimated using this model. A long literature explores
the impact of residents’ racial preferences on housing market equilibria (see, for exam-
ple, Schelling (1971); Cutler, Glaeser, and Vigdor (1999); Card, Mas, and Rothstein
(2008).) If the impact of changing zoning regimes is to change the racial composition
of the neighborhood, then that change may itself beget further changes in neighbor-
hood composition through the interaction of preferences for neighbors in the housing
market. Since the underlying assumption of the border fixed effects design is that
neighborhood attributes stay constant across the zoning borders, this effect, by as-
sumption, should be equal on either side and will therefore be absorbed by the border
fixed effects. In light of this, the estimates here are best seen as lower bounds for the
overall impact that changes in zoning regulations will have over time. What is being
isolated here is the variation that acts through the mechanisms discussed earlier; that
is, through changing housing types and proportion of ownership, price changes that
result directly from zoning and the stasis effect of slowing down new construction.
Incorporating the spillover effect to the neighborhood could be achieved by adding
more structure to the model such as is done in Bayer, Ferreira, and McMillan (2007)
and Kasy (2012), but doing so requires individual level data that is unavailable here.
Alternatively, one could return to a larger unit of geography such as the metro area
where the unit of observation is sufficiently large as to rule out spillovers beyond
its bounds, though at the risk of inviting back in the confounding factors discussed
above.
30
Furthermore, as with any local average treatment effect, caution should be taken
in extrapolating these results to other contexts. Boston in particular has some of
the strictest land use regulations in the country as measured both by Pendall (2000)
and the Wharton Residential Land Use Survey, and it would be interesting to see
how the micro-level estimates compare in regions with a less extreme distribution
of zoning. Another unique feature in Massachusetts is Regulation 40B, a statewide
statute that allows developers to seek state authorization to override local zoning
authority in communities where less than 10 percent of housing is deemed affordable
in exchange for maintaining at least 20 percent of the new units as affordable (Fisher,
2008). The threat of this law has also motivated some municipalities to enact their
own inclusionary zoning laws to achieve the same outcomes with more local control.
However, according to an examination of these policies by Schuetz, Meltzer, and Been
(2009) these laws have led to only modest levels of production of affordable housing,
with only about a fifth of communities reporting any new housing built under their
inclusionary zoning laws. If communities made widespread use of these regulations the
evidence I find from zoning borders might be attenuated estimates compared to those
that would be found in places with such regulations, but Schuetz’s work suggests that
perhaps the lost revenue from having to set aside affordable units mutes the impact
of these laws.
Even within Massachusetts, the estimates are only informative about places that
look like those that fall along zoning borders. Allowing construction of multi-family
apartment buildings may have quite different effects if enacted in a rural area zoned
entirely for an agricultural and residential mix than it does in places that border cur-
rently extent multi-family zones. The heterogeneity analysis showing strong impacts
even in suburban areas such as the Route 128 Corridor is reassuring here, but that
may mask variability within that region between places close to and far away from
multi-family districts. Fortunately, the margins likely to be relevant for policy are
31
precisely those along which the impacts are being identified in the data as commu-
nities are most likely to enact small policy changes by moving one or two lot size
categories or from higher density single family to permitting of multi-family housing.
Proceeding with caution given these caveats, I conclude the analysis by seeing what
my results imply about the impact of zoning on area level segregation measures. One
way of assessing this is to take my estimates of the impact of zoning on block level log
population growth by race and simulate the impact of equalizing zoning regulation
across the area. This should not be thought of as a policy simulation, since nobody
is suggesting that the areas towards the city center are going to substantially reduce
zoning density to meet the suburbs at the halfway point. Rather this is an attempt
to estimate segregation in the absence of zoning variation while keeping the area’s
overall minority populations constant.
I measure metro area level segregation using the dissimilarity index at the tract
level. For two racial groups, the dissimilarity index measures the percentage of one
group that would have to move in order for that group’s tract-level share of the
population to be equal across the area. This is a common measure in the sociology and
economics literature on segregation, and is the measure used by Rothwell and Massey
(2009) in their papers on the impact of zoning regulation.
Table 12 shows the dissimilarity index for blacks and non-blacks across the largest
88 metropolitan areas with populations over 600,000 in the 2010 census as calculated
by Glaeser and Vigdor (2012). Boston ranks 27th with a dissimilarity index of 57.6,
while Springfield is 35th at 55.7 and Worcester is 55th at 47.3. Because my data only
includes the Massachusetts portion of the Boston metro area I measure a slightly
smaller value of 56.4 for Boston’s dissimilarity index. I also use the updated 2013
redefinition of the Springfield metro area which removes the largely rural Franklin
County and modestly lowers the dissimilarity index to 54.5. Neither of these changes
affects the relative ranking of the cities by more than 1 place on the list.
32
To simulate the removal of zoning regulation I calculate the average zoned units
per acre at the metro and tract level using the block level data. The average densities
for the Springfield, Worcester and Boston areas are 4.63, 5.03 and 7.22 respectively,
roughly the average number of units observed for dense single family housing. Using
my coefficient from the first column of table 2, I multiply the difference between the
tract average and the metro area average by .0038 percentage points and add that to
the original black population. This results in a dissimilarity index for Boston of 49.9,
with Springfield only modestly affected at 52.7 and Worcester plummeting to 32.9,
which would be among the lowest values observed in the data. The change for Boston
is substantial; the simulated value would take Boston from being the 27th ranked to
the 48th ranked metro area in dissimilarity. Its neighbors in that region of the table,
Dallas, Houston and Oklahoma City, are among the least regulated metro areas in the
country according to the average Wharton Residential Land Use Regulation Index,
whereas Boston is ranked second. The simulation suggests that as much as three
quarters of the Boston to Houston gap could be accounted for by land use regulation
alone. On the other hand, the estimate is much smaller than that of Rothwell and
Massey, whose results suggested that moving from the most to least restrictive zoning
regime could have an impact on the dissimilarity index as large as 0.23 points.
7 Conclusion
Do strict density regulations have an exclusionary impact on minority populations
in stringently zoned neighborhoods? The results I present here for Massachusetts
suggest that they do. For each additional unit allowed per acre, the black share of
the population increases by 0.38 percentage points and the Hispanic share increases by
0.5 percentage points. The impact of permitting multi-family housing is particularly
strong, with the black share increasing by 3.38 percentage points and the Hispanic
share by 5.77 percentage points. By estimating the impacts using only areas along
33
zoning borders I am able to control for potentially omitted town and neighborhood
effects, isolating the variation coming from moving from a block on one side of a
zoning boundary to another. This paper is the first in this literature to isolate such
narrow spatial variation.
Future work is necessary to confirm the validity of these results in contexts beyond
Massachusetts, and to disentangle the mechanisms driving the results. Of particu-
lar interest is the intersection between race and socioeconomic status. While block
level census data are available by race, no income measures are available making it
difficult to separate income from the other channels by which land use regulation
might influence racial location. Given that much of the impact is mediated through
changes in the types of structures built, and that the proportion of minorities owning
homes lags whites even within income categories, it is unlikely the entire result can
be explained by income alone. Nonetheless, income surely plays a substantial role.
Even aside from any racial interaction, the effect of zoning on segregation by income
and educational attainment are worthy of study in their own right.
While changes in the dissimilarity index tend not to fit themselves neatly into
canonical social welfare functions, these results may be of interest to policymakers
who see lower (or higher) levels of racial segregation as a desirable outcome. The
Department of Housing and Urban Development issued new guidelines in July 2013
with the goal of “Affirmatively Furthering Fair Housing” and has threatened to with-
hold block grant money from New York’s Westchester County, among others, due to
“restrictive practices” such as limits on density and building type it sees as racially
and ethnically exclusionary. Angered by what he sees as federal overreach, a Westch-
ester County Executive penned a Wall Street Journal Op-Ed (Astorino, 2013) asking
residents whether they “think it is a good idea to give the Department of Housing
and Urban Development unchecked authority to put an apartment building in your
neighborhood.” While the results here cannot tell us about the desirability of such a
34

federal policy, they do imply that it would likely result in a substantial decrease in
racial segregation.
35
References
Ananat, E. O. (2011). The wrong side(s) of the tracks: The causal effects of racial
segregation on urban poverty and inequality. American Economic Journal: Applied
Economics 3, 34–66.
Astorino, R. (2013, September 5). Washington’s “fair housing” assault on local zoning.
The Wall Street Journal .
Bajari, P. and M. E. Kahn (2005). Estimating housing demand with an applica-
tion to explaining racial segregation in cities. Journal of Business and Economic
Statistics 23 (1), 20–33.
Bayer, P., F. Ferreira, and R. McMillan (2007). A unified framework for measuring
preferences for schools and neighborhoods. Journal of Political Economy 115 (4),
588–638.
Black, S. E. (1999). Do better schools matter? parental valuation of elementary
education. Quarterly Journal of Economics 114 (2), 577–599.
Boustan, L. P. (2010). Was postwar suburbanization “white flight”? Evidence from
the black migration. Quarterly Journal of Economics 125 (1), 417–442.
Card, D., A. Mas, and J. Rothstein (2008). Tipping and the dynamics of segregation.
Quarterly Journal of Economics 123 (1), 177–218.
Cutler, D. M., E. L. Glaeser, and J. L. Vigdor (1999). The rise and declilne of the
American ghetto. Journal of Political Economy 107, 455–506.
Danielson, M. N. (1976). The Politics of Exclusion. Columbia University Press.
Downs, A. (1973). Opening Up the Suburbs: An Urban Strategy for America. Yale
University Press.
36
Fischel, W. A. (1985). The Economics of Zoning Laws: A Property Rights Approach
to American Land Use Controls. The Johns Hopkins University Press.
Fischel, W. A. (2004). An economic history of zoning and a cure for its excexclusion
effects. Urban Studies 41, 317–340.
Fisher, L. (2008, November). Reviewing Chapter 40B: What gets proposed, what
gets approved, what gets appealed, what gets built? The Rappaport Institute for
Greater Boston.
Glaeser, E. L. and J. L. Vigdor (2012). The end of the segregated century: Racial
separation in America’s neighborhoods, 1890-2010. Manhattan Institute Civic Re-
port 66.
Glaeser, E. L. and B. Ward (2009). The causes and consequences of land use regula-
tion: Evidence from Greater Boston. Journal of Urban Economics 65, 265–278.
Gyourko, J., A. Saiz, and A. A. Summers (2008). A new measure of the local regu-
latory environment for housing markets. Urban Studies 45, 693–729.
Kasy, M. (2012). Identification in a model of sorting with social externalities and the
causes of urban segregation. Unpublished manuscript.
Morse, P. A. (1975). Route 128: Boston’s road to segregation. A Joint Report of the
Advisory Committee to the U.S. Commission on Civil Rights and the Massachusetts
Commisission Against Discrimination.
Office of Geographic Information, Commonwealth of Massachusetts, In-
formation Technology Division (2013). MassGIS Zoning Datalayer.
http://www.mass.gov/anf/research-and-tech/it-serv-and-support/application-
serv/office-of-geographic-information-massgis/datalayers/massgis-data-
zoning.html. Last accessed November 2013.
37
Pendall, R. (2000). Local land use regulation and the chain of exclusion. Journal of
the American Planning Association 66, 125–142.
Pendall, R., R. Puentes, and J. Martin (2006). From traditional to reformed: A
review of the land use regulations in the nations 50 largest metropolitan areas.
Brookings Institution Research Brief .
Rothwell, J. (2011). Racial enclaves and density zoning: The institutionalized seg-
regation of racial minorities in the United States. American Law and Economics
Review 13, 290–358.
Rothwell, J. and D. S. Massey (2009). The effect of density zoning on racial segrega-
tion in U.S. urban areas. Urban Affairs Review 44, 779–806.
Schelling, T. C. (1971). Dynamic models of segregation. Journal of Mathematical
Sociology 1, 143–186.
Schuetz, J., R. Meltzer, and V. Been (2009, March). Silver Bullet or Trojan Horse?
The effects of inclusionary zoning on local housing markets in Greater Boston. The
Rappaport Insitute for Greater Boston.
U.S. Census Bureau (2011). 2010 Census Summary File 1 – Massachusetts [machine-
readable data files].
Weise, A. (2004). Places of Their Own: African American Suburbanization in the
Twentieth Century. University of Chicago Press.
Wheaton, W. C. and B. Evenson (2003). Local variation in land use regulations.
Brookings-Wharton Papers on Urban Affairs 4, 221–260.
Zabel, J. and M. Dalton (2011). The impact of minimum lot size regulations on
house prices in eastern Massachusetts. Regional Science and Urban Economics 41,
571–583.
38
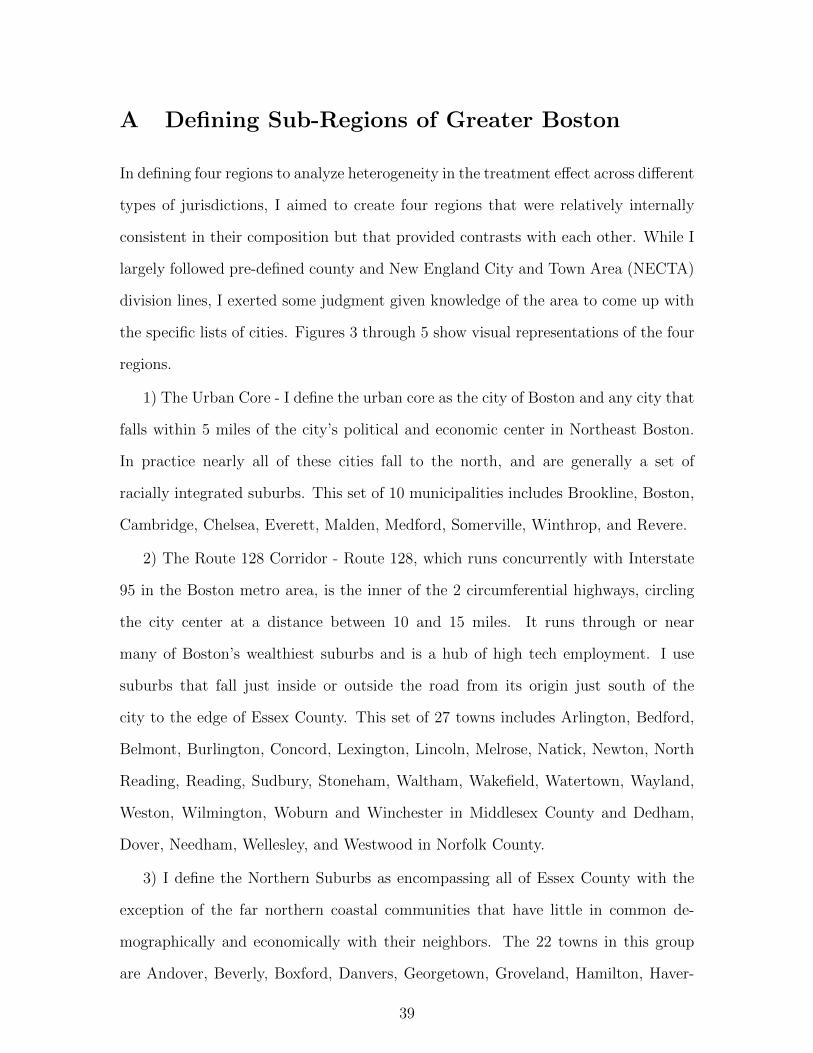
A Defining Sub-Regions of Greater Boston
In defining four regions to analyze heterogeneity in the treatment effect across different
types of jurisdictions, I aimed to create four regions that were relatively internally
consistent in their composition but that provided contrasts with each other. While I
largely followed pre-defined county and New England City and Town Area (NECTA)
division lines, I exerted some judgment given knowledge of the area to come up with
the specific lists of cities. Figures 3 through 5 show visual representations of the four
regions.
1) The Urban Core - I define the urban core as the city of Boston and any city that
falls within 5 miles of the city’s political and economic center in Northeast Boston.
In practice nearly all of these cities fall to the north, and are generally a set of
racially integrated suburbs. This set of 10 municipalities includes Brookline, Boston,
Cambridge, Chelsea, Everett, Malden, Medford, Somerville, Winthrop, and Revere.
2) The Route 128 Corridor - Route 128, which runs concurrently with Interstate
95 in the Boston metro area, is the inner of the 2 circumferential highways, circling
the city center at a distance between 10 and 15 miles. It runs through or near
many of Boston’s wealthiest suburbs and is a hub of high tech employment. I use
suburbs that fall just inside or outside the road from its origin just south of the
city to the edge of Essex County. This set of 27 towns includes Arlington, Bedford,
Belmont, Burlington, Concord, Lexington, Lincoln, Melrose, Natick, Newton, North
Reading, Reading, Sudbury, Stoneham, Waltham, Wakefield, Watertown, Wayland,
Weston, Wilmington, Woburn and Winchester in Middlesex County and Dedham,
Dover, Needham, Wellesley, and Westwood in Norfolk County.
3) I define the Northern Suburbs as encompassing all of Essex County with the
exception of the far northern coastal communities that have little in common de-
mographically and economically with their neighbors. The 22 towns in this group
are Andover, Beverly, Boxford, Danvers, Georgetown, Groveland, Hamilton, Haver-
39
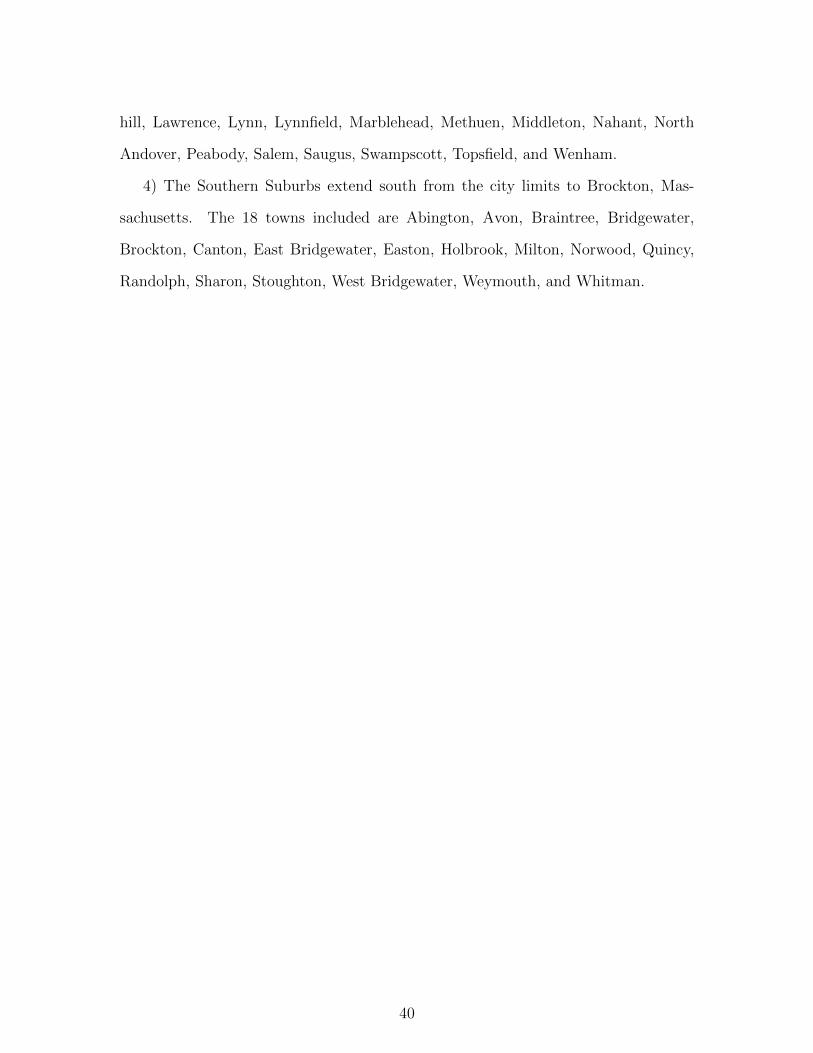
hill, Lawrence, Lynn, Lynnfield, Marblehead, Methuen, Middleton, Nahant, North
Andover, Peabody, Salem, Saugus, Swampscott, Topsfield, and Wenham.
4) The Southern Suburbs extend south from the city limits to Brockton, Mas-
sachusetts. The 18 towns included are Abington, Avon, Braintree, Bridgewater,
Brockton, Canton, East Bridgewater, Easton, Holbrook, Milton, Norwood, Quincy,
Randolph, Sharon, Stoughton, West Bridgewater, Weymouth, and Whitman.
40
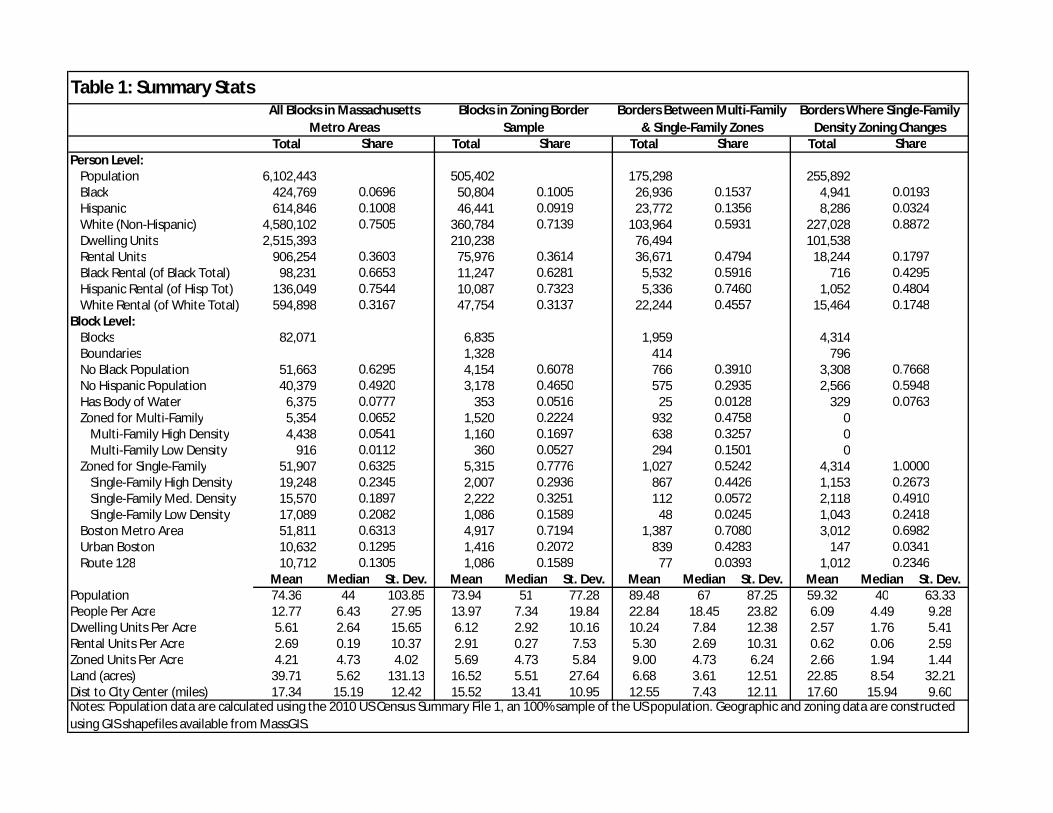
Total Total Total TotalPerson Level:
Population 6,102,443 505,402 175,298 255,892Black 424,769 50,804 26,936 4,941Hispanic 614,846 46,441 23,772 8,286White (Non-Hispanic) 4,580,102 360,784 103,964 227,028Dwelling Units 2,515,393 210,238 76,494 101,538Rental Units 906,254 75,976 36,671 18,244Black Rental (of Black Total) 98,231 11,247 5,532 716Hispanic Rental (of Hisp Tot) 136,049 10,087 5,336 1,052White Rental (of White Total) 594,898 47,754 22,244 15,464
Block Level:Blocks 82,071 6,835 1,959 4,314Boundaries 1,328 414 796No Black Population 51,663 4,154 766 3,308No Hispanic Population 40,379 3,178 575 2,566Has Body of Water 6,375 353 25 329Zoned for Multi-Family 5,354 1,520 932 0
Multi-Family High Density 4,438 1,160 638 0Multi-Family Low Density 916 360 294 0
Zoned for Single-Family 51,907 5,315 1,027 4,314Single-Family High Density 19,248 2,007 867 1,153Single-Family Med. Density 15,570 2,222 112 2,118Single-Family Low Density 17,089 1,086 48 1,043
Boston Metro Area 51,811 4,917 1,387 3,012Urban Boston 10,632 1,416 839 147Route 128 10,712 1,086 77 1,012
Mean Median St. Dev. Mean Median St. Dev. Mean Median St. Dev. Mean Median St. Dev.Population 74.36 44 103.85 73.94 51 77.28 89.48 67 87.25 59.32 40 63.33People Per Acre 12.77 6.43 27.95 13.97 7.34 19.84 22.84 18.45 23.82 6.09 4.49 9.28Dwelling Units Per Acre 5.61 2.64 15.65 6.12 2.92 10.16 10.24 7.84 12.38 2.57 1.76 5.41Rental Units Per Acre 2.69 0.19 10.37 2.91 0.27 7.53 5.30 2.69 10.31 0.62 0.06 2.59Zoned Units Per Acre 4.21 4.73 4.02 5.69 4.73 5.84 9.00 4.73 6.24 2.66 1.94 1.44Land (acres) 39.71 5.62 131.13 16.52 5.51 27.64 6.68 3.61 12.51 22.85 8.54 32.21Dist to City Center (miles) 17.34 15.19 12.42 15.52 13.41 10.95 12.55 7.43 12.11 17.60 15.94 9.60Notes: Population data are calculated using the 2010 US Census Summary File 1, an 100% sample of the US population. Geographic and zoning data are constructed using GIS shapefiles available from MassGIS.
0.1295 0.2072 0.4283 0.03410.1305 0.1589 0.0393 0.2346
0.2082 0.1589 0.0245 0.24180.6313 0.7194 0.7080 0.6982
0.2345 0.2936 0.4426 0.26730.1897 0.3251 0.0572 0.4910
0.0112 0.0527 0.15010.6325 0.7776 0.5242 1.0000
0.0652 0.2224 0.47580.0541 0.1697 0.3257
0.4920 0.4650 0.2935 0.59480.0777 0.0516 0.0128 0.0763
0.6295 0.6078 0.3910 0.7668
0.3167 0.3137 0.4557 0.1748
0.6653 0.6281 0.5916 0.42950.7544 0.7323 0.7460 0.4804
0.3603 0.3614 0.4794 0.1797
0.1008 0.0919 0.1356 0.03240.7505 0.7139 0.5931 0.8872
0.0696 0.1005 0.1537 0.0193
Table 1: Summary StatsAll Blocks in Massachusetts
Metro AreasBlocks in Zoning Border
SampleBorders Between Multi-Family
& Single-Family ZonesBorders Where Single-Family
Density Zoning ChangesShare Share Share Share
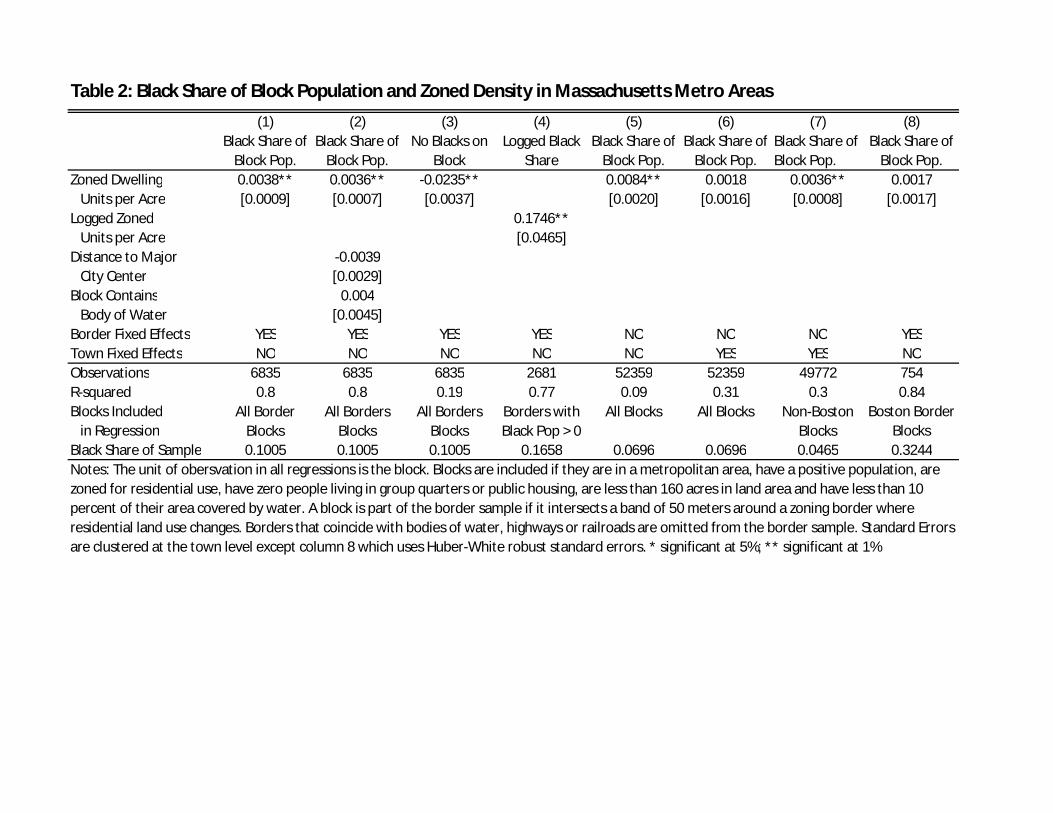
(1) (2) (3) (4) (5) (6) (7) (8)
Zoned Dwelling 0.0038** 0.0036** -0.0235** 0.0084** 0.0018 0.0036** 0.0017Units per Acre [0.0009] [0.0007] [0.0037] [0.0020] [0.0016] [0.0008] [0.0017]
Logged Zoned 0.1746**Units per Acre [0.0465]
Distance to Major -0.0039City Center [0.0029]
Block Contains 0.004Body of Water [0.0045]
Border Fixed Effects YES YES YES YES NO NO NO YESTown Fixed Effects NO NO NO NO NO YES YES NOObservations 6835 6835 6835 2681 52359 52359 49772 754R-squared 0.8 0.8 0.19 0.77 0.09 0.31 0.3 0.84Blocks Included
in RegressionBlack Share of Sample 0.1005 0.1005 0.1005 0.1658 0.0696 0.0696 0.0465 0.3244Notes: The unit of obersvation in all regressions is the block. Blocks are included if they are in a metropolitan area, have a positive population, are zoned for residential use, have zero people living in group quarters or public housing, are less than 160 acres in land area and have less than 10 percent of their area covered by water. A block is part of the border sample if it intersects a band of 50 meters around a zoning border where residential land use changes. Borders that coincide with bodies of water, highways or railroads are omitted from the border sample. Standard Errors are clustered at the town level except column 8 which uses Huber-White robust standard errors. * significant at 5%; ** significant at 1%
All Blocks All Blocks Non-Boston Blocks
Boston Border Blocks
All Border Blocks
All Borders Blocks
All Borders Blocks
Borders with Black Pop > 0
Black Share of Block Pop.
Black Share of Block Pop.
Black Share of Block Pop.
Table 2: Black Share of Block Population and Zoned Density in Massachusetts Metro Areas
Black Share of Block Pop.
Black Share of Block Pop.
No Blacks on Block
Logged Black Share
Black Share of Block Pop.
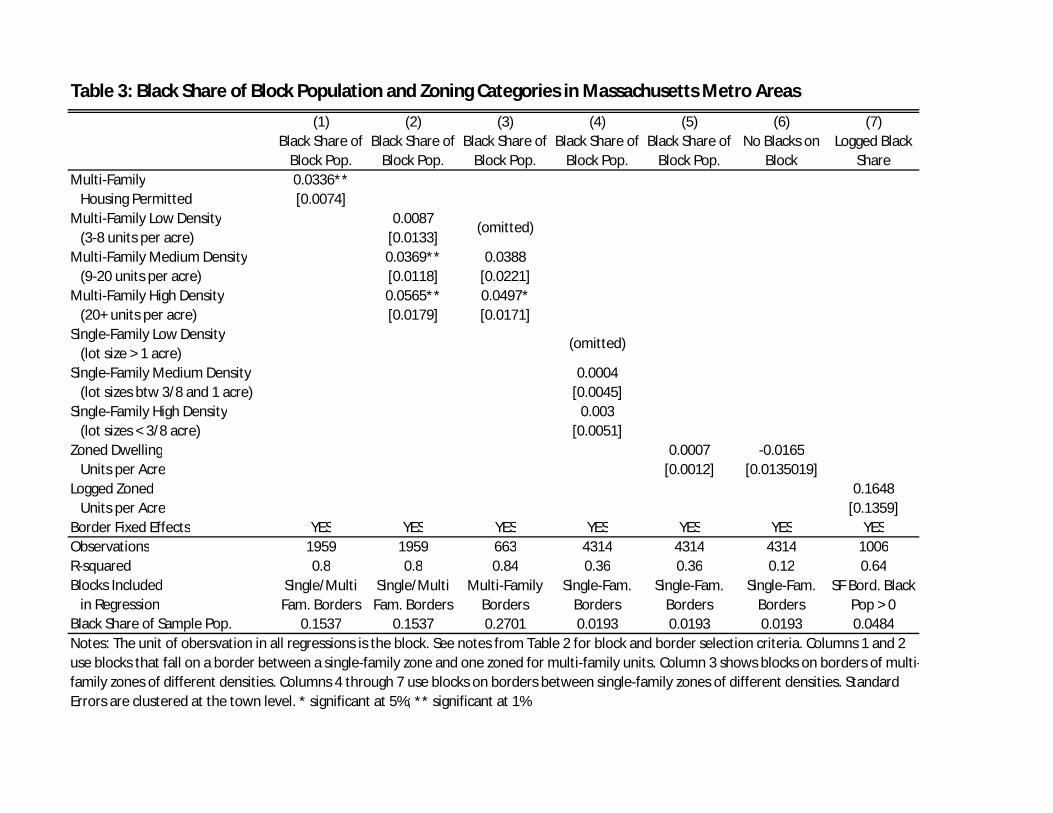
(1) (2) (3) (4) (5) (6) (7)
Multi-Family 0.0336**Housing Permitted [0.0074]
Multi-Family Low Density 0.0087(3-8 units per acre) [0.0133]
Multi-Family Medium Density 0.0369** 0.0388(9-20 units per acre) [0.0118] [0.0221]
Multi-Family High Density 0.0565** 0.0497*(20+ units per acre) [0.0179] [0.0171]
Single-Family Low Density(lot size > 1 acre)
Single-Family Medium Density 0.0004(lot sizes btw 3/8 and 1 acre) [0.0045]
Single-Family High Density 0.003(lot sizes < 3/8 acre) [0.0051]
Zoned Dwelling 0.0007 -0.0165Units per Acre [0.0012] [0.0135019]
Logged Zoned 0.1648Units per Acre [0.1359]
Border Fixed Effects YES YES YES YES YES YES YESObservations 1959 1959 663 4314 4314 4314 1006R-squared 0.8 0.8 0.84 0.36 0.36 0.12 0.64Blocks Included
in RegressionBlack Share of Sample Pop. 0.1537 0.1537 0.2701 0.0193 0.0193 0.0193 0.0484
Single-Fam. Borders
Single-Fam. Borders
SF Bord. Black Pop > 0
Notes: The unit of obersvation in all regressions is the block. See notes from Table 2 for block and border selection criteria. Columns 1 and 2 use blocks that fall on a border between a single-family zone and one zoned for multi-family units. Column 3 shows blocks on borders of multi-family zones of different densities. Columns 4 through 7 use blocks on borders between single-family zones of different densities. Standard Errors are clustered at the town level. * significant at 5%; ** significant at 1%
(omitted)
(omitted)
Single/Multi Fam. Borders
Single/Multi Fam. Borders
Multi-Family Borders
Single-Fam. Borders
Table 3: Black Share of Block Population and Zoning Categories in Massachusetts Metro Areas
Black Share of Block Pop.
Black Share of Block Pop.
Black Share of Block Pop.
Black Share of Block Pop.
Black Share of Block Pop.
No Blacks on Block
Logged Black Share
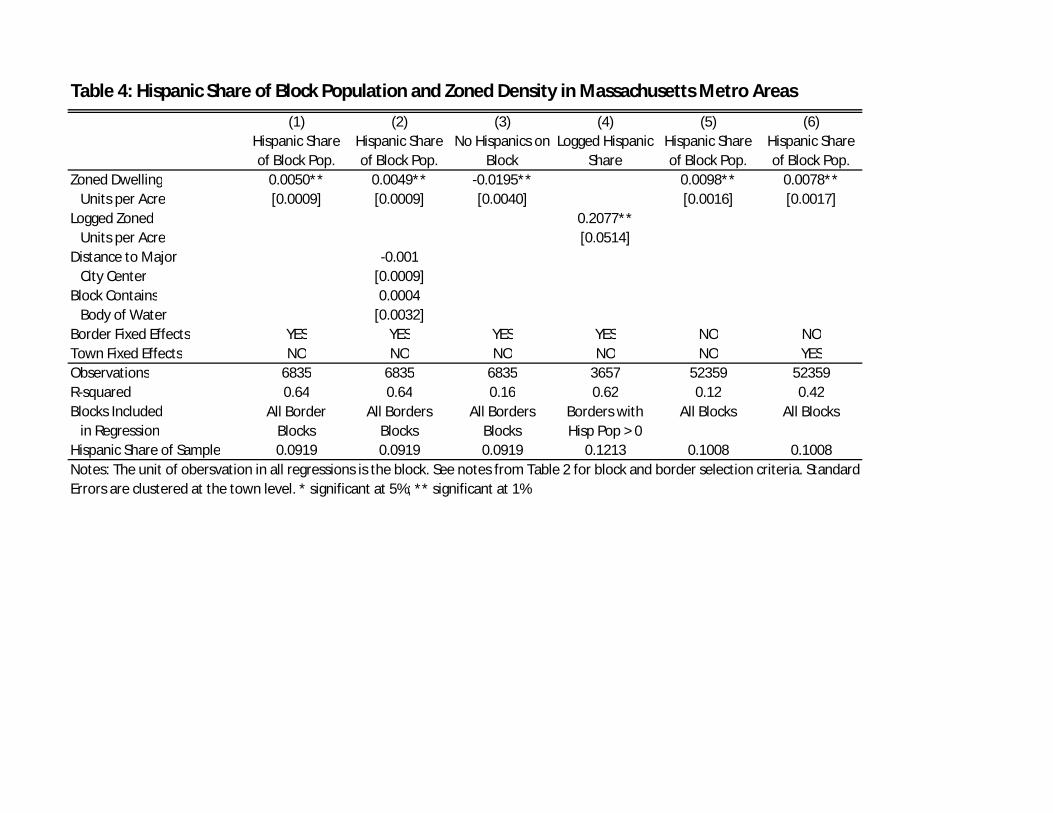
(1) (2) (3) (4) (5) (6)
Zoned Dwelling 0.0050** 0.0049** -0.0195** 0.0098** 0.0078**Units per Acre [0.0009] [0.0009] [0.0040] [0.0016] [0.0017]
Logged Zoned 0.2077**Units per Acre [0.0514]
Distance to Major -0.001City Center [0.0009]
Block Contains 0.0004Body of Water [0.0032]
Border Fixed Effects YES YES YES YES NO NOTown Fixed Effects NO NO NO NO NO YESObservations 6835 6835 6835 3657 52359 52359R-squared 0.64 0.64 0.16 0.62 0.12 0.42Blocks Included
in RegressionHispanic Share of Sample 0.0919 0.0919 0.0919 0.1213 0.1008 0.1008
Table 4: Hispanic Share of Block Population and Zoned Density in Massachusetts Metro Areas
Notes: The unit of obersvation in all regressions is the block. See notes from Table 2 for block and border selection criteria. Standard Errors are clustered at the town level. * significant at 5%; ** significant at 1%
All Border Blocks
All Borders Blocks
All Borders Blocks
Borders with Hisp Pop > 0
All Blocks All Blocks
Hispanic Share of Block Pop.
Hispanic Share of Block Pop.
No Hispanics on Block
Logged Hispanic Share
Hispanic Share of Block Pop.
Hispanic Share of Block Pop.

(1) (2) (3) (4) (5) (6) (7)
Multi-Family 0.0577**Housing Permitted [0.0122]
Multi-Family Low Density 0.0344*(3-8 units per acre) [0.0146]
Multi-Family Medium Density 0.0630** 0.0324(9-20 units per acre) [0.0192] [0.0250]
Multi-Family High Density 0.0753** 0.0596*(20+ units per acre) [0.0229] [0.0186]
Single-family Low Density(lot size > 1 acre)Single-Family Medium Density 0.0031(lot sizes btw 3/8 and 1 acre) [0.0028]Single-Family High Density 0.0137(lot sizes < 3/8 acre) [0.0074]Zoned Dwelling 0.0033 -0.0485**
Units per Acre [0.0018] [0.0135]Logged Zoned 0.0475
Units per Acre [0.0937]Border Fixed Effects YES YES YES YES YES YES YESObservations 1959 1959 663 4314 4314 4314 1748R-squared 0.63 0.64 0.64 0.3 0.29 0.11 0.46Blocks Included
in RegressionHispanic Share of Sample Pop. 0.1356 0.1356 0.1859 0.0324 0.0324 0.0324 0.0521
Single-Fam. Borders
Single-Fam. Borders
SF Bord. Hisp. Pop > 0
Notes: The unit of obersvation in all regressions is the block. See notes from Table 2 for block and border selection criteria. Columns 1 and 2 use blocks that fall on a border between a single-family zone and one zoned for multi-family units. Column 3 shows blocks on borders of multi-family zones of different densities. Columns 4 through 7 use blocks on borders between single-family zones of different densities. Standard Errors are clustered at the town level. * significant at 5%; ** significant at 1%
(omitted)
(omitted)
Single/Multi Fam. Borders
Single/Multi Fam. Borders
Multi-Family Borders
Single-Fam. Borders
Table 5: Hispanic Share of Block Population and Zoning Categories in Massachusetts Metro Areas
Hispanic Share of Block Pop.
Hispanic Share of Block Pop.
Hispanic Share of Block Pop.
Hispanic Share of Block Pop.
Hispanic Share of Block Pop.
No Hispanics on Block
Logged Hispanic Share
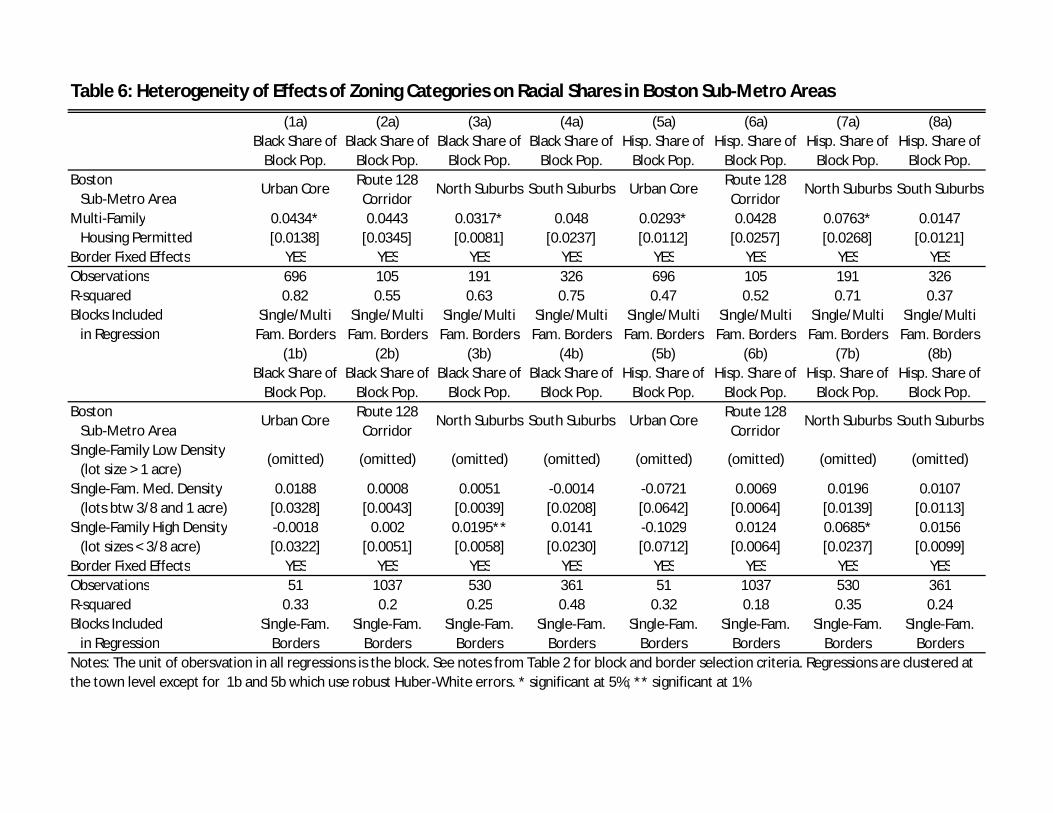
(1a) (2a) (3a) (4a) (5a) (6a) (7a) (8a)
BostonSub-Metro Area
Multi-Family 0.0434* 0.0443 0.0317* 0.048 0.0293* 0.0428 0.0763* 0.0147Housing Permitted [0.0138] [0.0345] [0.0081] [0.0237] [0.0112] [0.0257] [0.0268] [0.0121]
Border Fixed Effects YES YES YES YES YES YES YES YESObservations 696 105 191 326 696 105 191 326R-squared 0.82 0.55 0.63 0.75 0.47 0.52 0.71 0.37Blocks Included
in Regression(1b) (2b) (3b) (4b) (5b) (6b) (7b) (8b)
BostonSub-Metro Area
Single-Family Low Density(lot size > 1 acre)
Single-Fam. Med. Density 0.0188 0.0008 0.0051 -0.0014 -0.0721 0.0069 0.0196 0.0107(lots btw 3/8 and 1 acre) [0.0328] [0.0043] [0.0039] [0.0208] [0.0642] [0.0064] [0.0139] [0.0113]
Single-Family High Density -0.0018 0.002 0.0195** 0.0141 -0.1029 0.0124 0.0685* 0.0156(lot sizes < 3/8 acre) [0.0322] [0.0051] [0.0058] [0.0230] [0.0712] [0.0064] [0.0237] [0.0099]
Border Fixed Effects YES YES YES YES YES YES YES YESObservations 51 1037 530 361 51 1037 530 361R-squared 0.33 0.2 0.25 0.48 0.32 0.18 0.35 0.24Blocks Included
in Regression
(omitted)
Notes: The unit of obersvation in all regressions is the block. See notes from Table 2 for block and border selection criteria. Regressions are clustered at the town level except for 1b and 5b which use robust Huber-White errors. * significant at 5%; ** significant at 1%
Single/Multi Fam. Borders
Single-Fam. Borders
Single-Fam. Borders
Single-Fam. Borders
Single-Fam. Borders
Single-Fam. Borders
Single-Fam. Borders
Single-Fam. Borders
Single-Fam. Borders
(omitted) (omitted)
Single/Multi Fam. Borders
Single/Multi Fam. Borders
Single/Multi Fam. Borders
(omitted) (omitted) (omitted) (omitted) (omitted)
Route 128 Corridor
North Suburbs South Suburbs
Single/Multi Fam. Borders
Single/Multi Fam. Borders
Single/Multi Fam. Borders
Urban Core Route 128 Corridor
North Suburbs South Suburbs Urban Core
South Suburbs
Black Share of Block Pop.
Black Share of Block Pop.
Black Share of Block Pop.
Black Share of Block Pop.
Hisp. Share of Block Pop.
Hisp. Share of Block Pop.
Hisp. Share of Block Pop.
Hisp. Share of Block Pop.
Single/Multi Fam. Borders
Hisp. Share of Block Pop.
Hisp. Share of Block Pop.
Table 6: Heterogeneity of Effects of Zoning Categories on Racial Shares in Boston Sub-Metro Areas
Urban Core Route 128 Corridor
North Suburbs South Suburbs Urban Core
Black Share of Block Pop.
Black Share of Block Pop.
Black Share of Block Pop.
Black Share of Block Pop.
Hisp. Share of Block Pop.
Hisp. Share of Block Pop.Route 128 Corridor
North Suburbs
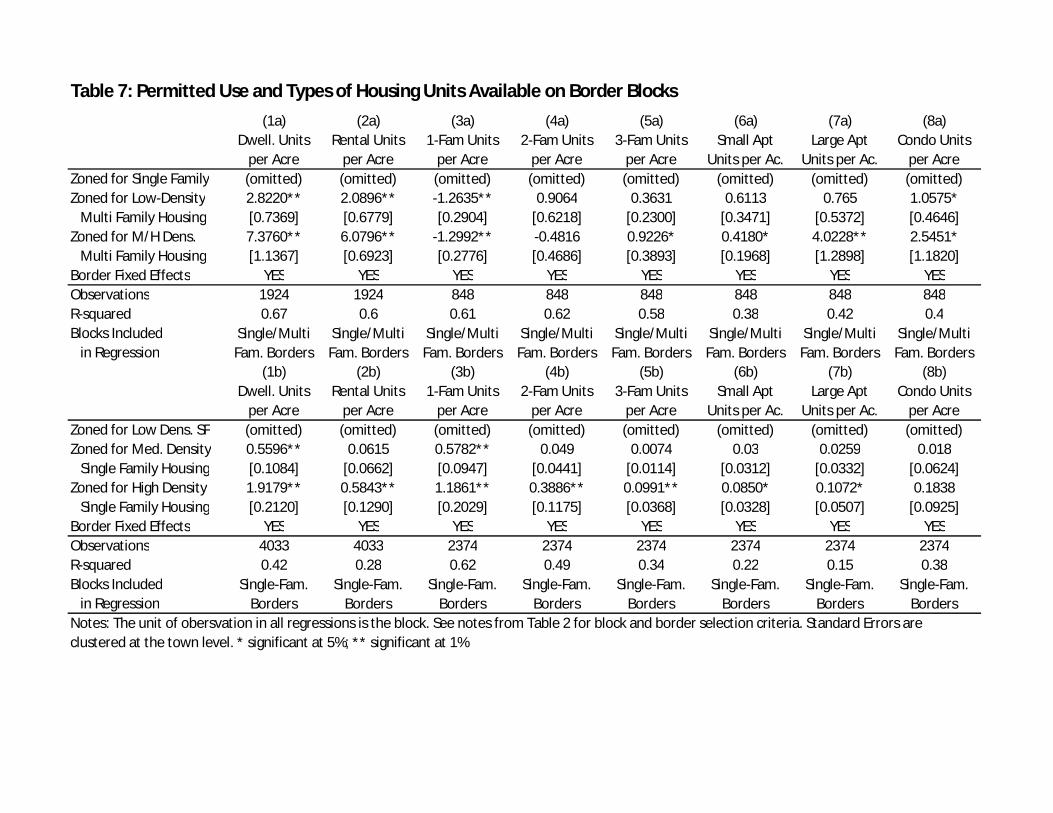
(1a) (2a) (3a) (4a) (5a) (6a) (7a) (8a)
Zoned for Single Family (omitted) (omitted) (omitted) (omitted) (omitted) (omitted) (omitted) (omitted)Zoned for Low-Density 2.8220** 2.0896** -1.2635** 0.9064 0.3631 0.6113 0.765 1.0575*
Multi Family Housing [0.7369] [0.6779] [0.2904] [0.6218] [0.2300] [0.3471] [0.5372] [0.4646]Zoned for M/H Dens. 7.3760** 6.0796** -1.2992** -0.4816 0.9226* 0.4180* 4.0228** 2.5451*
Multi Family Housing [1.1367] [0.6923] [0.2776] [0.4686] [0.3893] [0.1968] [1.2898] [1.1820]Border Fixed Effects YES YES YES YES YES YES YES YESObservations 1924 1924 848 848 848 848 848 848R-squared 0.67 0.6 0.61 0.62 0.58 0.38 0.42 0.4Blocks Included
in Regression(1b) (2b) (3b) (4b) (5b) (6b) (7b) (8b)
Zoned for Low Dens. SF (omitted) (omitted) (omitted) (omitted) (omitted) (omitted) (omitted) (omitted)Zoned for Med. Density 0.5596** 0.0615 0.5782** 0.049 0.0074 0.03 0.0259 0.018
Single Family Housing [0.1084] [0.0662] [0.0947] [0.0441] [0.0114] [0.0312] [0.0332] [0.0624]Zoned for High Density 1.9179** 0.5843** 1.1861** 0.3886** 0.0991** 0.0850* 0.1072* 0.1838
Single Family Housing [0.2120] [0.1290] [0.2029] [0.1175] [0.0368] [0.0328] [0.0507] [0.0925]Border Fixed Effects YES YES YES YES YES YES YES YESObservations 4033 4033 2374 2374 2374 2374 2374 2374R-squared 0.42 0.28 0.62 0.49 0.34 0.22 0.15 0.38Blocks Included
in RegressionNotes: The unit of obersvation in all regressions is the block. See notes from Table 2 for block and border selection criteria. Standard Errors are clustered at the town level. * significant at 5%; ** significant at 1%
Single-Fam. Borders
Single-Fam. Borders
Single-Fam. Borders
Single-Fam. Borders
Single-Fam. Borders
Single-Fam. Borders
Single-Fam. Borders
Single-Fam. Borders
Dwell. Units per Acre
Rental Units per Acre
1-Fam Units per Acre
2-Fam Units per Acre
3-Fam Units per Acre
Small Apt Units per Ac.
Single/Multi Fam. Borders
Single/Multi Fam. Borders
Large Apt Units per Ac.
Condo Units per Acre
Table 7: Permitted Use and Types of Housing Units Available on Border Blocks
Large Apt Units per Ac.
Condo Units per Acre
Single/Multi Fam. Borders
Single/Multi Fam. Borders
Single/Multi Fam. Borders
Single/Multi Fam. Borders
Single/Multi Fam. Borders
Single/Multi Fam. Borders
Dwell. Units per Acre
Rental Units per Acre
1-Fam Units per Acre
2-Fam Units per Acre
3-Fam Units per Acre
Small Apt Units per Ac.
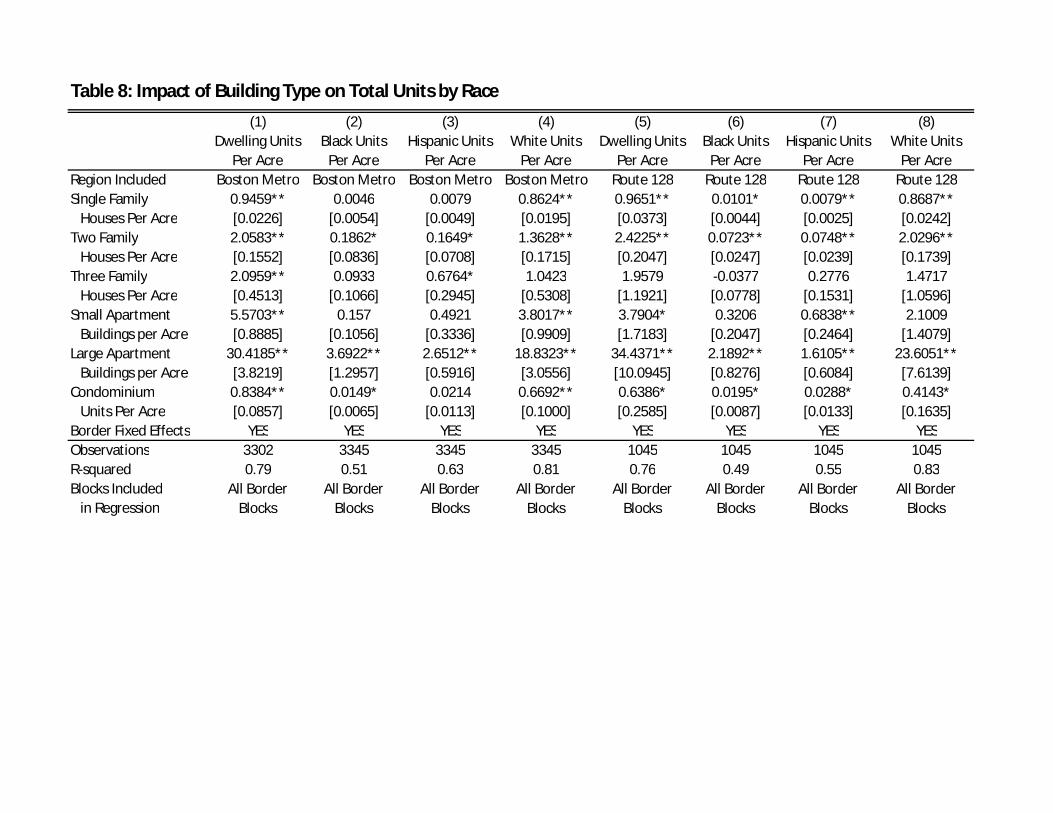
(1) (2) (3) (4) (5) (6) (7) (8)
Region Included Boston Metro Boston Metro Boston Metro Boston Metro Route 128 Route 128 Route 128 Route 128Single Family 0.9459** 0.0046 0.0079 0.8624** 0.9651** 0.0101* 0.0079** 0.8687**
Houses Per Acre [0.0226] [0.0054] [0.0049] [0.0195] [0.0373] [0.0044] [0.0025] [0.0242]Two Family 2.0583** 0.1862* 0.1649* 1.3628** 2.4225** 0.0723** 0.0748** 2.0296**
Houses Per Acre [0.1552] [0.0836] [0.0708] [0.1715] [0.2047] [0.0247] [0.0239] [0.1739]Three Family 2.0959** 0.0933 0.6764* 1.0423 1.9579 -0.0377 0.2776 1.4717
Houses Per Acre [0.4513] [0.1066] [0.2945] [0.5308] [1.1921] [0.0778] [0.1531] [1.0596]Small Apartment 5.5703** 0.157 0.4921 3.8017** 3.7904* 0.3206 0.6838** 2.1009
Buildings per Acre [0.8885] [0.1056] [0.3336] [0.9909] [1.7183] [0.2047] [0.2464] [1.4079]Large Apartment 30.4185** 3.6922** 2.6512** 18.8323** 34.4371** 2.1892** 1.6105** 23.6051**
Buildings per Acre [3.8219] [1.2957] [0.5916] [3.0556] [10.0945] [0.8276] [0.6084] [7.6139]Condominium 0.8384** 0.0149* 0.0214 0.6692** 0.6386* 0.0195* 0.0288* 0.4143*
Units Per Acre [0.0857] [0.0065] [0.0113] [0.1000] [0.2585] [0.0087] [0.0133] [0.1635]Border Fixed Effects YES YES YES YES YES YES YES YESObservations 3302 3345 3345 3345 1045 1045 1045 1045R-squared 0.79 0.51 0.63 0.81 0.76 0.49 0.55 0.83Blocks Included
in RegressionAll Border
BlocksAll Border
BlocksAll Border
Blocks
Table 8: Impact of Building Type on Total Units by Race
Dwelling Units Per Acre
Black Units Per Acre
Hispanic Units Per Acre
White Units Per Acre
Dwelling Units Per Acre
Black Units Per Acre
Hispanic Units Per Acre
White Units Per Acre
All Border Blocks
All Border Blocks
All Border Blocks
All Border Blocks
All Border Blocks
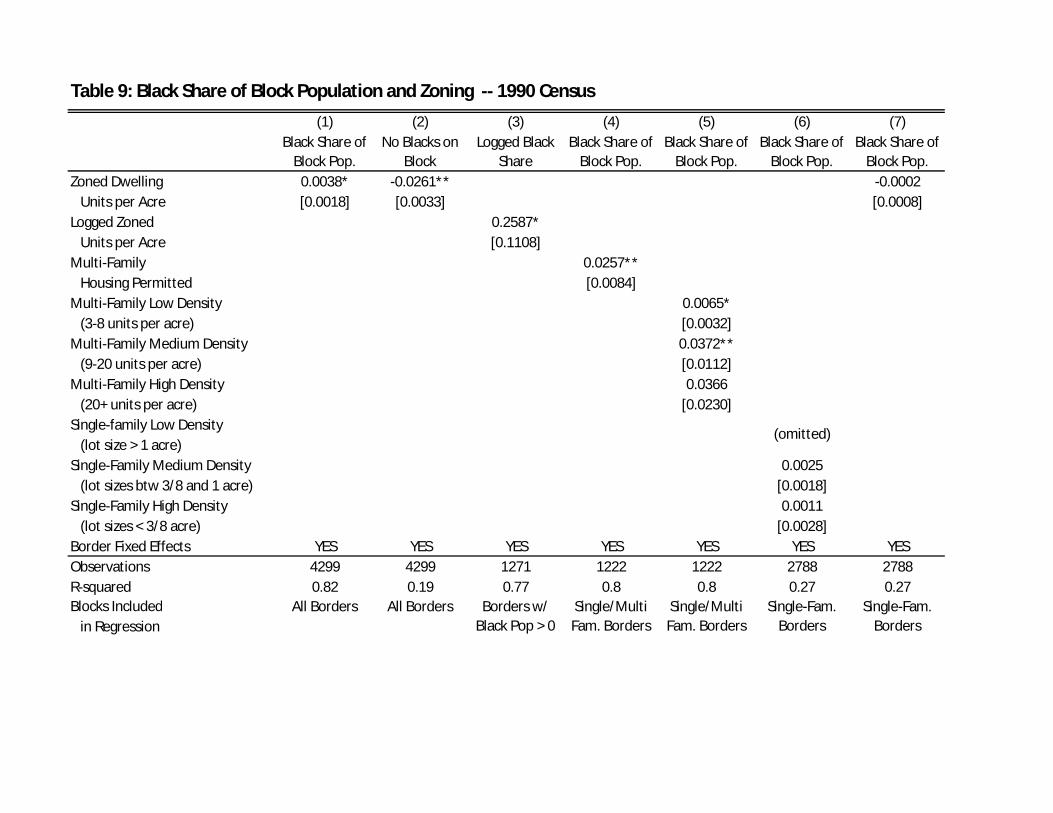
(1) (2) (3) (4) (5) (6) (7)
Zoned Dwelling 0.0038* -0.0261** -0.0002Units per Acre [0.0018] [0.0033] [0.0008]
Logged Zoned 0.2587*Units per Acre [0.1108]
Multi-Family 0.0257**Housing Permitted [0.0084]
Multi-Family Low Density 0.0065*(3-8 units per acre) [0.0032]
Multi-Family Medium Density 0.0372**(9-20 units per acre) [0.0112]
Multi-Family High Density 0.0366(20+ units per acre) [0.0230]
Single-family Low Density(lot size > 1 acre)
Single-Family Medium Density 0.0025(lot sizes btw 3/8 and 1 acre) [0.0018]
Single-Family High Density 0.0011(lot sizes < 3/8 acre) [0.0028]
Border Fixed Effects YES YES YES YES YES YES YESObservations 4299 4299 1271 1222 1222 2788 2788R-squared 0.82 0.19 0.77 0.8 0.8 0.27 0.27Blocks Included
in RegressionAll Borders All Borders Borders w/
Black Pop > 0Single/Multi Fam. Borders
Single/Multi Fam. Borders
Single-Fam. Borders
Single-Fam. Borders
(omitted)
Table 9: Black Share of Block Population and Zoning -- 1990 Census
Black Share of Block Pop.
Black Share of Block Pop.
Logged Black Share
Black Share of Block Pop.
Black Share of Block Pop.
No Blacks on Block
Black Share of Block Pop.
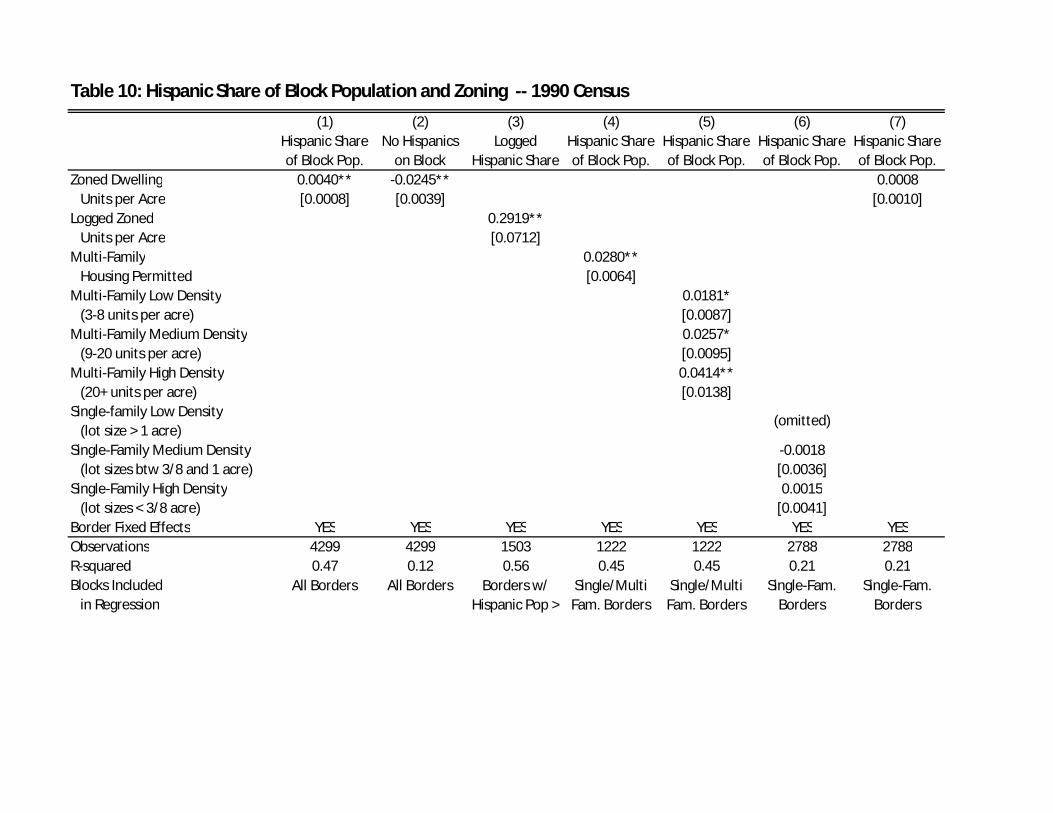
(1) (2) (3) (4) (5) (6) (7)
Zoned Dwelling 0.0040** -0.0245** 0.0008Units per Acre [0.0008] [0.0039] [0.0010]
Logged Zoned 0.2919**Units per Acre [0.0712]
Multi-Family 0.0280**Housing Permitted [0.0064]
Multi-Family Low Density 0.0181*(3-8 units per acre) [0.0087]
Multi-Family Medium Density 0.0257*(9-20 units per acre) [0.0095]
Multi-Family High Density 0.0414**(20+ units per acre) [0.0138]
Single-family Low Density(lot size > 1 acre)
Single-Family Medium Density -0.0018(lot sizes btw 3/8 and 1 acre) [0.0036]
Single-Family High Density 0.0015(lot sizes < 3/8 acre) [0.0041]
Border Fixed Effects YES YES YES YES YES YES YESObservations 4299 4299 1503 1222 1222 2788 2788R-squared 0.47 0.12 0.56 0.45 0.45 0.21 0.21Blocks Included
in Regression
Table 10: Hispanic Share of Block Population and Zoning -- 1990 Census
Hispanic Share of Block Pop.
No Hispanics on Block
Logged Hispanic Share
Hispanic Share of Block Pop.
Hispanic Share of Block Pop.
Hispanic Share of Block Pop.
Hispanic Share of Block Pop.
All Borders All Borders Borders w/ Hispanic Pop >
Single/Multi Fam. Borders
Single/Multi Fam. Borders
Single-Fam. Borders
Single-Fam. Borders
(omitted)
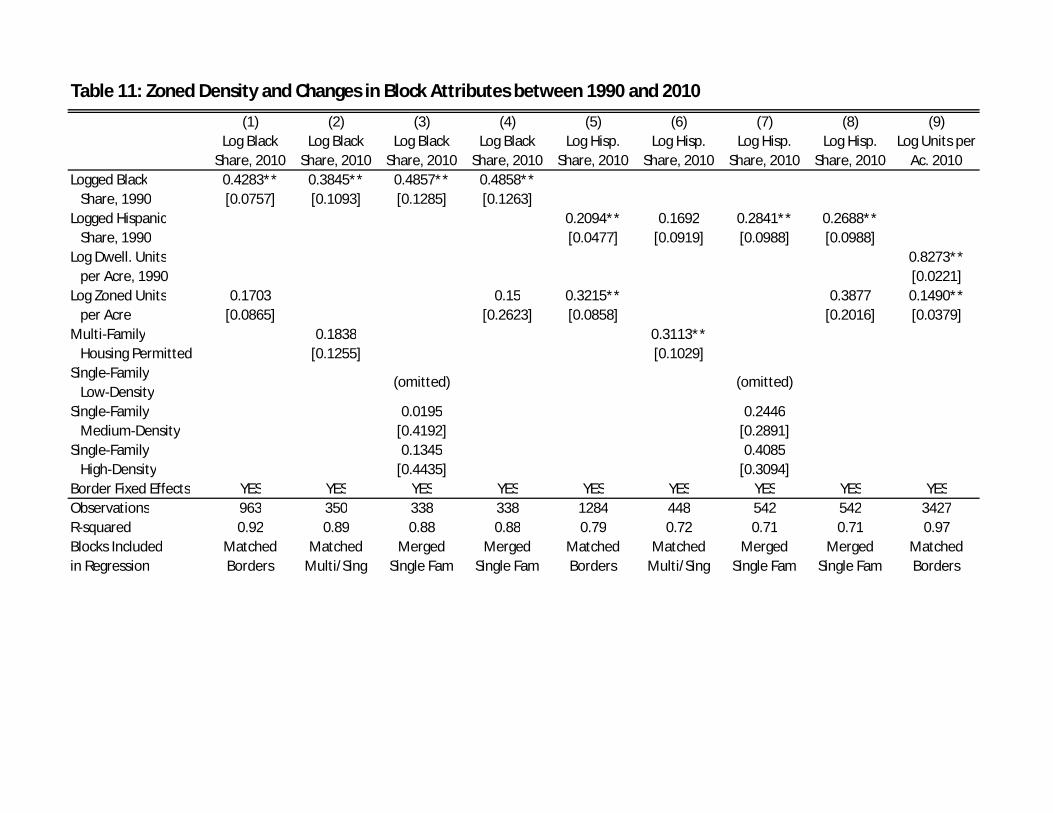
(1) (2) (3) (4) (5) (6) (7) (8) (9)
Logged Black 0.4283** 0.3845** 0.4857** 0.4858**Share, 1990 [0.0757] [0.1093] [0.1285] [0.1263]
Logged Hispanic 0.2094** 0.1692 0.2841** 0.2688**Share, 1990 [0.0477] [0.0919] [0.0988] [0.0988]
Log Dwell. Units 0.8273**per Acre, 1990 [0.0221]
Log Zoned Units 0.1703 0.15 0.3215** 0.3877 0.1490**per Acre [0.0865] [0.2623] [0.0858] [0.2016] [0.0379]
Multi-Family 0.1838 0.3113**Housing Permitted [0.1255] [0.1029]
Single-FamilyLow-Density
Single-Family 0.0195 0.2446Medium-Density [0.4192] [0.2891]
Single-Family 0.1345 0.4085High-Density [0.4435] [0.3094]
Border Fixed Effects YES YES YES YES YES YES YES YES YESObservations 963 350 338 338 1284 448 542 542 3427R-squared 0.92 0.89 0.88 0.88 0.79 0.72 0.71 0.71 0.97Blocks Includedin Regression
Log Units per Ac. 2010
(omitted) (omitted)
Table 11: Zoned Density and Changes in Block Attributes between 1990 and 2010
Log Black Share, 2010
Log Black Share, 2010
Log Black Share, 2010
Log Black Share, 2010
Log Hisp. Share, 2010
Log Hisp. Share, 2010
Log Hisp. Share, 2010
Log Hisp. Share, 2010
Merged Single Fam
Merged Single Fam
Matched Borders
Matched Borders
Matched Multi/Sing
Merged Single Fam
Merged Single Fam
Matched Borders
Matched Multi/Sing
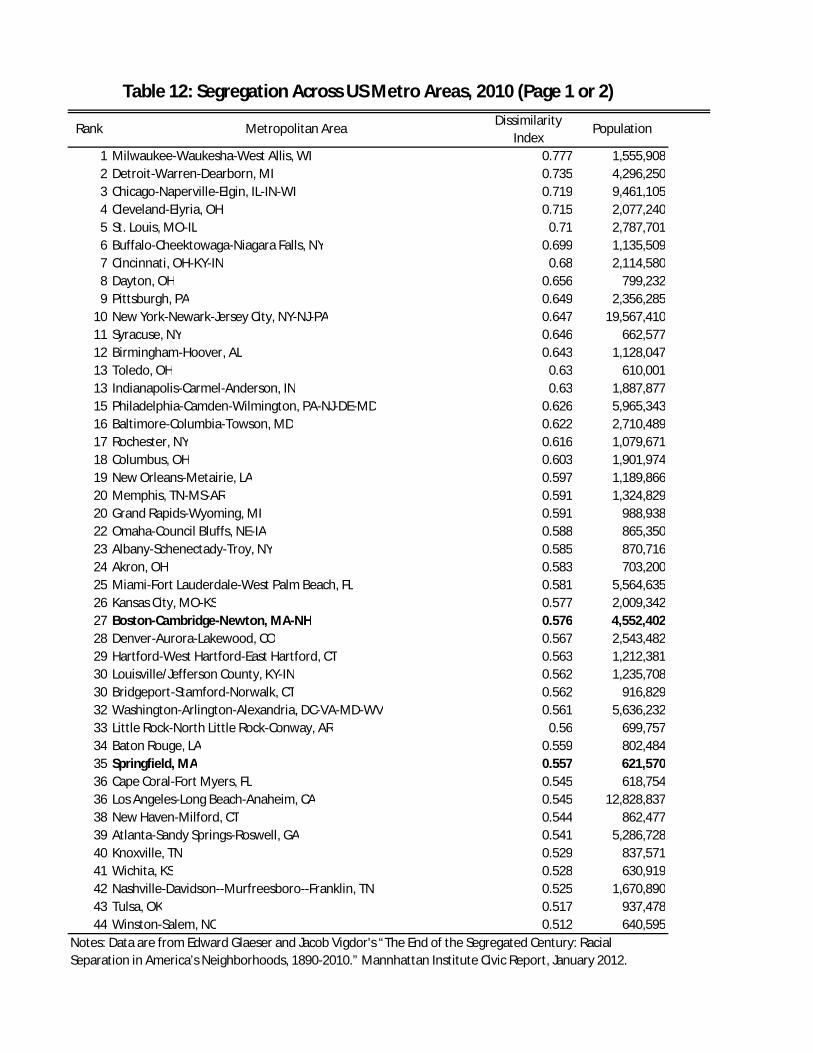
1 Milwaukee-Waukesha-West Allis, WI 0.777 1,555,9082 Detroit-Warren-Dearborn, MI 0.735 4,296,2503 Chicago-Naperville-Elgin, IL-IN-WI 0.719 9,461,1054 Cleveland-Elyria, OH 0.715 2,077,2405 St. Louis, MO-IL 0.71 2,787,7016 Buffalo-Cheektowaga-Niagara Falls, NY 0.699 1,135,5097 Cincinnati, OH-KY-IN 0.68 2,114,5808 Dayton, OH 0.656 799,2329 Pittsburgh, PA 0.649 2,356,285
10 New York-Newark-Jersey City, NY-NJ-PA 0.647 19,567,41011 Syracuse, NY 0.646 662,57712 Birmingham-Hoover, AL 0.643 1,128,04713 Toledo, OH 0.63 610,00113 Indianapolis-Carmel-Anderson, IN 0.63 1,887,87715 Philadelphia-Camden-Wilmington, PA-NJ-DE-MD 0.626 5,965,34316 Baltimore-Columbia-Towson, MD 0.622 2,710,48917 Rochester, NY 0.616 1,079,67118 Columbus, OH 0.603 1,901,97419 New Orleans-Metairie, LA 0.597 1,189,86620 Memphis, TN-MS-AR 0.591 1,324,82920 Grand Rapids-Wyoming, MI 0.591 988,93822 Omaha-Council Bluffs, NE-IA 0.588 865,35023 Albany-Schenectady-Troy, NY 0.585 870,71624 Akron, OH 0.583 703,20025 Miami-Fort Lauderdale-West Palm Beach, FL 0.581 5,564,63526 Kansas City, MO-KS 0.577 2,009,34227 Boston-Cambridge-Newton, MA-NH 0.576 4,552,40228 Denver-Aurora-Lakewood, CO 0.567 2,543,48229 Hartford-West Hartford-East Hartford, CT 0.563 1,212,38130 Louisville/Jefferson County, KY-IN 0.562 1,235,70830 Bridgeport-Stamford-Norwalk, CT 0.562 916,82932 Washington-Arlington-Alexandria, DC-VA-MD-WV 0.561 5,636,23233 Little Rock-North Little Rock-Conway, AR 0.56 699,75734 Baton Rouge, LA 0.559 802,48435 Springfield, MA 0.557 621,57036 Cape Coral-Fort Myers, FL 0.545 618,75436 Los Angeles-Long Beach-Anaheim, CA 0.545 12,828,83738 New Haven-Milford, CT 0.544 862,47739 Atlanta-Sandy Springs-Roswell, GA 0.541 5,286,72840 Knoxville, TN 0.529 837,57141 Wichita, KS 0.528 630,91942 Nashville-Davidson--Murfreesboro--Franklin, TN 0.525 1,670,89043 Tulsa, OK 0.517 937,47844 Winston-Salem, NC 0.512 640,595
Notes: Data are from Edward Glaeser and Jacob Vigdor's “The End of the Segregated Century: Racial Separation in America’s Neighborhoods, 1890-2010.” Mannhattan Institute Civic Report, January 2012.
Dissimilarity Index
PopulationRank Metropolitan Area
Table 12: Segregation Across US Metro Areas, 2010 (Page 1 or 2)
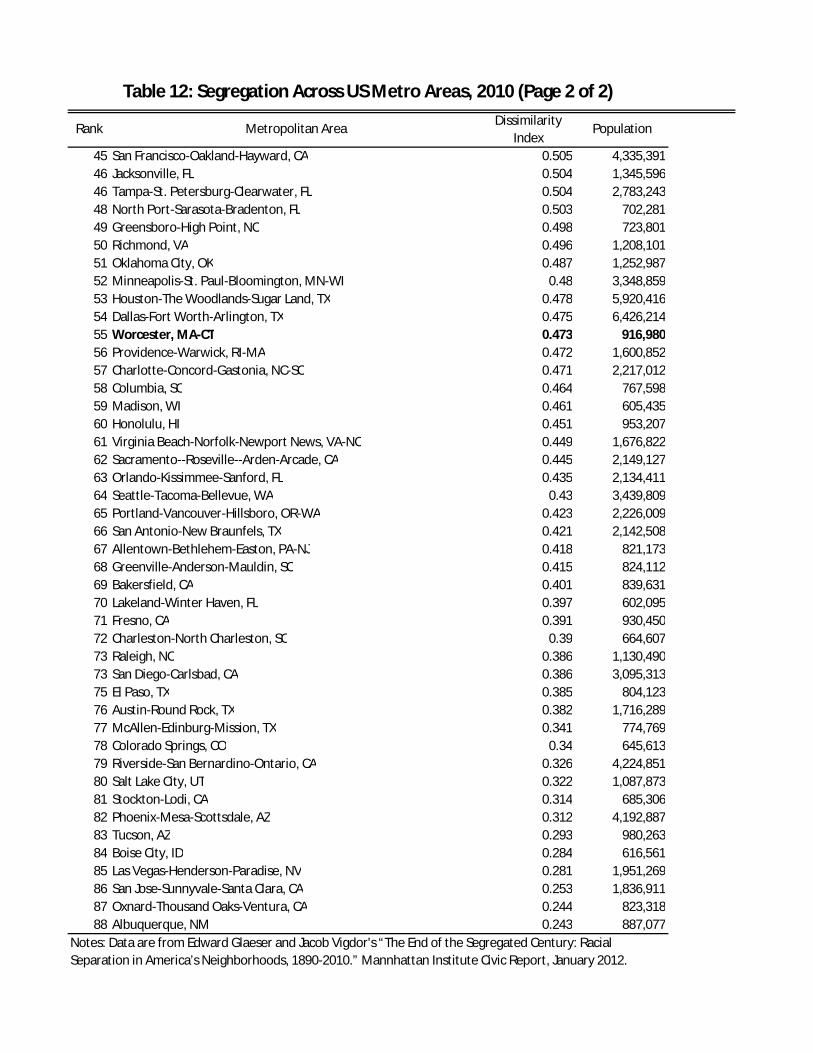
45 San Francisco-Oakland-Hayward, CA 0.505 4,335,39146 Jacksonville, FL 0.504 1,345,59646 Tampa-St. Petersburg-Clearwater, FL 0.504 2,783,24348 North Port-Sarasota-Bradenton, FL 0.503 702,28149 Greensboro-High Point, NC 0.498 723,80150 Richmond, VA 0.496 1,208,10151 Oklahoma City, OK 0.487 1,252,98752 Minneapolis-St. Paul-Bloomington, MN-WI 0.48 3,348,85953 Houston-The Woodlands-Sugar Land, TX 0.478 5,920,41654 Dallas-Fort Worth-Arlington, TX 0.475 6,426,21455 Worcester, MA-CT 0.473 916,98056 Providence-Warwick, RI-MA 0.472 1,600,85257 Charlotte-Concord-Gastonia, NC-SC 0.471 2,217,01258 Columbia, SC 0.464 767,59859 Madison, WI 0.461 605,43560 Honolulu, HI 0.451 953,20761 Virginia Beach-Norfolk-Newport News, VA-NC 0.449 1,676,82262 Sacramento--Roseville--Arden-Arcade, CA 0.445 2,149,12763 Orlando-Kissimmee-Sanford, FL 0.435 2,134,41164 Seattle-Tacoma-Bellevue, WA 0.43 3,439,80965 Portland-Vancouver-Hillsboro, OR-WA 0.423 2,226,00966 San Antonio-New Braunfels, TX 0.421 2,142,50867 Allentown-Bethlehem-Easton, PA-NJ 0.418 821,17368 Greenville-Anderson-Mauldin, SC 0.415 824,11269 Bakersfield, CA 0.401 839,63170 Lakeland-Winter Haven, FL 0.397 602,09571 Fresno, CA 0.391 930,45072 Charleston-North Charleston, SC 0.39 664,60773 Raleigh, NC 0.386 1,130,49073 San Diego-Carlsbad, CA 0.386 3,095,31375 El Paso, TX 0.385 804,12376 Austin-Round Rock, TX 0.382 1,716,28977 McAllen-Edinburg-Mission, TX 0.341 774,76978 Colorado Springs, CO 0.34 645,61379 Riverside-San Bernardino-Ontario, CA 0.326 4,224,85180 Salt Lake City, UT 0.322 1,087,87381 Stockton-Lodi, CA 0.314 685,30682 Phoenix-Mesa-Scottsdale, AZ 0.312 4,192,88783 Tucson, AZ 0.293 980,26384 Boise City, ID 0.284 616,56185 Las Vegas-Henderson-Paradise, NV 0.281 1,951,26986 San Jose-Sunnyvale-Santa Clara, CA 0.253 1,836,91187 Oxnard-Thousand Oaks-Ventura, CA 0.244 823,31888 Albuquerque, NM 0.243 887,077
Table 12: Segregation Across US Metro Areas, 2010 (Page 2 of 2)
Notes: Data are from Edward Glaeser and Jacob Vigdor's “The End of the Segregated Century: Racial Separation in America’s Neighborhoods, 1890-2010.” Mannhattan Institute Civic Report, January 2012.
Dissimilarity Index
PopulationRank Metropolitan Area
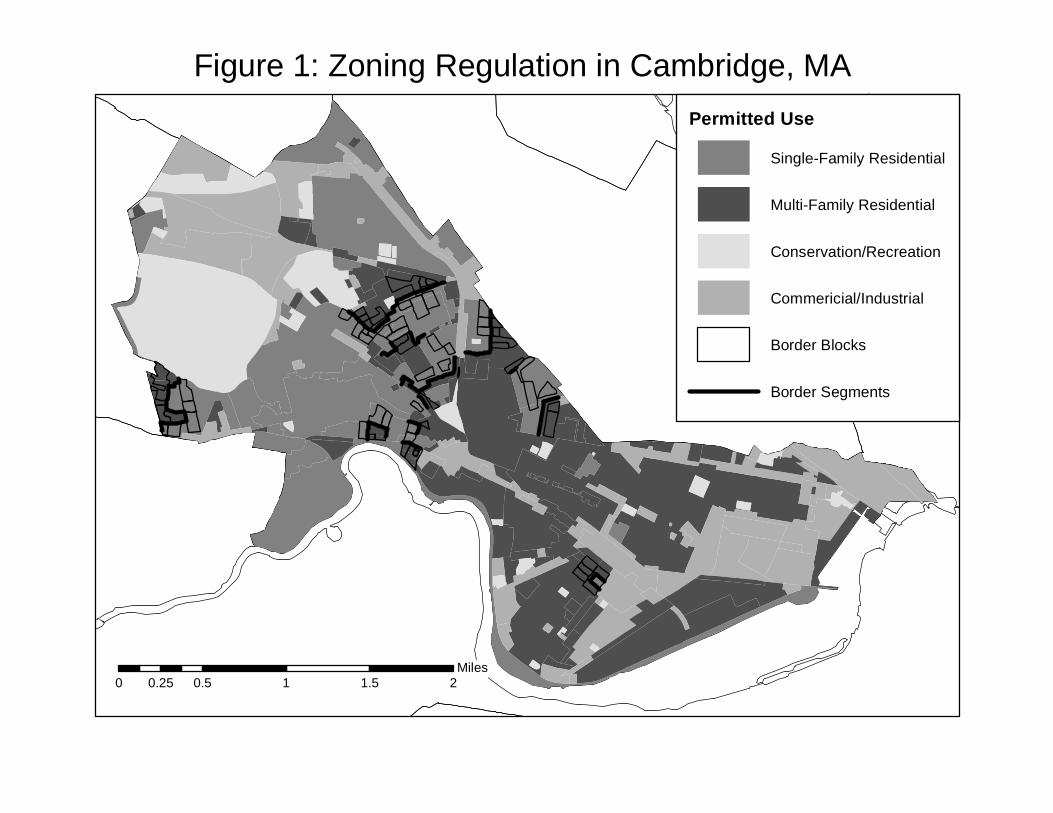
Figure 1: Zoning Regulation in Cambridge, MA
0 0.5 1 1.5 20.25Miles
Permitted Use
Single-Family Residential
Multi-Family Residential
Conservation/Recreation
Commericial/Industrial
Border Blocks
Border Segments

Figure 2: Percent Black by Census Block in Cambridge, MA
0 0.5 1 1.5 20.25Miles
Percent Black
0% - 5%
5% - 10%
10% - 25%
25% - 50%
50% - 100%
Border Blocks
Border Segments