Embed Size (px)
Citation preview

How higher energy-efficiency can lead to lower productivity and higher operating costs
Kevin Loucks, P.Eng., CEM National Business Development Manager – Power Quality Schneider Electric
PowerLogic Users Group Conference 2014 – Toronto, ON Friday October 17th, 2014
THE IMPACT OF POOR POWER QUALITY

2
Agenda
Understanding the root of Power Quality Problems
Common types of Power Quality problems and business impact
Problem solving methodology
Solutions to Power Quality problems

UNDERSTANDING THE ROOT
OF POWER QUALITY
PROBLEMS
3

4
INTRODUCTION
Understanding the root of Power Quality problems Our Electrical Power System is a complex system of generating stations and
loads Our Electrical Power System (also known as the grid) was designed to
provide smooth power through three phase Alternating Current (AC)
Three-phase Hydraulic system The torque is constant throughout the
rotation of the crankshaft if the flow is “balanced” and “smooth” in all three phases Loads which consume in an unsmooth way
introduce jerky flow and pressure
Single-phase Hydraulic system The torque is not constant throughout
the rotation of the crankshaft

Linear Load Non-Linear Load
Understanding the root of Power Quality problems
v i
6
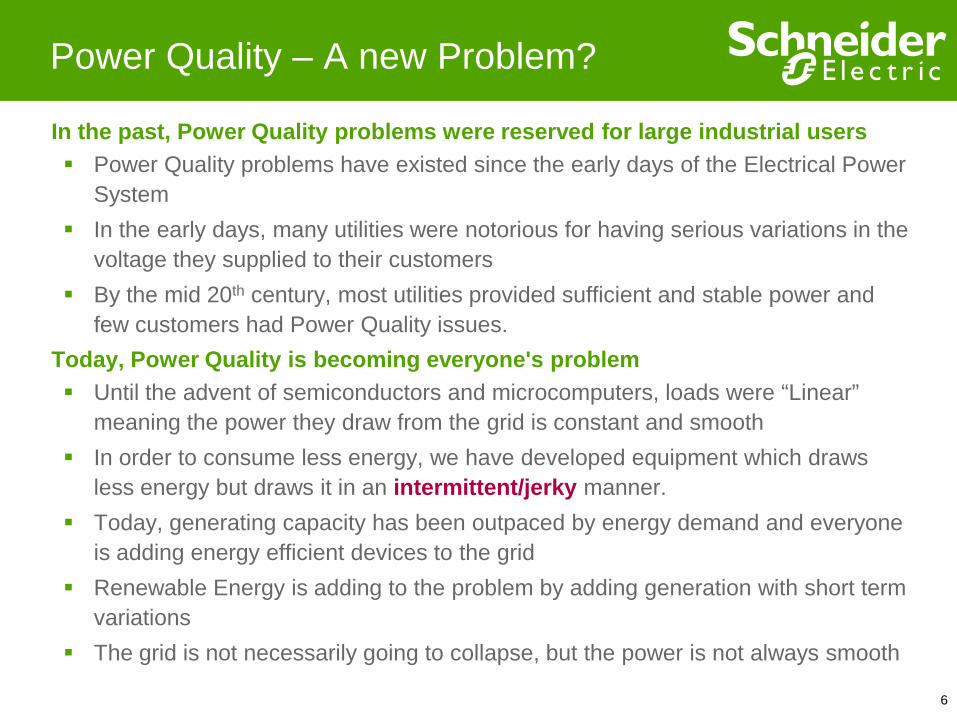
Power Quality – A new Problem?
In the past, Power Quality problems were reserved for large industrial users Power Quality problems have existed since the early days of the Electrical Power
System In the early days, many utilities were notorious for having serious variations in the
voltage they supplied to their customers By the mid 20th century, most utilities provided sufficient and stable power and
few customers had Power Quality issues. Today, Power Quality is becoming everyone's problem Until the advent of semiconductors and microcomputers, loads were “Linear”
meaning the power they draw from the grid is constant and smooth In order to consume less energy, we have developed equipment which draws
less energy but draws it in an intermittent/jerky manner. Today, generating capacity has been outpaced by energy demand and everyone
is adding energy efficient devices to the grid Renewable Energy is adding to the problem by adding generation with short term
variations The grid is not necessarily going to collapse, but the power is not always smooth
7
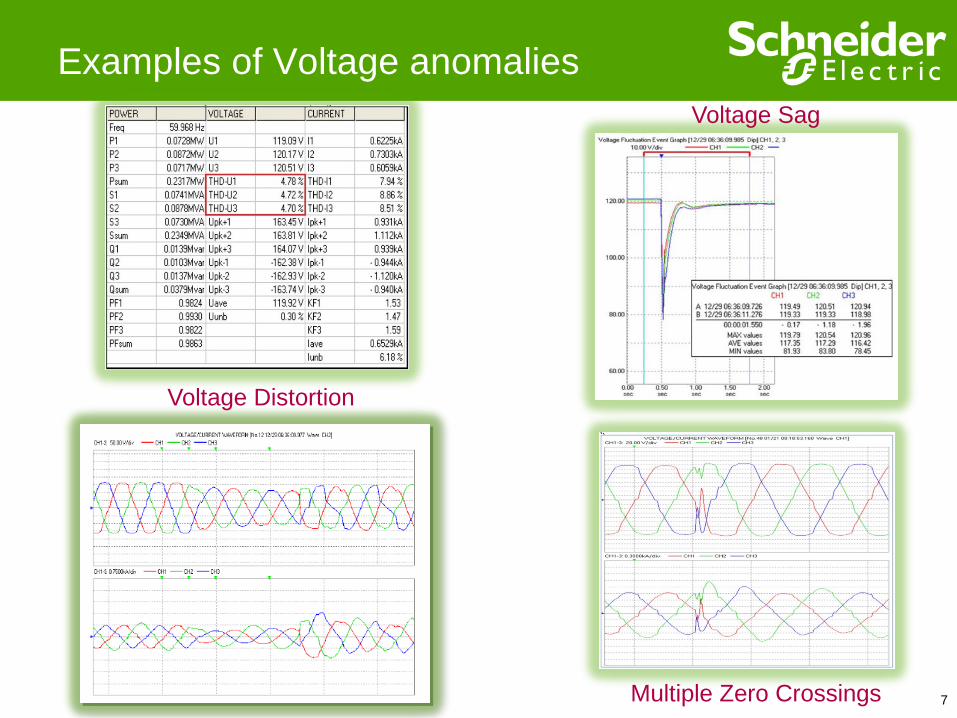
Examples of Voltage anomalies
Voltage Distortion
Multiple Zero Crossings
Voltage Sag
8
Power Quality can be maintained and improved
Thanks to technological innovation, a solution to most Power Quality problems has been developed

COMMON TYPES OF POWER
QUALITY PROBLEMS AND
BUSINESS IMPACT
9

10
The ideal voltage supply does not exist
-1.5
-1
-0.5
0
0.5
1
1.5
0 5 10 15 20 25
-1.5
-1
-0.5
0
0.5
1
1.5
0 5 10 15 20 25
-1.5
-1
-0.5
0
0.5
1
1.5
0 5 10 15 20 25
Phase unbalance
Harmonics
Sags/swells Overvoltage
notches
Transient (Spike)
3-phase balanced
-1.5
-1
-0.5
0
0.5
1
1.5
0 5 10 15 20 25 30 35 40 45 50 Flicker
-1.5
-1
-0.5
0
0.5
1
1.5
0 5 10 15 20 25 30 35 40 45 50
Blackout
-1.5
-1
-0.5
0
0.5
1
1.5
0 5 10 15 20 25 30 35 40 45 50 Power Factor
Noise
11
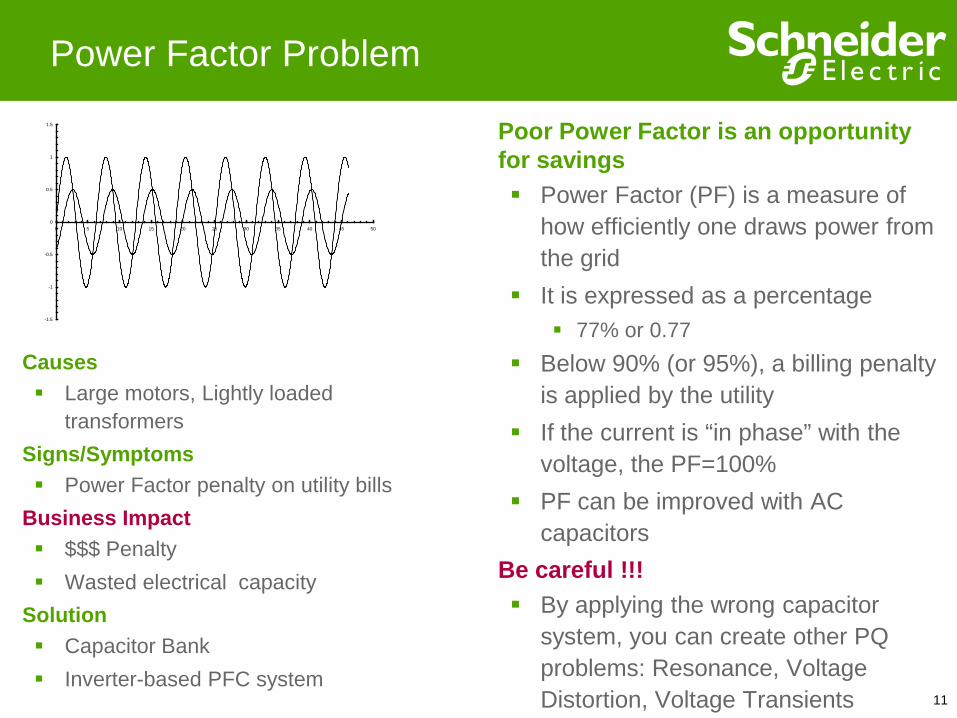
Power Factor Problem
Poor Power Factor is an opportunity for savings Power Factor (PF) is a measure of
how efficiently one draws power from the grid
It is expressed as a percentage 77% or 0.77
Below 90% (or 95%), a billing penalty is applied by the utility
If the current is “in phase” with the voltage, the PF=100%
PF can be improved with AC capacitors
Be careful !!! By applying the wrong capacitor
system, you can create other PQ problems: Resonance, Voltage Distortion, Voltage Transients
-1.5
-1
-0.5
0
0.5
1
1.5
0 5 10 15 20 25 30 35 40 45 50
Causes Large motors, Lightly loaded
transformers Signs/Symptoms Power Factor penalty on utility bills
Business Impact $$$ Penalty Wasted electrical capacity
Solution Capacitor Bank Inverter-based PFC system

12
Harmonic Distortion Problem
Harmonic Distortion can affect current and voltage Harmonic Distortion exists because
the waveform contains higher order frequencies (multiples of the 60Hz fundamental or “harmonics”)
Harmonic Distortion is the most common Power Quality problem today, excluding poor PF
In the context of Electrical Power Systems, Harmonic Distortion is usually separated into:
1. Current Distortion 2. Voltage Distortion
13
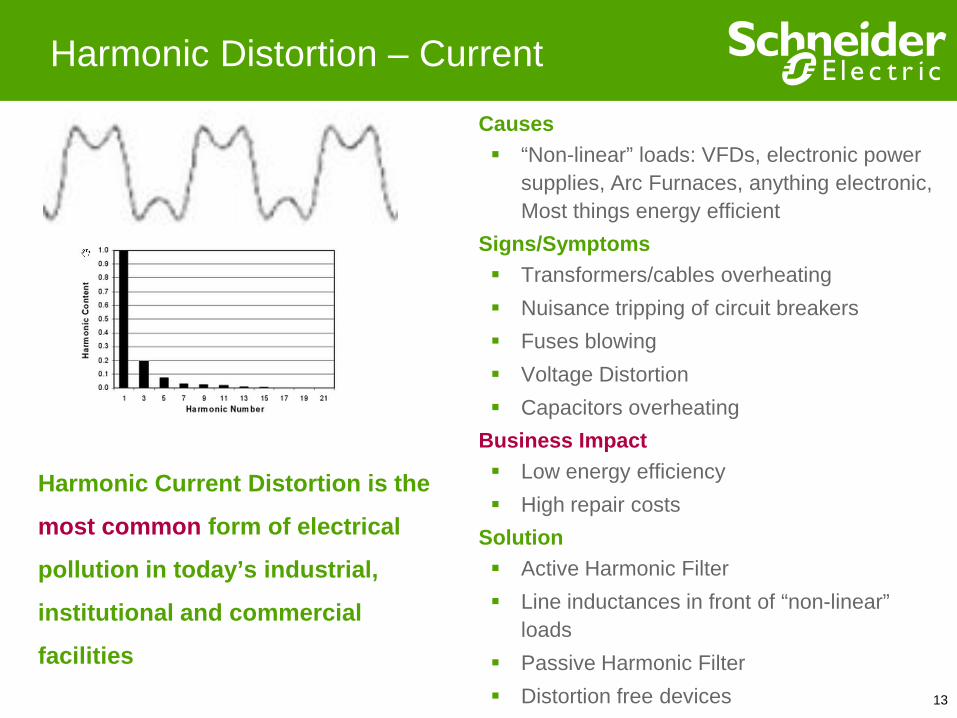
Harmonic Distortion – Current
Harmonic Current Distortion is the
most common form of electrical
pollution in today’s industrial,
institutional and commercial
facilities
Causes “Non-linear” loads: VFDs, electronic power
supplies, Arc Furnaces, anything electronic, Most things energy efficient
Signs/Symptoms Transformers/cables overheating Nuisance tripping of circuit breakers Fuses blowing Voltage Distortion Capacitors overheating
Business Impact Low energy efficiency High repair costs
Solution Active Harmonic Filter Line inductances in front of “non-linear”
loads Passive Harmonic Filter Distortion free devices

Inverter Converter
DC bus
M
A B C
Waveform of a 6-Pulse VFD w/o Line Reactor – 90% Current Distortion
15
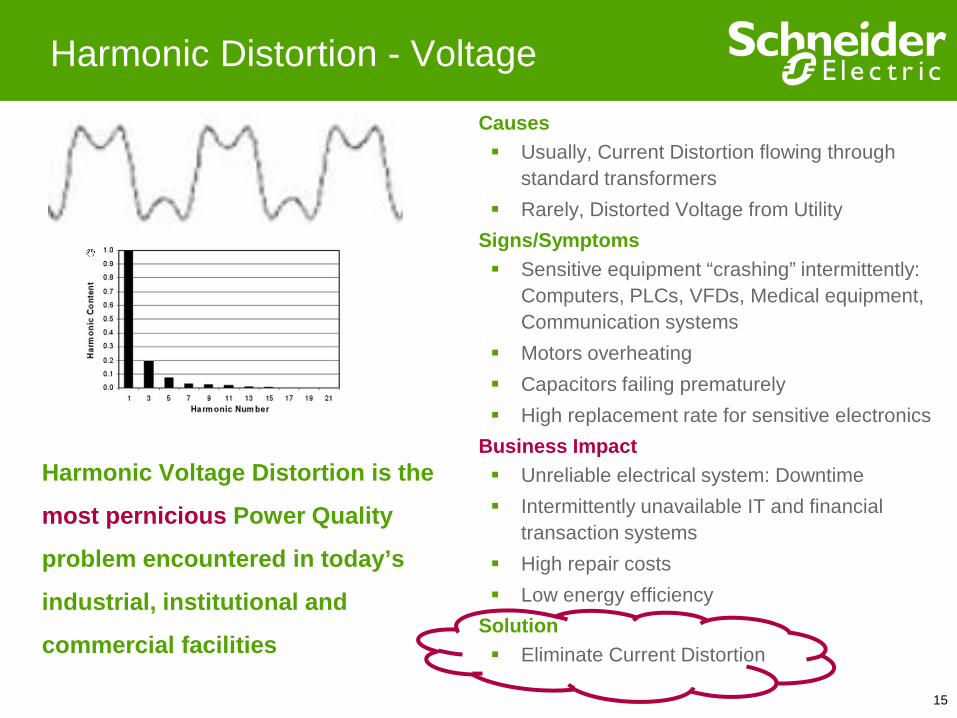
Harmonic Distortion - Voltage
Harmonic Voltage Distortion is the
most pernicious Power Quality
problem encountered in today’s
industrial, institutional and
commercial facilities
Causes Usually, Current Distortion flowing through
standard transformers Rarely, Distorted Voltage from Utility
Signs/Symptoms Sensitive equipment “crashing” intermittently:
Computers, PLCs, VFDs, Medical equipment, Communication systems
Motors overheating Capacitors failing prematurely High replacement rate for sensitive electronics
Business Impact Unreliable electrical system: Downtime Intermittently unavailable IT and financial
transaction systems High repair costs Low energy efficiency
Solution Eliminate Current Distortion

16
Sags / Swells
Voltage sags (also referred to as “dips”) are temporary reductions in voltage typically lasting from a half cycle to several seconds. If they are “mild” and prolonged they will be called “Undervoltage” Voltage swells are temporary increases in voltage typically lasting from a half cycle to several seconds
Causes Sags result from high currents, typically due to
faults or starting motors, interacting with system impedances on the Utility Grid
Swells are commonly caused by the de-energizing of large loads or asymmetrical faults on the Utility Grid
Signs/Symptoms Sags: Sensitive electronic/electrical equipment
shuts off Swells: Insulation breakdown in sensitive
electronic equipment; High replacement rate Business Impact Unreliable electrical system: Downtime Intermittently unavailable IT and financial
transaction systems High repair costs Low energy efficiency
Solution Voltage Regulator or SagFighter applied in
series with the load
-1.5
-1
-0.5
0
0.5
1
1.5
0 5 10 15 20 25 30 35 40 45 50
17
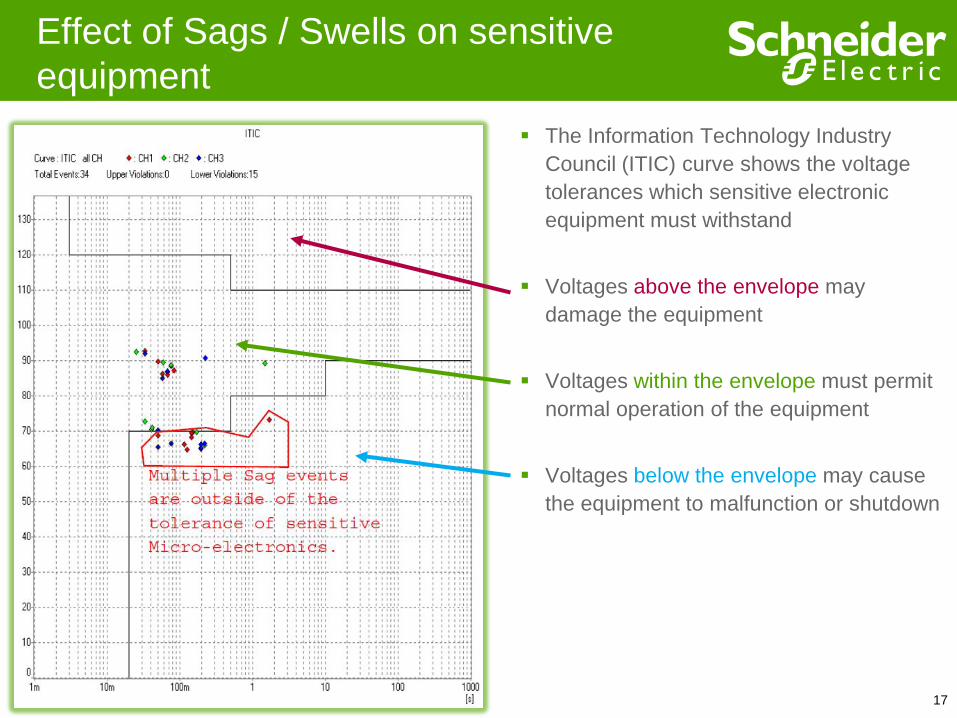
Effect of Sags / Swells on sensitive equipment
The Information Technology Industry Council (ITIC) curve shows the voltage tolerances which sensitive electronic equipment must withstand
Voltages above the envelope may damage the equipment
Voltages within the envelope must permit normal operation of the equipment
Voltages below the envelope may cause the equipment to malfunction or shutdown

PROBLEM SOLVING
METHODOLOGY
18

19
Power Quality solving methodology
Existing facilities Power Quality Audits conducted by a REMOTE Power Quality Team utilizing
Permanent meters are the ideal solution because the customer has Quick access to the highest level of Power Quality professionals with no travel costs
If necessary, temporary Power Monitoring equipment will be installed in strategic locations to gather Power Quality and Energy consumption data
New construction Modeling tools are used instead of Power Quality measurements
In both cases the methodology is the same:
1. Identify the source of the problems 2. Quantify the criticality of the problems and financial impact to the customer’s business 3. Provide Power Quality Report and recommend one or more solutions to the problems 4. Solve the problem(s) with the appropriate solutions/products

20
Power Quality solving methodology
SOLUTIONS TO POWER
QUALITY PROBLEMS
21
22
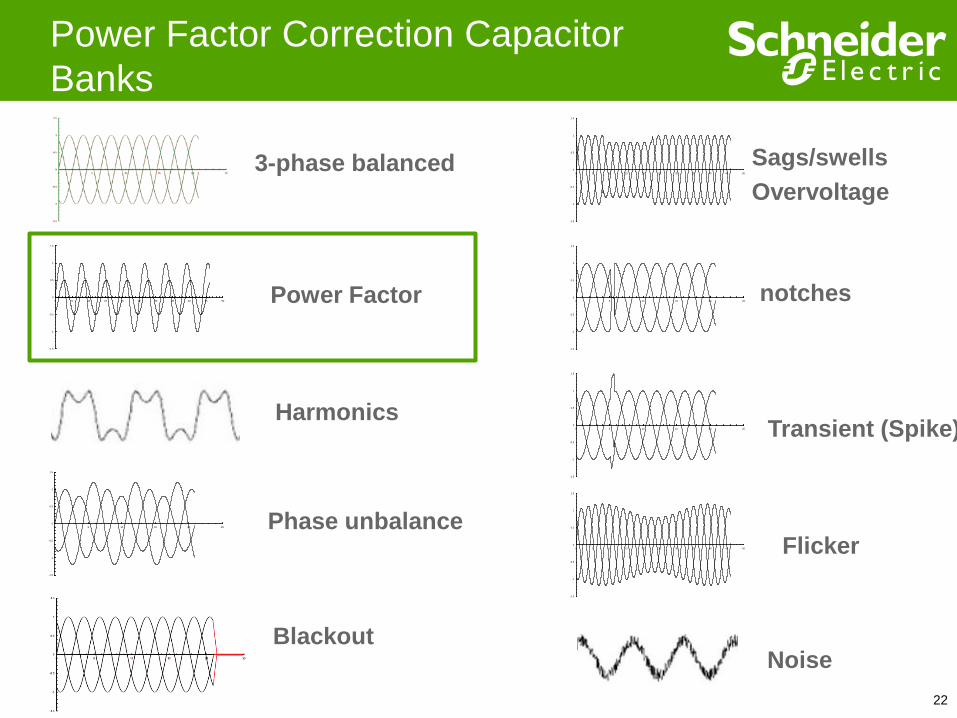
Power Factor Correction Capacitor Banks
-1.5
-1
-0.5
0
0.5
1
1.5
0 5 10 15 20 25
-1.5
-1
-0.5
0
0.5
1
1.5
0 5 10 15 20 25
-1.5
-1
-0.5
0
0.5
1
1.5
0 5 10 15 20 25
Phase unbalance
Harmonics
Sags/swells Overvoltage
notches
Transient (Spike)
3-phase balanced
-1.5
-1
-0.5
0
0.5
1
1.5
0 5 10 15 20 25 30 35 40 45 50 Flicker
-1.5
-1
-0.5
0
0.5
1
1.5
0 5 10 15 20 25 30 35 40 45 50
Blackout
-1.5
-1
-0.5
0
0.5
1
1.5
0 5 10 15 20 25 30 35 40 45 50 Power Factor
Noise
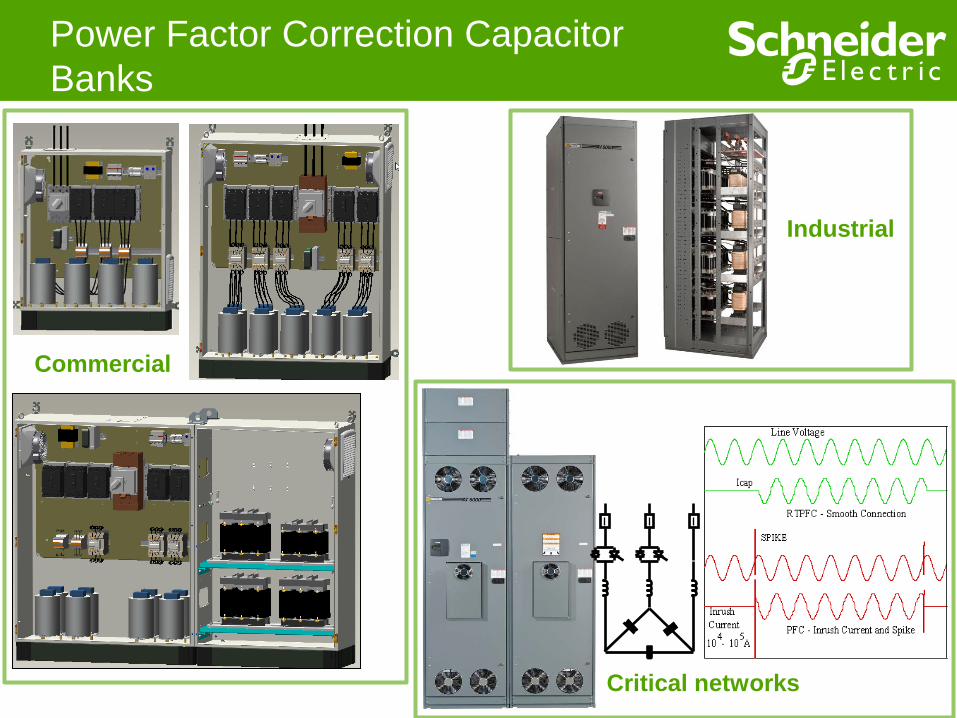
Power Factor Correction Capacitor Banks
Commercial
Industrial
Critical networks
24
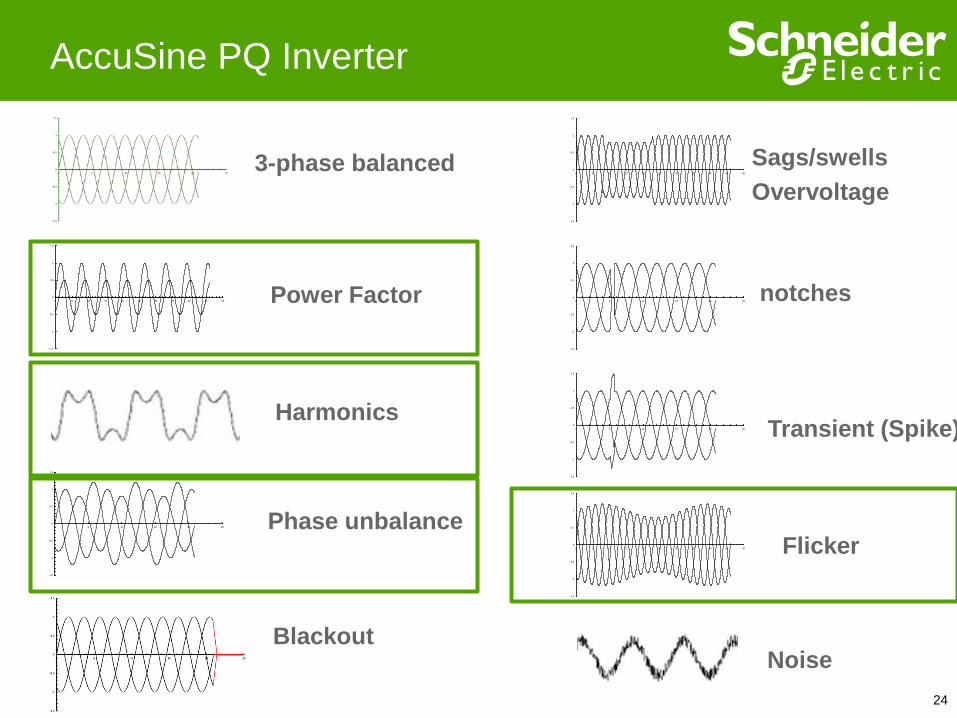
AccuSine PQ Inverter
-1.5
-1
-0.5
0
0.5
1
1.5
0 5 10 15 20 25
-1.5
-1
-0.5
0
0.5
1
1.5
0 5 10 15 20 25
-1.5
-1
-0.5
0
0.5
1
1.5
0 5 10 15 20 25
Phase unbalance
Harmonics
Sags/swells Overvoltage
notches
Transient (Spike)
3-phase balanced
-1.5
-1
-0.5
0
0.5
1
1.5
0 5 10 15 20 25 30 35 40 45 50 Flicker
-1.5
-1
-0.5
0
0.5
1
1.5
0 5 10 15 20 25 30 35 40 45 50
Blackout
-1.5
-1
-0.5
0
0.5
1
1.5
0 5 10 15 20 25 30 35 40 45 50 Power Factor
Noise

25
AccuSine Active Harmonic Filter

26
AccuSine Active Harmonic Filter

27
AccuSine Active Harmonic Filter Performance
AS off AS on Order % I fund % I fund Fund 100.000% 100.000% 3 0.038% 0.478% 5 31.660% 0.674% 7 11.480% 0.679% 9 0.435% 0.297% 11 7.068% 0.710% 13 4.267% 0.521% 15 0.367% 0.052% 17 3.438% 0.464% 19 2.904% 0.639% 21 0.284% 0.263% 23 2.042% 0.409% 25 2.177% 0.489% 27 0.293% 0.170% 29 1.238% 0.397% 31 1.740% 0.243% 33 0.261% 0.325% 35 0.800% 0.279% 37 1.420% 0.815% 39 0.282% 0.240% 41 0.588% 0.120% 43 1.281% 0.337% 45 0.259% 0.347% 47 0.427% 0.769% 49 1.348% 0.590% % THD(I) 35.28% 2.67%

28
Voltage Regulator and SagFighter
-1.5
-1
-0.5
0
0.5
1
1.5
0 5 10 15 20 25
-1.5
-1
-0.5
0
0.5
1
1.5
0 5 10 15 20 25
-1.5
-1
-0.5
0
0.5
1
1.5
0 5 10 15 20 25
Phase unbalance
Harmonics
Sags/swells Overvoltage
notches
Transient (Spike)
3-phase balanced
-1.5
-1
-0.5
0
0.5
1
1.5
0 5 10 15 20 25 30 35 40 45 50 Flicker
-1.5
-1
-0.5
0
0.5
1
1.5
0 5 10 15 20 25 30 35 40 45 50
Blackout
-1.5
-1
-0.5
0
0.5
1
1.5
0 5 10 15 20 25 30 35 40 45 50 Power Factor
Noise

Voltage Regulator
External: Line Drops & Brownouts
Brownout – intentional reduction in grid voltage
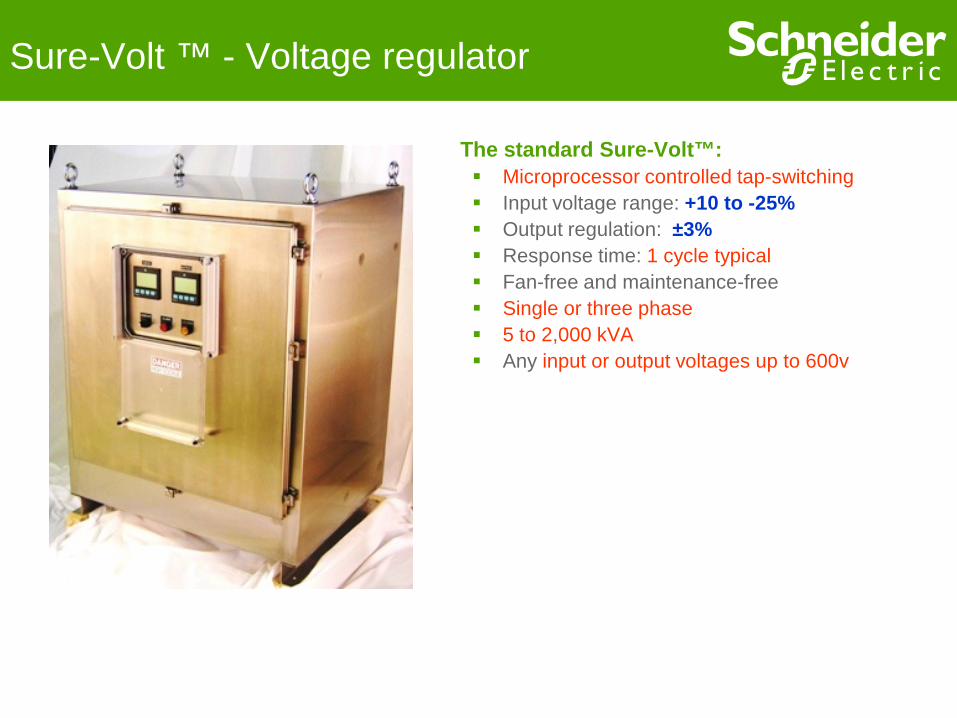
The standard Sure-Volt™: Microprocessor controlled tap-switching Input voltage range: +10 to -25% Output regulation: ±3% Response time: 1 cycle typical Fan-free and maintenance-free Single or three phase 5 to 2,000 kVA Any input or output voltages up to 600v
Sure-Volt ™ - Voltage regulator

Single Phase Sags
Three Phase Sags
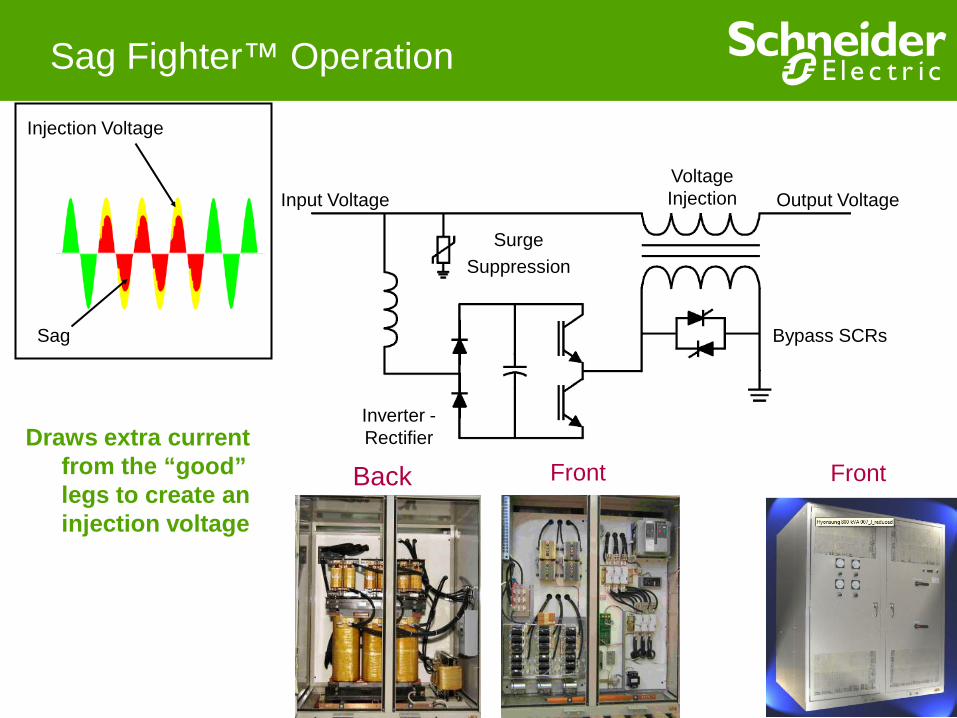
Sag Fighter™ Operation
Draws extra current
from the “good” legs to create an injection voltage
Input Voltage Output Voltage
Surge Suppression
Bypass SCRs
Voltage Injection
Inverter - Rectifier
Sag
Injection Voltage
Front Back Front

ONE FINAL WORD….
33

34
Charlatan
Beware of those who claim their box can solve all your Power Quality
problems

THANK YOU
35