Embed Size (px)
Citation preview
The Impact of Remittances on Central Bank
Balance Sheets and Inflation in Nepal1,2
Nephil Matangi Maskay, Ph.D.3
Sven Steinkamp, Ph.D.4
Frank Westermann, Ph.D.5
Abstract Starting from a set of stylized central bank balance sheets, we analyze how central bank policies
influence the inflationary impact of remittances. We also estimate the impact of remittances on
inflation empirically, using a Vectorautoregression (VAR) framework and a quarterly data set
from Nepal. We find this impact to be positive, even after controlling for inflation from India. The
domestic monetary base, on the other hand, has lost significance as an independent factor for
inflation in the latest 10 years of our sample period. This evidence is consistent with the
"impossible trinity" hypothesis. In the conclusions we discuss policy options to accommodate large
remittances inflows.
Key Words: Remittances, Inflation, Trilemma hypothesis
JEL Classification: E52, F24, F42, O53
1 The paper reflects the personal view of the authors and not the official views of the Nepal
Rastra Bank or other affiliated institutions. 2 The paper was written partly during the research visit of Nephil Matangi Maskay at
Osnabrueck University. We gratefully acknowledge financial support from the Dutsche
Bundesbank, Regional Office in Bremen, Lower Saxony and Saxony Anhalt. We also thank
Andres Steiner, as well as seminar participants at Heidelberg University, Germany, and the 2nd
International Conference on Economics and Finance organised by the Nepal Rastra Bank in
Kathmandu for helpful suggestions.
3 Nepal Rastra Bank, Central Office, Baluwatar, Kathmandu, Nepal, E-mail:
4 Institute of Empirical Economic Research, Osnabrück University, Rolandstraße 8, 49069
Osnabrück, Germany, E-mail: [email protected]
5 Corresponding Author, Institute of Empirical Economic Research, Osnabrück University,
Rolandstraße 8, 49069 Osnabrück, Germany, E-mail: [email protected],
2 NRB Economic Review
I. INTRODUCTION
The impact of remittances on inflation and welfare is a topic of high importance for a
country like Nepal, which receives remittances of over 25% relative to the GDP per year.
The general impression of several observers is that the remittances in the current form are
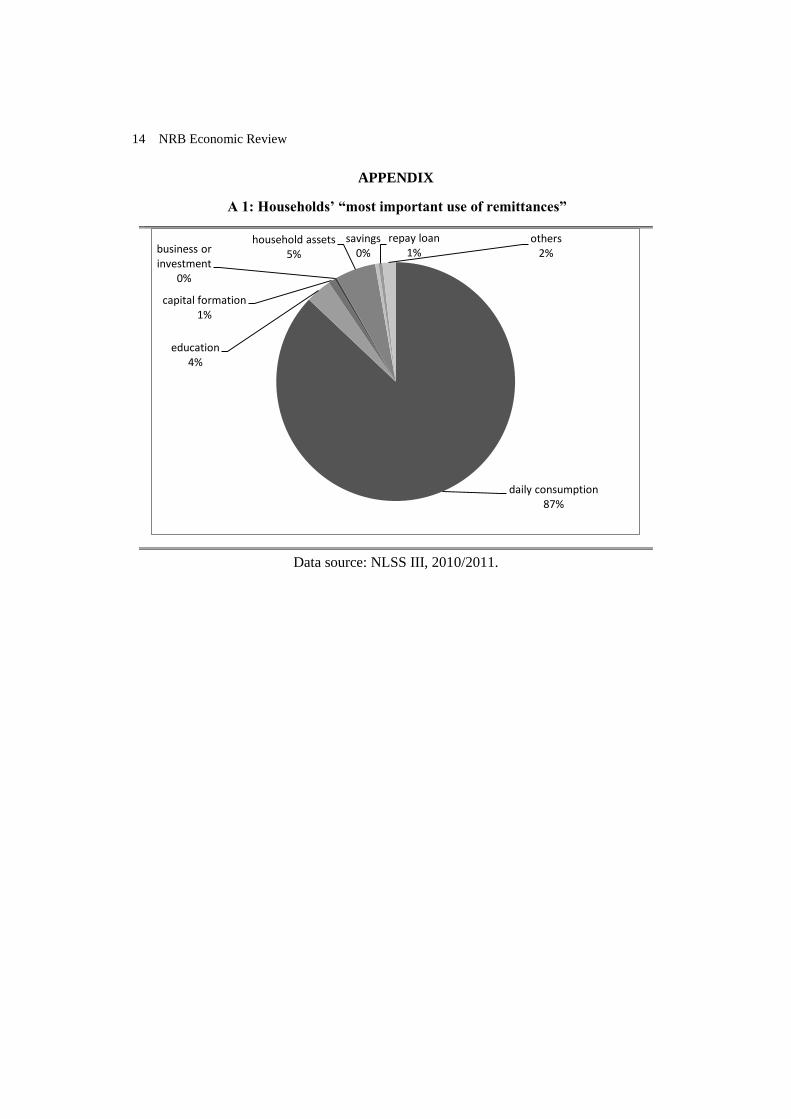
underutilized in Nepal. Primarily, this is because the lion's share of these inflows is used
for the purpose of daily consumption, rather than savings, education, or investment. Thus,
it does not appear to facilitate the buildup of a domestic capital stock that could help to
increase domestic per capita income in the long run (see the first Appendix (A 1), which
displays data from the Nepal Living Standards Survey (NLSS) 2010/2011).6
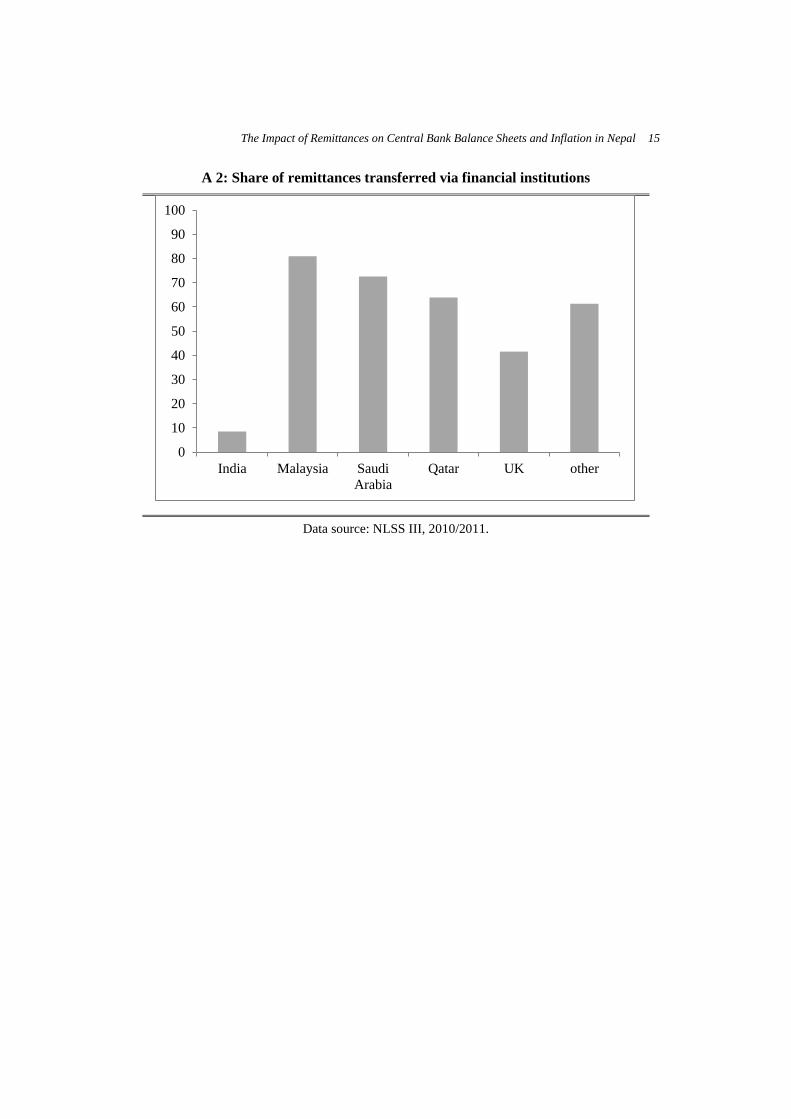
Furthermore, despite the efforts to promote the use of official channels, when sending the
money back home, the share of remittances transferred via the banking system is
considered to be below its potential (Pant 2011 and SAARC 2014). The second Appendix
(A 2) illustrates this for the key countries from which remittances are being sent to Nepal:
India clearly has the lowest share with close to 10%. The UK still has a value below 50%,
and other important countries, Malaysia, Saudi Arabia, and Qatar, vary between 60% and
80%.
In this paper, we aim to shed light on these two observations by analyzing possible
responses of the central bank to large remittance inflows, and by investigating the
resulting impact on domestic inflation. In the first part of the paper, we analyze the
hypothetical impact of remittances on stylized central bank balance sheets under different
exchange rate regimes. We argue that an economy with a mostly closed capital account
has difficulties in absorbing large amounts of remittance inflows, and illustrate that some
responses of the central bank are more inflationary than others.
In the second part of the paper, we estimate a simple Vectorautoregression (VAR) model
to illustrate the inflationary pressure that is created by large remittance inflows. We find
that in the full sample, inflation in Nepal primarily responds to inflation in India. 7
There
is also a partial effect of changes in the monetary base on inflation. However, this
observation is largely driven by the early part of the sample period. In a second VAR that
only includes data from the past 10 years, the significant impact of the monetary base on
inflation disappears. Instead, remittances entering the country from abroad start to
become a significant determinant of inflation.
6 The effect of remittances on financial development have been documented for instance by
Aggarwal et al. (2006, 2011), Gupta et al. (2009), or Giuliano and Ruiz-Arranz (2013). See
also Maskay, Steinkamp, and Westermann (2014) for the case of Nepal. A general overview on
the impact of remittances on macro and development indicators is given in Adams (2011) and
Brown et al. (2013). 7 Nepal officially maintains a pegged exchange rate regime that commenced in 1960; however,
since February 1993, the start of the sample period, there has not been any adjustement in the
exchange rate.This finding is consistent with both the model predictions as well as empirical
findings for a set of countries from Latin America in Ball et. al (2013).
The Impact of Remittances on Central Bank Balance Sheets and Inflation in Nepal 3
These empirical findings fit to the analysis of the balance sheet data in Section 2. The
central bank of Nepal, the Nepal Rastra Bank (NRB), which maintains a rigid pegged
exchange rate regime with India,8 continuously uses the incoming FX reserves to
purchase Indian currency, which it sells to its customers. The purchase of Indian rupees
corresponds to the net trade deficit with India. Therefore, the impact of remittances on
inflation, while statistically significant, is only transitory.
Our findings also confirm the "impossible trinity" or “trilemma” hypothesis, according to
which countries cannot - at the same time - have an open capital account, a fixed
exchange rate, and independent control over monetary policy. They also support recent
studies that suggest that the degree of domestic financial development, and in particular
investment opportunities, matters for the amount of remittances sent via the domestic
banking system (Bettin et al. 2012).
It is important to point out that the decision of migrant households to spend a large
proportion of their income on daily consumption is not subject to critique. If they are the
result of preferences, there is no scope for welfare improvements by policy makers trying
to alter their decisions. However, the constraints under which their savings-consumption
decisions are made could be distorted in favor of consumption over savings. In the
conclusions, we consider various implications for welfare and policy options. For
instance, we discuss the idea that a partial liberalization of foreign currency loans to non-
traded goods sectors might facilitate the saving of remittances (in foreign currency) and
relax credit constraints as an obstacle to economic growth.
II. THE IMPACT OF REMITTANCES ON CENTRAL BANK
BALANCE SHEETS
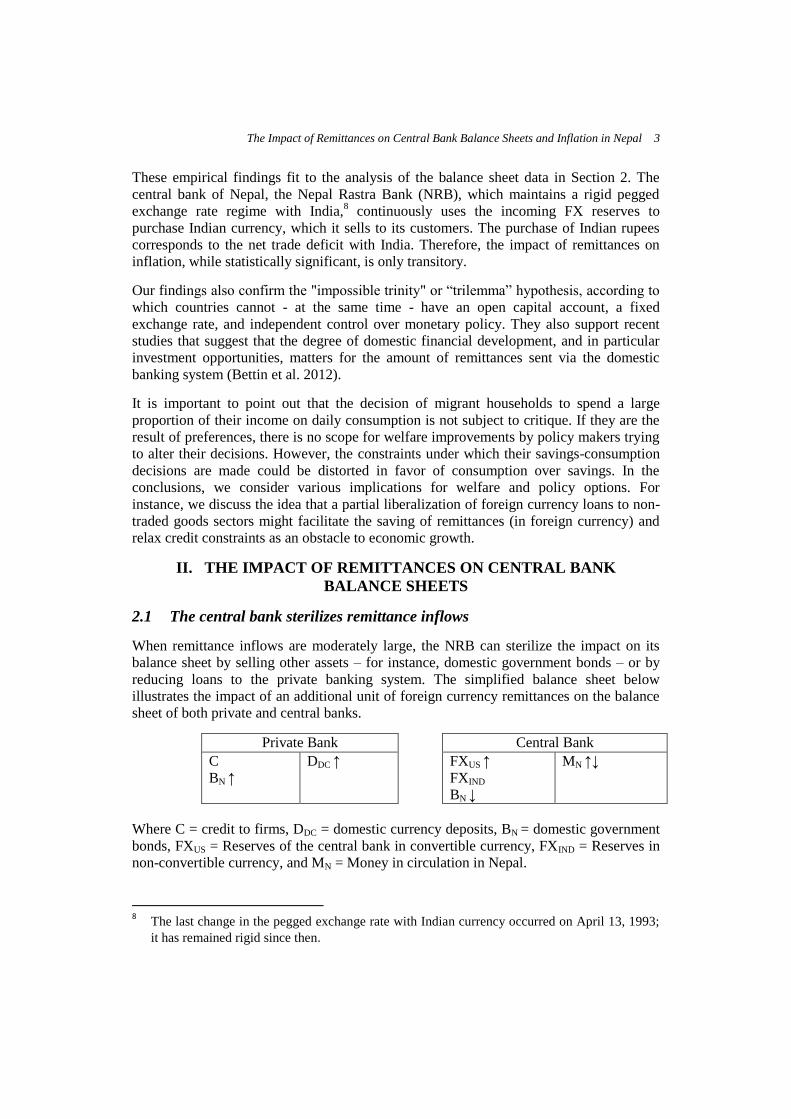
2.1 The central bank sterilizes remittance inflows
When remittance inflows are moderately large, the NRB can sterilize the impact on its
balance sheet by selling other assets – for instance, domestic government bonds – or by
reducing loans to the private banking system. The simplified balance sheet below
illustrates the impact of an additional unit of foreign currency remittances on the balance
sheet of both private and central banks.
Private Bank Central Bank
C
BN ↑
DDC ↑
FXUS ↑
FXIND
BN ↓
MN ↑↓
Where C = credit to firms, DDC = domestic currency deposits, BN = domestic government
bonds, FXUS = Reserves of the central bank in convertible currency, FXIND = Reserves in
non-convertible currency, and MN = Money in circulation in Nepal.
8 The last change in the pegged exchange rate with Indian currency occurred on April 13, 1993;
it has remained rigid since then.
4 NRB Economic Review
In the first instance, the incoming remittances raise the deposits of the private bank.
Within 15 days, the deposits are required (by NRB directive) to be converted to domestic
currency, which raises the foreign exchange holdings of the central bank as well as the
money in circulation.
However, in the next step, the central bank sells domestic government bonds to the
private bank and thus mops up the newly created liquidity. The money in circulation, as
well as the length of the central bank balance sheet, remains unchanged. The only thing
that has changed for the central bank is the composition of its assets. Also, the private
banks balance sheet has expanded.
In this scenario, the domestic price level and the equilibrium exchange rate with respect
to India remain unchanged. The central bank balance sheet can be viewed as less prone to
crisis, as it has increased its holdings of convertible reserve assets.
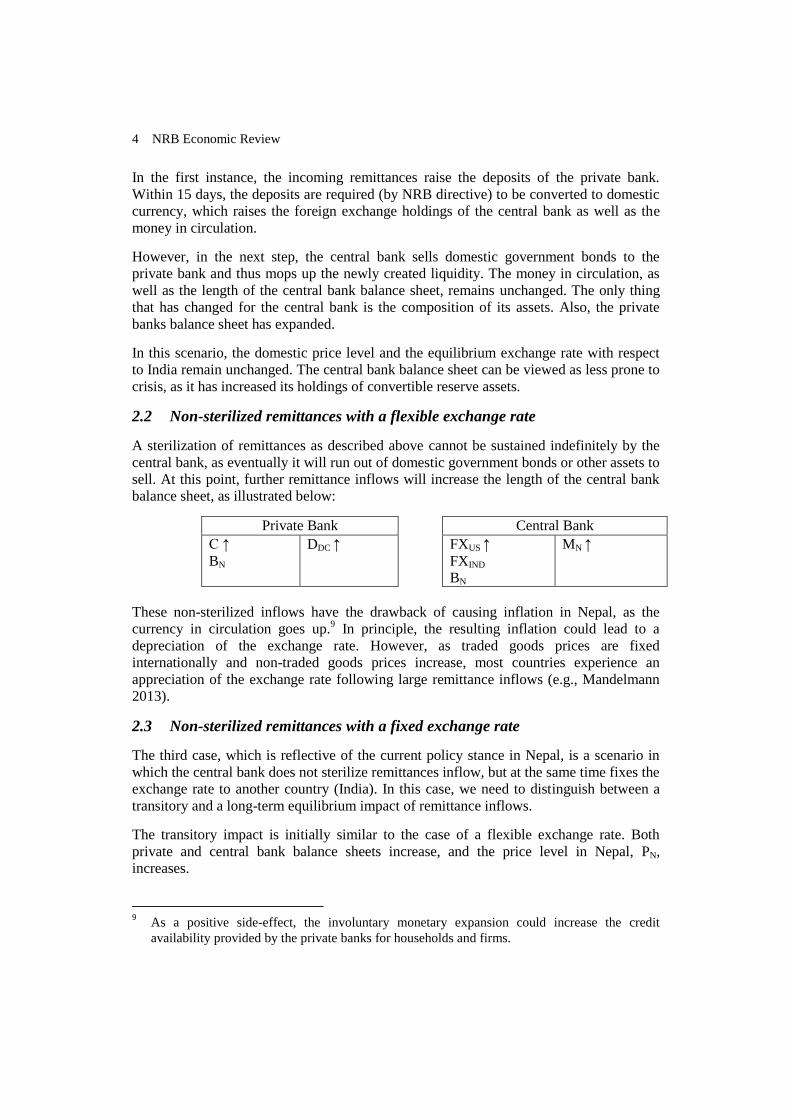
2.2 Non-sterilized remittances with a flexible exchange rate
A sterilization of remittances as described above cannot be sustained indefinitely by the
central bank, as eventually it will run out of domestic government bonds or other assets to
sell. At this point, further remittance inflows will increase the length of the central bank
balance sheet, as illustrated below:
Private Bank Central Bank
C ↑
BN
DDC ↑
FXUS ↑
FXIND
BN
MN ↑
These non-sterilized inflows have the drawback of causing inflation in Nepal, as the
currency in circulation goes up.9 In principle, the resulting inflation could lead to a
depreciation of the exchange rate. However, as traded goods prices are fixed
internationally and non-traded goods prices increase, most countries experience an
appreciation of the exchange rate following large remittance inflows (e.g., Mandelmann
2013).
2.3 Non-sterilized remittances with a fixed exchange rate
The third case, which is reflective of the current policy stance in Nepal, is a scenario in
which the central bank does not sterilize remittances inflow, but at the same time fixes the
exchange rate to another country (India). In this case, we need to distinguish between a
transitory and a long-term equilibrium impact of remittance inflows.
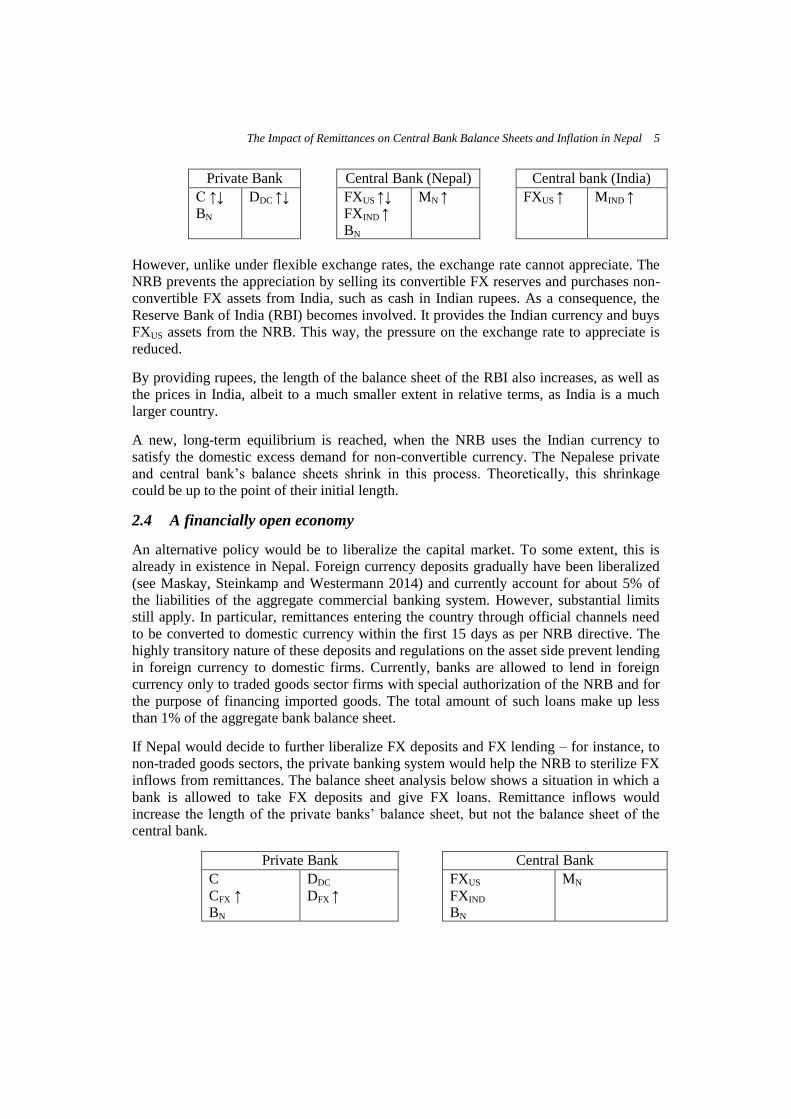
The transitory impact is initially similar to the case of a flexible exchange rate. Both
private and central bank balance sheets increase, and the price level in Nepal, PN,
increases.
9 As a positive side-effect, the involuntary monetary expansion could increase the credit
availability provided by the private banks for households and firms.
The Impact of Remittances on Central Bank Balance Sheets and Inflation in Nepal 5
Private Bank Central Bank (Nepal) Central bank (India)
C ↑↓
BN
DDC ↑↓
FXUS ↑↓
FXIND ↑
BN
MN ↑ FXUS ↑
MIND ↑
However, unlike under flexible exchange rates, the exchange rate cannot appreciate. The
NRB prevents the appreciation by selling its convertible FX reserves and purchases non-
convertible FX assets from India, such as cash in Indian rupees. As a consequence, the
Reserve Bank of India (RBI) becomes involved. It provides the Indian currency and buys
FXUS assets from the NRB. This way, the pressure on the exchange rate to appreciate is
reduced.
By providing rupees, the length of the balance sheet of the RBI also increases, as well as
the prices in India, albeit to a much smaller extent in relative terms, as India is a much
larger country.
A new, long-term equilibrium is reached, when the NRB uses the Indian currency to
satisfy the domestic excess demand for non-convertible currency. The Nepalese private
and central bank’s balance sheets shrink in this process. Theoretically, this shrinkage
could be up to the point of their initial length.
2.4 A financially open economy
An alternative policy would be to liberalize the capital market. To some extent, this is
already in existence in Nepal. Foreign currency deposits gradually have been liberalized
(see Maskay, Steinkamp and Westermann 2014) and currently account for about 5% of
the liabilities of the aggregate commercial banking system. However, substantial limits
still apply. In particular, remittances entering the country through official channels need
to be converted to domestic currency within the first 15 days as per NRB directive. The
highly transitory nature of these deposits and regulations on the asset side prevent lending
in foreign currency to domestic firms. Currently, banks are allowed to lend in foreign
currency only to traded goods sector firms with special authorization of the NRB and for
the purpose of financing imported goods. The total amount of such loans make up less
than 1% of the aggregate bank balance sheet.
If Nepal would decide to further liberalize FX deposits and FX lending – for instance, to
non-traded goods sectors, the private banking system would help the NRB to sterilize FX
inflows from remittances. The balance sheet analysis below shows a situation in which a
bank is allowed to take FX deposits and give FX loans. Remittance inflows would
increase the length of the private banks’ balance sheet, but not the balance sheet of the
central bank.
Private Bank Central Bank
C
CFX ↑
BN
DDC
DFX ↑
FXUS
FXIND
BN
MN
6 NRB Economic Review
III. EMPIRICS: THE LINK BETWEEN INFLATION, REMITTANCES
AND THE EXCHANGE RATE
The section above illustrated that remittances can have inflationary consequences for the
domestic economy, in particular when inflows are non-sterilized and the exchange rate is
flexible. While Nepal maintains a rigid pegged exchange rate vis-à-vis India, there still
could be an inflationary impact, as for a transitory period remittance inflows increase the
monetary base. In this section, we perform an empirical analysis in which we investigate
whether an increase in remittances indeed creates inflationary pressure in Nepal.
For several developing countries, earlier research also has documented that large
remittance inflows lead to a real appreciation of the currency (e.g., Ball, Lopez and Reyes
2013). The motivation is that non-tradable goods prices increase, while traded goods
prices largely are unaffected.
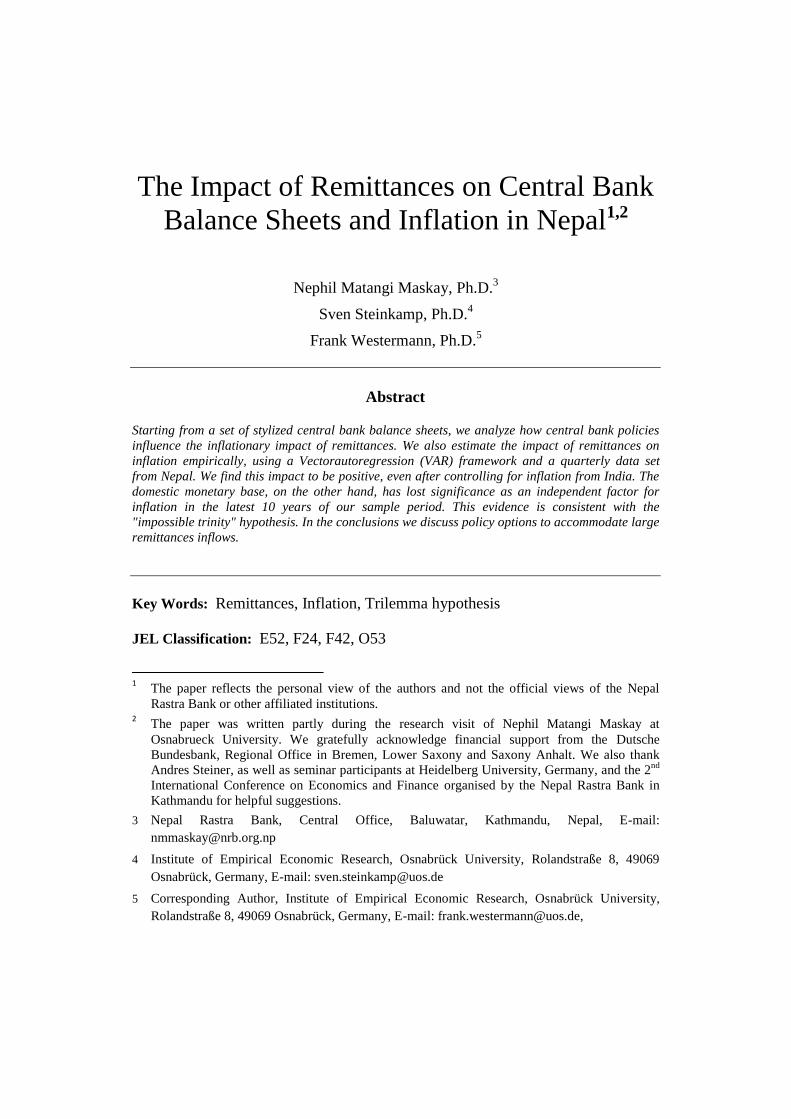
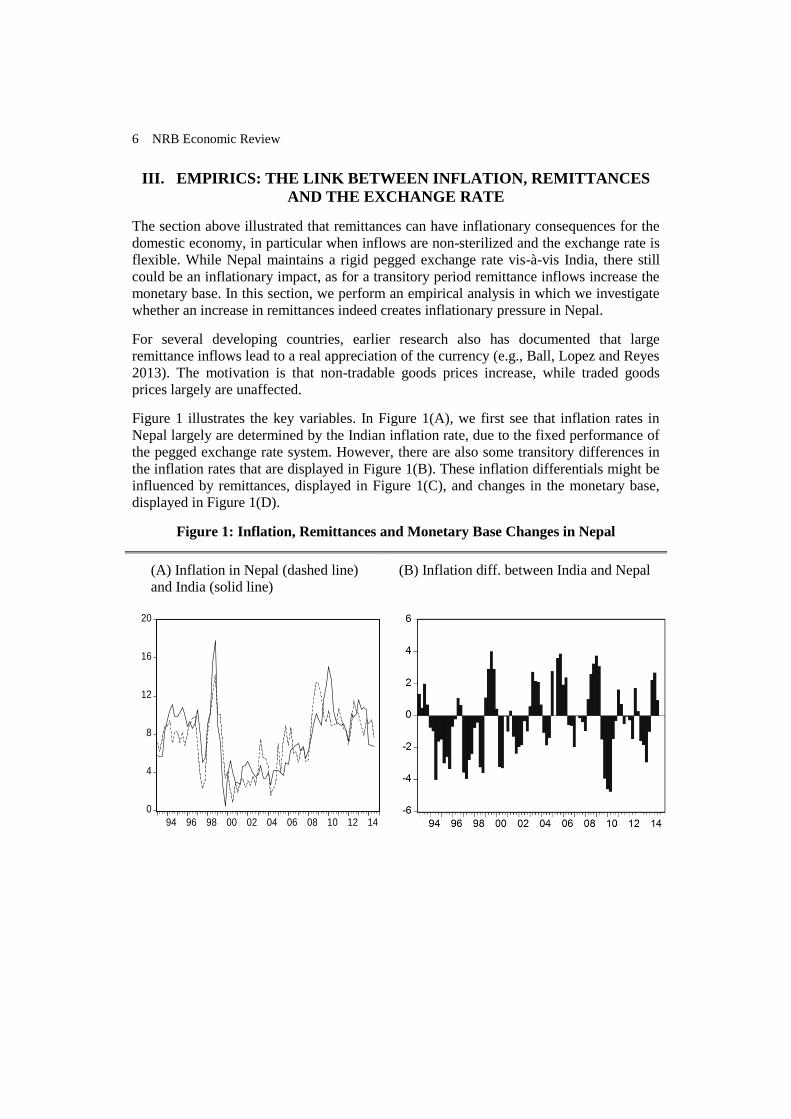
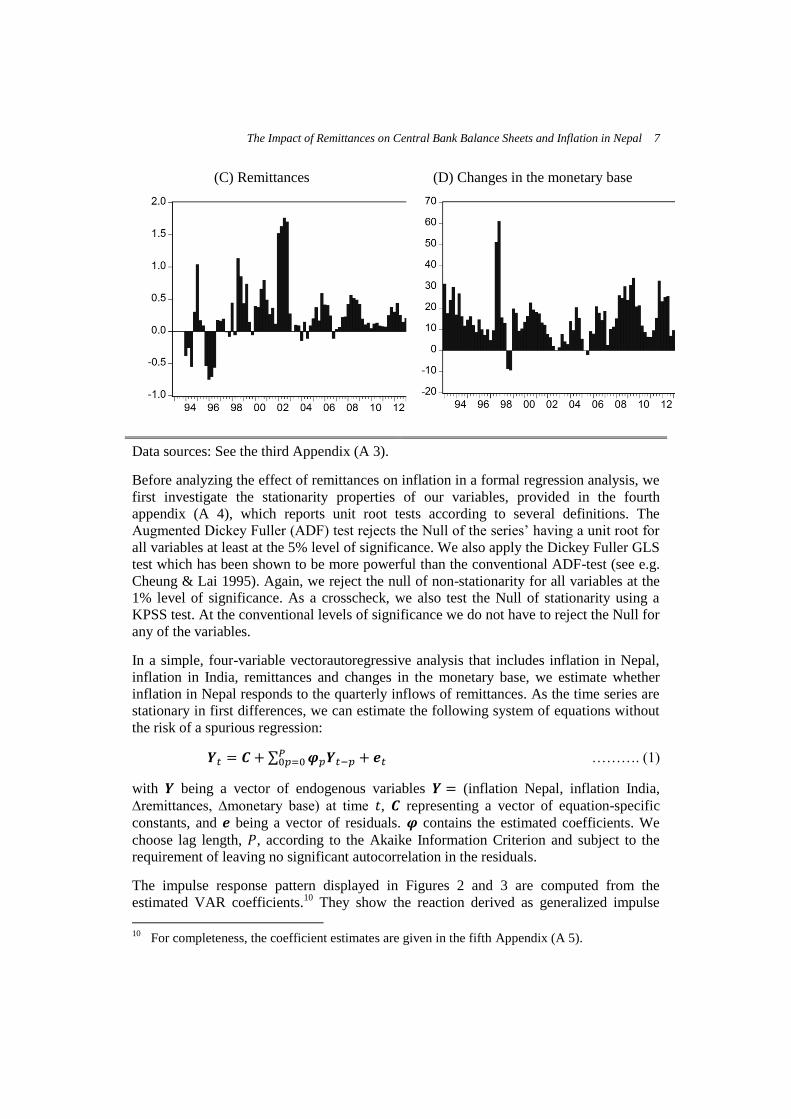
Figure 1 illustrates the key variables. In Figure 1(A), we first see that inflation rates in
Nepal largely are determined by the Indian inflation rate, due to the fixed performance of
the pegged exchange rate system. However, there are also some transitory differences in
the inflation rates that are displayed in Figure 1(B). These inflation differentials might be
influenced by remittances, displayed in Figure 1(C), and changes in the monetary base,
displayed in Figure 1(D).
Figure 1: Inflation, Remittances and Monetary Base Changes in Nepal
(A) Inflation in Nepal (dashed line)
and India (solid line)
(B) Inflation diff. between India and Nepal
0
4
8
12
16
20
94 96 98 00 02 04 06 08 10 12 14
The Impact of Remittances on Central Bank Balance Sheets and Inflation in Nepal 7
(C) Remittances
(D) Changes in the monetary base
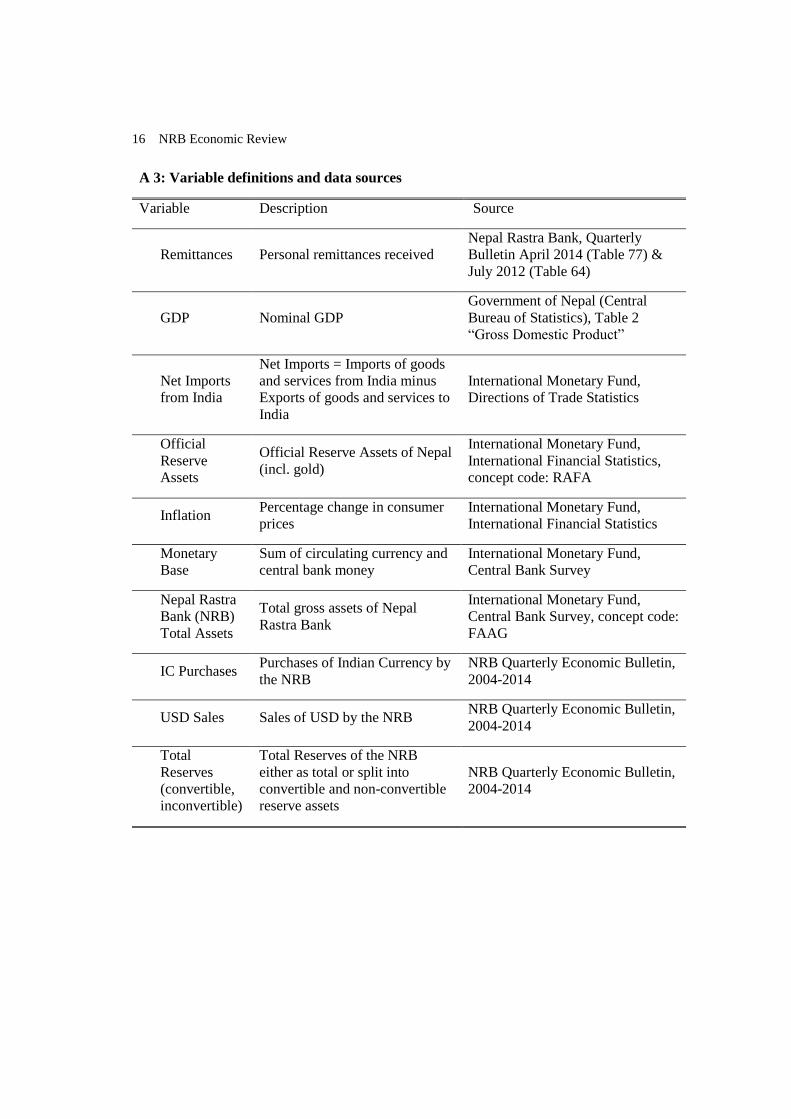
Data sources: See the third Appendix (A 3).
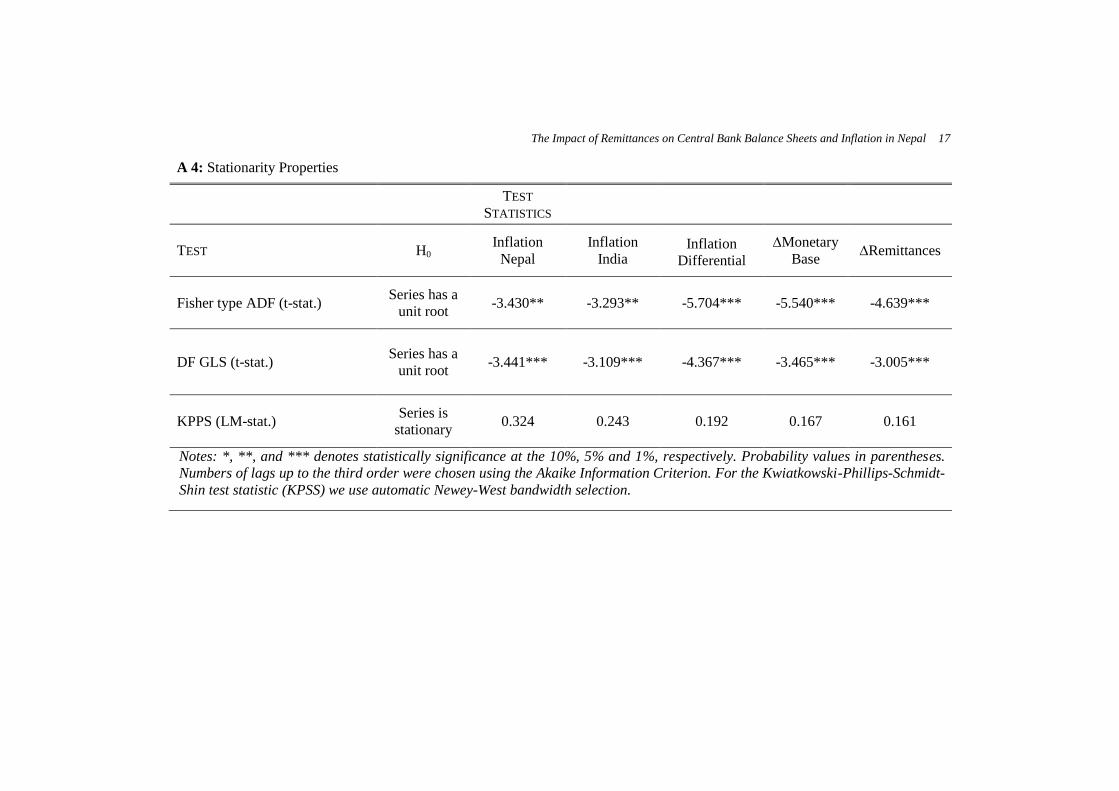
Before analyzing the effect of remittances on inflation in a formal regression analysis, we
first investigate the stationarity properties of our variables, provided in the fourth
appendix (A 4), which reports unit root tests according to several definitions. The
Augmented Dickey Fuller (ADF) test rejects the Null of the series’ having a unit root for
all variables at least at the 5% level of significance. We also apply the Dickey Fuller GLS
test which has been shown to be more powerful than the conventional ADF-test (see e.g.
Cheung & Lai 1995). Again, we reject the null of non-stationarity for all variables at the
1% level of significance. As a crosscheck, we also test the Null of stationarity using a
KPSS test. At the conventional levels of significance we do not have to reject the Null for
any of the variables.
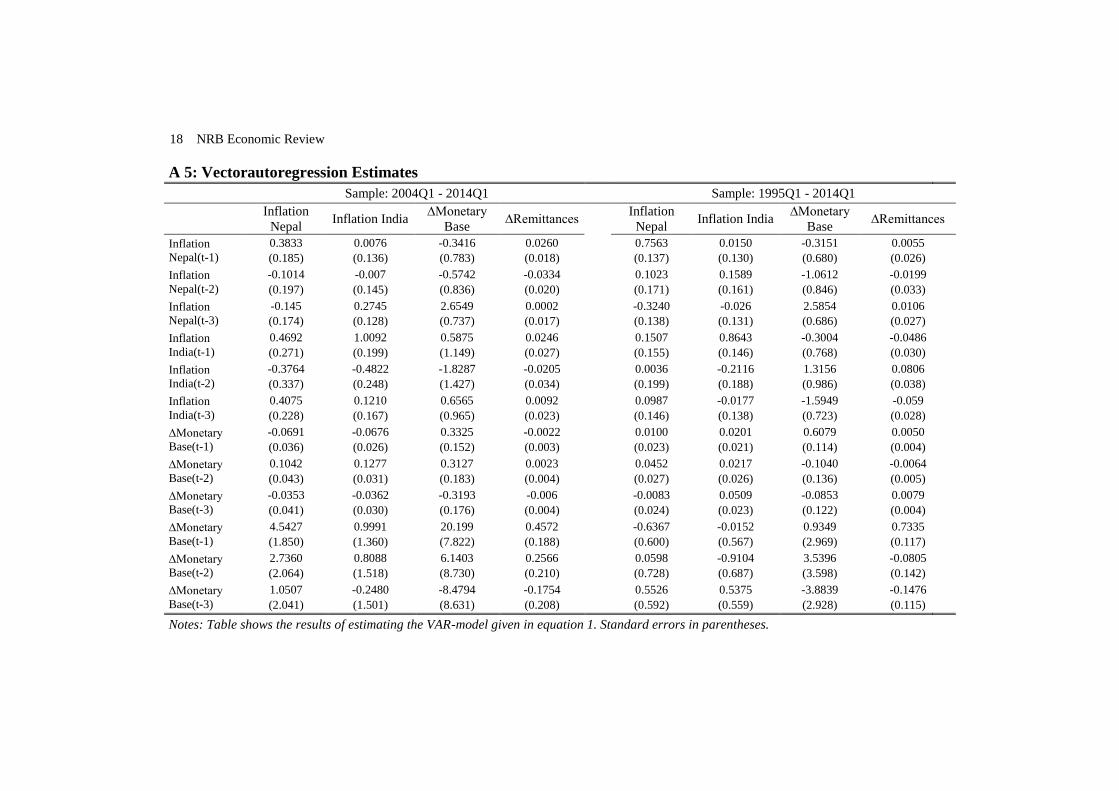
In a simple, four-variable vectorautoregressive analysis that includes inflation in Nepal,
inflation in India, remittances and changes in the monetary base, we estimate whether
inflation in Nepal responds to the quarterly inflows of remittances. As the time series are
stationary in first differences, we can estimate the following system of equations without
the risk of a spurious regression:
∑ ………. (1)
with being a vector of endogenous variables (inflation Nepal, inflation India,
∆remittances, ∆monetary base) at time , representing a vector of equation-specific
constants, and being a vector of residuals. contains the estimated coefficients. We
choose lag length, , according to the Akaike Information Criterion and subject to the
requirement of leaving no significant autocorrelation in the residuals.
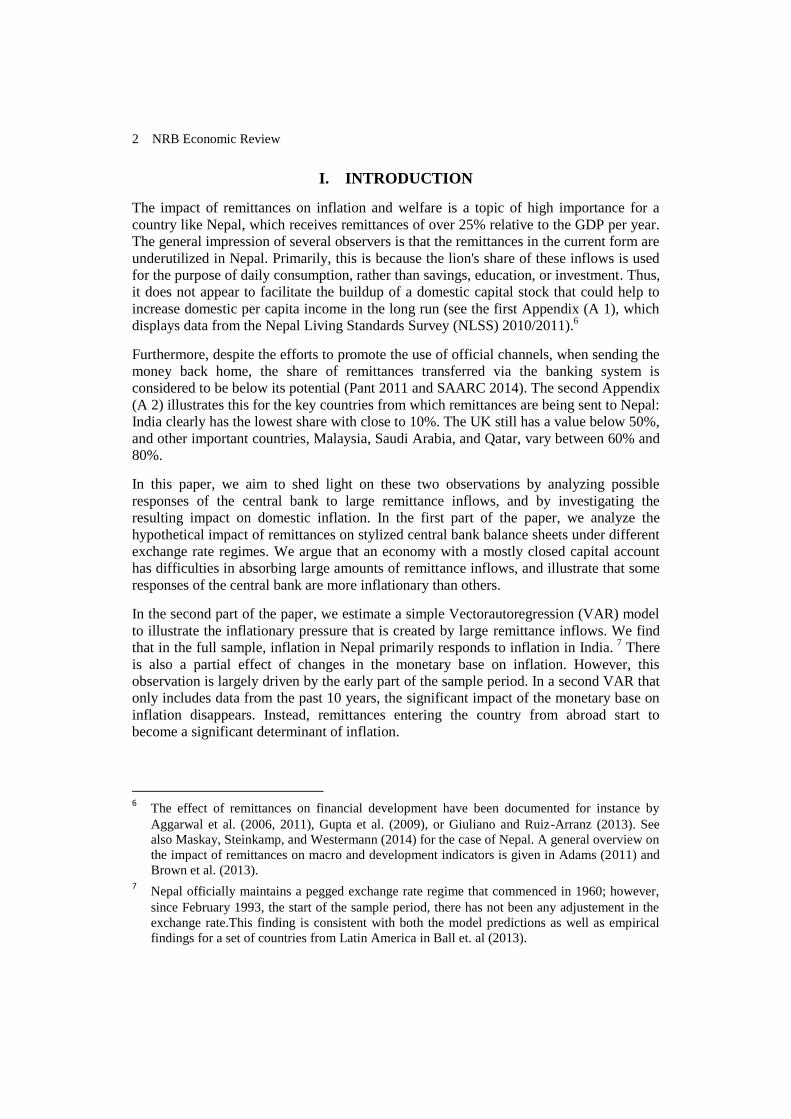
The impulse response pattern displayed in Figures 2 and 3 are computed from the
estimated VAR coefficients.10
They show the reaction derived as generalized impulse
10
For completeness, the coefficient estimates are given in the fifth Appendix (A 5).
8 NRB Economic Review
response functions; in other words, the graph displays a reaction to a system-shock to one
variable, taking the contemporaneous correlation with the other variable into account.
This approach has the advantage that the impulse response patterns are independent of the
ordering in the VAR. A potential disadvantage is the fact that each shock may not be
identified precisely. However, the contemporaneous correlation is quite low, and an
alternative approach, for instance a Cholesky decomposition, would yield similar results.
The full sample (1993:1 to 2014:1)
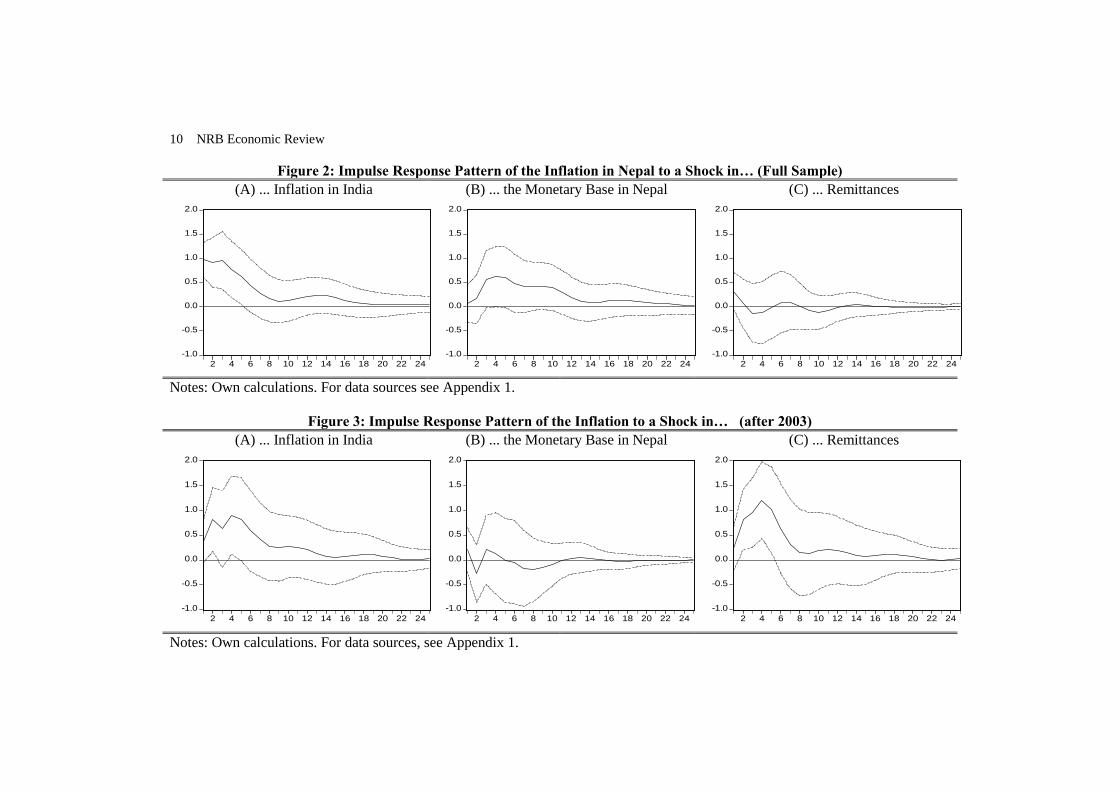
Figure 2 shows the impulse response functions in the full sample period from 1993:1 to
2014:1. In the first graph, Figure 2(A), we see the reaction of an unanticipated change in
inflation in India on the inflation rate in Nepal. It is statistically significant and positive
for about five to six quarters. It shows the importance of the Indian economy, as well as
the policy of the central bank of Nepal. By fixing the exchange rate, Nepal effectively
imports the inflation rate from India, as visible in Figure 1(A).
However and as seen in Figure 2(B), changes to the monetary base over the longer term
have not been ineffective entirely. Thus, despite its close link to India, Nepal has
managed to reserve some control over inflation. After a shock in the monetary base, there
is (with a delay of about two to three quarters) a positive response of inflation that is
statistically significant, although of course transitory and insignificant in the longer term.
While this observation violates the so-called “trilemma” hypothesis, according to which
economies cannot have a fixed exchange rate and (to some extent) an open capital
account and independent monetary policy at the same time, this finding is not
unreasonable, given Nepal's considerable capital controls, which are still in place.
Remittances, on the other hand and reflected in the final panel of Figure 2(C), only have a
very short-lived, but positive impact on inflation when considering the full sample period.
The reaction is statistically significant in the first quarter only. Thereafter, remittances do
not appear to contribute to explaining the path of inflation in Nepal.
The last 10 years (2004:1 to 2014:1)
There are several good reasons to perform a sample split and also to consider the most
recent period in Nepal separately. First, looking at Figure 1, there are several large
observations, such as 1997 in the monetary base, 1998 in inflation rates, and 2001 in
remittances. Although these observations are not outliers in a statistical sense, they still
may dominate the overall findings. The variance of all variables has been substantially
smaller in the later period. Also, one cannot fully rule out the possibility that these
observations from early data recording reflect data mistakes rather than larger underlying
economic movements.
Second, there are historical reasons for such a sample split. The insurgency that occurred
in Nepal and accelerated in the early 2000s has contributed to an economic downturn and
a substantial increase in remittances. While remittances were negligible in the 1990s, they
have grown to be an increasingly important element of national income from about
2003/4 onwards. In this period of large remittance inflows – considering the central bank
The Impact of Remittances on Central Bank Balance Sheets and Inflation in Nepal 9
balance sheet analysis above – one might expect a different reaction of inflation rates, as
large sums of inflows cannot be sterilized easily by the central bank.
In Figure 3(A), we can see that India, just as in the whole sample, plays a key role in
determining inflation rates in Nepal. The magnitude and time pattern are quite similar to
Figure 2, with the possible exception that there seems to be a short delay before the
shocks are transmitted.
Figure 3(B), on the other hand, illustrates that the impact of the monetary base has
changed in the later period. While the impact was positive and significant before, it now
has no clear sign direction, and is statistically insignificant over the full 25 quarter period
which was simulated.
Instead, as documented in Figure 3(C), the response to remittances has become much
more pronounced, and is positive and significant over a similar time interval of two to
seven quarters, comparable to the Indian inflation rate.
These impulse response patterns, although derived from a very simple VAR model, are
quite interesting, as they are consistent with the discussion of remittances and central
banks’ balance sheets above. While initially, small remittance inflows during the 1990s
and early 2000s were manageable from the central banks point of view, in the sense that
the central bank was able to sterilize its impact on inflation, the remittance inflows have
become a driving factor for inflation.
What appears to happen is that the remittances create inflationary pressure in Nepal, but
thereafter, the central bank policy of stabilizing the exchange rate ensures that this effect
is transitory, and thus, prevents a longer-term impact. The NRB steers against this
inflationary pressure by selling U.S. assets and purchasing Indian currency, as will be
documented in the following section. In the process, it has lost the ability to exert an
independent control over domestic inflation.
10 NRB Economic Review
Figure 2: Impulse Response Pattern of the Inflation in Nepal to a Shock in… (Full Sample)
(A) ... Inflation in India
(B) ... the Monetary Base in Nepal
(C) ... Remittances
Notes: Own calculations. For data sources see Appendix 1.
Figure 3: Impulse Response Pattern of the Inflation to a Shock in… (after 2003)
(A) ... Inflation in India
(B) ... the Monetary Base in Nepal
(C) ... Remittances
Notes: Own calculations. For data sources, see Appendix 1.
-1.0
-0.5
0.0
0.5
1.0
1.5
2.0
2 4 6 8 10 12 14 16 18 20 22 24
-1.0
-0.5
0.0
0.5
1.0
1.5
2.0
2 4 6 8 10 12 14 16 18 20 22 24
-1.0
-0.5
0.0
0.5
1.0
1.5
2.0
2 4 6 8 10 12 14 16 18 20 22 24
-1.0
-0.5
0.0
0.5
1.0
1.5
2.0
2 4 6 8 10 12 14 16 18 20 22 24
-1.0
-0.5
0.0
0.5
1.0
1.5
2.0
2 4 6 8 10 12 14 16 18 20 22 24
-1.0
-0.5
0.0
0.5
1.0
1.5
2.0
2 4 6 8 10 12 14 16 18 20 22 24
The Impact of Remittances on Central Bank Balance Sheets and Inflation in Nepal 11
IV. EXCHANGE RATE POLICY IN NEPAL
In this section, we investigate whether the policy response to remittance inflows in Nepal
is indeed reminiscent of the simplified balance sheet analysis of a central bank with an
only partially liberalized capital account and fixed exchange rate in section (2.3).
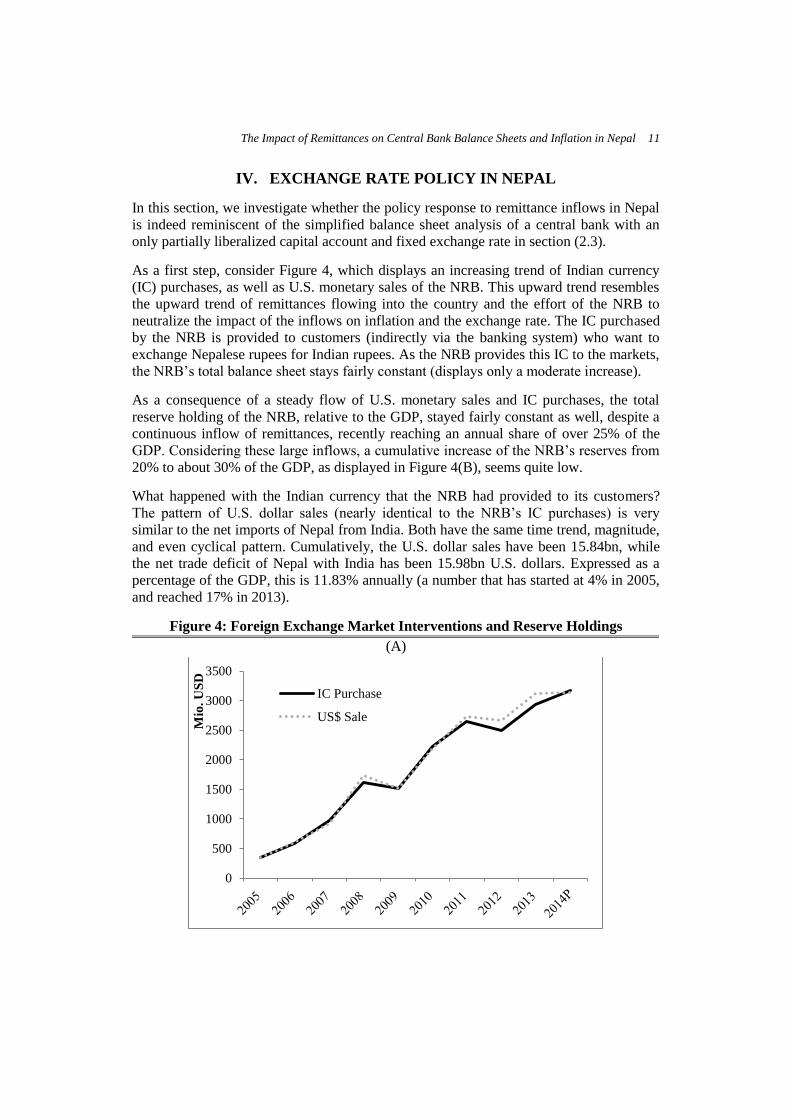
As a first step, consider Figure 4, which displays an increasing trend of Indian currency
(IC) purchases, as well as U.S. monetary sales of the NRB. This upward trend resembles
the upward trend of remittances flowing into the country and the effort of the NRB to
neutralize the impact of the inflows on inflation and the exchange rate. The IC purchased
by the NRB is provided to customers (indirectly via the banking system) who want to
exchange Nepalese rupees for Indian rupees. As the NRB provides this IC to the markets,
the NRB’s total balance sheet stays fairly constant (displays only a moderate increase).
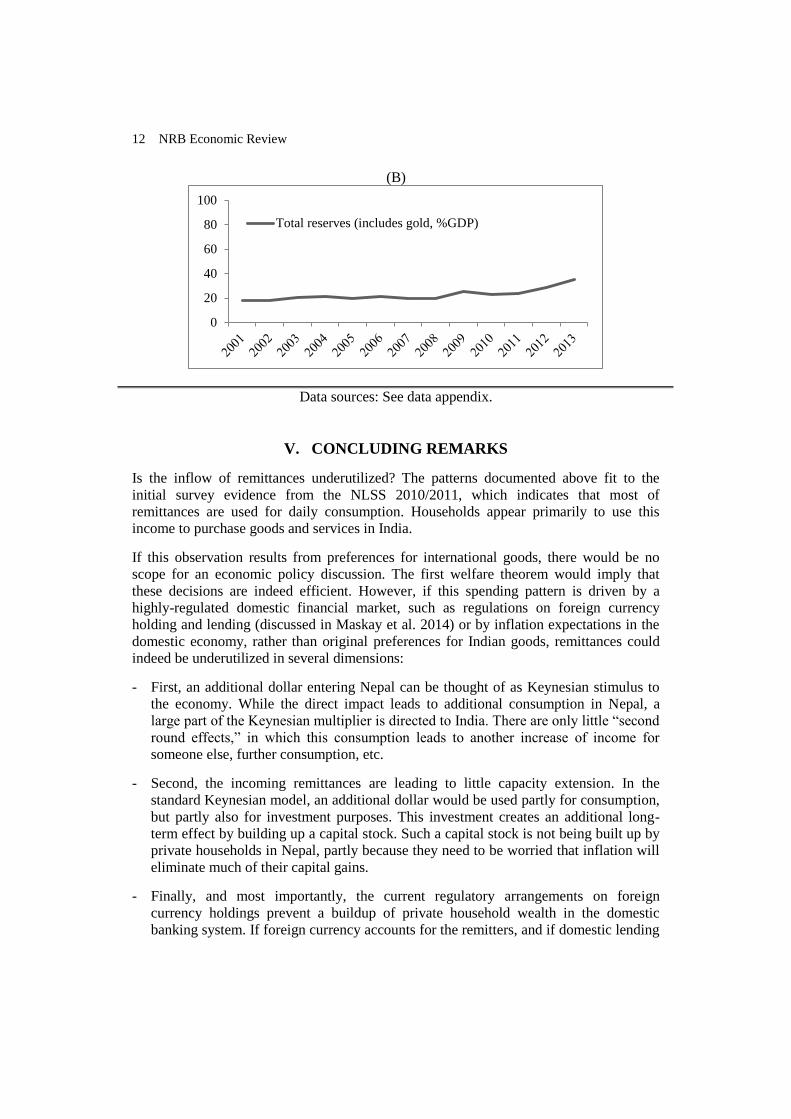
As a consequence of a steady flow of U.S. monetary sales and IC purchases, the total
reserve holding of the NRB, relative to the GDP, stayed fairly constant as well, despite a
continuous inflow of remittances, recently reaching an annual share of over 25% of the
GDP. Considering these large inflows, a cumulative increase of the NRB’s reserves from
20% to about 30% of the GDP, as displayed in Figure 4(B), seems quite low.
What happened with the Indian currency that the NRB had provided to its customers?
The pattern of U.S. dollar sales (nearly identical to the NRB’s IC purchases) is very
similar to the net imports of Nepal from India. Both have the same time trend, magnitude,
and even cyclical pattern. Cumulatively, the U.S. dollar sales have been 15.84bn, while
the net trade deficit of Nepal with India has been 15.98bn U.S. dollars. Expressed as a
percentage of the GDP, this is 11.83% annually (a number that has started at 4% in 2005,
and reached 17% in 2013).
Figure 4: Foreign Exchange Market Interventions and Reserve Holdings
(A)
0
500
1000
1500
2000
2500
3000
3500
Mio
. U
SD
IC Purchase
US$ Sale
12 NRB Economic Review
(B)
Data sources: See data appendix.
V. CONCLUDING REMARKS
Is the inflow of remittances underutilized? The patterns documented above fit to the
initial survey evidence from the NLSS 2010/2011, which indicates that most of
remittances are used for daily consumption. Households appear primarily to use this
income to purchase goods and services in India.
If this observation results from preferences for international goods, there would be no
scope for an economic policy discussion. The first welfare theorem would imply that
these decisions are indeed efficient. However, if this spending pattern is driven by a
highly-regulated domestic financial market, such as regulations on foreign currency
holding and lending (discussed in Maskay et al. 2014) or by inflation expectations in the
domestic economy, rather than original preferences for Indian goods, remittances could
indeed be underutilized in several dimensions:
- First, an additional dollar entering Nepal can be thought of as Keynesian stimulus to
the economy. While the direct impact leads to additional consumption in Nepal, a
large part of the Keynesian multiplier is directed to India. There are only little “second
round effects,” in which this consumption leads to another increase of income for
someone else, further consumption, etc.
- Second, the incoming remittances are leading to little capacity extension. In the
standard Keynesian model, an additional dollar would be used partly for consumption,
but partly also for investment purposes. This investment creates an additional long-
term effect by building up a capital stock. Such a capital stock is not being built up by
private households in Nepal, partly because they need to be worried that inflation will
eliminate much of their capital gains.
- Finally, and most importantly, the current regulatory arrangements on foreign
currency holdings prevent a buildup of private household wealth in the domestic
banking system. If foreign currency accounts for the remitters, and if domestic lending
0
20
40
60
80
100
Total reserves (includes gold, %GDP)
The Impact of Remittances on Central Bank Balance Sheets and Inflation in Nepal 13
to non-traded sectors in foreign currency was liberalized further, this could both
finance investment and dampen the inflationary impact of remittances. It would allow
for capacity extension and a higher long-term growth path. A potential drawback of
such a policy might be that it comes at the expense of a higher risk of currency crisis
that other developing economies have experienced (Tornell and Westermann 2005,
and Tornell, Westermann and Martinez 2003). However, household deposits, unlike
internation portfolio flows, are rather unlikely to experience sharp reversals.
REFERENCES
Adams Jr., R. H. 2011. “Evaluating the economic impact of international remittances on
developing countries using household surveys: A literature review.” Journal of Development
Studies 47(6): 809–828.
Aggarwal, R., Demirgüç–Kunt, A., and M. Soledad Martínez Pería. 2006. “Do workers’
remittances promote financial development?” World Bank Policy Research Working Paper
No. 3957.
Aggarwal, R., Demirgüç–Kunt, A., and M. Soledad Martínez Pería. 2011. "Do remittances
promote financial development?" Journal of Development Economics 96(2): 255–264.
Ball, C., Lopez, C., and J. Reyes. 2013. “Remittances, Inflation and Exchange Regimes in Small
Open Economics.” The World Economy 36(4): 487–502.
Bettin, G., Lucchetti, R., and A. Zazzaro. 2012. “Financial development and remittances: Micro
econometric evidence.” Economics Letters 115(2): 184–186.
Brown, R. P. C., Carmignani, F., and G. Fayad. 2013. “Migrants’ Remittances and Financial
Development: Macro– and Micro–Level Evidence of a Perverse Relationship.” The World
Economy 36: 636–660.
Giuliano, P., and M. Ruiz–Arranz. 2009. “Remittances, financial development, and growth.”
Journal of Development Economics 90(1): 144–152.
Gupta, S., Pattillo, C. A. and S. Wagh. 2009. “Effect of Remittances on Poverty and Financial
Development in Sub–Saharan Africa.” World Development 37(1): 104–115.
Mandelmann, F. (2013). “Monetary and exchange rate policy under remittance fluctuations.”
Journal of Development Economics 102: 128–147.
Maskay, N. M., Steinkamp, S., and F. Westermann. 2014. “On Remittances, Foreign Currency
Exposure and Credit Constraints: Evidence from Nepal.” CESifo Working Paper #5023.
Pant, B. 2011. "Harnessing Remittances for Productive Use in Nepal." NRB Economic Review 23:
1–20.
South Asian Association for Regional Cooperation (SAARC). 2014. “Nepal – Role of Remittances
in Economic and Financial Development.”, SAARC/IGEG.07/27, Kathmandu.
Tornell, A., and F. Westermann. 2005. “Boom‐Bust Cycles and Financial Liberalization.” MIT
Press. Cambridge, Massachusetts (USA).
Tornell, A., Westermann, F. & L. Martinez. 2003. "Liberalization, Growth and Financial Crisis:
Lessons from Mexico and the Developing World." Brookings Papers on Economic Activity 2:
1‐112.
14 NRB Economic Review
APPENDIX
A 1: Households’ “most important use of remittances”
Data source: NLSS III, 2010/2011.
daily consumption 87%
education 4%
capital formation 1%
business or investment
0%
household assets 5%
savings 0%
repay loan 1%
others 2%
The Impact of Remittances on Central Bank Balance Sheets and Inflation in Nepal 15
A 2: Share of remittances transferred via financial institutions
Data source: NLSS III, 2010/2011.
0
10
20
30
40
50
60
70
80
90
100
India Malaysia Saudi
Arabia
Qatar UK other
16 NRB Economic Review
A 3: Variable definitions and data sources
Variable Description Source
Remittances Personal remittances received
Nepal Rastra Bank, Quarterly
Bulletin April 2014 (Table 77) &
July 2012 (Table 64)
GDP Nominal GDP
Government of Nepal (Central
Bureau of Statistics), Table 2
“Gross Domestic Product”
Net Imports
from India
Net Imports = Imports of goods
and services from India minus
Exports of goods and services to
India
International Monetary Fund,
Directions of Trade Statistics
Official
Reserve
Assets
Official Reserve Assets of Nepal
(incl. gold)
International Monetary Fund,
International Financial Statistics,
concept code: RAFA
Inflation Percentage change in consumer
prices
International Monetary Fund,
International Financial Statistics
Monetary
Base
Sum of circulating currency and
central bank money
International Monetary Fund,
Central Bank Survey
Nepal Rastra
Bank (NRB)
Total Assets
Total gross assets of Nepal
Rastra Bank
International Monetary Fund,
Central Bank Survey, concept code:
FAAG
IC Purchases Purchases of Indian Currency by
the NRB
NRB Quarterly Economic Bulletin,
2004-2014
USD Sales Sales of USD by the NRB NRB Quarterly Economic Bulletin,
2004-2014
Total
Reserves
(convertible,
inconvertible)
Total Reserves of the NRB
either as total or split into
convertible and non-convertible
reserve assets
NRB Quarterly Economic Bulletin,
2004-2014
The Impact of Remittances on Central Bank Balance Sheets and Inflation in Nepal 17
A 4: Stationarity Properties
TEST
STATISTICS
TEST H0 Inflation
Nepal
Inflation
India
Inflation
Differential
∆Monetary
Base ∆Remittances
Fisher type ADF (t-stat.) Series has a
unit root -3.430** -3.293** -5.704*** -5.540*** -4.639***
DF GLS (t-stat.) Series has a
unit root -3.441*** -3.109*** -4.367*** -3.465*** -3.005***
KPPS (LM-stat.) Series is
stationary 0.324 0.243 0.192 0.167 0.161
Notes: *, **, and *** denotes statistically significance at the 10%, 5% and 1%, respectively. Probability values in parentheses.
Numbers of lags up to the third order were chosen using the Akaike Information Criterion. For the Kwiatkowski-Phillips-Schmidt-
Shin test statistic (KPSS) we use automatic Newey-West bandwidth selection.
18 NRB Economic Review
A 5: Vectorautoregression Estimates
Sample: 2004Q1 - 2014Q1
Sample: 1995Q1 - 2014Q1
Inflation
Nepal Inflation India
∆Monetary
Base ∆Remittances
Inflation
Nepal Inflation India
∆Monetary
Base ∆Remittances
Inflation
Nepal(t-1)
0.3833
(0.185)
0.0076
(0.136)
-0.3416
(0.783)
0.0260
(0.018)
0.7563
(0.137)
0.0150
(0.130)
-0.3151
(0.680)
0.0055
(0.026)
Inflation
Nepal(t-2)
-0.1014
(0.197)
-0.007
(0.145)
-0.5742
(0.836)
-0.0334
(0.020)
0.1023
(0.171)
0.1589
(0.161)
-1.0612
(0.846)
-0.0199
(0.033)
Inflation
Nepal(t-3)
-0.145
(0.174)
0.2745
(0.128)
2.6549
(0.737)
0.0002
(0.017)
-0.3240
(0.138)
-0.026
(0.131)
2.5854
(0.686)
0.0106
(0.027)
Inflation
India(t-1)
0.4692
(0.271)
1.0092
(0.199)
0.5875
(1.149)
0.0246
(0.027)
0.1507
(0.155)
0.8643
(0.146)
-0.3004
(0.768)
-0.0486
(0.030)
Inflation
India(t-2)
-0.3764
(0.337)
-0.4822
(0.248)
-1.8287
(1.427)
-0.0205
(0.034)
0.0036
(0.199)
-0.2116
(0.188)
1.3156
(0.986)
0.0806
(0.038)
Inflation
India(t-3)
0.4075
(0.228)
0.1210
(0.167)
0.6565
(0.965)
0.0092
(0.023)
0.0987
(0.146)
-0.0177
(0.138)
-1.5949
(0.723)
-0.059
(0.028)
∆Monetary
Base(t-1)
-0.0691
(0.036)
-0.0676
(0.026)
0.3325
(0.152)
-0.0022
(0.003)
0.0100
(0.023)
0.0201
(0.021)
0.6079
(0.114)
0.0050
(0.004)
∆Monetary
Base(t-2)
0.1042
(0.043)
0.1277
(0.031)
0.3127
(0.183)
0.0023
(0.004)
0.0452
(0.027)
0.0217
(0.026)
-0.1040
(0.136)
-0.0064
(0.005)
∆Monetary
Base(t-3)
-0.0353
(0.041)
-0.0362
(0.030)
-0.3193
(0.176)
-0.006
(0.004)
-0.0083
(0.024)
0.0509
(0.023)
-0.0853
(0.122)
0.0079
(0.004)
∆Monetary
Base(t-1)
4.5427
(1.850)
0.9991
(1.360)
20.199
(7.822)
0.4572
(0.188)
-0.6367
(0.600)
-0.0152
(0.567)
0.9349
(2.969)
0.7335
(0.117)
∆Monetary
Base(t-2)
2.7360
(2.064)
0.8088
(1.518)
6.1403
(8.730)
0.2566
(0.210)
0.0598
(0.728)
-0.9104
(0.687)
3.5396
(3.598)
-0.0805
(0.142)
∆Monetary
Base(t-3)
1.0507
(2.041)
-0.2480
(1.501)
-8.4794
(8.631)
-0.1754
(0.208)
0.5526
(0.592)
0.5375
(0.559)
-3.8839
(2.928)
-0.1476
(0.115)
Notes: Table shows the results of estimating the VAR-model given in equation 1. Standard errors in parentheses.