Embed Size (px)
Citation preview
i
THE IMPACT OF REWARD SYSTEM ON EMPLOYEE PERFORMANCE : A
CASE STUDY OF BANK OF TANZANIA
GEORGE KALANGULLA
A DISSERTATION SUBMITTED IN PARTIAL FULFILLMENT OF THE
REQUIREMENTS FOR THE MASTER OF HUMAN RESOURCE
MANAGEMENT OF THE OPEN UNIVERSITY OF TANZANIA
2015
ii
CERTIFICATION
The undersigned certifies that he has read and hereby recommends for acceptance by
the Open University of Tanzania a dissertation entitled The Impact of Reward
System on Employee Performance: A Case Study of Bank of Tanzania, in partial
fulfilment of the requirements for the degree of Master of Human Resources
Management.
...........................................................................
Dr. Raphael Gwahula
(Supervisor)
……………………………………………….
Date

iii
COPYRIGHT
No part of this dissertation may be reproduced, stored in any retrieval system, or
transmitted in any form by any means, electronic, mechanical, photocopying,
recording or otherwise without prior written permission of the author or The Open
University of Tanzania in that behalf.

iv
DECLARATION
I, George Kalangulla, do hereby declare that this dissertation is my own original
work and that it has not been submitted for a similar degree in any other University.
……………………………………
Signature
……………………………
Date

v
DEDICATION
This work is dedicated to my spouse namely Adelina Mwashambwa, God bless you
for love, care, tolerance, moral and material support during my MHRM studies. I am
also gratefully to my parents, Mr. Issack Kalangulla and Mrs. Leonia Kipanta
Kalangulla for their love, support and players.

vi
ACKNOWLEDGEMENTS
This work is the result of dissertation and writing that involved various people who
presented huge concern, help, direction, and advices. I am gratefully to thanks to the
Almighty God for giving me driving force and strength which enabled me to carry out
this program successfully.
I would like to record my sincere gratitude for intellectual support and guidance
extended by my dissertation supervisor Dr. Raphael Gwahula all the way through
dissertation writing. Frankly speaking I would not finish this dissertation without his
expert advice and encouragement.
I am also grateful to the Manager Economics (MEC) of the Central Bank of Tanzania
Arusha Branch Dr. Wilfred Mbowe for his directives and advices regarding my
dissertation.
Last but not the least; I thank the management and staff of the Central Bank of
Tanzania BOT for their moral and material support shown during my data collections
up to the completion of my dissertation.

vii
ABSTRACT
The study was “the impact of reward system on employee performance: case study of
bank of Tanzania” it aimed at analysing the effects of financial and nonfinancial
rewards on empoyees’ job performance at BOT. The study employs both qualitative
and quantitative research paradigms and philosophy. This research method is “the
procedures for coming to terms with the meaning not the regularity of an occurrence
by studying it in its social context.” a quantitative approach is likewise used because it
is essential to have the absolute values of certain key issues during the research.
Quantitative research method is based on the measurement of quantity or amount. It is
applicable to phenomena that can be expressed in terms of quantity (William, 2010).
Therefore study employed both quantitative and qualitative approaches. Meanwhile
after data collection and discussions findings of this research which includes the
descriptive statistics, characteristics of work motivation, attributes of employees’
rewards, attributes of employees’ performance and effects of the independent
variables on the dependent variable, this among other issues. Analysis of the study
above study, it is obvious therefore those financial rewards positively affect
employees’ job performance. Similarly nonfinancial rewards have the same impact on
employees’ job performance at BOT. Thus, it is crucial that managers of the bank pay
attention on the way they reward their employees in order to boost job performance,
but it is often time that nonfinancial rewards are ignored by managers in many
organization, this study provides suggestion that they are vital in improving job
performance. After a conclusion, then the research recommended that, employees’ job
performance in the central Bank of Tanzania and any other business Organizations are
influenced by rewards systems in place.

viii
TABLE OF CONTENTS
CERTIFICATION ------------------------------------- ----------------------------------------- ii
COPYRIGHT ----------------------------------------- ------------------------------------------ iii
DECLARATION --------------------------------------- ---------------------------------------- iv
DEDICATION ---------------------------------------- ------------------------------------------- v
ACKNOWLEDGEMENTS ---------------------------------- -------------------------------- vi
ABSTRACT ------------------------------------------------------------------------------------ vii
TABLE OF CONTENTS --------------------------------- ---------------------------------- viii
LIST OF TABLES AND FIGURES ------------------------ -------------------------------- x
LIST OF ABBREVIATIONS AND ACRONYMS ---------------- -------------------- xii
CHAPTER ONE -------------------------------------------------------------------------------- 1
1.0 INTRODUCTION ---------------------------------- ------------------------------------ 1
1.1 Background to the Study ------------------------------------------------------------- 1
1.2 Statement of the Problem ------------------------------------------------------------ 2
1.3 Objectives ------------------------------------------------------------------------------ 4
CHAPTER TWO --------------------------------------- ---------------------------------------- 5
2.0 LITERATURE REVIEW ------------------------------------------------------------- 5
2.1 Definition of Concepts ---------------------------------------------------------------------- 5
2.2 Theoretical Literature Review ------------------------------------------------------------- 7
2.3 Empirical Literature Review ------------------------------------------------------------- 16
2.4 Conceptual Model ------------------------------------------------------------------------- 19
2.5 Research Synthesis and Gap ------------------------------------------------------------- 21
CHAPTER THREE ------------------------------------- ------------------------------------- 22
3.0 RESEARCH METHODOLOGY -------------------------- ----------------------- 22

ix
3.1 Study Area ---------------------------------------------------------------------------------- 22
3.2 Research Design --------------------------------------------------------------------------- 22
3.3 Sampling Design --------------------------------------------------------------------------- 23
3.4 Data Collection Instruments -------------------------------------------------------------- 24
3.5 Variable Measurements ------------------------------------------------------------------- 25
3.6. Validity and Reliability ------------------------------------------------------------------ 25
3.7 Data analysis and Analysis Designs ----------------------------------------------------- 27
CHAPTER FOUR ---------------------------------------------------------------------------- 28
4.0 DATA ANALYSIS, PRESENTATION AND DISCUSSION --------------- 28
4.1 Descriptive Statistics ---------------------------------------------------------------------- 28
4.2 Characteristics of Work Motivation at BOT ------------------------------------------- 30
4.3 Attributes of Employees’ Reward System at BOT ------------------------------------ 31
4.4 Attributes of Employees’ Work Performance at BOT -------------------------------- 35
4.5 Contribution of Financial Rewards on Employees’ Work Performance at BOT - 38
4.6 Contribution of nonfinancial rewards on employees’ work performance at BOT 41
4.7 Research Hypotheses Tests --------------------------------------------------------------- 44
4.8 Conclusions --------------------------------------------------------------------------------- 46
CHAPTER FIVE -------------------------------------- ---------------------------------------- 47
5.0 CONCLUSIONS RECOMMENDATIONS ------------------- ------------------ 47
5.1 Conclusions --------------------------------------------------------------------------------- 47
5.2 Recommendations ------------------------------------------------------------------------- 48
5.3 Areas for Further Studies ----------------------------------------------------------------- 49
REFERENCES -------------------------------------------------------------------------------- 51
APPENDICES --------------------------------------------------------------------------------- 55

x
LIST OF TABLES
Table 3.3: Sample Strata Distribution ------------------------------------------------------ 24
Table 4.1b Employees’ age and work experience levels -------------------------------- 30
Table 4.2 Employees’ work motovation --------------------------------------------------- 30
Table 4.3a Knowledge of Success Measurements ---------------------------------------- 31
Table 4.3b Importance of bonuses over salary -------------------------------------------- 32
Table 4.3c Recognition of Extra Efforts --------------------------------------------------- 32
Table 4.3d Achievement Celebrations ----------------------------------------------------- 33
Table 4.3e Work environment --------------------------------------------------------------- 33
Table 4.3f Motivation Through Financial Rewards -------------------------------------- 34
Table 4.3g Motivation Through Nonfinancial Rewards --------------------------------- 34
Table 4.3h employees’ reward --------------------------------------------------------------- 35
Table 4.4a Quantity Produced Met --------------------------------------------------------- 36
Table 4.4b Quality produced not redone/rejected----------------------------------------- 36
Table 4.4c Timely Completing Tasks ------------------------------------------------------ 37
Table 4.4d Productivity-performance correspondence ----------------------------------- 37
Table 4.4e Job Performance ----------------------------------------------------------------- 38
Table 4.5a Regression Model Summary --------------------------------------------------- 38
Table 4.5b Regression model-3 coefficients ---------------------------------------------- 39
Table 4.5c Regression model-1 coefficients ----------------------------------------------- 40
Table 4.5d Regression model-2 coefficients ---------------------------------------------- 42

xi
LIST OF FIGURES
Figure 2.2 Abraham Maslow's --------------------------------------------------------------- 13
Figure 2.4 Rewards-Employees Performance Model ------------------------------------ 19
Figure 4.1 Gender and Educational Levels ------------------------------------------------ 29

xii
LIST OF ABBREVIATIONS AND ACRONYMS
ARS Arusha
BOT Bank of Tanzania
BSC Balance Scorecard
CVI Content Validity Index
DR. Doctor
GPA Group Personal Accident
HQ Head Quarter
LAC Life Assurance Cover
MHRM Master of Human Resources Management
MR Mister
MRS Missus
OPRAS Open Performance Appraisal System
SPSS Statistical Software for Social Sciences
TQPM Total Quality Performance Management

1
CHAPTER ONE
1.0 INTRODUCTION
1.1 Background to the Study
This section introduces the background of the study with respect to various factors
that examine the relationship between remuneration and employee performance in the
BOT. It will also address the problem statement part, objectives of the study as well
as importance of the suggested study. Compensation is a reward for employment in
the form of pay, salary, or wage, comprising with allowances, benefits (such as
company car, medical plan, pension plan), bonuses, cash incentives, and monetary
value of the noncash incentives. It consists of the financial remuneration represented
by earnings plus the value of the benefits received by employees (Armstrong, 2002).
Remuneration is traditionally seen as the total income of an individual and may
comprise a range of separate payments calculated according to various rules. For
instance, the entire remuneration of medical staff in the BOT Employees may include
a capitation fee and a fee for services, or it may comprise a salary and shared financial
risk. A remuneration strategy, therefore, is the particular arrangement or bundling of
payments that go to make up an individual’s total income. The term ”Remuneration”
refers to wages, salaries, overtime payments, bonuses, commissions and other
financial rewards paid to employees in return for the work they perform for their
employers. It is also referred to us as pay. Employee performances refers to the
intensity at which workforce is applied on utilizing and organizing resources such as
machines, materials and money as engaged in production procedure in order to get
output. Employee performance is not a detached issue from remuneration; in fact job

2
performance depends very much on remuneration. In the contract of service which
involves agreement between an employer and employee, where an employer give an
offer to the employee where an employee offer manpower in order to get
remuneration in form of salary or wages as a reward. Therefore if a worker is not
provided with remuneration then, job performance will enormously decline. This is
for the reason that all incentives cannot work if remuneration is not applicable (By
Abraham Maslow’s) needs of hierarch in motivation factors. Remuneration is very
crucial to the BOT employees and any other business organization used as
competitive tool, employee retention, motivate employee, employee’s commitment,
develop a positive employment relationship and psychological contract align reward
practices with both business goals and employee values.
1.2 Statement of the Problem
For the central Bank of Tanzania to maximize employee’s performance there is a call
for the employees to be adequately motivated through various factors such as
financial and non-financial. Therefore, motivation in theory and practice becomes a
tricky subject touching on several disciplines. Although a lot of scholarly research has
been written on motivation, this subject is not obviously understood and more often
than not poorly practiced. On this score, to best comprehend how motivation can
impact on employee´s performance in the central Bank of Tanzania, one must
appreciate human nature. In as much as motivation impacts on employee
performance, there is need to mix together the suitable motivational tools with
effectual management and leadership to realize this goal. It is evident from the BOT
annual report that employees enjoys the following motivational packages: resolving
complaints through meetings and discussions, improvement in working conditions

3
and living standards of employees and such facilities include: medical services,
transport to and from work, house allowance, loans and health assistance, employee
training and development, leave travel assistance, long service awards for employees
of BOT who have been in employment for continuous period of twenty five and thirty
five years (As per BOT staff By laws and Financial Regulations of 2015). With this
regard improvement of individual performance, more resources were directed to
learning initiatives that support effective implementation of annual work plans of
functional units and approved projects in line with the Bank’s Core Competency
Framework. Out of the goal to train 1,316 staff by end June, 2014, a total of 450
employees were trained in the variety of short courses, group courses, seminars,
workshops and conferences.
In its labors to improve employees’ satisfaction and improve employees’
performance, the bank improved the medical insurance contract with the service
provider and launched annual medical check-up facility to employees. The bank also
developed employees’ welfare and benefits by introducing a Life Assurance Cover
(LAC) in place of Group Personal Accident (GPA) insurance cover. The bank of
Tanzania is an equal opportunity employer with a total of 1,320 staff as at 30 June
2014 (2013: 1,335) out of which 59.2 per cent (2013: 58.8 per cent) are male and 40.8
per cent (2013: 41.2 per cent) are female (Bank of Tanzania [BOT], 2014). Despite
such efforts, this arouses more critical academic thinking within the subject area. In
this light a lot of academic literatures from scholars and practicing managers have
attempted to resolve this intriguing academic domain on how motivation can enhance
performance. The diversity of today’s work force presents managers with problems of
substantial magnitude. Huge differences among employees in every organization and

4
work group means that there is no one best way to deal with them. An approach that
motivates some employee to perform well misses the mark with other employees.
This consequently, possesses a major challenge to today’s managers. As such it
triggers the problem question “why is or not reward in terms of financial and
nonfinancial rewards sufficient motivators for employees’ performance in an
organization?”
1.3 Objectives
1.3.1 General Objective
To assess the role of rewards on influencing employees’ work performance at the
Bank of Tanzania
1.3.2 Specific Objectives
The specific objectives of the study are to:
i) To assess the attributes of employees’ reward system in the Bank of Tanzania
ii) To assess the attributes of employees’ work performance in the Bank of
Tanzania
iii) To assess the contribution of financial rewards on employees work
performance in the Bank of Tanzania
iv) To assess the contribution of nonfinancial rewards on employees work
performance in the Bank of Tanzania

5
CHAPTER TWO
2.0 LITERATURE REVIEW
2.1 Definition of Concepts
2.1.1 Employee Reward System
An employee reward system embraces an organization’s incorporated policies,
processes and practices for rewarding its employees in accordance with their
contribution, skills and competence, and their market value. It emerges within the
framework of the organization’s reward philosophy, strategies and policies. The
reward systems of employees has arrangements in the variety of processes, practices,
structures and procedures which will grant and sustain fitting varieties and levels of
pay, benefits and other forms of reward. The reward system consists of financial
rewards (fixed and variable pay) and employee benefits, which together comprise
total compensation. The system also incorporates non-financial rewards (recognition,
praise, achievement, responsibility and personal growth) and in a lot of cases,
performance management processes (Armstrong, 2002; William, 2010).
2.1.2 Employee Performance
Performance of employees has been accepted as a multidimensional construct in view
of the fact that it quantifies a variety of different aspects of employees’ performance.
In the organizational context performance is usually defined as the degree to which an
organizational member contributes to achieving the goals of the organization.
Employee performance plays an imperative role for organizational performance.
Employee performance is at first what an employee does or does not do. Performance
of employees could include: quantity of output, quality of output, timeliness of output.

6
Employee performance may possibly be defined as the evidence of outcomes
achieved, for each job task, throughout a precise period of time. If viewed in this way,
performance is represented as a distribution of outcomes achieved, and performance
could be measured by using a variety of parameters which describe an employee’s
pattern of performance over time (Ying, 2004).
2.1.3 Employee Performance Measurement
The concepts of performance are studied through evaluation of overall performance.
Furthermore the axiom ‘If you can’t measure it, you can’t manage it,’ supports the
rationale for organization having a completed and wide-ranging performance
measurement system such as the Balanced Scorecard (BSC) or total quality
performance management (TQPM) or the open performance appraisal system
(OPRAS). This approach connects measures throughout an organization to translate
high level objectives into lower level activities.
Performance criteria have to be unambiguous, obviously explained, pertinent to the
work tasks undertaken by employees and achievable. The criteria should not include
factors beyond the control of the individual employee. Supervisors also need to be
trained to provide regular, meaningful and constructive feedback. Employees should
also be provided with appropriate training and development opportunities to
overcome weaknesses in performance identified through the evaluation process. The
assessment of individual employee performance as well needs to focus on evaluating
employee behavior and work performance and not the personality of the employee
(Ying, 2004).

7
2.2 Theoretical Literature Review
2.2.1 Reward System
An organization’s reward system is the way by which it encourages employees, such
as achievement, recognition, autonomy and other intrinsic aspects and discourages for
instance low pay, poor work environment and poor company policies which may
motivate employees and vice versa. The most important machinery of the reward
system includes salaries, bonuses and privileges. The reward system as a means to
support innovation by employees is a fairly mechanical but nevertheless effective
management technique (William, 2010).
Once the members of an organization understand that they will be rewarded for such
activities, they are more likely to work creatively. The initiative to provide financial
and non-financial rewards to people and groups who develop innovative ideas is
important for organizations (Griffin, 2006). Reward systems are necessary because
they give preference to service over self-interest (William, 2010).
Reward system is very important in any organization as the process that is in com-
mand of human behavior within an organization. It helps to verify not only perfor-
mance in relation to current goals but also influences the possibility of people joining
and remaining in an organization. It also shapes the degree to which effort is directed
in the development of the organization future capabilities. If correctly designed or
administered reward systems can lead to attractive behavior for a firm. On the other
hand, if incorrectly designed or administered, reward systems can lead to the steady
deterioration of an organization and why not its immediate demise (Flamholtz, 1996;
William, 2010). The managers must guarantee that its reward structure is equivalent

8
to the market rate. An effective reward system shall enable competitiveness with
those of the other firms seeking a particular kind of competency and talent which is
more striking to prospective candidates (William, 2010). Managers can design reward
systems to diminish absenteeism by linking bonuses to levels of attendance. This
strategy is particularly positive in compensation for low job content and poor working
conditions that cannot be improved. Furthermore, some of the jobs in facility
management companies may be simple and routine and therefore may lack
motivational properties. The facility manager may attempt to decrease such
absenteeism by linking certain rewards to attendance. For example, the manager may
set a policy of giving a monetary bonus or extra days of paid leave for an ideal or
near-perfect attendance (William, 2010). The linkage between performance and
reward (that is intrinsic and extrinsic rewards) is a strong factor influencing
subsequent performance (William, 2010).
2.2.2 Financial Rewards
Refers to those rewards in terms of money, such types of financial payments paid to
the BOT employees. Some directly provide the employee with cash. Bonuses based
on performance against budget, quality or other standards may be used as immediate
financial incentives. Management rewards by bonuses have become popular in some
companies as a means of providing employees with an immediate buster for
completion of a project or activity (William, 2010). Most companies make use of
financial compensation plan to motivate their employees. High level executives of
most companies have separate compensation programs and plans. These programs
anticipated to reward these executives for their performance and for the performance
of the company. The senior executives collect their compensation in two forms. One

9
is a base salary as the case maybe with the staff member or professional member of
the company. The base salary is a definite amount that the employees will be paid.
Above the base salary, most executives also receive one or more forms of incentive
pay. The conventional manner of incentive pay for executives is in the form of
bonuses. The bonuses in turn are generally determined by the performance of the
company (William, 2010).
2.2.3 Nonfinancial Rewards
Refer as those rewards, which are not in form of money: for instance medical care,
transport, house and other incentives which are not in form of cash. Organizations
with positive ambitions could make available a framework within which high levels
of motivation could be accomplished through non financial reward systems by the
provision of opportunities for learning and development (William, 2010). It is an
approach of expressing gratitude for the special or extra effort done by an employee
within an organization. Recognition has two essential goals: to encourage the
employees or team to repeat or continue the behavior and to encourage others
employees to do the same (William, 2010).
Most team recognition plans fall into celebrating organizational objectives habitually
as an event, designed to acknowledge the successful completion of important
company goals. This is to create a greater awareness or to remind people of the
importance of the goals achieved within the company (William, 2010). Recognition,
either informal (oral) or formal (written remarks and events), has been the most cost
effective way to strengthen required actions for performance within an organization.
However, when recognition is acting in isolation of compensation and equity rewards,

10
it’s frequently loses much of its appeal (Wilson, 2003; William, 2010). Feedback in
particular constructive criticisms is necessary for the expansion and development of
the employee. Negative reinforcement such as indicating mistakes and threatening
employees with job loss, causes employees to adjust their behavior just enough to
avoid punishment. It may get to produce a positive result at the job but it won’t
generate enthusiasm. Negative reinforcement produces responses like “That’s not my
job” or “I don’t know.” On the other hand, periodic positive performance reviews
generate extra or discretionary effort on the part of the employees. Positive feedback
motivates the employees to function as a team (William, 2010). According to
Herzberg, managers do not motivate employees by awarding employees higher
wages, more benefits or status symbols. Rather, employees are motivated by their
own inherent need to accomplish something at a challenging task (William, 2010).
2.2.4 Employees’ Performance
Comparing performance measurement system to an instrument panel on a dashboard
provides significant insights about the mix of financial and nonfinancial measures
needed in a management control system. A single measure cannot control a complex
system (William, 2010). Performance measurement could be defined as “the regular
measurement of the results (outcomes) and efficiency of ser-vices or programs.” This
entails the regular measurement of progress towards precise outcome (it is a
fundamental component of any effort at managing for results), a customer oriented
procedure that focuses on maximizing benefits and minimizing nega-tive cost for
customers of service and programs. When performance is not measured or is
measured inaccurately, those using the information will be misled and bad judg-ments
will be likely followed.

11
Conventional measures of organizational performance were financial and accounting
based. Currently it has evolved into sophisticated systems which have several func-
tions. Firstly, the financial measures as tools were used to control the financial re-
sources of companies in order to support organizational objectives. Secondly,
financial performance measures acted as barometers to indicate achievements against
major organizational objectives. Thirdly, they also serve as motivators for future
achieve-ments. Furthermore, by providing a window of the past they were thought to
be the influencing factors for future successes. Notwithstanding the merits of the
financial and accounting measures in assessing performance, the fact that they were
cost based and back ward looking provided little motivation.
2.2.5 Theories of Employees’ Motivation
The reward system takes into account both monetary and non-monetary rewards.
Rewards are part of the employees’ motivational framework; as such we can not talk
of reward systems without discussing motivation theories. For the purpose of this
research I considered the following theories to be vital in this study: the Maslow’s
hierarchy of needs, Herzberg’s Motivation-hygiene theory, Vroom’s Expectancy
theory and Adam’s Equity theory.
2.2.6 Herzberg’s Two Factor Theory
Herzberg had the notion that those factors which cause job satisfaction are the
opposite to those that causes job dissatisfaction. Herzberg in his studies came up with
the conclusion that employees are influenced by two factors that are; the motivators
and hygiene factors. Motivators create job satisfactions which include achievement,
recognition, autonomy and other intrinsic aspects when there are fulfilled. On the

12
other hand he came up the hygiene factors which will enhance dissatisfaction when
they are not fulfilled. Motivators are those factors which come from within an
individual that is intrinsic. Herzberg hygiene factors create a suitable work
environment though not increase in satisfaction. For instance low pay can cause job
dissatisfaction which will affect employees’ performance. Typical hygiene factors are
salary, working condition, status, company policies and administration. (Saiyadain,
2009)
2.2.7 Maslow’s Hierarchy of Needs
Different scholars have put forth different explanations on how motivation can be
achieved within a company or an organization. Maslow in 1943 reasoned that human
beings have an internal need pushing them on towards self actualization (fulfillment)
and personal superiority. Maslow came up with the view that there are five different
levels of needs and once we happen to satisfy a need at one stage or level of the
hierarchy it has an influence on our behavior. At such level our behavior tends to
diminish, we now put forth a more powerful influence on our behavior for the need at
the next level up the hierarchy.
Initially, individuals are motivated by Psychological needs: By Maslow this
psychological needs forms the basic need for survival and this may include food,
warmth, clothing and shelter. The second level is seen as the security needs: Security
tends to be the most essential need to people at this level. This is expressed in safety
in the employee’s health and family. Esteem needs- These needs relate to desire for
self-respect, recognition and respect from others. The highest or last level of
Maslow’s need is self-actualization needs: These are the needs of the highest order

13
and these needs are found in those people whose previous four needs are satisfied.
This will include need for social service, meditation.
Figure 2.1 Abraham Maslow's
2.2.8 Expectancy Theory
The formal framework of expectancy theory was developed by Victor Vroom (1964).
This framework states basically that motivation plus effort leads to performance,
which then leads to outcomes. According to this theory, three conditions must be met
for individuals to exhibit motivated behavior and these include: effort to performance
expectancy must be greater than zero, performance to outcome expectancy must also
be greater than zero, and that the sum of the valances for all relevant outcomes must
be greater than zero. The Expectancy theory explains that in any given situation, the

14
greater the number and variety of rewards that are available to the employees, the
greater is the probability that extra effort will be exerted in attaining the set goals or
targets in the hope of getting the desired rewards (Kirunda, 2004). The concept of the
expectancy theory was first develop by Victor Vroom and was published in
1964.Victor Vroom offered an expectancy approach to the understanding of
motivation. As a result, motivation is a product of the anticipated value to a person in
an action. He perceived probability that the person’s goals would be accomplished as
a product of the anticipated value in an action. Thus the Vroom’ model is built around
the concepts of value, expectancy and force. The concept of force is on the whole
equivalent to motivation and may be shown to be the algebraic sum of the products of
valences and expectations thus,
Valence x Expectancy = Motivation (force)
Valence is the strength of an individual’s preference for an outcome or goal. The
strength may be negative (fear demotion or transfer to less important job) or positive
(prospect for promotion). Expectancy is the probability that a particular action will
lead to a required outcome. If the employee has a particular goal, some behavior has
to be produced to accomplish that goal. The employee has to weigh the likelihood of
various behaviors that will accomplish the desired goals and select the most
successful behavior. Thus the employee’s motivation according to Vroom may be
augmented by changing the perception or by boosting the expectancy level through
better communication and augmenting the actual reward that will result. Vroom’s
theory clarifies the relationship between the employee and the organizational goals
and recognizes the differences between employees in producing work motivation.
15
The Equity theory of motivation concerns on the people’s perception and feelings on
how they are treated as compared with others (Armstrong, 2008; Kirunda, 2004). The
argument is that people work well in accordance to what they regard as fair.
Employees consider whether management has treated them fairly, when they look at
what they receive for the effort they have made (Kirunda, 2004). Therefore employees
expect rewards or outcomes to be broadly proportional to their effort. Furthermore,
this theory is consistent with the idea that a manager’s job is to design an environment
for performance, necessarily taking into account the differences in various situations.
Thus Vroom’s theory is quite consistent with management by objectives. However,
this theory is difficult to research and is confronted with practical difficulties in its
application (Bose, 2004).
2.2.9Equity Theory
The Equity Theory states that employees expect fairness when being rewarded for the
work done. The theory was developed from the Hertzberg’s job satisfaction theory
and linked to the reward system by Adam Stacy. An important factor in employer’s
motivation is whether individuals perceive the reward structure as being fair. The
Equity theory essentially refers to an employee’s subjective judgment about the
fairness of the reward she/he got in comparison with the inputs (efforts, time,
education, and experience) when compared with others in the organization. William
illustrates this as follows; the formula below to illustrate the comparison.
Input (X) =Input (Y)
Reward (X) =Reward (Y)
Employee A compares the ratio of his/her input to his/her reward to that of employee
B. If he/she feels the ratios are similar, he/she is bound to be satisfied with the

16
treatment received. If he/she feels inadequately treated, he or she is bound to be
dissatisfied. This dissatisfaction is likely to breed tension and frustration in such
employees and their consequent performance may be negatively affected and this may
perhaps further lower rewards. Much as Employees must be rewarded, employers’
perception towards performance-based rewards can depend on many factors such as
politically rewarding someone because of his/her political affiliation, circumstantial
instances like one being in the right place at the right time and be rewarded with a
high office position, it can be gender sensitivity, it can be ethical, personal, such as
one being rewarded because of the relationship he/she has with the head teacher. The
factors can even be policy based in that some schools are led and not managed but
stagnant because there is a management blockage or poor management. The reasons
can vary or be a combination of all the above and many more.
2.3 Empirical Literature Review
The empirical evidence is plenteous as regard to how employees’ performance is
affected, numerous factors have been identified for instance it is found that,
employees’ performance is correlated with organizational culture, manager’s attitude,
job content, financial rewards and personal problems (Saeed, et al., 2013). On similar
vein Mustapha (2013) found that, financial rewards were positively related to job
satisfaction, and if employees are satisfied we expect them to perform high on their
jobs. According to Liu (2010) although the reward strategies are diverse, the data
collected was in favour of the treatise that reward strategies adopted by the Chinese
top IT companies was the explanation for their success. Ogedegbe, R. J. & Bashiru, B.
(2014), in their studied the result indicated that a cautious deliberation of job security,
prospect of career progression apart from monetary rewards is crucial for

17
organizational development and change in employee initiative and improve in
employee morale. Chepkwony, C. C. (2014) found that, both monetary and non-
monetary satisfactions were as central in job satisfaction. Those being the case
motivated employees are by default the ones that are going to perform highy on their
jobs. On a different level but on similar veins, further proof is provided that there is a
strong relationship between executive remuneration and various company
performance variables, such as total assets, turnover and share price (Scholtz & Smit,
2010). Other evidences indicated that for instance notably, Stathopoulus, et al. (2005)
found that there was a linkage between higher-performing companies and executive
remuneration, and that the linkage involving poorer-performing companies and
executive remuneration was feeble. Gregg, et al., (2005) also found the linkage
involving executive remuneration and company performance to be feeble. The
findings are as such mixed.
Furthermore, low ownership firms strongly reward positive returns with higher pay
but need no pay penalty for negative returns. In contrast, the higher ownership firms
come out to reward performance absolutely symmetrically. All the facts studied
indicated that senior managers earn the rewards of success while more junior
managers and workers have wages that are a great deal more weakly correlated with
company achievement (Bell & Reenen, 2012). It is also shown that the sensitivity of
pay to performance for senior managers depended in part on the level of institutional
ownership in the company. Those companies that have low institutional ownership do
not have a important linkage between pay and performance on average. However they
appear to reward positive company performance with wage rises at the same time as
not penalising bad performance. In contrast, companies with higher levels of

18
institutional ownership have a considerable stronger pay-performance linkage that
appears absolutely symmetric. These findings complement a variety of evidence that
suggests that external shareholder control matters, at least where it is missing or low
(Bell & Reenen, 2012). It has also been noted that an outcome-based remuneration
scheme augments productivity levels in the place of work, more particularly in the
financial sector; it was apparent that productivity can be motivated by way of an
outcome-based remuneration system, meaning that an outcome-based remuneration
system can add to levels of productivity in the place of work.
There are a variety of advantages and disadvantages of a pay for performance scheme
but the advantages unquestionably prevailed over the disadvantages. There is without
a doubt a momentous positive change in productivity levels when an outcome-based
remuneration scheme is initiated compared to a 100% fixed salary based system.
There was also a momentous change in absenteeism; absenteeism dwindled when the
outcome-based remuneration scheme was initiated, many can dispute that the grounds
for this is that employees felt that they could write their own paycheck enabling them
to feel that they are in control of their fate. The other two factors of overtime and
shortages and surpluses had no significant change during the period when outcome-
based remuneration was initiated versus a 100 percent fixed salary base (Naicker,
2012).
19
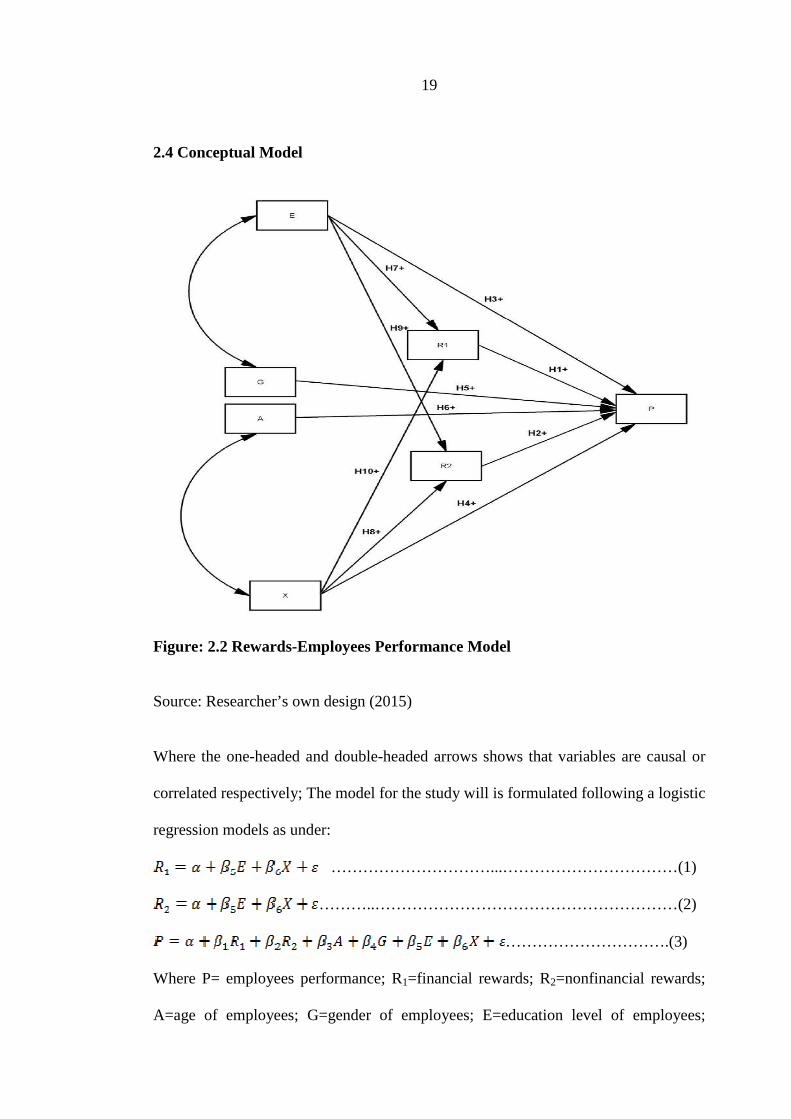
2.4 Conceptual Model
Figure: 2.2 Rewards-Employees Performance Model
Source: Researcher’s own design (2015)
Where the one-headed and double-headed arrows shows that variables are causal or
correlated respectively; The model for the study will is formulated following a logistic
regression models as under:
…………………………...……………………………(1)
………..…………………………………………………(2)
………………………….(3)
Where P= employees performance; R1=financial rewards; R2=nonfinancial rewards;
A=age of employees; G=gender of employees; E=education level of employees;

20
X=experience years of employees. And the are alpha constant, beter
coeficient and error term respectively. are used as control variables.
Therefore the research hypotheses are:
i) There is a positive effects of financial rewards on employees’ peformance at
BOT
ii) There is a positive effects of nonfinancial rewards on employees’ peformance
at BOT
iii) There is a positive effects of educational level of employees on employees’
peformance at BOT
iv) There is a positive effects of experience of employees on employees’
peformance at BOT
v) Employees’ gender affect employees’ performance differently at BOT
vi) There is a positive effects of age of employees on employees’ peformance at
BOT
vii) There is a positive effects of education level of employees on financial
rewards at BOT
viii) There is a positive effects of experience of employees on nonfinancial
rewards at BOT
ix) There is a positive effects of education level of employees on nonfinancial
rewards at BOT
x) There is a positive effects of experience of employees on financial rewards at
BOT
21
2.5 Research Synthesis and Gap
So based on that synthesis above this study will fill the following knowledge gap: as
there has been not study to the best of my knowledge that have attempted to address
the issues of financial and nonfinancial rewards and how they affects employees job
performance at the central bank of Tanzania, namely the Bank of Tanzania. Further,
the method that I employ to find and test relationships in this study is also to an extent
new to this type of study within Tanzania and tries to assess which theory is supported
within the Tanzanian context.

22
CHAPTER THREE
3.0 RESEARCH METHODOLOGY
Research could be defined as the methodical approach to obtaining and confirming
new and trustworthy knowledge. Research is a process that starts with a problem and
ends up with the problem either resolved or addressed (William, 2010). The study
employs both qualitative and quantitative research paradigms and philosophy. This
research method is “the procedures for coming to terms with the meaning not the
regularity of an occurrence by studying it in its social context.” a quantitative
approach is likewise used because it is essential to have the absolute values of certain
key issues during the research. Quantitative research method is based on the
measurement of quantity or amount. It is applicable to phenomena that can be
expressed in terms of quantity (William, 2010).
3.1 Study Area
This study will be done within Tanzania. It covers the central bank of Tanzania, Bank
of Tanzania (BOT) and its branches in Tanzania. The bank has a total of 6 branches,
which are Arusha branch, Mwanza branch, Mbeya branch, Dodoma branch, Training
Institute branch (in Mwanza) , Zanzibar branch and Headquarters (in DSM).
3.2 Research Design
The type of research strategy is a case study based research with the overall objective
of identifying the causes for the identified independent variables which have an
ultimate influence on the success of employees’ performance. The case study will be
based on the central bank of Tanzania, BOT (Bank of Tanzania).

23
3.3 Sampling Design
The kind of sampling design to be used is probability design using target population
(selection of respondents).
3.3.1 Study Population
The study will specifically base on Tanzania; the population will be that of BOT
personnel. It comprises of a total from the following categories of employees: 6 BOT
branches from Tanzania and BOT Headquarters are 1389 employees.
3.3.2 Sample Size
Stratified random sampling techniques will be used to find a representatives
group/sample for the study. This procedure will be used for the reason that, the nature
of the population is naturally organised into strata, to reduce variances of sample
estimates, to use non-partly random method, and to study the strata independently. It
is estimated that the sample size will be 67 employees who will be distributed from
the above mentioned population groups proportionally, and as calculated by the
formular below and indicated in the table 1: that follows.
3.3.3 Sampling Adequacy/Size
In order to ensure sample representativeness or adequacy, I will use the following
fomular as given by Milton (1986) as belows; thus in this study I will employ a total
of at least 67 employees: n employees as my sample, based on the formular below
adapted from (Milton, 1986) as follows:
;
Where;

24
The total sample is represented by =67 employees that will ensure at least 70% of
the R-squared. A number of independent variables in the model:
Percentage of variations in the model explained by the independent
variables:
Minimum addition to r-square, to assure a t-value of 2 or greater (p < .05):
Minimum t-value of 2 or greater; .
Strata sample sizes are determined by the following equation: ;
Where is the sample size for stratum s, is the population size for stratum s, N is
total population size, and n is total sample size.
Table 3.1: Sample Strata Distribution
Branches Population from strata Sample from strata Total 1389 67 Dar es salaam—headquarter 913 43 Mwanza branch 100 5 Arusha branch 93 4 Mbeya branch 98 5 Zanzibar branch 95 5 Dodoma branch 56 3 Training institute (Mwanza) 34 2 Source: Researcher’s own design (2015).
3.4 Data Collection Instruments
Questionnaire
A structured questionnaire is employed in this research as a tool to acquire
information on employee’s attitudes for what motivates those most to achieve better
performance at work. These questionnaires were made available to the employees and

25
they had time to answer the questions based on their views at the company. The
questionnaire had mutually opened and closed questions.
Interviews
In addition to the questionnaire more qualitative data was collected from a personal
interview. The interview was in three main sections, the background, work
motivation and re-wards in a semi structured approach. Subsequently categories of
questions were developed on specific topics; these semi-structured questions were
used as the interview guide The interviews started by letting managers to give brief
background aspects about themselves, company, their duties and how they coordinate
their employees.
3.5 Variable Measurements
The dependent variable is employees’ performance. It is measured based on 7 items 5
points likert scale. The independent variables are the financial rewards and
nonfinancial rewards; they are measured based on a 5 point likert scale. The control
variables are other motivational factors, the age, and gender and educational level of
respondents.
3.6. Validity and Reliability
Reliability is a measure of the degree to which a research instrument yields consistent
results or data after repeated results (Chronbach 1953; Kirunda 2004). It is the extent
to which a text or procedure creates similar results under constant conditions on all
occasions. There are several devices for checking reliability in scales and tests, such
as test-retest (administering the same test sometime after the first), the alternate forms
method (where equivalent versions of the same items are given and result correlated)
or the split half method (where the items are split into two matched halves and sores

26
then correlated) (Onashile, 2012). For instance asking the same thing in two different
questions in a questionnaire by reversing or negating one of the two to make sure the
respondents are answering the items consistently. This is done in the items for all the
variables in the questionnaire. The other method is to create a pilot-questionnaire to
test if the respondents will understand the items and will offer reliable answers. This
will be done where a small pilot questionnaire will be administered to a group of
knowledgeable persons to assess the reliability and provide comments on the ability
of the questions to measure what it is intended to measure. Further we shall ascertain
our instruments reliability by using Crochban’s Alpha. It will be calculated from
SPSS and their output reported where an alpha value of 70% or above would indicate
suitability of the items to be included in the analysis.
Validity is an altogether more complex concept. It portrays more whether an item
measures or describes what it is supposed to measure or describe. Therefore, if an
item is unreliable, then it must also lack validity, but a reliable item is not necessarily
also valid. It could produce the same or similar responses on all occasions, but not be
measuring what it is supposed to measure (Judith, 1999; Onashile, 2012). In order to
ascertain the validity of this research study, for data collection, it was made sure that
the selected respondents played pivotal role within the sector and have proper
knowledge about the topic. The interviewees will be briefed about one or two likely
questions to be expected and also tell about the likely time duration of the interview
as that will assist the respondents toward preparing their emotions and schedule
regarding the interview proper. Further, copies of the questionnaires consisting the
objectives of the study was given to two research supervisors at the faculty to find out
whether the instruments measured what it was meant to measure and also check on

27
the phrasing, understandability and wording of the statements. Content validity index
(CVI) will be used to establish whether the questionnaire will measure what it is
intended to measure. The content validity index (CVI) as in (Onashile, 2012) will be
found by considering the number of items declared relevant by Crochban’s Alpha
divided by total number of items presented. Overall, the questionnaires need to have
CVI index of above 0.7 which will guarantee acceptability of validity (Amin, 2005).
3.7 Data analysis and Analysis Designs
Results of the questionnaires on the general background information about the
respondents will be analyzed such as, age, full-time/part-time, gender, work
experience and position. These was entered into the SPSS and STATA spread sheet
software program in which they will be processed to have their respective frequency
on what they represent within the study institution. Further correlational and
regression analysis will be done to find cause-effects relationships between reward
system variables and employees’ performance variables.
Having the theoretical work in place and from the understanding of the different
motivational theories, two different analytical approaches could be used; the inductive
or the deductive approach. The approach used in this research is based on working
from the finding that is from responds to find a link with the theoretical work, and
finally coming out with a conclusion by reconciling the responds with the theories.

28
CHAPTER FOUR
4.0 DATA ANALYSIS, PRESENTATION AND DISCUSSION
This chapter deals with the analysis, presentations and discussion of the findings of
this research. It includes the descriptive statistics, characteristics of work motivation,
attributes of employees’ rewards, attributes of employees’ performance and effects of
the independent variables on the dependent variable, this among other issues.
4.1 Descriptive Statistics
The study aimed at obtaining a total of 67 respondents, but the questionnaires that
were collected were only 43, representing a response rate of 64%. Table below
indicates the cross tabulation of gender and education level of employees at BOT.
The sample was mainly composed of male by 66.7% and female by 33.3%. Male that
had postgraduate education were 62.5% while female only 37.5%. Refer table 4.1a
below.

29
Table 4.1a Gender Versus Education Cross Tabulation
Source: Data analysis (2015)
From the figure 4.1 below it is evident that there are more male employees with
graduate education than there are female. Majority of female are diploma or less than
diploma holder education. This indicates the gender disparity at BOT.
Gender
malefemale
Cou
nt
16
14
12
10
8
6
4
2
0
Education
diploma or less
graduate
postgraduate
Figure 4.1 Gender and Educational Levels
Source: Data analysis (2015)
9 2 3 14
64.3% 14.3% 21.4% 100.0%
50.0% 12.5% 37.5% 33.3%
21.4% 4.8% 7.1% 33.3%
9 14 5 28
32.1% 50.0% 17.9% 100.0%
50.0% 87.5% 62.5% 66.7%
21.4% 33.3% 11.9% 66.7%
18 16 8 42
42.9% 38.1% 19.0% 100.0%
100.0% 100.0% 100.0% 100.0%
42.9% 38.1% 19.0% 100.0%
Count
% within Gender
% within Education
% of Total
Count
% within Gender
% within Education
% of Total
Count
% within Gender
% within Education
% of Total
female
male
Gender
Total
diplomaor less graduate postgraduate
Education
Total

30
The analysis in table 4.1b below indicates that the average age of an employee at BOT
was 44.9 years with a maximum of 60 years and minimum of 25 years. The work
experience was on average 18.9 years with a maximum of 37 years and a minimum of
0.5 years. This indicates that the employees on average are well experienced in their
work.
Table 4.1b Employees’ age and Work Experience Levels
Source: Data analysis (2015).
4.2 Characteristics of Work Motivation at BOT
Table 4.2 below indicates a group of responses analysis on employees’ work
motivation. The analysis indicates that 37.9% of responses indicate that they were
motivated to work by the motivation strategies used by BOT at their work. While
32.2% strongly agreed to the same fact. These statistics indicate that employees at
BOT are motivated to work due to good motivation strategies that are used at the
bank.
Table 4.2 Employees’ Work Motivation Work motivation Count Percentage of
responses
Percentage of
cases Category label Code
Strongly
disagree
1 26 4.8 61.9
Disagree 2 33 6.1 78.6
Fair 3 102 19.0 242.9
Agree 4 204 37.9 485.7
Strongly agree 5 173 32.2 411.9
Total responses 538 100.0 1281.0
41 35.00 25.00 60.00 1842.00 44.9268 10.3836
43 36.50 .50 37.00 814.25 18.9360 10.9318
41
Age
Experience
Valid N (listwise)
N Range Minimum Maximum Sum Mean Std. Deviation

31
4.3 Attributes of Employees’ Reward System at BOT
In this study the first objective stated as follows;
i) To assess the attributes of employees’ reward system in the Bank of Tanzania
The attributes of characteristics of the employees reward system was analyzed. There
were two main categories of reward that were assessed, the financial rewards (such as
bonuses, incentives, salary increments, salary size) and nonfinancial rewards (such as
written or verbal recognition, praise, positive feedback, freedom to make decisions
and promotions.
Table 4.3a below indicates that by 36.6% employees agree that they knew how their
work success was measured. Only 2.4% did not know how they are measured.
Table 4.3a Knowledge of Success Measurements
Source: Data analysis (2015).
Table 4.3b below indicate that employees did not view that bonuses were important
than salary. 81.0% indicated that preference.
1 2.3 2.4 2.4
7 16.3 17.1 19.5
9 20.9 22.0 41.5
15 34.9 36.6 78.0
9 20.9 22.0 100.0
41 95.3 100.0
2 4.7
43 100.0
strongly disagree
disagree
fair
agree
strongly agree
Total
Valid
System Missing
Total
Frequency Percent Valid Percent Cumulative
Percent

32
Table 4.3b Importance of Bonuses Over Salary
Source: Data analysis (2015).
Table 4.3c below employees indicated that 23.8% of employees strongly agree that
extra efforts on work are recognised by management, making at least 47.6% agreeing
to that fact.
Table 4.3c Recognition of extra efforts
Source: Data analysis (2015).
The employees indicated that achievement celebrations were important to them by
72.1%. This indicated that nonfinancial rewards were significant to them as well
(table 4.3d).
1 2.3 2.4 2.4
4 9.3 9.5 11.9
17 39.5 40.5 52.4
10 23.3 23.8 76.2
10 23.3 23.8 100.0
42 97.7 100.0
1 2.3
43 100.0
strongly disagree
disagree
fair
agree
strongly agree
Total
Valid
System Missing
Total
Frequency Percent Valid Percent Cumulative
Percent
8 18.6 19.0 19.0
34 79.1 81.0 100.0
42 97.7 100.0
1 2.3
43 100.0
yes
no
Total
Valid
SystemMissing
Total
Frequency Percent Valid PercentCumulative
Percent

33
Table 4.3d Achievement Celebrations
Source: Data analysis (2015).
The analysis indicated that 60.5% of the employees were free to make decision while
the rest were not free to make decision probably indicating the portion of employees
that are non-decision making group. Table (4.3e).
Table 4.3e Work environment
Source: Data analysis (2015).
The table 4.3f below indicates that employees by at least 78.6% indicated that they
were motivated by financial rewards, indicating that financial rewards were
significant in promoting job performance.
26 60.5 60.5 60.5
17 39.5 39.5 100.0
43 100.0 100.0
free to make decision
not free to make decision
Total
ValidFrequency Percent Valid Percent
CumulativePercent
31 72.1 72.1 72.1
12 27.9 27.9 100.0
43 100.0 100.0
yes
no
Total
ValidFrequency Percent Valid Percent
CumulativePercent

34
Table 4.3f Motivation Through Financial Rewards
Source: Data analysis (2015)
The analysis indicated that employees at BOT were by 83.3% of opinion’s response
were motivated by nonfinancial rewards (table 4.3g).
Table 4.3g Motivation Through Nonfinancial Rewards
Source: Data analysis (2015)
Table 4.3h below indicates the collective responses for the reward system at BOT. the
analysis indicated by 33.0% and 25.8% that they agree and strongly agree respectively
that both financial and nonfinancial rewards motivated them to work and that
increased job performance at BOT.
3 7.0 7.1 7.1
2 4.7 4.8 11.9
16 37.2 38.1 50.0
14 32.6 33.3 83.3
7 16.3 16.7 100.0
42 97.7 100.0
1 2.3
43 100.0
strongly disagree
disagree
fair
agree
strongly agree
Total
Valid
System Missing
Total
Frequency Percent Valid Percent Cumulative
Percent
1 2.3 2.4 2.4
3 7.0 7.1 9.5
5 11.6 11.9 21.4
21 48.8 50.0 71.4
12 27.9 28.6 100.0
42 97.7 100.0
1 2.3
43 100.0
strongly disagree
disagree
fair
agree
strongly agree
Total
Valid
System Missing
Total
Frequency Percent Valid Percent Cumulative
Percent

35
Table 4.3h Employees’ Reward
employees rewards Count Percentage of
responses
Percentage of
cases Category label Code
strongly
disagree
1 30 9.0 71.4
Disagree 2 32 9.6 76.2
Fair 3 75 22.5 178.6
Agree 4 110 33.0 261.9
Strongly agree 5 86 25.8 204.8
Total responses 333 100.0 792.9
Source: Data analysis (2015).
4.4 Attributes of Employees’ Work Performance at BOT
This section analyses the characteristics of employee’s work performance at BOT. it
analyses these attributes in terms of quantity produced, quality produced, and
timeliness on work and productivity levels.
ii) To assess the attributes of employees’ work performance in the Bank of Tanzania
The employees at BOT indicated that by 48.7% employees quantity of work needed to
be done was met by the workers, while only 10.3% strongly agreed to this fact. This
generally indicates that the performance of work at BOT in terms of quantity that is
produced in on average met by the employees (table 4.4a).

36
Table 4.4a Quantity Produced Met
Source: Data analysis (2015)
Table 4.4b below indicated that in terms of quality of work production, 44.7% of
respondents agreed that quality produced did not require reworking or were not
rejected indicating that on average the quality of work is good, while only 13.2%
strongly agreed to this fact.
Table 4.4b Quality Produced Not Redone/Rejected
Source: Data analysis (2015)
Table 4.4c below indicates the timeliness of work. For a good performance work need
to be completed on time, the table indicated that 51.2% of respondents indicated that
work was accomplished on time, while 31.7% strongly agreed, thus work is done on
time and thus performance is on average high at BOT.
2 4.7 5.3 5.3
3 7.0 7.9 13.2
11 25.6 28.9 42.1
17 39.5 44.7 86.8
5 11.6 13.2 100.0
38 88.4 100.0
5 11.6
43 100.0
strongly disagree
disagree
fair
agree
strongly agree
Total
Valid
System Missing
Total
Frequency Percent Valid Percent Cumulative
Percent
2 4.7 5.1 5.1
3 7.0 7.7 12.8
11 25.6 28.2 41.0
19 44.2 48.7 89.7
4 9.3 10.3 100.0
39 90.7 100.0
4 9.3
43 100.0
strongly disagree
disagree
fair
agree
strongly agree
Total
Valid
System Missing
Total
Frequency Percent Valid Percent Cumulative
Percent

37
Table 4.4c Timely Completing Tasks
Source: Data analysis (2015)
The productivity and performance relationship was assessed at BOT, table below
indicates that there is a correspondence between the two aspects, 40.0% and 37.5%
agreed and strongly agreed respectively that that was the case (table 4.4d).
Table 4.4d Productivity-Performance Correspondence
Source: Data analysis (2015).
Table 4.4e below indicated that by 36.2% and 15.8% they agree and strongly agree
respectively that job performance at BOT is on average good.
1 2.3 2.5 2.5
1 2.3 2.5 5.0
7 16.3 17.5 22.5
16 37.2 40.0 62.5
15 34.9 37.5 100.0
40 93.0 100.0
3 7.0
43 100.0
strongly disagree
disagree
fair
agree
strongly agree
Total
Valid
System Missing
Total
Frequency Percent Valid Percent Cumulative
Percent
3 7.0 7.3 7.3
4 9.3 9.8 17.1
21 48.8 51.2 68.3
13 30.2 31.7 100.0
41 95.3 100.0
2 4.7
43 100.0
disagree
fair
agree
strongly agree
Total
Valid
System Missing
Total
Frequency Percent Valid PercentCumulative
Percent
38
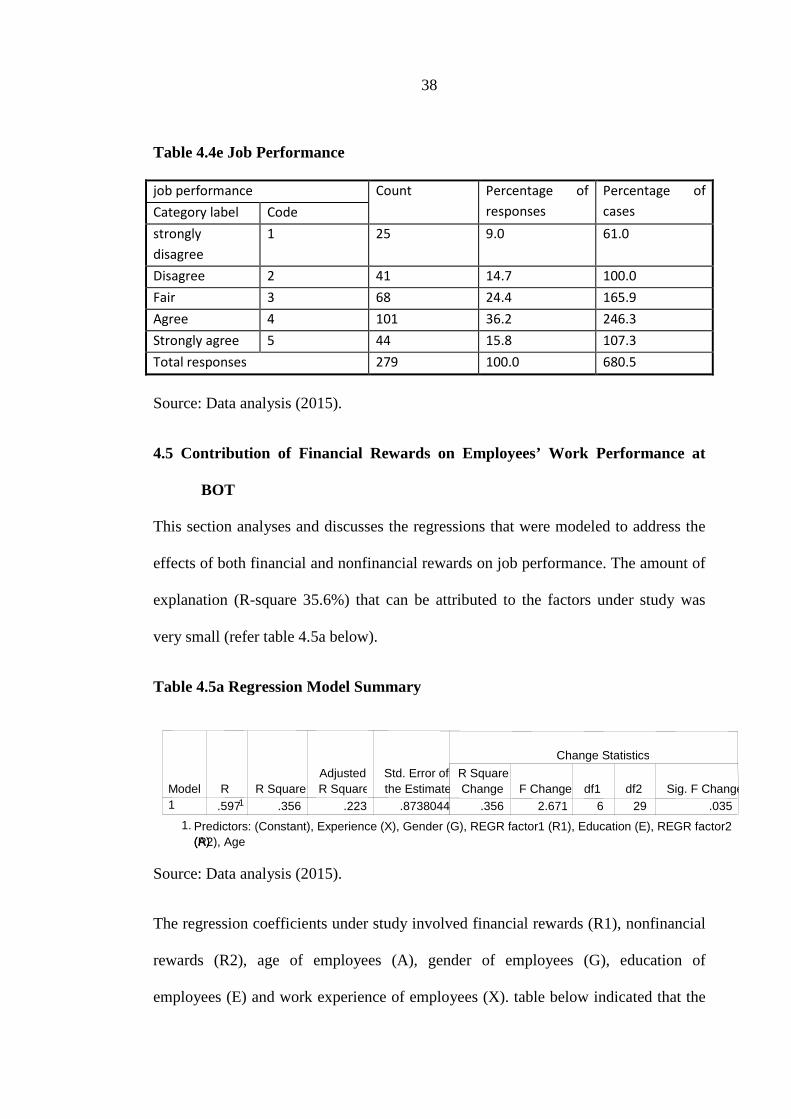
Table 4.4e Job Performance
job performance Count Percentage of
responses
Percentage of
cases Category label Code
strongly
disagree
1 25 9.0 61.0
Disagree 2 41 14.7 100.0
Fair 3 68 24.4 165.9
Agree 4 101 36.2 246.3
Strongly agree 5 44 15.8 107.3
Total responses 279 100.0 680.5
Source: Data analysis (2015).
4.5 Contribution of Financial Rewards on Employees’ Work Performance at
BOT
This section analyses and discusses the regressions that were modeled to address the
effects of both financial and nonfinancial rewards on job performance. The amount of
explanation (R-square 35.6%) that can be attributed to the factors under study was
very small (refer table 4.5a below).
Table 4.5a Regression Model Summary
Source: Data analysis (2015).
The regression coefficients under study involved financial rewards (R1), nonfinancial
rewards (R2), age of employees (A), gender of employees (G), education of
employees (E) and work experience of employees (X). table below indicated that the
.5971 .356 .223 .8738044 .356 2.671 6 29 .035Model1
R R Square AdjustedR Square
Std. Error of the Estimate
R SquareChange F Change df1 df2 Sig. F Change
Change Statistics
Predictors: (Constant), Experience (X), Gender (G), REGR factor1 (R1), Education (E), REGR factor2 (R2), Age (A)
1.

39
results were not significant which call for more study. But the directions were that a
100% change in financial rewards influenced a 3.3% change in work performance at
BOT. the same can be argued for nonfinancial rewards (+44.7%), while actually
education and experience has a negative impact on work performance (-14.0%) and (-
39.7%) of change on job performance respectively (table4.5b).
Table 4.5b Regression model-3 coefficients
Source: Data analysis (2015).
Thus, our third hypothesis was precisely dealing with this issue as clearly stated that;
iii) To assess the contribution of financial rewards on employees work performance
in the Bank of Tanzania
In order to visualise the effects of education and experience on financial rewards, the
analysis indicated that, education was positively related to financial rewards while
experience was negatively related to it. Thus according to table below, an 11.0%
increase in financial rewards can be attributed to education level, while a 29.0%
decrease in financial rewards can be attributed by work experience. Thus this
-.101 1.230 -.082 .9353.136E-02 .207 .033 .152 .881 .366 .028 .023
.433 .218 .447 1.987 .056 .505 .346 .296
4.030E-02 .037 .397 1.084 .287 -.006 .197 .162
-.421 .317 -.210 -1.326 .195 -.127 -.239 -.198
-.178 .204 -.140 -.871 .391 -.243 -.160 -.130-3.708E-02 .036 -.397 -1.044 .305 -.152 -.190 -.156
(Constant)REGR factor1 (R1)
REGR factor2 (R2)Age (A) Gender (G) Education (E) Experience (X)
Model 1
B Std. Error
UnstandardizedCoefficients
Beta
Stan dardized
Coefficient
st Sig. Zero-order Partial Part
Correlations
Dependent Variable: REGR factor3 (P)

40
indicated that experience did not very much matter to the increament of ones financial
rewards (table 4.5c).
Table 4.5c Regression model-1 coefficients
Source: Data analysis (2015).
………………………………………………………(1)
The table 4.5b (above) summarises the effect of financial rewards on job performance
and indicated that financial rewards were positively responsible in influencing job
performance at BOT.
……………………….(3)
This result is consistent to the arguments of Naicker (2012) who contend that the use
of performance pay schemes by employers has been shown to increase workers’
productivity, effort and earnings. The focus has shifted in recent years from rigid
salary scales, compulsory insurance and uniform benefits to pay for performance, pay
for talent and productivity based incentives. The trend today is to regard all employee
remuneration and benefits as rewards rather than benefits or entitlements and to align
these with performance business results.
.249 .440 .566 .575
.143 .209 .110 .683 .499 .053 .112 .108
-2.665E-02 .015 -.290 -1.803 .079 -.268 -.284 -.284
(Constant)
Education (E)
Experience (X)
Model 1
B Std. Error
UnstandardizedCoefficients
Beta
Standardized
Coeff icient
s
t Sig. Zero-order Partial Part
Correlations
Dependent Variable: REGR factor1 (R1) .
41
The main objective for the compensation strategy is to give the right rewards for the
right employee behaviours. Compensation can be seen as an important motivating
factor when trying to drive the right behaviour in employees which is to encourage
employees to perform at their best. Rewarding employees who increase productivity
or efficiency provides an incentive for other employees who want to achieve what the
top employees are achieving. Rather than rewarding every employee with the same
salary, outcome-based remuneration rewards the individual worker for extraordinary
efforts (ibid).
Employees started to work during busy periods of the day as they realised the more
they do the more reward they got. This helped move queues much faster which
resulted in better customer service. The outcome-based remuneration scheme created
a more competitive working environment, some might argue that this could be
detrimental to the organisation as team work gets neglected, but it actually fostered a
spirit of winning which from the empirical evidence it was quite evident that
productivity levels increased significantly (ibid).
4.6 Contribution of nonfinancial rewards on employees’ work performance at
BOT
In this section the analysis considers the contribution of education (E) and experience
(X) to nonfinancial rewards in an attempt to address the effects of nonfinancial
rewards to employees’ job performance.
iv) To assess the contribution of nonfinancial rewards on employees work
performance in the Bank of Tanzania

42
Table 4.5d Regression Model-2 Coefficients
Source: Data analysis (2015).
………………………………………...…………… (2)
Based on the table 4.5b (above), nonfinancial rewards (R2) were assessed indicating
that they contributed positively by 44.7% change to job performance. This indicates
that nonfinancial rewards are important in influencing employees’ job performance at
BOT.
……………………….(3)
Other nonfinancial aspects that motivate employees to work or the reasons that
motivated employees at work that were cited were; team work, salary and related
payments, working condition, health/life insurance benefits and training financed by
employer, salary, safe working environment, better salary, good working condition
and environment, and good remuneration (pay), good medical care, availability of soft
loans (vehicle, house, personal loans), participation, achievements, interaction,
creativity, leadership, service, for the case of achievement: they like challenging tasks
with clear goals, and specific measures of success. The tasks have a clear beginning
and end, rather than the work which is continuous and ongoing. Want to be
.607 .439 1.381 .175
-7.438E-02 .209 -.057 -.356 .724 -.112 -.058 -.056
-2.566E-02 .015 -.278 -1.738 .091 -.290 -.275 -.273
(Constant)
Education (E)
Experience (X)
Model 1
B Std. Error
UnstandardizedCoefficients
Beta
Standardized
Coeff icient
s
t Sig. Zero-order Partial Part
Correlations
Dependent Variable: REGR factor2 (R2) a.

43
recognized for my accomplishments and like working for a manager who appreciates
their abilities, also the one who can tell their weaknesses. Trustworthy leadership,
leaders that are looking out for their best interests – will win their trust. Trust is a
powerful motivational tool and is more transparent to find surprising results and new
types of opportunities to develop their talent. Career advancement: they are extremely
motivated to achieve if this means that advancement awaits them. This requires them
to get opportunities that lie around, beneath and beyond what they can seek. Earning
living and happiness: their motivation to achieve is ultimately based on earning a
living that brings them tremendous joy and satisfaction. Happiness fuels them self-
esteem and gives them hope for a better tomorrow.
Interaction; they enjoy frequent and friendly interaction with others. They prefer jobs
where the work requires face-to-face (or at least voice-to-voice) contact with people.
Creativity; they argued that they like value jobs that involve varied duties and
opportunities to innovate. They get bored with repetition, like finding new ways to do
familiar tasks, and enjoy brainstorming sessions. Service; they are largely motivated
by the opportunity to help others or make the world a better place. For them, work is
not a job, but a mission. They want to feel that activities or efforts ultimately have a
positive impact on people. Problem solving; tackling complex and challenging
problems is a motivating factor for them. Stable future; they are motivated to have
safety and security. Everyone wants a stable future, but you never know when time
will pass you by. That’s why they are all in a race against time and thus motivated to
achieve faster than ever before.

44
4.7 Research Hypotheses Tests
This section tests and discusses the hypotheses that were hypothesised in this study
based on regression equation 3 below.
………………………………
……….(3)
Where P= employees performance; R1=financial rewards; R2=nonfinancial rewards;
A=age of employees; G=gender of employees; E=education level of employees;
X=experience years of employees. And the are alpha constant, beter
coefficient and error term respectively. are used as control variables.
Therefore the research hypotheses were confirmed as follows:
i) There is a positive effects of financial rewards on employees’ peformance at
BOT. The results indicated a positive but insignificant effect on emplyees’
performance.
ii) There is a positive effects of nonfinancial rewards on employees’ performance
at BOT. The results indicated a positive but insignificant effect on
employees’ performance.
iii) There is a positive effects of educational level of employees on employees’
performance at BOT. The results indicated a negative but insignificant effect
on employees’ performance.
iv) There is a positive effects of experience of employees on employees’
performance at BOT. The results indicated a negative but insignificant effect
on employees’ performance.

45
v) Employees’ gender affect employees’ performance differently at BOT
The results indicated a negative effect that is male employees worked
more compared to female employees
vi) There is a positive effects of age of employees on employees’ performance at
BOT
The results indicate a positive but insignificant effect on employees’
performance
vii) There is a positive effects of education level of employees on financial rewards
at BOT
The results indicated that education level positively affected financial
rewards, however results were not significant
viii) There is a positive effects of work experience of employees on nonfinancial
rewards at BOT
The results indicated that work experience negatively affected nonfinancial
rewards, however results were not significant
ix) There is a positive effects of education level of employees on nonfinancial
rewards at BOT
The results indicated that education level negatively affected nonfinancial
rewards, however results were not significant
x) There is a positive effects of experience of employees on financial rewards at
BOT

46
The results indicated that work experience negatively affected financial
rewards, however results were not significant.
4.8 Conclusions
From the analysis of the study above, it is evident therefore that financial rewards
positively affect employees’ job performance. Similarly nonfinancial rewards have
the same impact on employees’ job performance at BOT. Thus, it is crucial that
managers of the bank pay attention on the way they reward their employees in order
to boost job performance, but it is often time that nonfinancial rewards are ignored by
managers in many organization, this study provides evidence that they are important
in improving job performance.

47
CHAPTER FIVE
5.0 CONCLUSIONS RECOMMENDATIONS
The research findings leads to the conclusion and implications for our objectives, this
section discusses how the specific objectives have been attained and point out
recommendations and spell out what was not attained that need further study.
5.1 Conclusions
The specific objectives of the study were attained as it is specifically outlines below;
the specific objectives of the study are stated and shown how they were attained as
follows:
i) To assess the attributes of employees’ reward system in the Bank of Tanzania
The attributes or characteristics of the BOT reward system were assessed and it
was found that the employees knew how they were rewards, the system was open.
They further indicated that extra efforts in work were rewarded accordingly. They
indicated as well that both financial and nonfinancial rewards were important in
their work performance, as it motivated them to work more.
ii) To assess the attributes of employees’ work performance in the Bank of Tanzania
The study found that the characteristics of work performance at BOT was
measured based on quantity produced, quality of work, timeliness on
accomplishing tasks and the productivity of the employees. It was found that
based on these criteria above the employees on average performed well. And were

48
able to produce specified quantity of work with good quality and on time and thus
they indicated a labour force that was highly productive.
iii) To assess the contribution of financial rewards on employees work performance
in the Bank of Tanzania
The study found that financial rewards had a positive effects on employees’ job
performance at BOT, that is the more the financial rewards were available to them
the more they indicated willingness to work more. And thus financial rewards are
important for the maintenance of job performance at BOT.
iv) To assess the contribution of nonfinancial rewards on employees work
performance in the Bank of Tanzania
The study indicated that the role of nonfinancial rewards cannot be
underestimated. They play important positive effects on employees’ job
performance. The more such rewards are given the more employees were
motivated to work. And thus it has a great deal of implications on worker’s
productivity.
5.2 Recommendations
The study came up with the following recommendations that need to take into effects
or an effective management of employees’ job performance at BOT and any work
organization. First, employees’ motivation to work is influenced by among other
things the reward system in place, knowing that there is a specific rewards system is
as important and providing the rewards themselves, thus management need to be more
transparent on how they reward their employees, since that in effect creates
expectation. Second, once the expectation is created by the transparent system,

49
employees consider rewards as significant for and need to be timely delivered to
them. Third, both financial and nonfinancial rewards are significant in promoting job
performance. Bonuses, salary increments, salary size (financial rewards) and verbal
and written appraisals, celebrations and recognition (nonfinancial rewards) are equally
important to employees when it comes to job performance, financial rewards may be
the reason why they stay with an organization while nonfinancial rewards may be the
reason why they tolerate to stay with the reason, they are encouraged to stay through
them. Lastly, surely to plan for the rewards and having a clear rewards system in an
organization is not only significant but a must in order to survive and compete
successfully as an organization, thus manager need not to shy away from investing
resources into this important function within organizations especially work
organizations with highly demanding tasks such as a bank, not to mention a central
banks such as BOT.
5.3 Areas for Further Studies
The study came up with more issues that it could not answer which probe for more
study and research; and these are as follows;
i) To study the effects of transparency on the reward system on the performance
of employees.
ii) To study the contribution of level and range of financial rewards and their
specific effect on workers motivation on work performance.
iii) To study identify other factors other than rewards that are instrumental in
influencing job performance in work organization particularly BOT because the
findings of the study in this case were not statistically significant as indicated in
the analysis but also, the amount of explanation that could be attributed to these

50
two factors was very small, indicating the presence of other reason that could
account for the remain effects.
iv) There are more other reasons for work performance that were identified in
section 4.6, these need to be imperially tested at BOT.
v) Despite reward system what would be the role of punishment system on job
performance?
51
REFERENCES
Abraham H. Maslow.1972. "A Memorial Volume" Monterey, CA: Brooks/Cole.
Amin, E. M. (2005). Social Science Research, Conception Methodology and
Analysis,
Armstrong, M. (2002). Employee reward 3rd edition. Cromwell Press.
Armstrong, M. (2008).. How to Be an Even Better Manager: A Complete A-Z of
Proven Techniques 7th edition. Kogan Page Limited.
Bank of Tanzania. (2014). Directors report and financial statements for the year ended
30th June 2014. Dar es salaam, Tanzania.
Bell, B and Reenen, J. V. (2012). Firm Performance and Wages: Evidence from
Across the Corporate Hierarchy, CEP Discussion Paper No 1088, London
School of Economics and Political Science. London, United Kingdom.
Bose, C. D. (2004). Principles of Management and Administration. Prentice-Hall of
India Limited.
Chepkwony, C. C. (2014). The relationship between rewards systems and job
satisfaction a case study at teachers service commission-kenya. European
Journal of Business and Social Sciences, 3(1), 59-70,
http://www.ejbss.com/recent.aspx
Ethridge, D. E. (2004). Research methodology in applied economics: organizing,
planning, and conducting economic research. Wiley-Blackwell, Inc.
Flamholtz, E. (1996). Effective management control: theory and practice. Springer,
Inc.

52
Gregg, P., Jewell, S. & Tonks, I. (2005). Executive pay and performance in the UK
1994–2002’, CMPO Working Paper Series, 05(122). [Online] Available at:
http://people.exeter.ac.uk/ipt201/research/Executive%20Pay_Performanceup
date6.pdf 05(122).
Griffin, R. W. (2006). Management. Cengage Learning, Inc.
Hsieh, F. Y., Bloch, D. A., & Larsen, M.D. (1998). A simple method of sample size
calculation for linear and logistic regression. Statistics in medicine 17, 1623-
1634.
Judith, B. (1999). “Doing Your Research Project”. Open University Press. 3rd
Edition.
Kirunda, H. K. (2004). Performance-based rewards and the performance of tearchers
in private secondary schools in Kampala district. Unpublished dissertation.
Liu, Y. (2010). Reward strategy in Chinise IT Industry. Internaltional journal of
business and management, 5(2), 119-127.
Milton, S., (1986). A sample size formula for multiple regression studies. The Public
Opinion Quarterly. 50(1), 112-118, Oxford University Press, URL:
http://www.jstor.org/stable/2748974,also http://www.jstor.org/page/info
/about/policies/terms.jsp.
Mustapha, N. (2013). The influence of financial reward on job satisfaction among
academic staffs at public universities in Kelantan, Malaysia. International
Journal of Business and Social Science, 4(3), 244-248.

53
Naicker, C. G. (2012). The impact of an outcomes based remuneration scheme on
performance in the financial sector. MBA dissertation. North-West University,
United Kingdom.
Ogedegbe, R. J. & Bashiru, B. (2014). Fostering employee morale through effective
remuneration practices. European Journal of Business and Management,
6(16), 112-115.
Onashile, A. O. (2012). The frequent labour turnover in insurance companies in
Nigeria: case of Nigerian insurance sector. Unpublised dissetation/thesis
University of Younde Cameroon.
Saiyadain, M. (2009). Human Resources Management. McGraw-Hill, Inc.
Saeed, R., Mussawar,S., Lodhi,R.N., Iqbal,A., Nayab, H.H. and Yaseen, S. (2013).
Factors Affecting the Performance of Employees at Work Place in the
Banking Sector of Pakistan, Middle-East Journal of Scientific Research 17
(9): 1200-1208, DOI: 10.5829/idosi.mejsr.2013.17.09.12256.
Scholtz, H. E. & Smit, A. (2012). Executive remuneration and company performance
for South African companies listed on the Alternative Exchange (AltX).
Southern African Business Review, 16(1), 22-38.
Srivastava, S. K. (2005). Organizational Behaviour and Management. Sarup & Sons,
Inc.
Stathopoulus, K., Espenlaub, S. & Walker, M. 2005. ‘The compensation of the UK
executive: Lots of carrots but are there any sticks’, Competition and Change,
9(1): 89–105.
Vroom, V. (1964). “Work and motivation”. New York, NY: Wiley.1st edition.

54
William, A. N. (2010). Employees’ motivational and performance. Unpublished
thesis.
Wilson, T. B. (2003). Innovative reward systems for the changing work place.
McGraw-Hill, Inc.
Ying, Z. Y. (2012). The impact of performance management system on employee
performance. Unpublished master thesis.

55
APPENDIX
1. QUESTIONNAIRE FOR BACKGROUND INFORMATION
1. Gender
a) Female__________
b) Male___________
2. Age ______________
3. Educational level _______________
4. Position ____________
5. How long have you been working for the BOT _______________
WORK MOTIVATION
6. What motivates you most at work?
_____________________________________________________________________
___________________________________________________________________
7. What do you think about taking risk?
_____________________________________________________________________
_________________________________________________________
8. How does your job enable you to fulfill your basic needs?
_____________________________________________________________________
_________________________________________________________
9. How does your employer encourage you to work?
_____________________________________________________________________
_________________________________________________________
10. I prefer my job environment to be (Please select one)

56
a) Free to make decisions so I have more responsibilities
b) Hierarchy so I have to work according to instructions given
REWARDS
11. What do you think is the essence of incentive to you?
_____________________________________________________________________
_________________________________________________________
12. Do you think bonuses are more important than your salary why?
_____________________________________________________________________
_________________________________________________________
13. Are BOT achievement celebrations important to you why?
_____________________________________________________________________
_________________________________________________________
14. What other reward aspect beside wages do you think it is important for you?
Why?
_____________________________________________________________________
_____________________________________________________________________
15. Do you perceive tangible and intangible rewards equally? Why?
_____________________________________________________________________
_________________________________________________________
16. Could you answer the questionnaire by rating the following statements by ticking
only one appropriate box on the side of each question, where 1= strongly disagree, 2 =

57
Disagree, 3 = fair, 4 = Agree, 5 = strongly agree, which best corresponds with your
opinion.
What is your opinion for the following Rating Scale
WORK MOTIVATION
My company provide fair promotion
opportunities
1 2 3 4 5
Promotion should be based on
performance
1 2 3 4 5
My job is beneficial to my career 1 2 3 4 5
My boss allows me to have my ability
fully utilize
1 2 3 4 5
It’s enjoyable to go to work 1 2 3 4 5
I have the possibility to be promoted in
my work
1 2 3 4 5
I like more challenging task at work 1 2 3 4 5
I am well aware of the bank
comprehensive goals
1 2 3 4 5
I am satisfied with the working condition 1 2 3 4 5
My boss is good in communicating
information
1 2 3 4 5
It is essential for managers empower
employees
1 2 3 4 5
The bank value my service 1 2 3 4 5

58
I am happy with my salary 1 2 3 4 5
REWARDS
I know how my success was measured 1 2 3 4 5
Bonuses should not be part of the bank
policy
1 2 3 4 5
My boss recognizes the extra effort I put
at work
1 2 3 4 5
Rewards should be based on performance 1 2 3 4 5
Financial rewards: bonuses, incentive
pays motivate me to work
1 2 3 4 5
Financial rewards: salary increaments,
salary size motivate me to work
1 2 3 4 5
Nonfinancial rewards: writted or verbal
recognition, praise, positive feedbacks
motivate me to work
1 2 3 4 5
Nonfinancial rewards: promotions, other
organizational opportunity motivate me
to work
1 2 3 4 5
EMPLOYEES’ JOB PERFORMANCE
Quantity produced: There is a percentage
of work output that is not produced
within a given task/job
1 2 3 4 5
Quantity produced: There is a percentage 1 2 3 4 5

59
of work output that is produced within a
given task/job
Quality produced: There is a percentage
of work output that must be redone or is
rejected by supervisor
1 2 3 4 5
Quality produced: There is a percentage
of work output that must be do not to be
redone or is not rejected by supervisor
1 2 3 4 5
Timeliness: I complete my tasks/jobs on
time
1 2 3 4 5
Timeliness: I do not complete my
tasks/jobs on time
1 2 3 4 5
Productivity: My labour productivity as
an indicator of my performance
corresponds to my job performance
1 2 3 4 5

60
INTERVIEW QUESTIONS
A. BACKGROUND INFORMATION
1. Can you brief me a bit about your organization?
2. What is your position within the bank?
3. What duties do you carry out in the bank?
4. How often do you have general meetings with the employees?
B. WORK MOTIVATION
5. How do you assess your own motivation as a factor for employee performance?
6. How do you assess employee motivation as a factor for employee performance?
7. How often do you communicate with employees?
8. Are there motivational tools? If yes, please list ……
9. Do you consider it important communicating to the staffs? How?
10. What factors affect the attitude of employees either positive or negative?
11. Have you realized any changes in employee performance in the past two years?
12. Would you encourage employees in decision-making? How?
13. Is it the responsibility for the manager to motivate the employees? How?

61
C. REWARDS
14. How is the incentive system for the managers’ structure at your bank?
15. What types of differences exist in the motivation of an employee who has been for
a long time with the company and those who have just arrived?
16. What type of reward system you have in the company?
a) Financial
b) Nonfinancial
17. Is there any need for improvement for the reward system?