Embed Size (px)
Citation preview

The Impact of Shareholder Power on Bondholders:
Evidence from Mergers and Acquisitions
Angie Low Fisher College of Business, The Ohio State University
Nanyang Business School, Nanyang Technological University
Anil K. Makhija*
Fisher College of Business, The Ohio State University
Anthony B. Sanders Fisher College of Business, The Ohio State University
March 14, 2007
_____________________________________________________________________________________ Abstract
Takeovers result in the transfer of bondholders’ claims from the target to the acquiring firm, providing a setting to examine the impact of shareholder power on bondholders. We find that excess returns to target bondholders at M & A announcements are positively related to the holdings of the top 5 acquirer institutional owners, a measure of shareholder power. This supports the view that stronger shareholder power, through superior monitoring of managers, can be beneficial to bondholders as well. Our findings are robust to various proxies for shareholder power, adjustments for endogeneity, controls for target shareholder power, and other controls for firm and deal characteristics that have been shown to affect bondholders’ wealth during takeovers. JEL Classification: G34 Keywords: Corporate Governance, Bondholders, Mergers and Acquisitions
_____________________________________________________________________________________ _____________________________________________________________________________________
Corresponding author: Anil K. Makhija, Rismiller Professor of Finance, Department of Finance, Fisher College of Business, The Ohio State University, Columbus, Ohio 43210. Tel: (614) 292-1899. Email address: [email protected]. We are thankful to Jay Hartzell, David Hirshleifer, Tomas Jandik, Gilberto Louriero, Rajesh Narayanan, René Stulz, and participants at presentations at the European Financial Management Conference (2006), Arizona State University, and a doctoral seminar at the Fisher College of Business, The Ohio State University, for helpful comments. All errors are our own.

The Impact of Shareholder Power on Bondholders:
Evidence from Mergers and Acquisitions
_____________________________________________________________________________________ Abstract
Takeovers result in the transfer of bondholders’ claims from the target to the acquiring firm, providing a setting to examine the impact of shareholder power on bondholders. We find that excess returns to target bondholders at M & A announcements are positively related to the holdings of the top 5 acquirer institutional owners, a measure of shareholder power. This supports the view that stronger shareholder power, through superior monitoring of managers, can be beneficial to bondholders as well. Our findings are robust to various proxies for shareholder power, adjustments for endogeneity, controls for target shareholder power, and other controls for firm and deal characteristics that have been shown to affect bondholders’ wealth during takeovers. JEL Classification: G34 Keywords: Corporate Governance, Bondholders, Mergers and Acquisitions
_____________________________________________________________________________________

1
The Impact of Shareholder Power on Bondholders:
Evidence from Mergers and Acquisitions
“Shareholder-friendly activity … is a clear credit risk,”
Tom Sullivan, Viacom Debt Gets Good Reception,
The Wall Street Journal, April 6, 2006, p. C4.
1. Introduction
There are compelling reasons to study the impact on bondholders of one important aspect of
corporate governance – shareholder power (or control), which is shareholders’ ability to enforce actions
on managers that maximize their wealth. Going as far back as Berle and Means (1932), and reiterated
notably by Roe (1994), it has been claimed that stock ownership in the U.S. is too dispersed and
shareholders too weak to effectively control managers. More recently, in the aftermath of serious
managerial misconduct at large U.S. corporations, e.g., Enron, Tyco, and WorldCom, the Sarbanes Oxley
Act of 2002 has been enacted to better monitor managers and strengthen shareholder control. However,
with a potential for unintended consequences, the implications of stronger shareholders for bondholders
have been ignored.
While stronger shareholders may mitigate managerial agency problems to the benefit of both
shareholders and bondholders, they can also aggravate shareholder-bondholder conflicts to the detriment
of bondholders, as suggested in the above quote from the Wall Street Journal. But, in contrast to a large
literature specifically devoted to the impact on shareholders of their power relative to managers,
invigorated by the development of governance indexes by Gompers, Ishii, and Metrick (2003) and
Bebchuk, Cohen, and Ferrell (2005), we are only beginning to understand how this power affects
bondholders (Denis and McConnell, 2003). Yet, debt is the primary source of financing for most firms,
and shareholder power is expected to affect both the ratings and cost of debt capital, with far reaching
consequences for the investment and financing decisions of firms.
Finally, an understanding of the impact of shareholder power on bondholders is particularly
important in the context of mergers and acquisitions (M & A’s). M & A’s redeploy real assets by
rearranging ownership and control rights. Bondholders have to rebase and revalue their claims according
to the new corporate governance structure of the merged firm. Consequently, attempts to understand if a
merger creates value and for whom -- a subject of considerable ongoing interest (e.g., Moeller,

2
Schlingemann, and Stulz, 2005) -- must also take into account how target bondholders will fare when they
face a new set of shareholders at the acquiring firm after the takeover.
The literature has so far attributed two main opposing effects to shareholder power, with the net
effect on bondholders being an empirical issue. On the one hand, in what we call the Managerial
Monitoring Hypothesis, greater shareholder power can reduce managerial agency costs and improve
collateral value. This lowers the likelihood of default, and enhances the value of bondholders’ claims.
Shareholders can use their power to reduce managerial perk consumption and shirking, and prevent
management from empire-building through poor investments (Jensen and Meckling, 1976, and Jensen,
1986). On the other hand, according to the Bondholders’ Wealth Expropriation Hypothesis, stronger
shareholder power can be used to expropriate bondholders’ wealth by pushing through riskier
investments, raising leverage with a consequent higher probability of default, increasing payouts such as
dividends and repurchases, and other actions that managers would otherwise prefer to avoid.1
The empirical evidence as to which effect dominates is mixed, based on the three studies focused
on the impact of shareholder power on bondholders (Bhojraj and Sengupta, 2003 (BS), Klock, Mansi, and
Maxwell, 2005 (KMM), and Cremers, Nair, and Wei, 2007(CNW)).2 Throughout the paper, we compare
our analysis and findings with BS, KMM, and CNW. BS conclude in favor of the Managerial Monitoring
Hypothesis when they find that firms with greater shareholder power -- firms with higher institutional
ownership and greater board independence -- have higher bond prices. Also, supporting the Managerial
Monitoring Hypothesis, CNW find that, when the firm is protected from takeover, stronger shareholder
power – indicated by the presence of an institutional blockholder -- has a positive effect on bond values.
However, for firms vulnerable to takeover, CNW report that the presence of an institutional blockholder
adversely affects bondholders, which is consistent with the Bondholders’ Wealth Expropriation
Hypothesis. Similarly, BS, although they do not distinguish between firms by takeover vulnerability, also
find that the holdings of institutional blockholders (and other forms of concentrated institutional
ownership) have a negative effect on bond values and ratings. Also supporting the Bondholders’ Wealth
Expropriation Hypothesis, KMM find that firms with stronger shareholder rights, as measured by a low
G-Index (Gompers, Ishii, and Metrick, 2003) in their case, have lower bond prices.
The issue of how shareholder power impacts bondholders deserves additional attention. Besides
the limited and conflicted evidence available so far, the extant work is vulnerable to the criticism that
Demsetz and Lehn (1985) level against cross-sectional studies that relate firm values to various ownership
measures (e.g., Morck, Shleifer, and Vishny, 1988, and McConnell and Servaes, 1990). Each of the three
1 We also consider the common interests that managers and bondholders may have to avoid risks and other activities that can lower the value of their fixed claims on the firm. 2 In addition, other studies, such as by Anderson, Mansi, and Reeb (2002) on the impact of founding families on the agency cost of debt, focus on special cases of share ownership.

3
previous studies on the impact of shareholder power on bondholders employs essentially the same
methodology, regressing bond yields (or ratings) on different measures of shareholder power. Plausibly,
endogeneity in the form of reverse causality is present here. It may be argued that it is corporate
governance structures, and consequent shareholder power, that are drawn to bonds with certain yields (or
ratings), and not that bond yields (or ratings) are caused by shareholder power. Indeed, there is empirical
evidence suggestive of this endogeneity problem. BS find that firms with high yield bonds have lower
institutional ownership in the subsequent year. Recognizing this endogeneity problem, previous
researchers adopt econometric approaches to address it. For example, BS utilize simultaneous equations
with a 3SLS methodology. KMM use a fixed effects model and employ a 2SLS procedure. These
remedies raise their own concerns regarding the specifications of the models used and their efficacy, an
important aspect that remains ignored. Indeed, Bhagat and Jeffries (2002) and Coles, Lemmon, and
Meschke (2005) suggest that such standard econometric remedies for endogeneity and causation in these
situations are ineffective.
We offer a new approach by examining the impact of shareholder power on bondholders during
takeovers. This approach has several advantages. Earlier studies relate bond yields (or ratings) to
shareholder power without examining the mechanism through which bondholders’ wealth is ultimately
affected. Masulis, Wang, and Xie (2007) have noted this similar black box nature of studies on the
relation between shareholder values and measures of shareholder power (such as the G-Index). Instead,
we study a major event in which the role and impact of corporate governance can be explicitly examined.
As debt claims on the target are transferred to the acquirer as a result of the takeover, we can track the
returns and ratings of individual target bonds from before to after the merger. Thus, the M & A setting
provides a unique opportunity to study the impact of a crucial change experienced by target bondholders -
- a change in shareholder power, as their claims become the responsibility of a new set of acquiring
shareholders. The wealth effects from these changes in shareholder power are reflected in excess bond
returns and observable changes in ratings in the period surrounding the announcement of the M & A’s.
In addition, in this setting reverse causality does not pose a serious problem either. Given the event study
nature of our experiment, target bond price reactions capture the unanticipated impact of a change in
corporate governance. By utilizing a merger event to exogenously shock target bond values with varying
preset acquirer ownership structures, we are able to observe the marginal response of target bond values.
In an efficient market, it may be argued that it is only the shareholder power at the acquirer that matters,
since target shareholder power is already impounded in target bond values. Thus, we emphasize acquirer
shareholder power in our baseline analysis. Even so, we also control for target shareholder power and for
differences in shareholder power between acquirer and target, and confirm our baseline findings. Also, as
a robustness check against reverse causality, we use several variations of acquirer institutional ownership

4
that take into account whether the holdings are temporary or permanent. We focus on short-term bond
price reactions surrounding the takeover announcement because of the problems with methodologies for
estimating long term returns (Fama, 1998, and Lyon, Barber, and Tsai, 1999).
Like previous studies on the subject, our study too still faces the problem of the other form of
endogeneity, spurious correlation due to a common missing factor that drives both target bondholders’
returns and shareholder power at the acquirer. In particular, a positive relation between target
bondholders’ returns and shareholder power at the acquirer may not necessarily imply support for the
Managerial Monitoring Hypothesis. A well-run acquirer could be beneficial for target bondholders, while
it simultaneously attracts greater institutional ownership and blockholdings, which have been used as
measures of shareholder power. We consider this specific possibility as a plausible alternative to the
Managerial Monitoring Hypothesis, and deal with it by including controls for firm quality (Market-to-
Book ratio, and past profitability measures) in our analysis. We also rule out another plausible
alternative. Value-creating M & A deals may be anticipated by institutions that may have consequently
taken on larger ownership stakes in the acquirer, and that target bondholders profit from such deals as
well. Thus, we also control for the combined returns to acquirer and target shareholders as a proxy for the
quality of the M &A deal. Yet, in general we remain open to the criticism of not having taken into
account other unspecified missing variables that simultaneously determine target bondholders’ returns at
merger announcements as well as shareholder power at the acquirer.
We employ a comprehensive set of proxies for shareholder power that have been extensively
employed in past studies on corporate governance, including all those employed by BS, KMM, and CNW
in the related prior work on the impact on bondholders. We use ownership measures (total institutional
ownership, holdings of the top 5 institutional owners, and the presence of an institutional blockholder),
board characteristics to capture the efficacy of internal governance (board size, board independence, and
CEO/Chairman position duality), and indexes based on corporate governance provisions that may protect
management (developed by Gompers, Ishii, and Metrick, 2003, Bebchuk, Cohen, and Ferrell, 2005, and
CNW).
We examine excess returns for 655 bonds of 214 targets, and ratings changes for 891 bonds
belonging to 266 targets, for takeover deals during the period 1979 to 1997. There are significant
differences in firm and ownership characteristics between our sample of targets and acquirers, making the
shift meaningful for target bonds. We find that, consistent with prior literature, Billet, King, and Mauer
(2004), target bondholders experience significant positive excess returns during the merger announcement
period with a mean of 0.48%, significant at the 5% level.3 This finding is driven by the speculative grade
bonds in our sample (mean and median excess returns of 2.22% and 1.33%, respectively, both significant
3 Like BKM, the median excess return for target bondholders is not significant.

5
at the 1% level). We also find some evidence that bond ratings for speculative grade bonds improve,
while bond ratings for investment grade bonds worsen after the merger, a finding that has not been
documented before. Importantly, we find that acquirer shareholder power benefits target bondholders
during the takeover event. This is consistent with the Managerial Monitoring Hypothesis, according to
which increased shareholder power leads to better monitoring of managers, and therefore to higher firm
value. In particular, even after controlling for the coinsurance potential and various deal characteristics,
we find that an increase in the holdings of the top 5 institutional owners of acquirer stock from the 1st
quartile (10.50%) to the 3rd quartile (20.70%) is associated with a statistically significant (1% level)
increase of 0.74% in the excess returns to target bondholders. This effect is economically meaningful
since the average target bond experiences an excess return of only 0.48%. Upon disaggregating by the
type of institution, we find that investment advisors are one of the prime drivers for our findings on the
impact of institutional ownership. Previous work by Chen, Harford, and Li (2006) has specially noted the
monitoring role played by investment advisors. We affirm the positive relation between target
bondholders’ excess returns and shareholder power with a comprehensive set of other proxies for
shareholder power, including board size and the G-Index (Gompers, Ishii, and Metrick, 2003). Our
findings hold up even after we control for acquirer and deal characteristics, as well as a number of other
robustness checks. Furthermore, based on a probit analysis, the probability of an upgrade in the rating of
a target bond after the deal also increases with acquirer shareholder power. We do not find any evidence
that acquirer shareholder power leads to the expropriation of target bondholders, which contradicts
inferences reached by CNW and KMM. There is also no evidence that acquirer shareholders try to limit
the benefits of the M & A to target bondholders or that institutional acquiring shareholders finance the
transaction through debt issuances to expropriate wealth from the target bondholders.
The structure of the remaining paper is as follows. Section 2 develops the hypotheses we test in
this paper. Section 3 describes our data and methodology. Section 4 presents the results. In Section 5,
we consider the possibility that the interests of managers and bondholders may be aligned when
managerial ownership is high. Finally, in Section 6 we offer concluding remarks.
2. Hypotheses
In this section, we formulate hypotheses on the impact of shareholder power on target
bondholders. We also discuss prior work on the impact of other factors on bondholders during M & A’s.
2.1. Hypotheses on the Impact of Shifts in Shareholder Power on Target Bonds
Arguably, bondholders should be immune to changes in the corporate governance of the firm. As
documented by Lehn and Poulsen (1991), U.S. courts have generally maintained that bondholder-

6
stockholder conflicts be resolved explicitly in the indentures, and that the corporation’s obligations to the
bondholders are contained exclusively in the bond contract. In Katz v. Oak Industries, the Delaware
Court of Chancery ruled that the “terms of the contractual relationship agreed to, and not the broad
concepts such as fairness, define the corporation’s duty to bondholders” (508 A.2d 873, 879, Del. Ch.
1986). In Revlon v. MacAndrews & Forbes Holdings, the court held that the board of directors’ primary
fiduciary duty is to shareholders, and that bondholders’ rights in the firm are limited to what is explicitly
delineated in the bond indenture (506 A.2d. 173 Del. 1986). However, even lengthy and complex bond
covenants can not protect against every contingency. For example, in contrast to bondholders,
shareholders prefer higher dividends, riskier investments, and greater debt financing, and it is impractical
to write contracts that will harmlessly preclude any such actions under all circumstances. In fact, research
has shown that shareholder power can be harmful to bondholders (KMM, and, CNW). There is also
evidence of significant losses of 6-7% experienced by bondholders in LBO’s, where leverage is raised
substantially (Warga and Welch, 1993).
We describe below two hypotheses regarding how shareholder power can affect bondholders.
The hypotheses are not mutually exclusive.
Bondholders’ Wealth Expropriation Hypothesis:
Shifting target bondholders’ claims to an acquirer with greater shareholder power can adversely
affect bondholders, as it may lead to expropriation of wealth from bondholders through an increase in
leverage of the merged firm or by lowering the priority of their claims (Kim and McConnell, 1977, Cook
and Martin, 1991, and Ghosh and Jain, 2000). Increases in leverage lower bond values by increasing the
probability and expected costs of bankruptcy, as well as the greater likelihood of loss of priority,
especially in the event of bankruptcy. Stronger shareholders can also force managers to undertake riskier
investments, which also affect bondholders adversely. Since acquirer shareholders have expanded
opportunities to expropriate wealth from bondholders during takeovers, we have the following
hypothesis: According to the Bondholders’ Wealth Expropriation Hypothesis, target bond returns at
takeover announcements are negatively related to acquirer shareholder power.
Managerial Monitoring Hypothesis:
This hypothesis focuses on the benefits of greater shareholder power from an improved
monitoring of managers. Good corporate governance can increase the value of the firm’s assets, and
therefore the collateral value they represent to bondholders, by reducing excessive managerial perk
consumption, prevention of waste of free cash flow in other ways, and avoiding managerial self-dealing.
In this sense, greater shareholder power enhances firm value, and that both bondholders and stockholders

7
have a common interest to control the behavior of managers. In the context of M & A’s, increased
shareholder power at the acquiring firm leads to better monitoring of acquirer managers, and ensures that
they undertake better takeover deals that increase the value of the merged firm (Masulis, Wang, and Xie,
2007). In addition, increased shareholder power leads to better monitoring of managers in the future as
well. This better monitoring of acquirer managers increases firm value and benefits bondholders. Thus,
according to the Managerial Monitoring Hypothesis, target bond returns at takeover announcements are
positively related to acquirer shareholder power.
Excessive concentration of share ownership can lead to the pursuit of private benefits of control
at the expense of higher share prices, a possibility we consider in our empirical analysis by positing a
non-linear relation between target bond returns and shareholder power.
2.2. Shifts in Operating and Financial Risk for Target Bonds at Takeovers
Target bonds can experience changes in both operating and financial risks, besides the corporate
governance changes we are interested in. Operating risks faced by bondholders change as the acquiring
firm’s risk can differ from that of the target’s assets, and because of the coinsurance effect (Levy and
Sarnat, 1970, Lewellen, 1971, Higgins and Schall, 1975, Galai and Masulis, 1976, and Shastri, 1990).
According to the coinsurance effect, debt gains as the probability of default for the merged firm is
lowered by combining acquirer and target cash flows that are not perfectly correlated. In addition, as
Shastri (1990) points out, target bonds face changes in financial risk as the likelihood of default may
change because of differences in acquirer and target leverage -- as well as the typical increase in leverage
following M & A’s (Kim and McConnell, 1977, Cook and Martin, 1991, and Ghosh and Jain, 2000).
Target bonds may also see changes in their financial risk because their priority will be altered if their
maturity differs from that of the acquirer’s bonds (Shastri, 1990). Billet, King, and Mauer (2004) study
all these changes in operating and financial risks and find that they explain excess bond returns at M & A
announcements. We rely on Billet, King, and Mauer (2004), BKM, for our treatment of the coinsurance
effect.
Many studies have examined wealth effects on bonds at announcements of takeovers (Kim and
McConnell, 1977, Asquith and Kim, 1982, Eger, 1983, Dennis and McConnell, 1986, Maquieira,
Megginson, and Nail, 1998, Renneboog, Szilagyi, and Martynova , 2006). But, with the recent exception
of BKM, few of the studies are able to find any significant effects on target bondholders. BKM’s study
stands out for its large sample of target bonds, and use of dealer quotes instead of matrix prices for bonds.
Besides reporting that target bonds gain on average by 1.09% (with non-investment grade bonds gaining
by as much as 4.30%), the study also tests several hypotheses based on changes in operating and financial

8
risk faced by target bonds, as suggested by the literature (Levy and Sarnat, 1970, Lewellen, 1971, Higgins
and Schall, 1975, Galai and Masulis, 1976, and Shastri, 1990).
Specifically, BKM hypothesize a Risk Effect according to which target bondholders will gain if
the operating risk (i.e., standard deviation of unlevered stock returns) of the merged firm is lower, and if
cash flows of the acquirer and target are not perfectly correlated (i.e., a conglomerate merger). They also
predict that, based on financial risk considerations, target bonds will gain if the leverage of the merged
firm is lower (Leverage Effect), and maturity of target bonds is shorter than that of acquirer bonds
(Maturity Effect). Lower leverage at the merged firm decreases default probabilities, while a shorter
maturity ensures better priority in the merged firm. We take these effects -- Risk Effect, Leverage Effect,
and Maturity Effect -- into account, and extend the analysis by hypothesizing how changes in shareholder
power will also affect bondholders.
2.3. Other Factors that can Impact Target Bondholders at Takeovers
In addition to the hypothesized effects of shareholder power, and operating and financial risks, we
also control for a number of factors suggested by past research. In some cases, the predicted effects of
these control variables are ambiguous. These factors, described in Appendix A, are size of the target
relative to the acquirer, use of tender offer, whether the bid is hostile, use of cash as a method of payment,
whether the M & A occurs in the 90’s, deal completion, and whether it is a diversifying deal.
3. Data and Methodology
3.1. Sample
A sample of completed and withdrawn takeover deals with announcement dates during the period
from 1979 to 1997 was collected from Securities Data Corporation’s (SDC) Mergers and Acquisitions
Database. Like prior work, i.e., BKM, the choice of the period is determined by the availability of
information on takeover deals (which begins in 1979) and bond price data (which ends in March 1998). If
multiple announcements for the same deal were made during the same calendar year, only the first
announcement is included in the analysis. We exclude leveraged buyouts and simple acquisitions of
assets, and require that the target and its acquirer have non-missing announcement date stock returns on
CRSP and valid asset and leverage data on Compustat in the fiscal year end immediately prior to the
merger announcement. These requirements give us an initial sample of 2,300 merger deals. We then
match these acquirers and targets to the firms in the Lehman Brothers Bond Database (LBBD). LBBD
contains all bonds in the Lehman Brothers corporate and government bond indices and covers the period
from January 1973 to March 1998. The database reports a time series of month-end bid quotes from
Lehman Brothers’ dealers and bond ratings from Moody’s and Standard and Poor’s, together with cross-

9
sectional bond details. We do not use “matrix” prices for bonds because they are less reliable than dealer
quotes (Warga and Welch, 1993).
For a target to be included in the sample, we require that the target has bonds listed in the LBBD
with valid Month -3 market value, where Month -3 is counted with respect to the month of the merger
announcement. We further require that the target satisfies either of the following conditions: 1) The
target has valid bond returns in Months -1 and 0 that are based on non-matrix prices in Months -2, -1, and
0, where Month 0 is the month of the announcement date (referred to as the “bond returns” sample); or 2)
The target has at least one rated bond existing in both Month -3 and Month +3, where Month -3 is with
respect to the announcement date of the deal and Month +3 is with respect to the effective date or
withdrawn date of the deal (referred to as the “bond ratings” sample).4,5 The first requirement leaves us
with 910 bonds belonging to 298 targets and the second requirement leaves us with 1226 bonds belonging
to 371 targets.
We further require the target and acquirer to have proxy statements available just prior to the
merger announcement for collection of managerial ownership and board structure data. We supplement
our corporate governance data from the Compact D/SEC discs. We also require that the target and
acquirer have institutional holdings data available in quarterly filings (SEC Form 13F), as provided by
Thomson Financial for the quarter just prior to the quarter in which the merger announcement falls.
Finally, we also require that the acquirer and target have at least 12 months of monthly stock returns from
Month -25 to Month -2, inclusive, to allow us to calculate the standard deviation of unlevered stock
returns. Our final sample consists of 281 targets with 956 bonds. Of these 281 targets, 214 targets with
655 different bonds belong to the bond returns sample, and 266 targets with 891 different bonds belong to
the bond ratings sample.6
The majority of the targets in the sample have multiple bond issues. We follow the approach of
BKM, and combine all of a firm’s bond characteristics into a single observation, where the weights are
based on the Month -3 market value of the bond. Thus, a target’s announcement period bond excess
return, bond rating changes and other bond characteristics are weighted averages of all the target’s bonds.
4 For those deals which are missing both the effective date and the withdrawn date, the announcement date is used instead. 5 As the ratings for speculative bonds prior to 1995 are known to be inaccurately recorded in the LBBD, we manually checked these ratings with the Moody’s Annual Bond Records and Moody’s Bond Records. Those bonds with ratings that cannot be verified are discarded. 6 Our sample of targets with available announcement period bond returns is slightly smaller than that of BKM primarily because we require the target and acquirer to have asset and leverage data in Compustat.

10
3.2. Proxies for Shareholder Power
To examine the relation between announcement period excess bond returns and shareholder
power, we use several measures of shareholder power. Though they are widely used in the literature on
corporate governance, it is important to note that researchers have questioned whether increases in some
of these measures are necessarily beneficial to share prices. Thus, it is important to employ a
comprehensive set of proxies for shareholder power.
Institutional Ownership: Total, Holdings of Top 5 Owners, and Blockholdings
Institutional investors may be considered more sophisticated investors with a superior ability to
monitor managers, which may explain the improvements in profitability for firms targeted by institutions
(Nesbitt, 1994, and Smith, 1996). Institutions also appear to monitor managers in control-related
situations such as takeovers and proxy fights (Brickley, Lease, and Smith, 1988, and Agrawal and
Mandelker, 1990). Furthermore, Hartzell and Starks (2003) find that institutional monitoring is
associated with lower CEO compensation and higher pay-for-performance sensitivity. Consequently, we
use total institutional ownership (InstTotal) as a measure of shareholder power. Since institutions with
small holdings may not have sufficient economic incentives to monitor managers (Roe, 1994), we also
use the holdings of the top 5 institutional owners (InstTop5) and the presence of an institutional
blockholder with 5% or more equity stake (a 0, 1 dummy, InstBlock) as additional measures of
shareholder power (Shleifer and Vishny, 1986, Maug, 1998, and Noe, 2002). InstTop5 and InstBlock are
measures that attempt to overcome free-riding problems among institutions, which would otherwise make
it difficult for them to take collective action against managers (Black, 1990; Karpoff, Malatesta, and
Walkling, 1996).
The monitoring role of institutions has been questioned in the literature. Some researchers have
argued that institutions are myopic, and “vote with their feet,” as a consequence of U.S. regulatory policy
that promotes liquidity over corporate governance (Bhide, 1994, and Black and Coffee, 1994).
Institutions may also have other commercial interests in the firms that they monitor, and may purposely
choose to avoid confronting errant managers. Pound (1988) offers empirical evidence that suggests that
institutions contribute to managerial entrenchment by supporting incumbent managers in proxy fights.
Finally, even if greater InstTotal and InstTop5 are generally beneficial to shareholders, they may
not be so at higher levels of institutional holdings. At higher levels of holdings, institutions may have
sufficient influence to draw greater private benefits from the firm compared with the shared benefits they
may gain with other securityholders from a better monitored firm (Barclay and Holderness, 1989, and
Zingales, 1994). Consequently, in our analysis we also consider a non-linear relation between
bondholders’ returns and shareholder power.

11
In the prior work related to this study, BS and CNW use InstTotal, InstTop5, and InstBlock as
measures of shareholder power.
Board Characteristics: Size, Independence, and CEO/Chairman Duality
Boards constitute an internal mechanism that addresses managerial agency problems that
shareholders can not readily resolve themselves, such as hiring and firing the CEO, setting compensation,
or providing approval for the issuance of securities. It has been claimed that smaller and more
independent boards, and boards where managerial power is not concentrated by having the CEO also hold
the position of board chairman, are features of firms with better corporate governance (Baysinger and
Butler, 1985, Weisbach, 1988, Byrd and Hickman, 1992, Brickley, Coles, and Terry, 1994, Cotter,
Shivdasani, and Zenner, 1997). The directors are more accountable if the board is smaller, and outside
directors are less likely to be unduly influenced by managers. Monitoring is also likely to be more
effective if the CEO is not too powerful, as may happen if he is also the chairman of the board.
Consequently, we use board size (Board Size), percentage of the directors that are independent (%
Outside Directors), and a dummy that takes a value one if the CEO also serves as chairman of the board
and is otherwise zero (CEO-Chairman duality dummy) as measures of shareholder power.
The effectiveness of boards has been questioned, since it is argued that boards serve at the
pleasure of the CEO and are unlikely to properly monitor her (Jensen, 1993). In their survey of research
on boards, Hermalin and Weisbach (2003) find the following regularities regarding boards: Firms with
smaller boards have better performance, but board independence is not related to firm performance. The
evidence on CEO/Chairman duality is limited, but again its impact on the firm has been questioned.
Thus, we pay particular attention to our findings regarding Board Size.
In related work, BS use board independence as a measure of shareholder power.
Anti-Takeover Provisions: G-, E-, and ATI-Indexes
Shareholder rights have been proxied with the extent of antitakeover defense provisions.
Antitakeover defenses protect management from being replaced by competing management teams and
embolden them to pursue self-serving activities. The Investor Responsibility Research Center has
published since 1990 details on 24 distinct corporate governance provisions for about 1500 firms.
Gompers, Ishii, and Metrick (2003) have used this data to develop a governance index, the G-Index,
which is simply a count of the number of anti-takeover provisions adopted by a firm. Gompers, Ishii,
Metrick (2003) find that firm value, Tobin’s Q, is negatively correlated with the G-Index. Arguing that
not all provisions are necessarily relevant in measuring the relative balance of power between
shareholders and managers, Bebchuk, Cohen, and Ferrell (2005) identify 6 important provisions:

12
staggered boards, limits to shareholder amendments of bylaws, supermajority requirements for mergers,
supermajority requirements for charter amendments, poison pills, and golden parachute arrangements.
Counting the number of these provisions in place for a firm, Bebchuk, Cohen, and Ferrell (2005) define
an entrenchment index, E-Index. Finally, CNW focus on just four anti-takeover provisions that they feel
are critical for takeovers, the existence of blank check preferred stock, classified boards, and restrictions
on calling special meetings and action through written consent. Their anti-takeover index, ATI-Index,
consists of a count of how many of these provisions are in place. The ATI-Index is more narrowly
focused on the anti-takeover posture of the firm, compared to the more general relative measure of power
between shareholders and managers captured by the G-Index. We employ all three measures, G-, E-, and
ATI indexes.
In related work, KMM use the G-Index, and CNW use the ATI-Index as measures of shareholder
power.
3.3. Sample Characteristics
Table 1 tabulates the 281 deals in our sample by year of announcement. The increase in merger
activity from 1985 to 1989, and also in the second half of the 1990s, is similar to that in BKM. It also
reflects the pattern of aggregate merger activity (Andrade, Mitchell, and Stafford, 2001).
Table 2 presents various characteristics relating to the deals, acquirers, and targets in our sample.
The deal characteristics are from SDC and are shown in Panel A. About one-third of the deals are fully
financed with cash, while about 22% of the deals are financed entirely by stock. Most of the M & A’s in
our sample are completed deals, with over half of the deals involving 100% of the target being acquired.
The transaction values for our sample are much higher than those reported in prior literature (e.g.,
Moeller, Schlingemann and Stulz, 2004) primarily because firms in the LBBD are bigger firms with
public debt outstanding.
Panel B of Table 2 provides descriptive statistics of the firms in our sample. All accounting ratios
are based on data from Compustat, and are measured as of the fiscal year-end immediately prior to the
merger announcement. Targets are, on average, smaller, less profitable, and more leveraged than the
acquirer. So, a move to the acquirer may be beneficial to target bondholders. But, risk considerations
suggest otherwise. Targets have lower growth, which may imply lower risk as well. However, there is
little difference in the risk of targets and acquirers, as measured by the standard deviation of unlevered
stock returns.
Panel C of Table 2 presents descriptive statistics for the firms’ bonds. Target bonds have shorter
maturity, with an average maturity of 11 years compared to 12 years for the acquirer. As expected, target
bonds have worse ratings. The median target is rated Baa2, while the median acquirer is rated A2.

13
Finally, targets have fewer bonds as compared to the acquirer. Our descriptive statistics on the firms’
bonds are similar to that in BKM.
Panels D, E, and F provide the descriptive statistics on the firms’ shareholder power and other
corporate governance characteristics. Although the targets have lower managerial ownership than the
acquirers, the difference is not significant. Consistent with the targets being smaller firms, targets tend to
have slightly lower total institutional holdings (Gompers and Metrick, 2001). Compared to the general
sample in BS, the median InstTotal and InstTop5 are lower in our sample. Interestingly, the targets’
institutional holdings are more concentrated as shown by the amounts held by the top five institutions,
and by the presence of an institutional blockholder. With targets having less institutional ownership but
higher concentration, the difference in shareholder power from the target to the acquirer and its impact on
bondholders is an empirical issue. Target boards are also smaller, and the chairman of the board is less
likely to be the CEO. For their sample, BS report a median value of 77.78% for % of Outside Directors,
which is similar to the 78.26% and 78.57% median values for the acquirer and target firms, respectively,
in our sample.
According to Panel F, our targets have slightly higher G-index and E-index, though the mean of
the difference in G-index is not significant. In KMM’s and Gompers, Ishii, and Metrick’s (2003) samples
which are drawn without regard to merger activity, the median values of the G-Index are 10 and 9,
respectively, while they are 9 and 10 for our acquirers and targets, respectively. The mean value of the E-
Index for the firms in the S & P 500 Index (not in the S & P 500) is 2.58 (2.46) according to Bebchuk,
Cohen, and Ferrell (2005), whereas our firms appear to be more vulnerable to takeovers based on the
mean values of 1.61 and 2.18 for the E-Index for acquirers and targets, respectively. Finally, we find that
for our sample the median values for our ATI-Index are 1 and 2 for acquirers and targets out of a possible
maximum of 4, respectively.
As a broad generalization, the extent of shareholder power is not peculiarly unique to our sample
of firms.
4. Results
4.1. Excess Bond Returns and Ratings Changes
We compute monthly bond excess returns and changes in bond ratings for each target in our
sample. Following Warga and Welch (1993) and BKM, we calculate monthly bond excess returns as the
difference between a bond’s monthly total returns (change in price plus accrued interest) and the monthly
total return on an index of bonds with similar rating and remaining maturity. These indices are
constructed by Lehman Brothers and are available in the LBBD. The announcement period bond return is
the sum of Month 0 and Month -1 excess returns. The change in a bond’s rating is the difference in a

14
bond’s rating between Month -3 and Month + 3, where Month -3 is counted with respect to the
announcement date and Month +3 is counted with respect to the merger effective date or the date on
which the bid is withdrawn. If target bonds gain from differences between acquirer and target and from
the coinsurance effect, this will be reflected in the ratings improvement that follow from a shift of the
claims of target bondholders to less risky merged assets. As mentioned previously, for those firms with
multiple bond issues, a weighted average bond excess return and a weighted average bond ratings change
are calculated for each target, where the weights are based on the market value of the bond in Month -3.7
Table 3 reports announcement period excess returns and rating changes for target bonds. Like
BKM, we find that target bonds on average earn a positive excess return, 0.48%, significant at the 5%
level. Although the median excess bond return is 0.13%, it is not significant. Most of the gains in returns
are experienced by speculative grade target bonds, consistent with the coinsurance effect. Speculative
grade bonds gain an average of 2.22% excess return, while the investment grade bonds lose an excess
return of about 0.45% in the period surrounding the announcement. Further, the gains are seen mainly in
completed deals, where targets of completed deals gain a significant excess return of 0.72%.
Results based on the changes in bond ratings are generally weaker, possibly because jumps in
bond ratings are lumpy. All the median changes are zero. Thus, when examining changes in bond
ratings, only the means will be discussed. On average, bond ratings decrease, although this decrease is
not significantly different from zero. Examining the investment grade and speculative grade bonds
separately, we find that, similar to the bond returns analysis above, the investment grade bonds worsen in
ratings, while the speculative grade bonds improve in ratings. The difference in ratings change between
the speculative grade bonds and investment grade bonds is significant at the 10% level. Inclusion of
withdrawn deals is a likely reason for our weak findings. The coinsurance effect for the target
bondholders comes about only if the target bondholders actually move from risky assets to less risky
merged assets. In untabulated results, where the withdrawn deals are discarded, the speculative grade
bonds increase their ratings significantly, by an average of 0.6, while the ratings change for investment
grade bonds are not significantly different from zero. The difference in ratings change for the two groups
of bonds is significantly different at the 5% level.
4.2. Univariate Analysis of Excess Bond Returns and Ratings Changes
Table 4 divides the firms into sub-samples based on various aspects of acquirer shareholder
power and corporate governance. Generally, the results show that better governed acquirers benefit target
bondholders. Higher institutional monitoring, i.e., high AInstTotal or AInstTop5 lead to significantly
7 One target has a value-weighted announcement period bond excess return of 85.77%. This observation is discarded from our sample.

15
positive excess bond returns, while bonds with low institutional monitoring experience returns that are not
significantly different from zero. The difference between the subgroups is also not significantly different
from zero. The changes in the ratings of target bonds show that bonds that move to an acquirer with high
(low) institutional monitoring improve (worsen) their ratings, with the difference between the two groups
of bonds significant at the 5% or better level. The presence of an acquirer institutional blockholder also
benefits the target’s bondholders.
We also examine how the acquirer’s board structure affects target bondholders’ gains. As can be
seen in the middle panel of Table 4, the size of acquirer board structure does not appear to affect target
bondholders. However, there is evidence that a more independent acquirer board benefits target
bondholders. Target bonds experience a mean improvement in ratings of 0.53 when the acquirer has a
more independent board, while the bonds experience a significant decrease in ratings of 0.63 when the
acquirer board is not as independent. In the bottom panel in Table 4, we examine how acquirer takeover
vulnerability affects bondholders’ returns and ratings. The mean and median returns to target
bondholders are higher when the G-Index is lower (shareholders are stronger and takeover vulnerability is
high), but the difference is not significant. However, when managers are in a stronger position, there is
some weak evidence that target bonds gain in terms of their ratings (the difference is significant at the
10% level). Qualitatively, we obtain similar findings with the E-Index.
Overall, our univariate analysis is consistent with the Managerial Monitoring Hypothesis since
bondholders are seen to gain when acquirers are better governed. There is no evidence of shareholder
expropriation.
4.3.1. Multivariate Analysis of Excess Bond Returns: Methodology
In this section, we report findings from a multivariate cross-sectional regression analysis of
excess bond returns on the shareholder power at the acquiring firm, and a number of other control factors.
Please note that the number of observations drops to 147 deals as we now require that the acquirer also
have bonds listed in the LBBD. Our baseline regression is:
Excess Target Bond Returns = f (Shareholder Power at Acquirer, Operating and Financial Risk
Differences between Acquirer and Target -- Risk, Leverage, and
Maturity Effects, Non-Diversifying Deal Dummy, Relative Size, Tender
Offer Dummy, Hostile Deal Dummy, Cash Dummy, 1990’s M & A
Dummy, and Completed Deal Dummy)

16
Shareholder power is measured as acquirer’s (i) Total institutional holdings, AInstTotal, acquirer’s
holdings of top 5 institutions, AInstTop5, or a (0, 1) dummy for the presence of an institutional
blockholder with a 5% and greater stake among the acquirer’s owners, AInstBlock,;(ii) Board Size, %
Outside Directors, or CEO-Chairman duality dummy, a (0, 1) dummy with a value one when the same
person serves as CEO and chairman of the board; and (iii) G-Index, E-Index, or ATI-Index.
Risk Effect is captured by the difference between the rating of the worst rated bond at the acquirer and the
target, JRT Diff). We also use another proxy, a (0, 1) dummy with a value of one when the standard
deviation of the unlevered of the target’s stock returns exceeds that of the acquirer, D(TRetStd >
ARetStd).
Leverage Effect is taken into account with a (0, 1) dummy variable which equals one if the target book
leverage, as measured by the ratio of total debt to book assets, is greater than the acquirer book leverage,
D(TLev > ALev).
Maturity Effect is included with a (0, 1) dummy which takes a value of one if the target bond maturity is
shorter than the acquirer maturity, D(TMaturity < AMaturity).
Other Control Variables include the ratio of the acquirer size to target size (Aquirer Size/ Target Size),
and dummy variables for whether the deal is financed 100% by cash (Cash), classified as hostile
(Hostile), occurred in the 1990s (1990s), non-diversifying (Non-Diversifying Deal), a tender offer
(Tender Offer), and if it is completed (Completed Deals).
Target Shareholder Power is not included in our baseline regression shown above. Instead, we include
just acquirer shareholder power as an independent variable. Yet, our hypotheses deal with the changes in
the corporate governance between the target and the acquirer. The reason is that, in an efficient market,
target shareholder power is expected to be already impounded in the prices and ratings of target bonds.
We, nevertheless, add target shareholder power as an additional independent variable in our robustness
checks. This allows for differences in shareholder power, and conforms more narrowly to our
hypotheses. We predict, however, that target shareholder power will not enter with a significant
coefficient in our regressions. We also repeat our analysis with another control, a (0, 1) dummy with a
value one when the acquirer shareholder power is greater than that of the target, e.g., when AInstTop5 >
TInstTop5. Again, in the presence of acquirer shareholder power in the regression, this dummy is not
predicted to add explanatory power.

17
4.3.2. Multivariate Analysis of Excess Bond Returns: Institutional Ownership as Shareholder Power
The findings of the multivariate analysis for shareholder power based on institutional ownership,
AInstTotal, AInstTop5, and AInstBlock, are presented in Table 5. First note that the coefficient of the
difference in JRT is significantly positive in all the regressions. Target bonds gain when the acquirer is
rated better than the target. Similar to BKM, a dummy for difference in standard deviation of unlevered
stock returns has little additional explanatory power. We also use yet another proxy, differences in
modified Z scores between acquirer and target, (Acq Z – Tar Z), where Z is measured using the modified
Z-score procedure in Graham, Lemmon, and Schallheim (1998). The difference in JRT continues to
remain positive and significant, although it is highly correlated with (Acq Z – Tar Z). These variations do
not alter the findings on shareholder power discussed below. In addition, we also find that target bonds
gain when the acquirer size is bigger than the target and target bonds lose when cash is used in the deal.
In Model 2, we include AInstTotal as an independent variable, and find that greater acquirer total
institutional ownership has a beneficial effect on target bondholders’ wealth, since the coefficient of
AInstTotal is positive and significant at the 10% level. Similarly, in Models 3 and 4, the coefficients of
AInstTop5 and AInstBlock are positive and significant (at the 5% or better level). Probably because of
multicollinearity (correlation coefficient between AInstTotal and AInstTop5 is 0.68, and that between
AInstBlock and AInstTop5 is 0.60 for the sample of 147 deals in Table 5), AInstTotal and AInstBlock do
not have significant coefficients when they are included along with AInstTop5 in Models 5 and 6.
However, AInstTop5 remains positive and significant in Model 6 and all other specifications in Table 5.
At any rate, arguably top 5 institutional holdings may be a better proxy for shareholder power as it
measures whether shareholders can take collective actions together to bargain with managers, while total
institutional holdings may include many institutions with very small holdings. The presence of a single
blockholder assures us only of an ownership stake of at least 5%, while the median value of AInstTop5 is
about 15% (Table 2). Institutions with small holdings, and even blockholders without sufficiently large
stakes, may suffer from free-rider problems. Adding AInstTop5 to the regression raises the adjusted R2
by over 5%, comparing Models 1 and 3. Model 3 also shows that a 1% increase in AInstTop5 leads to a
0.073% increase in excess bond returns at the merger announcement. In going from the 1st quartile
(10.50%) to the 3rd quartile (20.70%) for AInstTop5 in our sample raises target bond excess returns by
0.74%. Given that the mean target bond excess return at the M & A announcement is 0.48%, changes in
holdings by top 5 institutions of acquirer stock have, not only a statistically, but also an economically
significant impact. In all, these findings are consistent with the Managerial Monitoring Hypothesis.

18
In Models 7 and 8, we control for target shareholder power, TInstTop5 and D(AInstTop5 –
TinstTop5), respectively. Neither of these controls have significant coefficients, which is consistent with
the notion that target shareholder power has already been priced into target bonds.
4.3.3. Multivariate Analysis of Excess Bond Returns: Board Characteristics as Shareholder Power
We use board size, board independence, and whether the CEO is also chairman of the board as
additional proxies for shareholder power in Table 6. In Model 1, we see that the coefficient of Board Size
is -0.105, which is significant at the 5% level. Compared to Model 1 in Table 5, the inclusion of Board
Size in Model 1 in Table 6 raises the adjusted R2 from 21.6% to 23.9%, an increase of 2.6%.
In Models 2 and 3, we see that %Outside Directors and the CEO-Chairman duality dummy have
insignificant coefficients. We also employed other specifications to affirm these findings. For example,
we also used (0, 1) dummy variables based on whether the acquirer board has above median (above
78.26%), above 50%, or above 60% independent directors. All these variations do not change our
conclusion regarding board independence. In Model 4, we include all three board characteristics as
independent variables. The coefficient on Board Size remains negative and significant, while %Outside
Directors and the CEO-Chairman duality dummy are still insignificant. In Models 5 and 6, we control for
target shareholder power, and the findings on Board Size are qualitatively the same. Target Board Size
and D(Acq Board Size Smaller) both have insignificant coefficients.
Our findings are similar to those reported in previous work on how boards affect shareholders. In
their survey of the literature on boards, Hermalin and Weisbach (2003) note that the empirical evidence
supports the view that smaller boards are more effective in monitoring managers and creating value, while
board independence has not been consistently found to be beneficial. Thus, our findings on Board Size
too support the Managerial Monitoring Hypothesis.
4.3.4. Multivariate Analysis of Excess Bond Returns: G-, E- and ATI Indexes as Shareholder Power
In Table 7, we consider the G-Index proposed by Gompers, Ishii and Metrick (2003). Model 1 in
Table 7 shows that target bondholders fare better with acquirers with greater shareholder rights. The
coefficients for Ln (1+G-Index) is negative and significant, though only at the 10% level. This too
supports the Managerial Monitoring Hypothesis. However, once we control for target shareholder power
in Models 2 and 3, the coefficient of Ln(1+G-Index) is insignificant. But, the number of observations
may now be unreliably down to only 51 compared to 147 in Tables 5 and 6 because of data availability on
corporate governance provisions.
We also employ alternative specifications, Models 4 and 5, in which we use a (0, 1) dummy with
a value one if the G-Index has a value lower than the median and captures cases where shareholders are

19
stronger. The dummy Low G-Index has a significant positive coefficient in both Models 4 and 5.
Importantly, the dummy Low G-Index has a significant coefficient even though AInstTop5 and
AInstBlock are included as independent variables. Overall, though not strongly so, these findings also
support the Managerial Monitoring Hypothesis.
Models 4 and 5 in Table 7 also provide us with a closer replication of the analysis in CNW
because we include interaction terms, Low G*AInstTop5 or Low G*AInstBlock. These interaction terms
capture the cases with high takeover vulnerability of the acquirer (Low G) and concentrated institutional
ownership (AinstTop5 or AInstBlock). According to CNW, when the firm is protected from takeover,
institutional blockholdings have a positive monitoring impact. But when the firm is vulnerable to
takeovers, institutional blockholdings lead to an expropriation of bondholders’ wealth. However in both
models, the coefficients of the interaction terms are not significant. In unreported findings, we also use
the ATI-Index developed by CNW in place of the G-Index to replicate CNW’s analysis more faithfully.
We find that, while AInstTop5 and AInstBlock continue to have significant coefficients, the ATI-Index
and the interaction terms do not have significant coefficients.
We obtain qualitatively similar results by repeating all of the above analysis with the E-Index
developed by Bebchuk, Cohen, and Ferrell (2005) instead of the G-Index used in our Table 7. Thus,
unlike KMM and CNW, we find support for the Managerial Monitoring Hypothesis in our context of M
& A’s.
4.3.5. Multivariate Analysis of Excess Bond Returns: Multiple Measures of Shareholder Power
In Table 8, we simultaneously include multiple measures of shareholder power in our analysis to
check on the relative roles of our measures, which have been used individually in Tables 5 through 7 but
may be either complements or substitute governance mechanisms. We are particularly interested in
AInstTop5, AInstBlock, Board Size, and possibly the G-Index, based on our findings so far. The
correlation coefficients between top 5 institutional holdings with board size, percentage of independent
directors on board, and a CEO-Chairman duality dummy are only -0.03, 0.14, and -0.28, respectively.
These are low correlation coefficients, making it unlikely that multicollinearity with the holdings of the
top 5 institutional owners explains the lack of significance for the coefficients on % Outside Directors and
CEO-Chairman duality dummy in our earlier analysis.
Table 8 shows that our findings on AInstTop5 and AInstBlock are indeed robust, since the
coefficients for these measures are significant irrespective of the other measures included as independent
variables. The findings on Board Size are now mixed. But, Board Size has the predicted negative and

20
significant coefficient for the larger sample (147). Finally, the coefficients for G- Index terms still have
the predicted significant negative signs.8
4.4. Spurious Correlation because of Acquirer Quality or Deal Quality?
Firm quality as a control to address endogeneity problems is included in additional specifications
in our analysis in Table 9. We use both acquirer MB and ROA, as proxies for a potentially missing
factor, firm performance. Institutional owners may take larger positions in well-run, better performing
firms, and that target bonds stand to gain when targets are acquired by such firms. Thus, a positive
relation between acquirer institutional ownership and returns to target bonds may not be because of any
monitoring ability of institutions. But if, after controlling for MB (or ROA), we find that bond excess
returns and institutional ownership are still positively related, it would further support the validity of the
Managerial Monitoring Hypothesis.
Deal quality as control to address endogeneity problems is also included in additional
specifications in our analysis to examine another link that could create a spurious correlation between
acquirer shareholder power and target bond returns. Our proxies for deal quality are the Combined
(Target, Acquirer) cumulative stock excess returns, CAAR, from Day -1 to Day +1, where Day 0 is the
announcement of the M & A.
In Models 1 and 2 of Table 9, we examine how AInstTop5 impacts target bonds after we control
for the quality of the acquirer, MB or ROA. These controls are in addition to those shown in Table 5.
Both MB and ROA have positive coefficients, suggesting that target bonds do indeed benefit in moving to
a better acquirer. Importantly, coefficients of AInstTop5 in models 1 and 2 retain their positive and
significant sign.
In Models 3 through 5, we control for deal quality. Irrespective of whether we employ target,
acquirer, or combined CAAR (-1, +1) as proxies for deal quality, we find that target excess bond returns
are positively related to AInstTop5. Notably, the coefficients for target, acquirer, or combined CAAR (-1,
+1) are insignificant in Models 3, 4, and 5, which is contrary to the notion that target bondholders gain at
the expense of acquirer or target shareholders. If anything, when we re-estimate the regression with only
AInstTop5 and target CAAR (-1, +1), target CAAR (-1, +1) has a positive coefficient (significant at the
10% level). When acquirer or combined CAAR (-1, +1) are similarly entered in the regression instead of
target CAAR (-1, +1), they still have insignificant coefficients. In all, these findings are inconsistent with
those of CNW that suggest that target shareholders expropriate wealth from target bondholders during
8 The findings are similar but weaker using the E-Index. The coefficients in Models 3 and 6 are negative, but are significant only for Model 6 at the 10% level. Using the ATI-Index, we again get negative coefficients but they not significant in both Models 3 and 6.

21
takeovers. They are, however, consistent with the findings in BKM, where they find a positive
correlation between returns to target shareholders and target bondholders.
As a robustness check, we repeat our analysis in Table 9 using our other proxies for shareholder
power. The coefficient of Board Size remains negative and significant after MB, ROA, or target
(acquirer, combined) CAAR (-1, +1) are used as additional control variables. Similarly, the coefficient of
Ln (1+G-Index) remains negative and significant (10% level).
Our findings, after controlling for firm and deal quality, remain consistent with the Managerial
Monitoring Hypothesis.
4.5. Additional Robustness Checks on Multivariate Analysis
4.5.1 Impact of Institutional Ownership at High Levels
We do not include square terms for any of our institutional ownership variables, total or top 5, in
our tables because they never have significant coefficients. In unreported results, when we include the
square of AInstTop5 as an independent variable the coefficient of AInstTop5 retains its significance but
the coefficient of the square term is not significant. This means that AInstTop5 has a positive impact on
target bondholders throughout the range of AInstTop5 values in our sample, and does not reach levels at
which the top 5 institutions prefer to draw private benefits that adversely affect share prices.
4.5.2. Target Bonds with Call Features or Event Risk Covenants
To preclude the possibility that our findings are driven by bonds that have sweet deals based on their
covenants, but are not ultimately around to be affected by the monitoring that accompanies shareholder
power at the acquirer, we form a sample of only those bonds that are still outstanding three months after
the effective date of the acquisition. The sample size drops to 135 targets, but the coefficients on
AInstTop5, Board Size, and Ln (1 + G-Index) are similar to that for the full sample.
4.5.3. Industry and Year Effects
For acquirer industry effects, we repeat the analysis (Model 2 in Table 5, Model 1 in Table 6, and
Model 1 in Table 7) for coefficients when AInstTop5, Board Size, and Ln (1 + G-Index) are entered
individually with additional controls consisting of dummies for 1-digit SIC. All the coefficients remain
similar in sign and significance. When we use dummies for target industry 1-digit SIC instead, the
findings are again largely the same, except that the coefficient of Ln (1 + G-Index) is still negative but not
significant anymore (t-stat = 1.63).

22
Institutional ownership has increased dramatically over the years, going from about 7% of U.S.
equities in 1950 to about 51% by 2004 (Federal Reserve Board’s Flow of Funds reports).9 If over the
years target bondholders have fared progressively better during M & A’s, e.g., because of better
protection such as event risk covenants, we may spuriously find bond excess returns to be positively
correlated with institutional ownership. Consequently, we repeat the analysis (Model 2 in Table 5, Model
1 in Table 6, and Model 1 in Table 7) when AInstTop5, Board Size, and Ln (1 + G-Index) are entered
individually with additional controls consisting of yearly dummies for 1981 through 1997. The
coefficient for AInstTop5 is still positive and significant. The coefficient for Board Size is negative, but
significant at only the 10% level. Finally, Ln (1 + G-Index) is negative but it is not significant anymore.
None of the year dummies has a significant coefficient.
Overall, the analysis with industry and year effects affirms our earlier findings for AInstTop5 and
Board Size. However, the findings for Ln (1+ G-Index) appear to be consistent though weaker.
4.5.4. Independent, Long-Term, Institutional Ownership in Acquirer
Arguably, only institutions with a long-term interest in the firm will undertake costly monitoring.
So, in the spirit of Chen, Harford, and Li (2006), we determine the percentage of acquirer shares held by
independent, long-term institutional investors. First, we determine the top 5 institutional investors in the
quarter prior to quarter in which the M & A announcement occurs. Then, we ascertain which of these
institutional investors holds stakes in the acquirer during the 5 prior quarters, quarter (-1) through quarter
(-5). Only those institutions with ownership in the top 5 for each of these past 5 quarters are considered
long-term investors. Independent, long-term investors are those long-term investors who are classified as
investment advisors, investment companies, and public pension funds. Together the institutional holdings
by these independent, long-term investors in quarter (-1) constitute our measure of concentrated
ownership by long-term institutional investors. Repeating our baseline analysis with this measure of
concentrated ownership, we again find a positive relation between target excess bond returns and this
proxy of shareholder power. The coefficient is now 0.089, significant at the 5% level (the comparable
coefficient in Model 3 of Table 5 is 0.073, significant at the 1% level).
9 Indeed, our sample confirms this trend since we find that the mean (median) for AInstTotal and AInstTop5 are 43.93% (47.22%) and 15.82% (14.11%), respectively, at the end the quarter prior to the M & A announcements, and 46.90% (48.22%) and 17.04% (15.05%), respectively, at the end of the quarter in which the effective date falls. These represent statistically significant increases of 2.97% (1.40%) and 1.23% (0.58%) in AInstTotal and AInstTop5, respectively. If it had been the opposite case – institutions were selling out while bonds were gaining – it would have been consistent with bonds reaping the benefits of overpayment while institutions were “walking away” instead of monitoring.

23
4.6. Multivariate Analysis of Bond Ratings Changes
We also examine changes in the ratings of target bonds as an alternative to the excess returns
experienced by target bonds at the M & A announcement. This is another approach that avoids relying
on bond gains which may result from target bonds being called back at higher prices, rather than the
monitoring improvements the acquirer shareholders might offer. In this analysis, we only examine
completed deals and targets where there is a ratings upgrade or downgrade. Targets where there are no
ratings changes are discarded because they may contain cases where changes were not large enough to
effectuate the lumpy steps needed for a ratings change. As a result, we are also able to apply a more
straightforward probit analysis. However, the cost is that the sample size decreases to 64 targets, out of
which 41 targets experience a ratings upgrade.
Panel A of Table 10 presents a probit analysis of the impact of AInstTotal, AInstTop5, and
AInstBlock on the probability of a ratings upgrade for target bondholders. Marginal effects are provided.
Similar to the returns results, we find that the probability of a ratings upgrade increases with the
difference between acquirer and target JRT. This effect is consistent with the coinsurance effect where
target bonds gain when they move to a less risky environment. Importantly, we find that in Models 2
through 4 higher acquirer institutional holdings, AInstTotal, AInstTop5 or AInstBlock, increases the
probability of a ratings upgrade, and that the findings are significant at conventional levels of
significance. (In unreported findings, we control for firm quality with acquirer’s MB or ROA, as an
independent variable, and the coefficient of AInstTop5 remains positive and significant.) These findings
are consistent with the Managerial Monitoring Hypothesis. If the Shareholder Expropriation Hypothesis
is valid, we would expect that the target bonds ratings are negatively affected by AInstTotal, AInstTop5,
and AInstBlock. Although AInstTotal is highly correlated with AInstTop5, the coefficient of AInstTop5
is still positive and significant in Model 5. In Model 6, perhaps because of multicollinearity, the
coefficient of AInstBlock loses significance when AInstBlock and AInstTotal are both independent
variables.
In Panel B of Table 10, we examine the impact of acquirer’s Board Size, % Outside Directors,
and CEO-Chairman duality on the probability of a ratings upgrade for target bondholders. Different from
the findings on bond excess returns, acquirers’ % Outside Directors has a significant positive coefficient,
a finding that is consistent with the Managerial Monitoring Hypothesis. Notably, Board Size does not
have a significant coefficient in any of the specifications. Finally, we find that AInstTop5 and
AInstBlock continue to positively impact the probability of a ratings upgrade for target bondholders.

24
Overall, the findings using ratings changes are also supportive of the Managerial Monitoring
Hypothesis, particularly when shareholder power is proxied by concentrated acquirer institutional
ownership.10
4.7. Which Institutions Matter? Disaggregating Institutional Ownership
Next, we examine which types of institutions play a significant role in affecting target
bondholders’ returns. In Table 11, Model 1, we disaggregate institutional ownership by type of
institution. Across the 147 deals in Table 11, mean total acquirer ownership by different institutions, if
the institution is among the top 5 owners, is as follows: banks, 3.97%, insurance companies, 1.43%,
investment companies, 2.90%, investment advisors, 7.20%, public pensions, 0.19%, and others, 0.82%.
Furthermore, the number of deals out of the 147 total deals in which different institutions are not a part of
the top 5 owners in our sample are: banks, 35, insurance companies, 89, investment companies, 66,
investment advisors, 4, public pensions, 131, and others, 134. These participation rates suggest that
investment advisors are prominent owners of our acquiring firms. In fact, investment advisors hold
blocks (5% or more) in 23% of our acquiring firms, which is the highest percentage among all the
different types of institutions.
In Model 1 of Table 11, we replace AInstTop5 with the percentage holdings of each type of
institution if they are in the top 5, while Model 2 makes use of dummy variables indicating whether each
type of institution holds more than 5% of acquirer shares.11
Based on Models 1 and 2 in Table 11, our consistent finding is that the presence of Investment
Advisors as owners of acquirer stock has a positive effect on target bondholders’ excess returns at M & A
announcements. These findings are consistent with those in Chen, Harford, and Li (2006), who find that
concentrated institutional ownership by long-term independent institutional owners leads to better
performing M & A’s. They define independent institutions as public pension funds, investment advisors,
and investment companies, but according to them it is only the pension funds and investment advisors
that monitor managers. In our sample, pension funds are not important owners, while investment
advisors are. Thus the findings regarding investment advisors, in conjunction with those of Chen,
Harford, and Li (2006), further support the monitoring role of shareholder power claimed in the
Managerial Monitoring Hypothesis.12
10 We are unable to repeat our analysis of target bond ratings changes with the G-, E-, and ATI-Indexes because of extremely small samples of bonds with ratings changes as well as limited availability of data on corporate governance indexes for acquirers. 11 There are no public pension fund blockholders in our sample of 147 deals. 12 We do not attach the same interpretation to the positive coefficient for investment companies based on the literature on their monitoring activities. In fact, according to Qiu (2004), investment companies “monitor” by their feet.

25
4.8. Which Target Bonds Gain? Investment or Speculative Grade?
Investment grade target bonds have limited upside potential, while speculative bonds can benefit
substantially by an improvement in corporate governance. This notion is tested in Table 11 in Models 3
and 4. According to Model 3, relative to investment grade bonds, speculative bonds gain more from the
holdings of the top 5 institutional owners. The coefficient for the interaction term is 0.072, which is
significant at the 5% level. However, when we control for the speculative nature of the target bond in
Model 4, the interaction term is still positive but not significant anymore. Furthermore, the coefficient of
AInstTop5 remains highly significant and positive. These findings suggest that our results are not driven
by distressed debt, and that investment bonds gain as well.
We also repeated the analysis with the G-Index, but in unreported findings the interaction terms
were negative though not significant in both estimations corresponding to Models 3 and 4 in Table 11.
Finally, we repeat our analysis using Board Size as the proxy for shareholder power. In additional
unreported findings, now the coefficient of Speculative Target*Board Size is negative and significant (at
the 5% level) in both estimations corresponding to Models 3 and 4. Since smaller boards are considered
better for corporate governance, these results do suggest that speculative bonds gain more from better
board monitoring.
4.9. Acquirer response to prevent gains to target bonds: Impact of Issuance of Debt?
One way to expropriate bondholders is to issue debt to finance the deal. To test for expropriation,
in Table 11, Model 5, we interact our shareholder power proxies with a dummy variable indicating
whether debt securities are used as a source of financing. We also include a dummy variable to indicate
whether debt securities are used in the transaction. There are only seven deals from among our 147 deals
for which SDC indicates that the transaction is being financed in some portion by debt securities.13
Model 5 shows that there is no evidence that institutional shareholders expropriate wealth from
bondholders by making management issue debt to finance the deal. The interaction term between top 5
institutional holdings and a dummy variable for debt issuance is positive and significant (1% level of
significance), which is contrary to the Shareholder Expropriation Hypothesis. Note, however, that Debt
Issue itself has the expected adverse effect on target bondholders (coefficient of Debt Issue is negative
and significant).
Arguably, the mere seven cases of financing the deal with debt may understate an increase in
acquirer leverage meant to expropriate wealth from bondholders. We define leverage prior to the
13 The SDC reporting of a small number of cases of debt financing specifically for the M & A deal likely understates other increases in acquirer debt, since acquirer leverage is typically rising around M & A’s (Ghosh and Jain, 2000).

26
announcement date as the ratio of the sum of the target and acquirer book debts to the sum of their total
book assets. After the effective date, the leverage is just the ratio of the acquirer’s book debt to its total
book assets. For the 90 cases of completed deals where 100% of the target has been acquired, the mean
(median) change in leverage for years +1 and +2 after the effective date from the average for years -1 and
-2 prior to the announcement date is 3.0% (2.1%), both mean and median changes being significant at the
1% level. Some 58% of the deals experience an increase in leverage. This is consistent with the increase
in leverage surrounding M & A’s found by others (Ghosh and Jain, 2000). With a (0, 1) dummy for an
increase in this leverage (Leverage Increase instead of Debt Issue), we repeat the analysis in Model 5 of
Table 11. The coefficient of the interaction term, AInstTop5*Leverage Increase, is insignificant, while
our baseline results regarding a positive and significant coefficient on AInstTop5 continue to hold. Thus,
an increase in leverage is not associated with lower returns to target bondholders. We confirm these
findings with other proxies of shareholder power, Board Size and Ln (1 + G-Index). We conclude, like
Ghosh and Jain (2000), that the evidence does not support that the increase in leverage is associated with
expropriation of bondholders’ wealth. Instead, other motives, such as an increase in debt capacity, may
underlie the increase in leverage.
Overall, our results from this entire Section 4 show a significant positive relation between excess
target bond returns and holdings of the top 5 institutional owners of the acquiring firm. The findings are
robust to controls for target shareholder power, deal and firm characteristics of the target and acquirer,
and for firm and deal quality. Other proxies – additional measures of institutional ownership, board
characteristics, and indexes based on corporate governance provisions -- corroborate the positive relation
between target bond values and shareholder power. The findings are also corroborated with ratings
changes for target bonds, and the findings on the type of institutional owners (Investment Advisors) that
take a prominent monitoring role. In sum, the Managerial Monitoring Hypothesis is consistently
supported by the evidence.
5. Alignment of Bondholders with Managers: Effect of Managerial Ownership
Under certain circumstances, managers and bondholders have complementary interests that may
be detrimental to the wealth of equity holders. Risk-averse managers may invest in value-destroying risk-
reducing investments to protect their firm-specific human capital (Amihud and Lev, 1981, Smith and
Stulz, 1985, and May, 1995), or their perquisite consumption (Williams, 1987).
At low levels of ownership, an increase in managerial ownership increases management
incentives to increase shareholders’ wealth at the expense of bondholders’ wealth, since there is a
growing alignment of interests between managers and shareholders (Jensen and Meckling, 1976).

27
However, at high levels of managerial ownership, management can become overly risk averse as its
wealth becomes under-diversified, and there may now be greater alignment between managers’ and
bondholders’ interests. Managers may engage in less risky projects to reduce the uncertainty of their own
firm-specific wealth, and bondholders stand to benefit as well. Moreover, as managerial ownership
increases, the firm is less likely to be disciplined by the takeover market (Song and Walkling, 1993), and
thus perquisite consumption may increase even more. Thus, at higher levels of managerial ownership,
another reason to reduce firm risk is to protect their larger perquisite consumption (Williams, 1987; John,
Litov, and Yeung, 2005). Consistent with this reasoning, Bagnani, et. al. (1994) find that bond yields
increase with managerial ownership at low levels of ownership, and decrease with managerial ownership
at high levels of ownership. Correspondingly in our M & A context, we formulate a Mutual Interest
Hypothesis: Target bond returns at M & A announcements are negatively (positively) related to acquirer
managerial ownership at low (high) levels of managerial ownership. In effect, at low levels, increases in
managerial ownership enhance shareholder power, but, at high levels, increases in managerial ownership
diminish shareholder power.
In Models 6 and 7 of Table 11, we examine the effects of acquirer managerial ownership on
target bondholder wealth. The coefficient on management ownership is 0.089 in Model 6, significant at
the 10% level. This positive coefficient contradicts the Mutual Monitoring Hypothesis. Moreover, the
coefficient of (management holdings)2 is not significant, so that there is no evidence of a non-linear
relation between managerial ownership and target announcement period excess bond returns. Thus,
increases in acquirer managerial ownership are beneficial to bondholders through the range of managerial
ownership in our sample, which is consistent with the Mutual Monitoring Hypothesis.
Finally in Model 7, we include AInstTop5 as an independent variable, and find that its coefficient
remains positive and highly significant. This affirms the robustness of the relation between excess returns
to target bondholders and AInstTop5 even after controlling for managerial ownership.
6. Conclusion
This paper examines target bondholders’ wealth changes during a takeover event, and relates
these wealth changes to shareholder power at the acquiring firm. Target bondholders’ claims shift from
the target to the acquirer shareholders as a result of the takeover. Prior literature suggests that higher
shareholder power at the acquiring firm can adversely affect bondholder wealth because it empowers
acquiring shareholders to expropriate wealth from bondholders during takeovers (Cremers, Nair, and Wei,
2007). Our findings do not support this view. Instead, we find that target bondholders benefit from
moving to an acquirer with high shareholder power. In particular, an increase in the shares held by the
top 5 institutions among the acquiring shareholders is associated with a significant increase in excess

28
bond returns at the time of the announcement of the takeover. Similarly, target bonds experience an
improvement in ratings if the acquiring firm has higher stock ownership held by the top 5 institutions.
Furthermore, other proxies for shareholder power – institutional blockholdings, Board Size, G- and E-
Indexes – also consistently validate the positive relation between target bond values and acquirer
shareholder power. These findings support the view that stronger shareholder power, through superior
monitoring of managers, improves asset and collateral values, which benefits bondholders. Gompers,
Ishii, and Metrick (2003) and Bebchuk, Cohen, and Ferrell (2005) provide evidence that shows that good
corporate governance results in better returns to shareholders. Adding in our evidence regarding returns
to target bondholders during M & A’s, good corporate governance is beneficial to both stockholders and
bondholders.

29
Appendix A
Factors Affecting Target Bondholders: Additional Control Variables in Analysis
Relative size (Acquirer/Target): Larger targets make for more complex acquisitions with greater
uncertainties about synergies (Bhagat, Dong, Hirshleifer, and Robert, 2005). Acquisitions of larger
targets could also be driven by hubris (Jensen, 1986). While these reasons suggest that there is a direct
relation between relative size and wealth changes for target bondholders (equity premiums also increase
with relative size, Jarrell and Poulsen, 1989, and Billet and Ryngaert, 1997), other reasons suggest that
the relation may be inverse. For example, larger targets have a greater coinsurance potential
(Hovakimian, Opler, and Titman, 2001).
Tender Offer: Tender offers bypass management and indicate a greater confidence on the part of the
acquirer (Loughran and Vijh, 1997), predicting gains for bondholders. However, tender offers entail
more aggressive bargaining and can lead to higher premiums being paid to stockholders (Schwert, 2000).
Hostile Offer: Unlike friendly deals, hostile deals tend not to be driven by empire-building and face more
scrutiny. They are more likely to create value, and therefore to be seen favorably by bondholders. On the
other hand, the firm may land up paying more to target shareholders, and this drain affects bondholders
adversely.
Cash Offer: A cash offer directly lowers collateral value, and it also typically requires the acquirer to
raise debt financing (Faccio and Masulis, 2005), which increases leverage and default risk. Consequently,
bond prices are expected to drop if the offer is financed with cash. But, equity-financed transactions may
also be bad news for the firm and the M & A, and bondholders as well, because of the implied
overvaluation (Myers and Majluf, 1984, Mitchell and Stafford, 2000).
M & A’s in 1990’s: The 1990’s saw bondholders protect themselves with event risk covenants
(McDaniel, 1986, Lehn and Poulsen, 1991, Cook and Easterwood, 1994, and Nash, Netter, and Poulsen,
2003). We expect that on average bondholders will fare better in M & A’s in the 1990’s.
Completed Deals: Completed deals, in contrast to withdrawn deals, are more likely to have larger bond
price and ratings effects since investors anticipate and discount the effects of withdrawn offers.

30
Non-Diversifying Deals: While bondholders are likely to be adversely affected by value-destroying
conglomerate M & A’s motivated by empire-building, they benefit from the risk reduction that comes
from the accompanying diversification.

31
References
Agrawal, Anup, and Gershon N. Mandelker, 1990, Large Shareholders and the Monitoring of Managers:
The Case of Antitakeover Charter Amendments, Journal of Financial and Quantitative Analysis
25, 143-161.
Amihud, Yakov and Baruch Lev, 1981, Risk Reduction as a Managerial Motive for Conglomerate
Mergers, Bell Journal of Economics 12, 605-617.
Anderson, R.S., S. A. Mansi, and D. Reeb, 2003, Family Ownership and the Agency Cost of Debt,
Journal of Financial Economics 68, 263-285.
Andrade, Gregor, Mark Mitchell, and Erik Stafford, 2001, New Evidence and Perspectives on Mergers,
Journal of Economic Perspectives 15, 103-120.
Asquith, Paul and E. Han Kim, 1982, The Impact of Merger Bids on the Participating Firms’ Security
Holders, Journal of Finance 37, 1209-1228.
Bagnani, Elizabeth Strock, Nikolaos T. Milonas, Anthony Saunders, and Nickolaos G. Travlos, 1994,
Managers, Owners, and The Pricing of Risky Debt: An Empirical Analysis., Journal of Finance
49, 453-477.
Barclay, Michael and C. Holderness, 1989, Private Benefits from Control of Public Corporations, Journal
of Financial Economics 25, 371-95.
Baysinger, B. and H. Butler, 1985, Corporate Governance and the Board of Directors: Performance
Effects in Board Composition, Journal of Law, Economics and Organization 1, 101-124.
Bebchuk, Lucian A., A. Cohen, and A. Ferrell, 2005, What Matters in Corporate Governance? Harvard
Law School Working Paper.
Berle, Adolf A. and Gardiner C. Means, 1932, The Modern Corporate and Private Property, MacMillan
Publishers, New York, NY.
Bhagat, Sanjai and R. Jeffries, 2002, The Econometrics of Corporate Governance Studies, The MIT Press,
Cambridge, MA.
Bhagat, Sanjai, Ming Dong, David Hirshleifer, and Robert Noah, 2005, Do Tender Offers Create Value?
New Methods and Evidence, Journal of Financial Economics 76, 3-60.
Bhide, Amar, 1994, Efficient Markets, Deficient Governance: U.S. Securities Regulations Protect
Investors and Enhance Market Liquidity. But do they Alienate Managers and Shareholders?
Harvard Business Review 72, 128-140.
Bhojraj, Sanjeev and Partha Sengupta, 2003, Effect of Corporate Governance on Bond Ratings and
Yields: The Role of Institutional Investors and Outside Directors, Journal of Business 76, 455-
475.

32
Billett, Matthew T., Tao-Hsien Dolly King, and David C. Mauer, 2004, Bondholder Wealth Effects in
Mergers and Acquisitions: New Evidence from the 1980s and 1990s. Journal of Finance 59, 107-
135.
Billett, Matthew T. and Mike Ryngaert, 1997, Capital Structure, Asset Structure, and Equity Takeover
Premiums in Cash Tender Offers, Journal of Corporate Finance 3, 141-165.
Black, Bernard S., 1990, Shareholder Passivity Reexamined, Michigan Law Review 89, 520-608.
Black, Bernard S., and John Coffee, 1994, Hail Britannia?: Institutional Investor Behavior Under Limited
Regulation, Michigan Law Review 92, 1999-2088.
Brickley, James A., Ronald C. Lease, and Clifford W. Smith, 1988, Ownership Structure and Voting on
Antitakeover Amendments, Journal of Financial Economics 20, 267-293.
Brickley, James A., Jeffrey L. Coles, and Rory L. Terry, 1994, Outside Directors and the Adoption of
Poison Pills, Journal of Financial Economics 35, 371-390.
Bryd, J. and K. Hickman, 1992, Do Outside Directors Monitor Managers? Evidence from Tender Offer
Bids, Journal of Financial Economics 32, 371-390.
Chen, Xia, Jarrad Harford, and Kai Li, 2006, Monitoring: Which institutions matter?, Journal of
Financial Economics, Forthcoming.
Coles, Jeffrey L., Michael L. Lemmon, and Felix J. Meschke, 2005, Structural Models and Endogeneity
in Corporate Finance: The Link between Managerial Ownership and Corporate Performance,
Working Paper.
Cook, Douglas O. and John C. Easterwood, 1994, Poison Put Bonds: An Analysis of their Economic
Role, Journal of Finance 49, 1905-1920.
Cook, Douglas O. and John D. Martin, 1991, The Coinsurance and Leverage Effects on Target Firm
Bondholder Wealth, Research in Finance 9, 107-129.
Cotter, J., A. Shivdasni, and M. Zenner, 1997, Do Independent Directors Enhance Target Shareholders
Wealth during Tender Offers? Journal of Financial Economics 43, 195-218.
Cremers, K.J. Martijn, Vinay B. Nair, and Chenyang Wei, 2007, Governance Mechanisms and Bond
Prices, Review of Financial Studies, Forthcoming.
Demsetz, Harold and Kenneth Lehn, 1985, The Structure of Corporate Ownership: Causes and
Consequences, Journal of Political Economy 93, 1155-1177.
Denis, David and John J. McConnell, 2003, International Corporate Governance, Journal of Financial
and Quantitative Analysis 38, 1-36.
Dennis, Debra K. and John J. McConnell, 1986, Corporate Mergers and Security Returns, Journal of
Financial Economics 16, 143-187.
Eger, Carol E., 1983, An Empirical Test of the Redistribution Effect in Pure Exchange

33
Mergers, Journal of Financial and Quantitative Analysis 4, 547-572.
Faccio, Mara and Ronald W. Masulis, 2005, The Choice of Payment Method in European Mergers and
Acquisitions, Journal of Finance 60, 1345-88.
Fama, Eugene F., 1998, Market Efficiency, Long-Term Returns, and Behavioral Finance, Journal of
Financial Economics 49, 283-306.
Galai, Dan and Ronald Masulis, 1976, The Option Pricing Model and the Risk Factor of Stock, Journal of
Financial Economics 3, 53-81.
Ghosh, Aloke and Prem C. Jain, 2000, Financial Leverage Changes Associated with Corporate Mergers,
Journal of Corporate Finance 6, 377-402.
Gompers, Paul A., Joy Ishii, and Andrew Metrick, 2003, Corporate Governance and Equity Prices,
Quarterly Journal of Economics 118, 107-155
Gompers, Paul A. and Andrew Metrick, 2001, Institutional Investors and Equity Prices, Quarterly
Journal of Economics 116, 229-259.
Graham, John R., Michael L. Lemmon, and James S. Schallheim, 1998, Debt, Lease, Taxes, and
Endogeneity of Corporate Tax Status, Journal of Finance 53, 131-162.
Hartzell, Jay C. and Laura T. Starks, 2003, Institutional Investors and Executive Compensation, Journal
of Finance 58, 2351-2374.
Hermalin, E. Benjamin and Michael S. Weisbach, 2003, Board of Directors as an Endogenously
Determined Institution: A Survey of the Economic Literature, Economic Policy Review 9, 7-26.
Higgins, Robert C. and Lawrence D. Schall, 1975, Corporate Bankruptcy and Conglomerate Merger,
Journal of Finance 30, 93-111.
Hovakimian, Armen, Tim Opler, and Sheridan Titman, 2001, The Debt-Equity Choice, Journal of
Financial and Quantitative Analysis 36, 1-24.
Jarrell, Gregg A., and Annette B. Poulsen, 1989, The Returns to Acquiring Firms in Tender Offers:
Evidence from Three Decades, Financial Management 18, 12-19.
Jensen, Michael C., 1986, Agency Costs of Free Cash Flow, Corporate Finance, and Takeovers, American
Economic Review 76, 323-29.
Jensen, Michael C., 1993, The Modern Industrial Revolution, Exit, and the Failure of Internal Control
Systems, Journal of Finance 48, 831-880.
Jensen, Michael C. and William H. Meckling, 1976, Theory of the Firm: Managerial Behavior, Agency
Costs and Ownership Structure, Journal of Financial Economics 3, 305-360.
John, Kose, Lubomir Litov, and Bernard Yeung, 2005, Corporate Governance and Managerial Risk-
Taking: Theory and Evidence, University of Washington in St. Louis Working Paper.

34
Karpoff, Jonathan M., Paul H. Malatesta, and Ralph A. Walkling, 1996, Corporate Governance and
Shareholder Initiatives: Empirical Evidence, Journal of Financial Economics 42, 365-395.
Kim, E. Han and John J. McConnell, 1977, Corporate Mergers and the Co-insurance of Corporate Debt,
Journal of Finance 32, 349-365.
Klock, Mark S., Sattar A. Mansi, and William F. Maxwell, 2005, Does Corporate Governance Matter to
Bondholders?, Journal of Financial & Quantitative Analysis 40, 693-719.
Lehn, Kenneth and Annette B. Poulsen, 1991, Contractual Resolution of Bondholder-Stockholder
Conflicts in Leveraged Buyouts, Journal of Law and Economics 34, 645-673.
Lewellen, Wilbur G., 1971, A Pure Financial Rationale for the Conglomerate Merger, Journal of Finance
26, 521-537.
Levy, Haim and Marshall Sarnat, 1970, Diversification, Portfolio Analysis, and the Uneasy Case for
Conglomerates, Journal of Finance 25, 795-802.
Loughran, Tim and Anand M. Vijh, 1997, Do Long-Term Shareholders Benefit from Corporate
Acquisitions? Journal of Finance 52, 1765-1790.
Lyon, J., B. Barber, and C. Tsai, 1999, Improved Methodology for Tests of Long-Run Abnormal Stock
Returns, Journal of Financial Economics 54, 165-201.
Maquieira, Carlos P., William L. Megginson, and Lance A. Nail, 1998, Wealth Creation versus Wealth
Redistributions in Pure Stock-for-Stock Mergers, Journal of Financial Economics 48, 3-33.
Masulis, Ronald W., Cong Wang, and Fei Xie, 2007, Corporate Governance and Acquirer Returns,
Journal of Finance, Forthcoming.
Maug, E., 1998, Large Shareholders as Monitors: Is there a Tradeoff Between Liquidity and Control?
Journal of Finance 53, 65-98.
May, Don O., 1995, Do Managerial Motives Influence Firm Risk Reduction Strategies?, Journal of
Finance 50, 1291-1308.
McConnell, John J. and Henri Servaes, 1990, Additional Evidence on Equity Ownership and Corporate
Value, Journal of Financial Economics 27, 595-612.
McDaniel, Morey, 1986, Bondholders and Corporate Governance, Business Lawyer 41, 413-460.
Mitchell, Mark L. and Erik Stafford, 2000, Managerial Decisions and Long-Term Stock Price
Performance, Journal of Business 73, 287-329.
Moeller, Sara B., Frederik P. Schlingemann, and René M. Stulz, 2004, Firm Size and the Gains from
Acquisitions, Journal of Financial Economics 73, 201-228.
Moeller, Sara B., Frederik P. Schlingemann, and René M. Stulz, 2005, Wealth Destruction on a Massive
Scale? A Study of Acquiring Firm Returns in the Recent Merger Wave, Journal of Finance 60,
757-782.

35
Morck, Randall, Andrei Shleifer, and Robert V. Vishny, 1988, Management Ownership and Market
Valuation, Journal of Financial Economics 20, 293-315.
Myers, Stewart C. and Nicholas Majluf, 1984, Corporate Financing and Investment Decisions When
Firms Have Information That Investors Do Not Have, Journal of Financial Economics 13, 187-
221.
Nash, Robert C., Jeffrey Netter, and Annette Poulsen, 2003, Determinants of Contractual Relations
between Shareholders and Bondholders: Investment Opportunities and Restrictive Covenants,
Journal of Corporate Finance 9, 201-232.
Nesbitt, Stephen, 1994, Long-term Rewards from Shareholders Activism: A Study of the CalPERS
Effect, Journal of Applied Corporate Finance 6, 75-80.
Noe, T., 2002, Institutional Activism and Financial Market Structure, Review of Financial Studies 15,
289-319.
Pound, John, 1988, Proxy Contests and the Efficiency of Shareholder Oversight, Journal of Financial
Economics 20, 237-265.
Qiu, Lily, 2004, Which Institutional Investors Monitor? Evidence from Acquisition Activity, Working
Paper, Department of Economics, Brown University.
Renneboog, Luc, Peter G. Szilagyi, and Marina Martynova, 2006, How Do Mergers Affect Bondholders
in Europe? Evidence on the Impact and Spillover of Governance and Legal Standards, Tilburg
University Working Paper.
Roe, Mark J., 1994, Strong Managers, Weak Owners: The Political Roots of American Corporate
Finance, Princeton University Press, Princeton, NJ.
Schwert, William G., 2000, Hostility in Takeovers: In the Eyes of the Beholder? Journal of Finance 55,
2599-2640.
Shastri, Kuldeep, 1990, The Differential Effects of Mergers on Corporate Security Values, Research in
Finance 8, 179-201.
Shleifer, Andrei and Robert W. Vishny, 1986, Large Shareholders and Corporate Control, Journal of
Political Economy 94, 461-488.
Smith, Michael, 1996, Shareholder Activism by Institutional Investors: Evidence from CalPERS, Journal
of Finance 51, 227–252.
Smith, Clifford W. and René M. Stulz, 1985, The Determinants of Firms' Hedging Policies, Journal of
Financial and Quantitative Analysis 20, 391-405.
Song, Moon H. and Ralph A. Walkling, 1993, The Impact of Managerial Ownership on Acquisition
Attempts and Target Shareholder Wealth, Journal of Financial and Quantitative Analysis 28,
439-457.

36
Warga, Arthur and Ivo Welch, 1993, Bondholder Losses in Leveraged Buyouts, Review of Financial
Studies 6, 959-982.
Weisbach, Michael S., 1988, Outside Directors and CEO Turnover, Journal of Financial Economics 20,
431-460.
Williams, Joseph T., 1987, Perquisites, Risk, and Capital Structure, Journal of Finance 42, 29-48.
Zingales, Luigi, 1994, The Value of the Voting Right: A Study of the Milan Stock Exchange Experience,
Journal of Financial Economics 7, 125-148.

37
Table 1: Frequency of M & A Deals by Year of Announcement Deals include all completed or withdrawn mergers and acquisitions announced during 1979 to 1997 and listed in the Securities Data Corporation’s (SDC) Mergers and Acquisitions Database. The target and acquirer must exist on CRSP with non-missing announcement date stock returns, have valid accounting data on Compustat, have valid corporate governance data from proxy statements in the fiscal year end just prior to the announcement date, and have valid institutional ownership data from Thomson Financial in the quarter prior to the quarter in which the merger announcement falls in. The target must also have bonds listed on the Lehman Brothers Bond Database (LBBD) that satisfies either of the following conditions: 1) The target have valid bond returns in Month -1, and Month 0, that are based on non-matrix prices, where Month 0 is the month of the announcement date; or 2) The target have at least one rated bond existing in both Month -3 and Month +3, where Month -3 is with respect to the announcement date of the deal and Month +3 is with respect to the effective date of the deal.
Year Frequency Percent 1980 1 0.36 1981 11 3.91 1982 6 2.14 1983 12 4.27 1984 13 4.63 1985 30 10.68 1986 16 5.69 1987 14 4.98 1988 17 6.05 1989 22 7.83 1990 12 4.27 1991 18 6.41 1992 11 3.91 1993 9 3.2 1994 19 6.76 1995 27 9.61 1996 22 7.83 1997 21 7.47 Total 281 100

38
Table 2: Descriptive Statistics-- Deal, Firm, Bond, and Governance Characteristics
Deal characteristics are from the SDC, firm characteristics are from Compustat and CRSP, and bond characteristics are from the LBBD. Institutional holdings are from SEC Form 13F quarterly filings, as provided by Thomson Financial, while management holdings and board characteristics are collected from proxy statements and Compact Disclosures Discs. Takeover vulnerability indexes are from the Investor Responsibility Research Center (IRRC). ROE is defined as the ratio of net income to book equity, while ROA is the ratio of net income to total assets. Size is defined in terms of the market value of the firm, and is equal to the sum of stock market capitalization and total assets minus book equity. Size and book assets are expressed in 1998 dollars using the Consumer Price Index. Growth is given by the ratio of size to book assets. Unlevered stock returns are computed as one minus the firm’s market leverage ratio at the end of the corresponding fiscal year-end times equity returns. The firm’s market leverage ratio is defined as the ratio of book value of total debt to the sum of the book value of total debt and market value of equity. The market value of equity in the leverage calculation is from CRSP and is the value for the corresponding month as the stock return. We compute the standard deviation of unlevered stock returns using monthly stock returns from Month -25 to Month -2. We require that the firm has at least 12 months of non-missing returns during this window. When a firm has multiple bonds, the bond maturity and ratings are market-value weighted average where the market value of the bond is taken as of Month -3. Bond maturity is the no. of years to maturity, measured with respect to the announcement date. Bonds rated AAA+ are given a no. of 23 and bonds rated D are given a no. of 1. The G-index is calculated as per Gompers, Ishii, and Metrick (2003), the E-index is calculated as per Bebchuk, Cohen, and Ferrell (2005), and the ATI-Index is calculated as per Cremers, Nair, and Wei (2006). Paired T-Tests and the Wilcoxon Signed Rank Sum Test are used to test for differences between the acquirers’ and targets’ mean and median values, respectively. The asterisks, ***, **, and * denote significance at the 1%, 5% and 10% levels, respectively.

39
Table 2, cont’d
Panel A: Deal Characteristics VARIABLE N % Proportion 100% Cash Financed 281 32.74 Proportion 100% Stock Financed 281 22.06 Proportion with Tender Offer 281 16.73 Proportion with Hostile Bid 281 10.32 Proportion of Completed Deals 281 69.75 VARIABLE N MEAN MEDIAN Days btw ann. date and eff. date 196 145.15 120.50 Transaction Value (in 1998 $mil) 253 3040.84 1119.72 % of Target Acquired 186 68.92 100.00 Panel B: Firm Characteristics Acquirer Target VARIABLE N MEAN MEDIAN N MEAN MEDIAN ROE 281 0.126 0.147 281 0.035 ** 0.112 *** ROA 281 0.035 0.032 281 0.018 *** 0.016 *** Growth 281 1.304 1.116 281 1.198 *** 1.069 *** Total Debt/Total Asset 281 0.283 0.253 281 0.325 *** 0.276 *** Size (in 1998 $mil) 281 29563 11409 281 14689 *** 5486 *** Book Total Asset (in 1998 $mil) 281 25981 8672 281 13747 *** 4479 *** Std Dev of Unlevered Stk Ret 281 0.059 0.057 281 0.047 0.044 Panel C: Bond Characteristics Bond Maturity (years) 193 12.04 10.63 281 10.55 *** 9.18 *** Month -3 Bond Rating 189 16.28 17.00 281 13.74 *** 14.00 *** Average No. of Bonds 193 5.51 3.00 281 3.64 *** 2.00 *** Panel D: Ownership Management Hldg (%) 281 11.06 2.49 281 10.23 2.99
Total Institutional Hldg (%) 281 43.88 45.96 281 41.79 41.13 ** Top 5 Institutional Hldg (%) 281 15.89 14.52 281 18.65 *** 16.65 *** Dummy for Blockholder Institution 281 0.51 1.00 281 0.59 * 1.00 *
Panel E: Board Structure Board Size 281 13.46 13.00 281 12.64 *** 12.00 *** % of Outside Director 281 75.39 78.26 281 75.50 78.57
Dummy for duality of CEO-Chairman 281 0.83 1.00 281 0.74 ** 1.00 *** Panel F: Takeover vulnerability G-Index 107 8.88 9.00 89 9.70 10.00 * E-Index 107 1.61 2.00 89 2.18 ** 2.00 ** ATI-Index 107 1.56 1.00 89 1.71 2.00

40
Table 3: Target Bond Returns and Rating Changes Surrounding M & A’s, 1979 - 1997 The following table gives the univariate tests of target bond excess returns and target bond rating changes. Excess returns are the sum of the excess returns for the 2 months period, Months -1 and 0, where Month 0 is the month of the announcement date. Excess bond returns are calculated as the bond’s total return minus the return on a similar risk and maturity bond index. Target bond rating changes is measured as the difference in the target’s bond ratings on Month -3 and Month +3, where Month -3 is measured with respect to the month of the announcement date and Month + 3 is measured with respect to the month of the effective date or withdrawn date. Bonds rated AAA+ is given a no. of 23 and those rated D is given a no. of 1, bonds that are not rated are not included in the bond rating changes tests. When a target has multiple bonds, a firm-level average of bond returns and bond rating change is calculated using the market values of the bonds in Month -3. Investment grade bonds are defined as those with Moody’s ratings equal to or better than Baa3. JRT is the rating on the worst rated bond that the firm has. The significance level of the means and medians is tested using T-test and Wilcoxon Signed Rank Test respectively. The significance level between group means is tested using T-test assuming unequal variances across groups when a test of equal variances is rejected at the 10% level. The significance level of the medians is tested using the Wilcoxon-Mann-Whitney test. The asterisks, ***, **, and * denote significance at the 1%, 5% and 10% levels, respectively.
Bond Returns (%) Bond Rating Changes N Mean Median N Mean Median Full Sample 214 0.484 ** 0.129 266 -0.067 0.000
Sample Grouped by Target JRT Investment Grade 139 -0.453 ** -0.082 * 174 -0.220 0.000 Speculative Grade 75 2.219 *** 1.327 *** 92 0.222 0.000 Difference -2.672 *** -1.409 *** -0.442 * 0.000 *
Sample Grouped by Deal Status Completed 150 0.723 *** 0.247 ** 183 0.134 0.000 Withdrawn 64 -0.077 -0.009 83 -0.511 *** 0.000 *** Difference 0.800 0.256 * 0.645 *** 0.000 ***

41
Table 4: Impact of Acquirer Corporate Governance on Target Bond Returns & Ratings Changes The following table gives the univariate tests of target bond excess returns and rating changes across various subgroups. For total institutional holdings, top 5 institutional holdings, board size and percentage of outside directors, the firms are divided into 3 groups based on the values of each measure. Only the top and bottom terciles are contrasted. For the G-index and E-index, the firms are divided into two groups based on the median values. The significance level of the means and medians is tested using T-test and Wilcoxon Signed Rank Test respectively. The significance level between group means is tested using T-test assuming unequal variances across groups when a test of equal variances is rejected at the 10% level. The significance level of the medians is tested using the Wilcoxon-Mann-Whitney test. The asterisks, ***, **, and * denote significance at the 1%, 5% and 10% levels, respectively.

42
Table 4, cont’d
Bond Returns (%) Bond Rating Changes N Mean Median N Mean Median
Acquirer Institutional Holdings Total Institutional Holdings is:
High 76 0.775 ** 0.253 ** 88 0.245 0.000 Low 67 0.186 -0.075 87 -0.459 *** 0.000 *** Difference 0.589 0.328 0.704 ** 0.000 ***
Sum of Top 5 Institutional Holdings is: High 71 1.155 *** 0.309 *** 86 0.320 * 0.000 * Low 71 0.284 -0.009 88 -0.409 ** 0.000 *** Difference 0.871 0.318 * 0.729 *** 0.000 ***
Presence of Blockholder Institution Yes 109 0.991 *** 0.281 *** 133 0.150 0.000 No 105 -0.043 -0.082 133 -0.284 * 0.000 * Difference 1.034 ** 0.363 ** 0.435 * 0.000 **
Acquirer Board Structure Board Size
Small 79 0.618 0.081 99 -0.281 * 0.000 Big 77 0.024 0.156 96 0.114 0.000 Difference 0.594 -0.075 -0.396 0.000 *
% of Outside Directors is: High 73 0.755 * 0.444 ** 85 0.533 *** 0.000 *** Low 63 0.601 0.018 83 -0.625 *** 0.000 *** Difference 0.154 0.425 1.158 *** 0.000 ***
CEO is also Chairman of Board Yes 181 0.441 0.136 223 -0.089 0.000 No 33 0.718 0.014 43 0.045 0.000 Difference -0.277 0.121 -0.134 0.000
Acquirer Takeover Vulnerability Acquirer Takeover Vulnerability as measured by G-Index
High 40 0.917 * 0.380 *** 44 0.532 ** 0.000 ** Low 51 0.651 ** 0.223 *** 55 1.054 *** 1.000 *** Difference 0.266 0.157 -0.521 -1.000 *
Acquirer Takeover Vulnerability as measured by E-Index High 45 1.094 ** 0.380 *** 45 0.654 *** 0.000 *** Low 49 0.488 * 0.224 ** 54 0.962 *** 1.000 *** Difference 0.606 0.156 -0.308 -1.000 *

43
Table 5: Regressions of Target Bond Returns against Acquirer Institutional Monitoring The following table gives the regressions of target announcement period excess bond returns against measures of institutional monitoring. JRT Diff is the difference between acquirer JRT and target JRT where JRT is the ratings on the firm’s worst rated bond. D(TLev > ALev) equals to one if target’s total debt to book assets ratio is greater than that of the acquirer’s. D(TRetStd > ARetStd) equals to one if the target’s standard deviation of unlevered stock returns is greater than that of the acquirer’s. D(TMaturity < AMaturity) equals to one if the target’s bonds have shorter maturity than that of the acquirer’s. AInstTotal is the percentage of acquirer shares held by all institutions in the quarter just prior to the quarter the announcement date is in. AInstTop5 (TInstTop5) is the percentage of acquirer’s (target’s) shares held by the five largest institutional owners of the acquirer. AInstBlock is a dummy variable indicating whether there is any institution who holds more than 5% of the acquirer’s share. Robust T-Statistics are reported in italics. The asterisks, ***, **, and * denote significance at the 1%, 5% and 10% levels, respectively.
(1) (2) (3) (4) (5) (6) (7) (8) Constant -0.634 -1.632* -1.503** -1.240 -1.477 -1.507 -1.321* -1.579** 0.88 1.70 1.98 1.58 1.55 1.58 1.70 2.02 JRT Diff 0.253*** 0.236*** 0.260*** 0.250*** 0.261*** 0.260*** 0.264*** 0.268*** 3.81 3.54 3.97 3.72 3.89 3.85 3.97 3.84 D(TLev > ALev) -0.108 -0.025 -0.071 0.069 -0.074 -0.026 -0.105 -0.058 0.18 0.04 0.12 0.11 0.13 0.04 0.17 0.10 D(TRetStd > ARetStd) -0.239 -0.465 -0.485 -0.184 -0.480 -0.418 -0.519 -0.516 0.43 0.80 0.90 0.33 0.85 0.72 0.95 0.94 D(TMaturity < AMaturity) 0.681 0.750* 0.675 0.688 0.672 0.670 0.697 0.734 1.56 1.74 1.62 1.62 1.60 1.59 1.65 1.62 AInstTotal 0.025* -0.001 -0.003 1.81 0.06 0.16 AInstTop5 0.073*** 0.074*** 0.066** 0.075*** 0.065*** 3.35 2.64 2.37 3.31 2.90 AInstBlock 1.060** 0.347 2.38 0.64 TInstTop5 -0.013 0.70 D(AInstTop5 > TInstTop5) 0.334 0.61 Non-Diversifying Deal -0.465 -0.542 -0.575 -0.543 -0.574 -0.581 -0.549 -0.556 0.97 1.18 1.26 1.16 1.26 1.27 1.19 1.22 Acquirer Size/ Target Size 0.018*** 0.019*** 0.019*** 0.019*** 0.019*** 0.019*** 0.019*** 0.019*** 7.47 7.74 8.14 7.68 8.06 7.90 7.56 7.00 Tender Offer 0.479 0.324 0.475 0.695 0.481 0.563 0.478 0.527 0.60 0.41 0.61 0.89 0.63 0.75 0.61 0.65 Hostile -0.147 -0.197 -0.297 -0.314 -0.298 -0.332 -0.314 -0.349 0.19 0.25 0.40 0.42 0.40 0.44 0.42 0.46 Cash -1.331** -1.206** -1.255** -1.139* -1.259** -1.213** -1.242** -1.312** 2.25 2.01 2.20 1.97 2.14 2.08 2.18 2.25 1990s 0.260 -0.002 -0.062 0.077 -0.056 -0.061 0.023 -0.028 0.55 0.00 0.13 0.16 0.12 0.13 0.05 0.06 Completed deals 0.763* 0.788* 0.704 0.736 0.701 0.698 0.705 0.733 1.66 1.73 1.58 1.60 1.57 1.55 1.61 1.64 N 147 147 147 147 147 147 147 147 Adj R-Sq 0.216 0.234 0.269 0.243 0.264 0.261 0.266 0.266

44
Table 6: Regressions of Target Bond Returns against Acquirer Board Monitoring The following table gives the regressions of target announcement period excess bond returns against measures of acquirer board characteristics. Unless otherwise specified, all board structure variables refer to the acquirer. Information on board structure is from company proxy statements. CEO-Chairman duality is an indicator variable indicating whether the CEO is also the chairman of the board. D(Acq Board Size Smaller) is a dummy variable indicating that the acquirer’s board size is smaller than that of the target’s. Robust T-Statistics are reported in italics. The asterisks, ***, **, and * denote significance at the 1%, 5% and 10% levels, respectively.
(1) (2) (3) (4) (5) (6)
Constant 1.047 -0.690 0.088 1.002 1.390 0.895 0.93 0.39 0.09 0.50 1.15 0.75 JRT Diff 0.274*** 0.253*** 0.261*** 0.282*** 0.277*** 0.273*** 4.20 3.78 3.90 4.26 4.18 4.18 D(TLev > ALev) -0.326 -0.107 -0.003 -0.231 -0.370 -0.318 0.54 0.17 0.01 0.39 0.61 0.53 D(TRetStd > ARetStd) -0.087 -0.242 -0.244 -0.129 -0.126 -0.072 0.16 0.44 0.44 0.24 0.23 0.13 D(TMaturity < AMaturity) 0.578 0.684 0.629 0.558 0.575 0.579 1.34 1.54 1.37 1.22 1.34 1.35 Board Size -0.105** -0.113** -0.094* -0.100** 2.18 2.43 1.86 2.03 % Outside Directors 0.001 0.012 0.04 0.64 CEO-Chairman -0.799 -0.749 1.27 1.23 Board Size (Target) -0.032 0.66 D(Acq Board Size Smaller) 0.119 0.25 Controls for deal characteristics Yes Yes Yes Yes Yes Yes N 147 147 147 147 147 147 Adj R-Sq 0.239 0.210 0.218 0.238 0.236 0.234

45
Table 7: Regressions of Target Bond Returns against Acquirer Takeover Vulnerability The following table gives the regressions of target announcement period excess bond returns against a measure of acquirer takeover vulnerability, G-Index. The G-Index is from the Investor Responsibility Research Center (IRRC). The G-index is calculated as per Gompers, Ishii, and Metrick (2003). Unless otherwise specified, the index refers to the acquirer. D(Acq G lower) is a dummy variable indicating that the acquirer has a lower G-Index than the target. Low G-Index is a dummy variable which equals to one if the index is lower than the median index. Controls for deal characteristics do not include the 1990s M & A dummy since IRRC only start in 1990. Robust T-Statistics are reported in italics. The asterisks, ***, **, and * denote significance at the 1%, 5% and 10% levels, respectively.
(1) (2) (3) (4) (5) Constant 3.745** 2.954 0.013 -0.392 -0.081 2.28 0.85 0.00 0.39 0.10 JRT Diff 0.196** 0.289* 0.322* 0.195*** 0.169** 2.46 1.79 1.98 2.71 2.25 D(TLev > ALev) -0.413 -0.374 -0.402 -0.516 -0.258 0.76 0.53 0.55 1.09 0.49 D(TRetStd > ARetStd) -0.050 0.133 0.098 -0.553 -0.216 0.09 0.20 0.15 1.13 0.41 D(TMaturity < AMaturity) -0.452 -0.208 -0.375 -0.403 -0.384 1.16 0.38 0.67 1.08 1.03 Ln(1+G-Index) -1.163* -0.508 0.239 1.74 0.63 0.22 Ln(1+G-Index) (Target) -0.360 0.31 D(Acq G lower) 0.569 0.88 Low G-Index 1.405* 1.402** 1.73 2.42 Low G*AInstTop5 -0.039 1.11 Low G*AInstBlock -0.945 1.09 AInstTop5 0.081** 2.55 AInstBlock 1.355*** 2.80 Controls for deal characteristics Yes Yes Yes Yes Yes N 69 51 51 69 69 Adj R-Sq 0.423 0.062 0.075 0.511 0.476
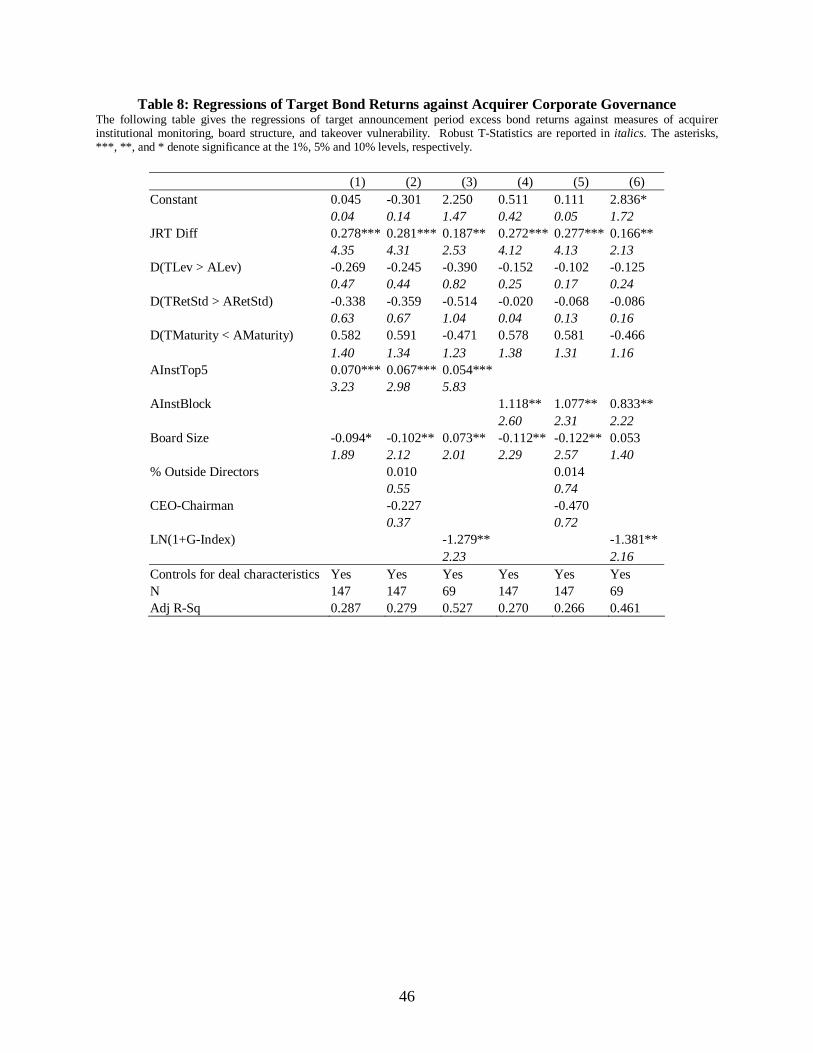
46
Table 8: Regressions of Target Bond Returns against Acquirer Corporate Governance The following table gives the regressions of target announcement period excess bond returns against measures of acquirer institutional monitoring, board structure, and takeover vulnerability. Robust T-Statistics are reported in italics. The asterisks, ***, **, and * denote significance at the 1%, 5% and 10% levels, respectively.
(1) (2) (3) (4) (5) (6) Constant 0.045 -0.301 2.250 0.511 0.111 2.836* 0.04 0.14 1.47 0.42 0.05 1.72 JRT Diff 0.278*** 0.281*** 0.187** 0.272*** 0.277*** 0.166** 4.35 4.31 2.53 4.12 4.13 2.13 D(TLev > ALev) -0.269 -0.245 -0.390 -0.152 -0.102 -0.125 0.47 0.44 0.82 0.25 0.17 0.24 D(TRetStd > ARetStd) -0.338 -0.359 -0.514 -0.020 -0.068 -0.086 0.63 0.67 1.04 0.04 0.13 0.16 D(TMaturity < AMaturity) 0.582 0.591 -0.471 0.578 0.581 -0.466 1.40 1.34 1.23 1.38 1.31 1.16 AInstTop5 0.070*** 0.067*** 0.054*** 3.23 2.98 5.83 AInstBlock 1.118** 1.077** 0.833** 2.60 2.31 2.22 Board Size -0.094* -0.102** 0.073** -0.112** -0.122** 0.053 1.89 2.12 2.01 2.29 2.57 1.40 % Outside Directors 0.010 0.014 0.55 0.74 CEO-Chairman -0.227 -0.470 0.37 0.72 LN(1+G-Index) -1.279** -1.381** 2.23 2.16 Controls for deal characteristics Yes Yes Yes Yes Yes Yes N 147 147 69 147 147 69 Adj R-Sq 0.287 0.279 0.527 0.270 0.266 0.461

47
Table 9: Acquirer Quality and Deal Quality The following table examines the relation between acquirer quality and deal quality, and target announcement period excess bond returns. Acquirer MB is the ratio of market value to book value of assets, where market value is given by the sum of market capitalization and total assets less book equity. Acquirer ROA is the ratio of income before extraordinary items to book assets. Target (acquirer) stock excess returns is calculated as the cumulative excess returns (CAAR) from Day -1 to Day +1 where Day 0 is the announcement date. Stock excess returns is calculated using the market model, where the market is CRSP value-weighted market returns and the market model parameters are calculated using returns data from Day -280 to Day -61. Combined stock returns is the value-weighted CAAR of the target and acquirer, where the weights are based on the market capitalizations on Day -2. Toehold is deducted to avoid double-counting. Robust T-Statistics are reported in italics. The asterisks, ***, **, and * denote significance at the 1%, 5% and 10% levels, respectively.
(1) (2) (3) (4) (5) Constant -2.970*** -1.779** -1.501** -1.449* -1.503** 3.11 2.34 1.99 1.89 2.00 JRT Diff 0.254*** 0.237*** 0.261*** 0.258*** 0.259*** 3.96 3.55 3.92 3.94 3.95 D(TLev > ALev) -0.209 -0.285 -0.066 -0.070 -0.062 0.34 0.47 0.11 0.12 0.10 D(TRetStd > ARetStd) -0.481 -0.688 -0.482 -0.471 -0.488 0.88 1.22 0.88 0.87 0.91 D(TMaturity < AMaturity) 0.479 0.765* 0.681 0.628 0.695* 1.18 1.87 1.64 1.51 1.69 AInstTop5 0.078*** 0.079*** 0.074*** 0.074*** 0.073*** 3.72 3.56 3.30 3.31 3.37 Acquirer MB 1.317* 1.72 Acquirer ROA 11.298** 2.23 Target CAAR(-1,+1) -0.280 0.18 Acquirer CAAR(-1,+1) 3.263 0.80 Combined CAAR(-1,+1) -1.393 0.30 Controls for deal characteristics Yes Yes Yes Yes Yes N 147 147 147 147 147 Adj R-Sq 0.290 0.290 0.264 0.267 0.265

48
Table 10: Probit Regressions of the Probability of a Ratings Upgrade - Institutional Monitoring The following table gives the probit regressions of the probability of a ratings upgrade against measures of institutional monitoring (Panel A) and board monitoring (Panel B). Only completed deals are included in the regressions. Targets with no change in bond ratings are discarded. The dependent variable is a dummy variable which equals to one if the target bondholders experience a ratings upgrade, and zero if there is a ratings downgrade. Target rating change is measured as the difference in the target’s bond ratings on Month -3 and Month +3, where Month -3 is measured with respect to the month of the announcement date and Month + 3 is measured with respect to the month of the effective date. When a target has multiple bonds, a weighted average ratings change is calculated over all the target’s bonds, where the weights are based on the market value of the bonds in Month -3. Marginal effects are given. Robust T-Statistics are reported in italics. The asterisks, ***, **, and * denote significance at the 1%, 5% and 10% levels, respectively. Panel A: Institutional Ownership
(1) (2) (3) (4) (5) (6) JRT Diff 0.074** 0.059** 0.069*** 0.077** 0.068*** 0.065** 2.47 2.07 2.92 2.54 2.59 2.17 D(TLev > ALev) -0.034 -0.074 -0.009 -0.017 -0.016 -0.051 0.26 0.51 0.07 0.13 0.12 0.35 D(TRetStd > ARetStd) -0.042 -0.103 -0.019 -0.037 -0.028 -0.087 0.32 0.72 0.14 0.27 0.21 0.60 D(TMaturity < AMaturity) 0.093 0.116 0.130 0.097 0.131 0.112 0.70 0.86 1.00 0.71 1.00 0.81 AInstTotal 0.011*** 0.001 0.008* 2.65 0.25 1.84 AInstTop5 0.035*** 0.033** 3.01 2.05 AInstBlock 0.275** 0.191 2.20 1.36 Controls for deal characteristics No No No No No No N 64 64 64 64 64 64 No. of Upgrade 41 41 41 41 41 42 Pseudo R-Sq 0.16 0.22 0.28 0.21 0.28 0.24

49
Panel B: Board Monitoring
(1) (2) (3) (4) (5) (6) JRT Diff 0.073** 0.086*** 0.075*** 0.087*** 0.085*** 0.102*** 2.48 3.04 2.76 3.31 3.40 3.51 D(TLev > ALev) -0.023 -0.044 -0.020 -0.058 -0.028 -0.053 0.17 0.32 0.16 0.40 0.19 0.34 D(TRetStd > ARetStd) -0.046 -0.104 -0.031 -0.094 -0.070 -0.088 0.35 0.74 0.23 0.68 0.48 0.60 D(TMaturity < AMaturity) 0.093 0.144 0.134 0.164 0.173 0.163 0.69 1.04 0.94 1.11 1.18 1.12 AInstTop5 0.029** 2.52 AInstBlock 0.361** 2.37 Board Size 0.004 -0.008 0.001 -0.009 0.27 0.54 0.07 0.62 % Outside Directors 0.021*** 0.021*** 0.019** 0.026*** 3.28 3.44 2.22 2.62 CEO-Chairman 0.221 0.091 0.087 0.057 1.09 0.48 0.40 0.26 Controls for deal characteristics No No No No No No N 64 64 64 64 64 64 No. of Upgrade 41 41 41 41 41 41 Pseudo R-Sq 0.16 0.28 0.17 0.29 0.37 0.37

50
Table 11: Alternative Specifications The following table examines how the type of institutional owners, credit rating of targets, whether debt is a source of financing for the deal, and insider ownership affects target announcement period excess bond returns. Speculative target is a dummy variable which equals to one if the target’s JRT is lower than Baa3. JRT is the Moody’s rating on the worst rated bond that the firm has. Debt issue is a dummy variable which equals to one if SDC indicates that the deal is financed in some portions by debt securities. Robust T-Statistics are reported in italics. The asterisks, ***, **, and * denote significance at the 1%, 5% and 10% levels, respectively.
Type of Inst. Speculative Target Debt Issue Insider Ownership Top 5 Inst. Inst. Block (1) (2) (3) (4) (5) (6) (7) Constant -1.833** -1.102 -1.491** -1.484** -1.300* -0.835 -1.703** 2.03 1.46 2.09 2.33 1.86 1.26 2.54 JRT Diff 0.261*** 0.267*** 0.220*** 0.220*** 0.255*** 0.260*** 0.275*** 3.79 3.84 3.24 2.81 3.96 3.89 4.16 D(TLev > ALev) -0.041 0.062 -0.125 -0.126 -0.205 -0.312 -0.264 0.07 0.10 0.22 0.22 0.36 0.53 0.47 D(TRetStd > ARetStd) -0.592 -0.291 -0.569 -0.569 -0.564 -0.240 -0.451 1.09 0.51 1.09 1.09 1.07 0.44 0.84 D(TMaturity < AMaturity) 0.466 0.485 0.591 0.592 0.790* 0.616 0.557 1.07 1.07 1.47 1.47 1.91 1.33 1.26 Bank 0.069 0.519 1.62 0.87 Insurance 0.097 0.517 1.02 0.66 Investment Co 0.117*** 0.879 2.62 1.63 Investment Advisors 0.103** 1.185** 2.24 2.15 Public Pension 0.626 1.18 Others 0.045*** 1.442 3.88 0.90 AInstTop5 0.059*** 0.059*** 0.068*** 0.072*** 3.53 4.28 3.36 3.75 Speculative Target*AInstTop5 0.072** 0.073 2.55 0.96 Speculative Target -0.028 0.02 AInstTop5*Debt Issue 0.323*** 2.97 Debt Issue -6.762*** 2.63 Insider Ownership 0.089* 0.080* 1.89 1.69 Insider Ownership - Squared -0.001 -0.001 1.65 1.31 Controls for deal characteristics Yes Yes Yes Yes Yes Yes Yes N 147 147 147 147 147 147 147 Adj R-Sq 0.266 0.243 0.308 0.302 0.292 0.240 0.290