Embed Size (px)
Citation preview
The Impact of Teacher Gender on Elementary Students’ Academic Performance
Timothy J. Winkelmann B.A., University of Missouri–Columbia, 2009
M.S., Baker University, 2012
Submitted to the Graduate Department and Faculty of the School of Education of Baker University in partial fulfillment of the requirements for the degree of
Doctor of Education in Educational Leadership
_______________________________ Verneda Edwards, Ed.D.
Major Advisor
________________________________ Harold Frye, Ed.D.
________________________________
Steve Morgan, Ed.D.
Date Defended: October 24, 2016
Copyright 2016 by Timothy J. Winkelmann
ii
Abstract
The purpose of this study was to explore the impact teacher gender had on third
and fifth grade students’ academic performance and attendance. Archival data were
collected from the Student Information System (SIS) used by District X, a suburban
district located in the Midwest. Students in District X take the STAR assessment in
reading and mathematics each fall and spring. The STAR assessment is a computer
adaptive test, which changes the level of difficulty based on student response. Correctly
answering questions increases the difficulty level of content matter, which ultimately
results in a higher score for the student (Renaissance Learning, 2014). Students of male
teachers did not show statistically significant academic growth regardless of student
gender. Female students taught by female teachers showed marginally significant growth
in reading when compared to male students of female teachers. Teacher gender did not
make a statistically significant difference in student academic growth in mathematics for
either gender. Students from various socioeconomic backgrounds also did not show a
statistically significant difference in academic growth when placed with a male teacher
versus a female teacher. Finally, attendance of students was not impacted by the gender
of the teacher. Prior to this study, the majority of research studies related to teacher
gender focused on male teachers as role models. The present study utilizes a quantitative
approach to analyze test scores and attendance of students. Although results indicated
teacher gender did impact academic growth in reading, future researchers should exercise
caution when reviewing this study because of the small sample of teachers available.
iii
Dedication
I would like to dedicate this dissertation to the following people. First and
foremost, I would like to dedicate this dissertation to my family. Thank you to my wife,
Raelynne Winkelmann. Throughout my doctoral journey, you have been my lifeline. As
I have worked through the coursework and dissertation process, you have helped me to
maintain a sense of balance. Your understanding, patience, and encouragement have
again proven you are the best choice I have ever made. I am grateful for our beautiful
daughter, Kinley. Kinley– I hope you understand the importance of family and
education. These are two of the most important things in life and I look forward to
watching you grow.
I would also like to dedicate this dissertation to my parents. Since I set foot in
preschool, they instilled a love of learning that is ingrained in my soul and pushes me to
become a better person each day. Mom, through your patience, guidance, and support,
you have taught me the only person that can limit my potential is me. Your passion for
education and helping others has taught me that life is a never-ending journey to helping
better the lives of everyone around you. Dad, you started this doctoral journey with me
and I know you are my biggest champion looking down from above. You taught me to
be generous, laugh often, and live a simple life.
I am grateful for my brothers, Matt Winkelmann and Mark Winkelmann, who
have impacted my life in so many ways. Raymond Schreiber, Jean Schreiber, and
Dorothy Landry, thank you for everything you have provided for our family. Your
support is truly indescribable.
iv
Thank you to the CCF: Paul McCorkle, Kenny Rodrequez, and Brian VanBatavia.
During the pursuit of our degree, the three of you helped to maintain a sense of
comradery that pushed me to become a better educator and friend each day. Finally,
thank you to my students and colleagues. Each interaction I have made in my life has
shaped me into the person I am today. For that, I thank you.
v
Acknowledgements
First and foremost, I would like to thank my major advisor Dr. Verneda Edwards.
Your persistence and patience throughout this process is truly inspiring. During
coursework for the doctorate, you helped me to remember family first through some very
challenging times. As I progressed throughout the program, you pushed me to my
potential and I could not have completed this program, much less this research study,
without your relentless support. Words cannot justify my gratitude towards your support.
Additionally, I would like to thank Dr. Harold Frye of Baker University. During
our time together throughout both graduate degrees, your innovative leadership and
thought provoking activities inspired me to always learn and grow. I would also like to
extend my sincerest thanks to Dr. Peg Waterman for her willingness to understand me as
a student and spend countless hours working with me to enhance my research study.
Thank you to Dr. Steve Morgan for your guidance and support in our short time together.
I have worked with many colleagues who have helped me grow into a leader. I
would like to acknowledge the following colleagues from Park Hill: Dr. Kerry Roe, Dr.
Jeanette Cowherd, and Dr. Susan Rizzo. Also, thank you to Renata Maiorino of the
University of Missouri-Columbia, Mrs. Lauren Bernstein of New Jersey, and Ms. Cathy
Fetter of Missouri. Your leadership has rippled into many lives because of the time we
spent together.
vi
Table of Contents
Abstract ............................................................................................................................... ii
Dedication .......................................................................................................................... iii
Acknowledgements ..............................................................................................................v
Table of Contents ............................................................................................................... vi
List of Tables ..................................................................................................................... ix
List of Figures ......................................................................................................................x
Chapter One: Introduction ...................................................................................................1
Background ..............................................................................................................1
Statement of the Problem .........................................................................................3
Purpose Statement ....................................................................................................4
Significance of the Study .........................................................................................5
Delimitations ............................................................................................................6
Assumptions .............................................................................................................6
Research Questions ..................................................................................................7
Definition of Terms ..................................................................................................8
Organization of the Study ........................................................................................9
Chapter Two: Review of the Literature .............................................................................11
History of Education and Teaching .......................................................................11
Gender Differences in the Teaching Profession ....................................................14
Academic Discrepancies Between Male and Female Students .............................20
Student Gender and Academic Achievement ........................................................22
Instructional Style and Classroom Management ...................................................24
vii
Socioeconomic Status and Academic Achievement of Students ...........................26
Attendance and Academic Achievement ...............................................................27
Summary ................................................................................................................29
Chapter Three: Methods ....................................................................................................31
Research Design .....................................................................................................31
Selection of Participants ........................................................................................32
Measurement ..........................................................................................................32
STAR Reading Assessment .......................................................................33
STAR Mathematics Assessment ................................................................34
Socioeconomic Status ................................................................................34
Attendance .................................................................................................34
Validity and Reliability ..............................................................................35
STAR Reading Validity and Reliability ..........................................35
STAR Mathematics Validity and Reliability ...................................37
Data Collection Procedures ....................................................................................38
Data Analysis and Hypothesis Testing ..................................................................39
Limitations .............................................................................................................43
Summary ................................................................................................................44
Chapter Four: Results ........................................................................................................45
Descriptive Statistics ..............................................................................................45
Hypothesis Testing .................................................................................................46
Summary ................................................................................................................54
Chapter Five: Interpretation and Recommendations .........................................................56
viii
Study Summary ......................................................................................................56
Overview of the Problem ...........................................................................56
Purpose Statement and Research Questions ..............................................57
Review of the Methodology .......................................................................57
Major Findings ...........................................................................................58
Findings Related to the Literature ..........................................................................58
Conclusions ............................................................................................................59
Implications for Action ..............................................................................60
Recommendations for Future Research .....................................................60
Concluding Remarks ..................................................................................61
References ..........................................................................................................................63
Appendices .........................................................................................................................71
Appendix A. Request and Approval from District X ............................................72
Appendix B. Proposal for Research to Baker University ......................................74
Appendix C. IRB Letter of Approval ....................................................................79

ix
List of Tables
Table 1. Elementary School Socioeconomic Demographics for District X in 2015 ...........3
Table 2. Summary of STAR Reading Validity Studies .....................................................36
Table 3. Summary of STAR Mathematics Validity Studies ..............................................37
Table 4. Teacher Gender and Student Sample ...................................................................45
Table 5. Descriptive Statistics for the Results of the Test for H1 ......................................47
Table 6. Descriptive Statistics for the Results of the Test for H2 ......................................48
Table 7. Descriptive Statistics for the Results of the Test for H3 ......................................49
Table 8. Descriptive Statistics for the Results of the Test for H4 ......................................50
Table 9. Descriptive Statistics for the Results of the Test for H5 ......................................51
Table 10. Descriptive Statistics for the Results of the Test for H6 ....................................52
Table 11. Descriptive Statistics for the Results of the Test for H7 ....................................53
Table 12. Descriptive Statistics for the Results of the Test for H8 ....................................53
Table 13. Descriptive Statistics for the Results of the Test for H9 ....................................54

x
List of Figures
Figure 1. Elementary and secondary school teachers by sex: 1986-2011 .........................14

1
Chapter One
Introduction
“The lack of male teachers in primary schools has been closely aligned with
another commonsense truth: boys are the new disadvantaged in schools” (Mills, Haase, &
Charlton, 2008). Elementary education is a profession dominated by females. Weaver-
Hightower (2011) stated “countries worldwide have seen crisis discourses over small
numbers of male teachers” (p. 97). According to the Bureau of Labor Statistics (BLS)
(2013), women made up 81% of the elementary and middle school teacher population
while men composed just 19% of the elementary and middle school teacher population in
2013. McGrath and Sinclair (2013) noted the discrepancy between the number of male
and female teachers and called for more males to choose education as a career after
analyzing the impact of males as teachers.
Men are often discouraged from choosing education as a profession. Weaver-
Hightower (2011) called for a wide variety of stakeholders to examine “subtle and
explicit biases that discourage male teachers” (p. 113). Similarly, Tucker (2015) urged
these stakeholders to provide “more support to transform the school environments in
which they teach” (p. 7). Although men are the minority in most schools, they still have
an impact on students and schools (McGrath & Sinclair, 2013).
Background
A discrepancy has existed between the number of female and male teachers at the
elementary level. Historically, females have dominated the profession of teaching at the
elementary and high school levels (BLS, 2013). However, a common theme in literature
related to teacher gender has been the call for more male teachers at the elementary level.
2
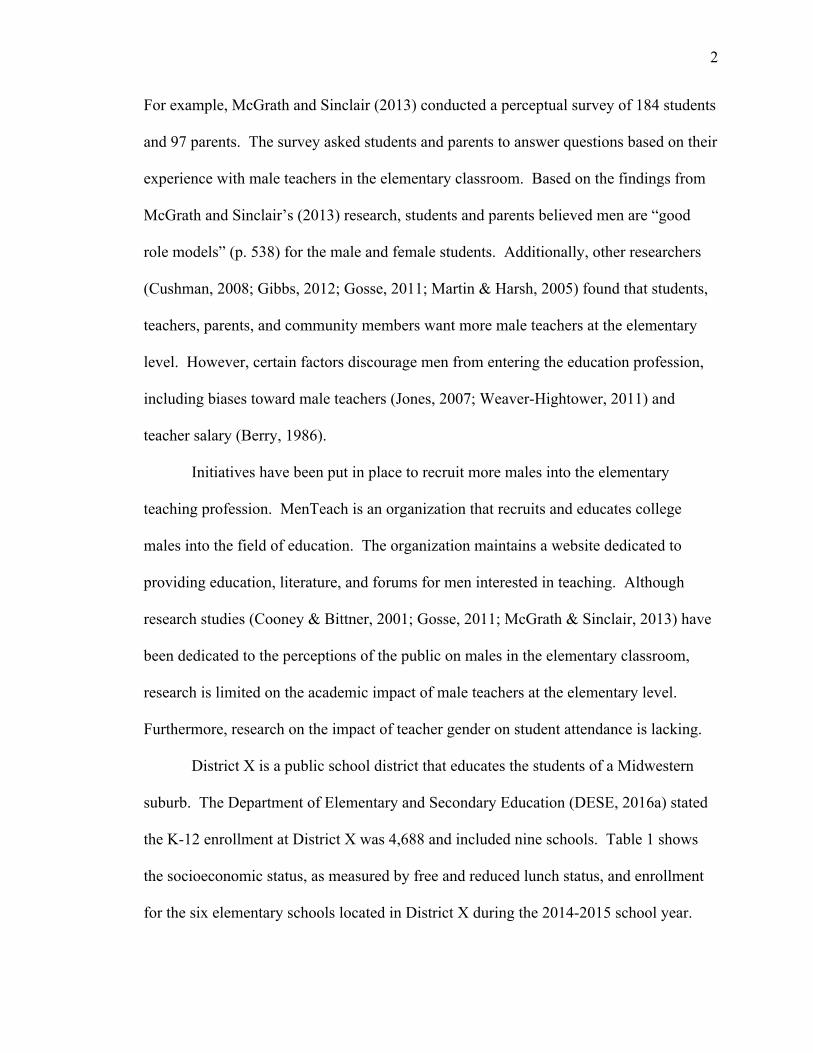
For example, McGrath and Sinclair (2013) conducted a perceptual survey of 184 students
and 97 parents. The survey asked students and parents to answer questions based on their
experience with male teachers in the elementary classroom. Based on the findings from
McGrath and Sinclair’s (2013) research, students and parents believed men are “good
role models” (p. 538) for the male and female students. Additionally, other researchers
(Cushman, 2008; Gibbs, 2012; Gosse, 2011; Martin & Harsh, 2005) found that students,
teachers, parents, and community members want more male teachers at the elementary
level. However, certain factors discourage men from entering the education profession,
including biases toward male teachers (Jones, 2007; Weaver-Hightower, 2011) and
teacher salary (Berry, 1986).
Initiatives have been put in place to recruit more males into the elementary
teaching profession. MenTeach is an organization that recruits and educates college
males into the field of education. The organization maintains a website dedicated to
providing education, literature, and forums for men interested in teaching. Although
research studies (Cooney & Bittner, 2001; Gosse, 2011; McGrath & Sinclair, 2013) have
been dedicated to the perceptions of the public on males in the elementary classroom,
research is limited on the academic impact of male teachers at the elementary level.
Furthermore, research on the impact of teacher gender on student attendance is lacking.
District X is a public school district that educates the students of a Midwestern
suburb. The Department of Elementary and Secondary Education (DESE, 2016a) stated
the K-12 enrollment at District X was 4,688 and included nine schools. Table 1 shows
the socioeconomic status, as measured by free and reduced lunch status, and enrollment
for the six elementary schools located in District X during the 2014-2015 school year.

3
Table 1
Elementary School Socioeconomic Demographics in District X in 2015
School Name Eligible for Free/Reduced Lunch Enrollment
School A 56.1% 313
School B 47.9% 331
School C 69.1% 307
School D 47.3% 570
School E 51.6% 752
School F 57.8% 349 Note. Adapted from “District demographic data,” DESE, 2016 (https://mcds.dese.mo.gov/guidedinquiry/District%20and%20Building%20Student%20Indicators/District%20Demographic%20Data.aspx) For this study, classrooms in grades three and five were analyzed. School C and School
E were the only two schools that had male teachers in one of these grade levels during the
2015 school year.
Statement of the Problem
According to the BLS (2013), the public education system is one of the largest
employers in the United States. The system employed 2.8 million teachers in grades
kindergarten through eighth in 2013. However, only 18.6% of the teaching population
was male. This number is low and confirms what “researchers have long noted that male
teachers are severely underrepresented in elementary school classrooms” (Malaby &
Ramsey, 2010/2011, p. 2).
Research has been conducted that demonstrates the positive impact a male teacher
can have on students (McGrath & Sinclair, 2013; Mills, Haase, & Charlton, 2008). These
studies call for more males to enter elementary education as a career because men are
seen as positive role models. Researchers (Cushman, 2008; Dee, 2006; Gibbs, 2012;
4
Tucker, 2015) have found many schools are calling for more male teachers. Cushman
(2008) called for more male teachers in primary schools because “young children,
especially boys, need ‘male role models’ in their lives” (p. 123). Cushman (2008)
highlighted the imbalance between the number of female and male teachers at the
elementary level. As the schools are calling for more male teachers at the elementary
level, the actual number remains stagnant (BLS, 2014).
There are theories about the reasons for a lack of male teachers at the elementary
level. One theory is men are deterred, in general, from entering education as a
profession. Weaver-Hightower (2011) found men were discouraged from teaching as a
profession. The discouragement has come from peers and family members through
“gendered teasing about the ease of and ‘cuteness’ required in education coursework,
gendered objections to ‘wasting’ their ability, and gendered suspicions of sexual
predation” (Weaver-Hightower, 2011, p. 97). Teasing and suspicions have resulted in
male undergraduate students pursuing different degrees during college.
Few quantitative studies have been conducted that link teacher gender to
academic achievement and attendance in the classroom. The literature and research has
not focused on a relationship between student demographics and the impact of teacher
gender on academic achievement. Additionally, the literature and research has not
focused on the relationship between teacher gender and attendance.
Purpose Statement
The primary purpose of this study was to determine the extent there was a
difference in academic growth between students in upper elementary classrooms with
male teachers and students in upper elementary classrooms with female teachers.
5
Specifically, the researcher looked at language arts and mathematics growth for students
throughout one school year. A second purpose of this study was to determine the extent
there was a difference in academic growth between female and male students. A third
purpose of the study was to determine the extent student gender and SES impacted
differences in academic growth between students in classrooms with male teachers and
students in classrooms with female teachers. A final purpose of the study was to
determine the extent there was a difference in attendance between students when paired
with a male teacher and students when paired with a female teacher.
Significance of the Study
The vast majority of educators at the elementary level are female (BLS, 2013).
While studies (Petersen, 2014; Porter, 2008; Saban, 2003) have been conducted that
demonstrate gender differences and workplace expectations for male and female
educators, few have quantified the impact of teacher gender on student academic growth
and student attendance throughout the school year. This study contributes to the body of
knowledge by helping to fill this gap in research and literature. Administrators, teachers,
and students could benefit from this research. With a better understanding of the impact
teacher gender has on an elementary student’s academic growth, administrators could be
able to strategically place students in various classrooms according to student gender,
teacher gender, and student SES. This research could benefit administrators, teachers,
and students by providing a better understanding of varying student attendance in
classrooms taught by a male or female teacher. If attendance rates are also impacted by
teacher gender, strategically placing students into classrooms led by teachers of a certain
6
gender could increase student attendance. With increased attendance, student
achievement could increase (Daugherty, 2008).
Delimitations
“Delimitations are self-imposed boundaries set by the researcher on the purpose
and scope of the study” (Lunenberg & Irby, 2008, p. 134). The following delimitations
were placed on this study:
• All participants attended two elementary schools in the District X.
• Only students in attendance for a full year were used in the study.
• Data collection included information from the 2015-2016 school year. Only
language arts and mathematics scores were used.
• Attendance was tracked on a daily basis and recorded in the School
Information System (SIS).
Assumptions
According to Lunenburg and Irby (2008), “Assumptions are postulates, premises,
and propositions that are accepted as operational for purposes of the research” (p. 135).
Assumptions are factors within the study that the researcher does not have control over.
In the present research, the following assumptions were made:
• All students put forth their best effort on the assessments.
• Regardless of gender, all teachers were highly qualified, effective teachers.
• Students were identified in the correct demographic group.
• Attendance was recorded in SIS with fidelity.
7
Research Questions
Research questions give the study direction and contain the essence of the study
for those who review them (Lunenburg & Irby, 2008). The following research questions
were used to guide this study:
RQ1. To what extent is there a difference in academic growth in reading, as
measured by the difference in the fall STAR scaled score and the spring STAR scaled
score, between third and fifth grade students in classrooms taught by male teachers and
third and fifth grade students in classrooms taught by female teachers?
RQ2. To what extent is the difference in academic growth in reading, as
measured by the difference in the fall STAR scaled score and the spring STAR scaled
score, between third and fifth grade students in classrooms with male teachers and third
and fifth grade students in classrooms with female teachers affected by student gender?
RQ3. To what extent is the difference in academic growth in reading, as
measured by the difference in the fall STAR scaled score and the spring STAR scaled
score, between third and fifth grade students in classrooms with male teachers and third
and fifth grade students in classrooms with female teachers affected by student
socioeconomic status?
RQ4. To what extent is there a difference in academic growth in mathematics, as
measured by the difference in the fall STAR scaled score and the spring STAR scaled
score, between third and fifth grade students in classrooms taught by male teachers and
third and fifth grade students in classrooms taught by female teachers?
RQ5. To what extent is the difference in academic growth in mathematics, as
measured by the difference in the fall STAR scaled score and the spring STAR scaled
8
score, between third and fifth grade students in classrooms taught by male teachers and
third and fifth grade students in classrooms taught by female teachers affected by student
gender?
RQ6. To what extent is the difference in academic growth in mathematics, as
measured by the difference in the fall STAR scaled score and the spring STAR scaled
score, between third and fifth grade students in classrooms taught by male teachers and
third and fifth grade students in classrooms taught by female teachers affected by student
socioeconomic status?
RQ7. To what extent is there a difference in attendance between third and fifth
grade students in classrooms with male teachers and third and fifth grade students in
classrooms with female teachers?
RQ8. To what extent is the difference in attendance between third and fifth grade
students in classrooms with male teachers and third and fifth grade students in classrooms
with female teachers affected by student gender?
RQ9. To what extent is the difference in attendance between third and fifth grade
students in classrooms with male teachers and third and fifth grade students in classrooms
with female teachers affected by student socioeconomic status?
Definition of Terms
This section of the research is dedicated to key terms that were used throughout the study.
Attendance. Student attendance is required for all children under the age of 17 in
the state of Missouri (DESE, 2016b). Attendance is tracked in the District X through
School Information Systems (SIS). Attendance percentages in SIS reflect the total
number of hours a student is present throughout the 2015-2016 school year.
9
Scaled Score. Students receive a scaled score for the STAR Reading and STAR
Mathematics assessments.
A scaled score is calculated based on the difficulty of questions and the number of
correct responses. Because the same range is used for all students, scaled scores
can be used to compare student performance across grade levels. STAR Reading
Scaled scores range from 0 to 1400. All norm-referenced scores are derived from
the scaled score. (Renaissance Learning, 2015a, p. 1)
School Information Systems (SIS). An online information management system
that tracks socioeconomic status and attendance. District X utilizes Tyler Information
Systems to store SIS data (Tyler Technologies, 2016).
Socioeconomic Status (SES). The Department of Education in the state of
Missouri classifies all students into three socioeconomic classes based on lunch status.
These classes include free lunch, reduced lunch, and standard lunch pricing. The lunch
status is based on the income level of the family (U.S. Department of Labor, 2016).
STAR Reading and Mathematics Assessment. STAR Reading and
Mathematics assessments are computer adaptive tests created by Renaissance Learning
that measure reading comprehension and mathematical skills (Renaissance Learning,
2014).
Organization of the Study
This study is organized into five chapters. Chapter one provided an introduction
of the study, needed background, statement of the problem, and the purpose statement.
Chapter one then identifies the significance of the study, the delimitations, the
assumptions, and the research questions. Chapter one concludes with the definition of
10
terms and the overview of methodology. Chapter two provides an overview of related
literature including the impact of teacher gender on academic growth based on student
gender and student socioeconomic status, and student attendance. Chapter three provides
a detailed view of the research design used including the selection of participants,
measurement, and data collection procedures with research questions, hypotheses, and
statistical analyses explanations. Chapter three concludes with limitations to the study.
Chapter four presents the results of the present study. The final chapter, five, summarizes
the present study and provides an overview of the problem, presents the purpose
statements and research questions, reviews the methodology used, and reports major
findings. Additionally, any implications for action and recommendations for future
research are considered in chapter five.
11
Chapter Two
Review of the Literature
“The perceived need for more male primary-school teachers has emerged as an
international issue with research and media reporting proportional and absolute decline in
the number of male primary-school teachers” (McGrath & Sinclair, 2013). Studies have
been conducted on the qualitative benefits of male teachers being in the elementary
classroom (Martin & Harsh, 2005; McGrath & Sinclair, 2013). However, research that
analyze the relationship between teacher gender and student achievement are
limited. The history of education is discussed with an in-depth look at teaching as a
profession. In addition, academic discrepancies between male and female students is
discussed. Chapter two then discusses literature related to the impact of teacher on
student achievement. The chapter concludes with instructional style of teachers,
socioeconomic status of students, and how attendance impacts student achievement.
History of Education and Teaching
The early establishment of public schools in the United States of America is well
documented in a book entitled A History of Education in the United States, which was
published in 1904 by Dr. Edwin Grant Dexter of the University of Illinois. This book
provides an exhaustive look at the history of education in the pre-1900s United States. A
History of Education in the United States (Dexter, 1904) started with an overview of
several attempts to build schools in the early 1600s. Many of these attempts failed due to
a variety of reasons, including conflicts with Native Americans and lack of support from
citizens. During this time of “distress, legislative mandates called for families to educate
their youth in the home” (Dexter, 1904, p. 8). Successful attempts of establishing schools
12
came to fruition in the mid 1600s. Many of the teachers and school headmasters were
males with educational backgrounds (Dexter, 1904). Dexter (1904) stated “in the earlier
colonial days grammar-school teachers were almost universally college men” (p.
371). Interestingly, school teachers were also ministers of local towns and therefore,
revered by communities.
After an exhaustive review of school establishments throughout the 1600s, Dexter
then spoke of the development of school systems in each state. Throughout his review of
school establishments, Dexter frequently mentioned teacher gender trends that occurred
at various times throughout history. At the time of Dexter’s publication, the United
States consisted of 45 states. Oklahoma, New Mexico, Arizona, Alaska, and Hawaii
joined the United States post-publication (Kelly, 2015).
Dexter (1904) then elaborated on the establishment of post-secondary education,
including colleges, technical schools, and professional education. Colleges, technical
schools, and professional education opportunities came to fruition and focused on the
fields of science, technology, and electricity. With the increased availability of electricity
in the 1800s, colleges sought to prepare young people for careers in these areas.
The population of the United States continued to increase during the 17th and 18th
centuries. During the 19th century, schools were becoming more systematic (Ravitch,
2003). Since the school populations were growing, the call for more teachers also
increased. During this time, the teaching population shifted from predominantly male to
predominantly female (Ravitch, 2003).
To meet the increased demand for teachers, some colleges began developing
teacher preparation classes. These classes date back to the early 1800s. Ravitch (2003)

13
stated “new teachers had to persuade a local school board of their moral character, and in
some districts, pass a test of their general knowledge” (para. 6). Different communities
had various criteria for hiring teachers.
As the United States moved forward toward the 20th century, a more systematic
process for teacher training was developed. Ravitch (2003) stated this “was a time in
which relatively small departments of pedagogy expanded into undergraduate and
graduate schools of education” (para. 10). In the early 20th Century, the Department of
Education transformed formal teacher training (Ravitch, 2003). Additionally, teaching
was still predominantly female.
The United States continued to grow during the early 20th century. From 1900-
1930, the number of children between the ages of 5-14 grew by 8 million (U.S. Census
Bureau, 1999). With this rise in population, the demand for qualified teachers also
grew. During this time the Federal government mandated that all states require children
to attend school, although the government allowed states to decide on the ranges of ages
to be in school. Chicosky (2015) stated that “by 1918, all states had compulsory
education statutes” (p. 16). With this large population of students, the demand for
teachers continued to increase. During this time, the teaching profession was
predominantly female. This disparity continued throughout the 20th century. The
National Education Association (2014) found that males made up 23% of United States
public school teachers in 2013. Even though this is a 7% increase from 2011 there has
continued to be a significant gap between male and female teachers.

14
Gender Differences in the Teaching Profession
Since the 1980s, the disparity between the number of male and female teachers
has continued to grow. Figure 1 shows the disparity in the number of female teachers
and male teachers in 1986 was just 38%. By 2011, the gap had increased to 68%.
Figure 1. Elementary and secondary school teachers by sex: 1986-2011
According to the BLS (2014), the job outlook for elementary teachers is expected to grow
by 12% between 2012 and 2022. This rate of growth is considered faster than average
when compared to all other professions (BLS, 2014). The average growth expectation
for all occupations is 6% (BLS, 2014). Therefore, the call for more teachers will
continue into the foreseeable future (BLS, 2014). However, college students turn away
from teaching as a profession for a variety of reasons. One reason is teacher salary
(Berry, 1986).
Teacher salary is frequently mentioned in mainstream media and literature. Starr
(2015) synthesized information from the 47th Annual Phi Delta Kappan Gallup Poll,
which surveyed 3,499 Americans 18 years of age and older via the web in May 2015.
69 71 7482 84
31 29 2618 16
0
10
20
30
40
50
60
70
80
90
100
1986 1990 1996 2005 2011
Percen
tage
Female Male
15
The survey also included an additional 1001 individuals surveyed via telephone. The
survey asked respondents questions that pertain to public education. After organizing the
findings, one key point discovered was that “teacher salaries in their community are too
low, according to a majority of Americans” (Starr, 2015, p. 52). The NEA found that
salary has an impact on the percentage of teachers that are male. According to the 2006
NEA survey, “states with the highest salaries had the highest percentage of male
teachers” (Cleaver, 2010).
When choosing a career, (Skelton, 2003; Weaver-Hightower, 2014) men were
deterred from entering education for a variety of reasons. Skelton (2003) surveyed
college students that were enrolled in teacher preparation courses across 20 different
colleges. These surveys asked for anecdotal feedback from male and female teaching
candidates. One of the themes that emerged was that teaching, specifically at the
elementary level, is viewed as feminine. One candidate stated “the majority of men that I
know have gone into secondary teaching because that seems to be the thing to do. If you
want to be a teacher- and you are male- secondary teaching is more acceptable” (p.198).
Weaver-Hightower (2014) found men were discouraged from teaching by peers and
family members. Weaver-Hightower (2014) interviewed and observed three male
teachers from the southern United States in 2014. Throughout Weaver-Hightower’s
(2014) study, the male teachers spoke about their attitudes towards teaching as a
profession and the negative connotation that peers and relatives have on their career
choice as teachers. Male teachers often receive criticism for their career choice when in
social situations (Weaver-Hightower, 2014).
16
Similarly, Jones (2007) found some societal views regarding male preservice
teachers have a negative connotation. Jones (2007) conducted a small scale research
project in which she interviewed 18 male preservice teachers from a university. The
university had a partnership with a local school district. The researcher also interviewed
12 female teachers that worked at the school and had experience working with male
preservice teachers. After conducting interviews amongst the male preservice teachers
and female teachers, several themes emerged. The first theme was the societal view that
male preservice teachers are not “real men.” Another societal view is that male
preservice teachers could be sexual predators.
Additionally, male teacher candidates have often been compared to female
teacher candidates. Saban (2003) conducted a study using a survey that consisted of
fixed-response and open-ended questions. Saban (2003) sent the survey to 381
prospective classroom teachers enrolled in a college program during the 2001-2002
academic year. After analyzing the results, Saban (2003) found female teachers at the
elementary level were more enthusiastic about and committed to teaching than their male
counterparts. Hussain, Ali, Khan, Ramzan, and Qadeer (2011) found that teacher attitude
towards the teaching profession impacts student performance. Hussain et al. (2011)
stated the following:
Female elementary school teachers have a more positive attitude towards the
profession as compared to the male secondary school teachers. This may be the
result of the stereotyping belief that teaching is a feminine job. Female teachers
might feel the job is more appropriate for them. (p. 989)
17
However, males enter the teaching profession for a variety of reasons. Dundar
(2010) conducted a study of 176 male and female teaching candidates. A survey was
disseminated to the candidates to identify factors that influenced the choice of choosing
teaching as a profession. Using an analysis of variance (ANOVA), Dundar (2010)
compared responses between female and male teacher candidates. Dundar (2010) found
male teacher candidates involved in the study chose teaching as a fallback career.
Additionally, male teacher candidates involved in the study reported the difficulty of
teaching is significantly less than the female teaching candidates.
Positive societal views can also encourage male preservice teachers to enter the
elementary teaching profession. Cooney and Bittner (2001) conducted four one-hour
conversations amongst male students, male teachers, and male professors at a United
States university. Cooney and Bittner (2001) found that preservice teachers see
themselves as being good role models for young students. Even though these preservice
teachers recognized they are entering into a predominantly female profession, the males
viewed themselves as father figures to those students without a positive male role model.
Malaby and Ramsey (2010/2011) conducted a study on the choice male
preservice teachers made to pursue a career in elementary education. Through
interviews, Malaby and Ramsey (2010/2011) found the “participants indicated an
embracing of the nurturing, supporting aspects of being a role model or father figure in a
school while resisting categorization as either strongly feminine or masculine” (p. 10).
Furthermore, Petersen (2014) conducted a study that included approximately 230
students that were in the first year of a four-year Bachelor of Education program.
Students in this program were asked two questions. The first question asked the students
18
to write down views of males in elementary education. The second question asked
students to talk about what the community says about males in the teaching profession.
After analyzing the responses, Petersen (2014) concluded society views males as good
role models at the elementary level. Additionally, male teachers at the elementary level
were viewed as having a strict classroom management style, thus providing a structured
learning environment. Another positive societal view, as described by Petersen (2014), is
the issue of security. By having a male at school, there seems to be a “greater sense of
security” (Petersen, 2014, p. 6).
Gosse (2011) researched the demand for more males in elementary
education. Gosse (2011) developed a survey that was sent to male elementary teachers.
The questions included “social, political, institutional, and structural variables that
influence male teachers’ decision to enter, remain in, and/or leave teaching” (Gosse,
2011, p. 120). Gosse (2011) sent this survey to several hundred male elementary teachers
in Canada. Two hundred and twenty-three responses were returned. Gosse (2011) found
male elementary teachers act as positive role models not just for boys but for girls as
well.
Similarly, McGrath and Sinclair (2013) conducted a perceptual study of males
already in the teaching profession by surveying 97 parents and 184 sixth-grade students.
Through the use of a survey, the researchers aimed to identify any themes that developed.
One theme found at the conclusion of the study was the desire to see an increase in the
number of male teachers.
Regardless of the reason men enter teaching, a discrepancy still existed between
the number of males and females. Cunningham and Watson (2002) talked about the
19
process of recruiting males into elementary education. In their article, Recruiting Male
Teachers, Cunningham and Watson (2002) discussed the roles of stakeholders involved
in recruiting male teachers. There are many roles to recruit male teachers, including
“administrators, teacher educators, career counselors, and the teachers of young children
themselves” (p. 10). In each of these roles, Cunningham and Watson (2002) gave advice
to the stakeholder in each of these positions. For instance, Cunningham and Watson
(2002) advised administrators to recruit male staff by hiring them for entry level
positions, such as teacher assistants and paraprofessionals.
Initiatives around the world have been implemented to encourage men to enter the
teaching profession. In the United Kingdom, the Teaching Agency put together a
Primary Experience program in which pre-service teaching candidates were matched with
inspirational male teachers (Gibbs, 2012). In Australia, the government also utilizes
strategies encourage men to enter the teaching profession (New South Wales Department
of Education and Communities, 2014). In 2013, the Toronto School District Board in
Canada gave preference to males when hiring new educators (Lett, 2013).
In the United States, MenTeach is a program that seeks to promote teaching as a
profession to males. MenTeach was founded in 1979 to increase the number of men
working with young children. Since it was founded, the group has presented at state and
national conferences and has developed literature in regards to the importance of males at
the elementary level. The program provides news, resources, forums, and collegial
connections for the public and MenTeach members. Although this program has
generated interest and literature regarding males in elementary education, the number of
female teachers continues to drastically exceed the number of male teachers.
20
Furthermore, elementary school principals and administrators seek out male
teaching candidates. Cushman (2008) surveyed 250 primary school principals. The
survey included questions to investigate the principals’ views of male teachers in the
classroom. Perceptual questions included a rating system and open-ended questions.
Cushman (2008) found that school administrators wanted more male teachers in the
school system. At the conclusion of the study, Cushman (2008) reported 94% of the
male principals and 87% of the female principals agreed that education systems need
more male role models. However, the reason these principals wanted more male teachers
did not follow any ideology or pedagogy. Instead, the general consensus from this study
showed that principals had the same viewpoint as the rest of society (Cushman,
2008). Society would like more males in education, specifically elementary education,
because students without positive male role models need this void filled in their lives.
Academic Discrepancies Between Male and Female Students
Dee (2006) researched the link between teacher gender and student achievement.
Dee used the data from the National Education Longitudinal Survey (NELS), which
organized student achievement data and teacher gender. The data included 24,599 8th
grade students. Dee (2006) found that students learn best when they are taught by
teachers of the same gender. In Dee’s study, female students with a female teacher raised
the achievement of girls by 4%.
Orr (2011) studied discrepancies between 6,394 kindergarten students enrolled in
public education. The data set included surveys to parents, teachers, and school
administrators, as well as academic achievement assessments. These data included
student achievement throughout a school year and teacher perceptions of male and female
21
students at the kindergarten level. A multivariate analysis of variance (MANOVA) based
on the data was conducted. Orr’s (2011) study found that boys were more likely to have
a negative attitude toward school while girls were more likely to have a positive attitude
towards school. Expectedly, these attitudes towards school often resulted in
corresponding test scores. With the correlation Orr found between the positive attitudes
towards school and positive grades, she noted the discrepancy between boys and girls
started in early childhood classrooms. At the kindergarten level, Orr (2011) found a
negative attitude towards school had a negative impact on student achievement.
In a report about state testing results commissioned by the Center of Education
Policy (Sadowski, 2010) the following findings about the academic achievement
discrepancy between male and female students in public education were summarized:
The report, which outlined results on state accountability tests, noted that the
percentage of boys scoring “proficient” or higher in reading was below that of
girls at all grade levels tested and in every state for which sufficient data were
available. (p. 10)
According to Sadowski (2010), this alarming trend is not restricted to the United
States. Instead, a gender gap is developing around the world. Boys were falling behind
girls in reading and mathematics at increasing rates.
In order to equalize the opportunity for academic achievement for boys and girls
in education, O’Neil and LuJan (2009) identify an assumption that exists in literature
about boys in education. The assumption is many teachers use the excuse of ‘boys will
be boys’ when they act out. This means when boys have behavioral or academic issues,
the issues are considered normal and not significant. O’Neil and LuJan (2009) agree this

22
is not an acceptable way to handle behavioral or academic situations in the school
setting. Instead, these negative actions often mean something deeper.
In order to combat the discrepancy between boys and girls, researchers and
education professionals have conducted studies regarding male teachers (Cushman, 2008;
McGrath & Sinclair, 2013; Roulston & Mills, 2000; Tucker, 2015). Carrington and
Skelton (2003) suggested men are positive role models and mentors to students.
Similarly, Schwartz (2002) recommended having a male in the classroom at the
elementary level. Schwartz (2002) stated “men can model reading by doing so
themselves and reading aloud to children, and by telling children why reading enriches
their own lives” (p. 4).
Student Gender and Academic Achievement
While the call for more male role models is evident in the literature, the research
related to teacher gender and student achievement is limited and reveals mixed results.
Piechura-Couture, Heins, and Tichenor (2013) found that single-gender classrooms have
a positive effect on student achievement. Piechura-Couture, Heins, and Tichenor (2013)
distributed surveys to teachers of single-gender classrooms in South Carolina. Surveys
were also disseminated to students and families. Approximately 2200 students, 178
parents, and 181 teachers completed the survey. The survey included questions that
pertained to single-gender classrooms. Based on survey results, Piechura-Couture, Heins,
and Tichenor (2013) found that single-gender classrooms have a positive impact on
students in the classroom. However, the study did not disaggregate the data based on the
gender of the teacher. Students, parents, and teachers all reported that students in single-
gender classrooms were more likely to participate during class, have a positive attitude in
23
school, complete classwork, and increased student desire to succeed in academics.
Specifically, this research study also found that African-American male students
benefited the most from single-gender classrooms, regardless of teacher gender. Based
on the results of the survey, 78% of the 592 African-American males strongly agreed,
agreed, or somewhat agreed with the statement “By being in the single-gender program, I
have increased or improved my ability to succeed in school” (Piechura-Couture, Heins, &
Tichenor, 2013, p. 241).
In contrast to Piechura-Couture, Heins, and Tichenor (2013), Krieg (2005) found
that elementary students learn best from female teachers. Krieg (2005) studied a cohort
of fourth grade students in Washington. The group of students included 49,415 students
from 965 school buildings. Students involved in this study took the Washington
Assessment of Student Learning (WASL). Krieg (2005) found that students perform
better in classrooms with a female teacher than classrooms with a male teacher. Krieg
(2005) found that “male teachers have students that fail the WASL with 6.9% greater
frequency than female teachers” (p. 21).
While Krieg (2005) found elementary students learned best from female teachers,
Marsh, Martin, and Cheng (2008) found the gender of a teacher had no impact on student
achievement at the middle and high school level. Students that had female teachers
performed the same as students with male teachers. Additionally, Marsh, Martin, and
Cheng (2008) found female students outperformed their male counterparts in a variety of
subjects. These subjects include reading, mathematics, and science. The average female
participant was also more positively motivated than boys.

24
McGrath and Sinclair (2013) conducted research based on the gender of primary
school teachers. Throughout this study, 97 parents and 185 sixth-grade students from
Sydney, Australia participated in surveys. McGrath and Sinclair (2013) began their
research by calling “for more male primary-school teachers has long been associated with
the educational needs of boys, the importance of positive male role models in schools and
the disproportionate number of male and female primary-school teachers internationally”
(p. 531). Throughout their study, McGrath and Sinclair (2013) found teacher gender does
not indicate a statistically significant difference in terms of student achievement among
students. Instead, their research is a collection of positive attitudes towards males
working in elementary education. Conclusions from this study found that parents and
students see male primary teachers as role models and father-figures.
Instructional Style and Classroom Management
Instruction within classrooms across the United States has undergone changes in
recent years. The Common Core State Standards Initiative (Common Core State
Standards Initiative, 2015) redefined standards in both reading and mathematics. In
reading, three shifts were identified: (a) regular practice with complex texts and their
academic language, (b) reading, writing, and speaking grounded in evidence from texts,
both literary and information, and (c) building knowledge through content-rich
nonfiction. Three shifts were also identified in mathematics: (a) greater focus on fewer
topics, (b) linking topics and thinking across grades, and (c) pursue conceptual
understanding, procedural skills and fluency, and application with equal intensity. With
the shifts in grade level expectations, educators have also begun to shift instructional
styles to promote student engagement.
25
One shift in instructional style is the move from traditional classrooms to student
center classrooms (Genc & Ogan-Bekiroglu, 2006). However, the research between
teacher gender and instructional style is limited. Genc and Ogan-Bekiroglu (2006)
conducted a study to analyze the teaching styles of 100 randomly selected middle- and
high-school science teachers in Florida. The teachers were sent a survey based on
classroom instruction strategies. Teachers were grouped into four categories based on
instructional styles, including a) somewhat traditional, b) transitional, c) somewhat
individualized, and d) student centered. At the conclusion of the study, Genc and Ogan-
Bekiroglu (2006) found the gender of the teacher did not have a significant correlation to
instructional style. Therefore, the gender of the teacher did not indicate a certain
instructional style would take place in the classroom.
Quality instruction requires classroom management. Marzano and Marzano
(2003) stated “classroom management had the largest effect on student achievement” (p.
6). Rubie-Davies, Flint, and McDonald (2012) conducted a study that analyzed
instructional strategies, classroom management, and student engagement among female
and male teachers. The study included 68 teachers, 57 females and 11 males, from 18
schools in New Zealand. Of the 68 teachers, 52 teachers were from primary schools,
which included students from ages 8 to 10. The participating teachers were sent a
questionnaire to begin the study. The questionnaire asked teachers to reflect on their
beliefs. Reading achievement data was also analyzed in this study. Students were
assigned a code that linked the student to their teacher. At the conclusion of the study,
the researchers found female teachers routinely performed better than male teachers in all
26
three areas. However, the researcher made note that the sample size of 11 male teachers
was relatively low compared to the sample size of female teachers.
Socioeconomic Status and Academic Achievement of Students
Socioeconomic status (SES) has also been considered a predictor of student
academic achievement. Stull (2013) conducted a study which reviewed data collected
from the Early Childhood Longitudinal Study (ECLS). This study included 22,000
kindergarten students enrolled in 900 kindergarten programs. The parent(s) of the
student provided the demographics and socioeconomic status of the family via a 40-50
minute phone call. The participants were asked questions regarding academic
expectations they held for their children. The findings of this study revealed the
following:
Only 5.9% of the high-SES/low-achieving students’ parents expect them to
complete twelve years [of education] or less, the percentage of the low-SES/low-
achieving students is 27.4%. At the other end of the spectrum, while 86.4% of the
high-SES/high achieving students are expected to earn a Bachelor’s degree or
higher, the percentage for the low-SES/high-achieving students was 60.4%. (Stull,
2013, p. 61)
SES has important implications for expectations of a child’s academic career. Families
from low SES seemed to have low expectations for their students graduating from high
school or college, regardless of academic achievement in early education years. Stull
(2013) found “an achievement gap already exists when children begin school” (p. 63).
Standardized test results show the impact of SES on academic achievement.
Bentzel (2012) conducted a study by analyzing archival data from the Pennsylvania
27
Information Management System. The researcher reviewed data from a cohort of
students from 2007-2010. During the 2007-2008 school year, the students were in third
grade. From 2008-2009, students were in fourth grade. Finally, the cohort was in fifth
grade during 2009-2010. The sample included over 100,000 students. Bentzel (2012)
conducted a one-way analysis of variance (ANOVA) to analyze the data. After analyzing
the data, the researcher found “students with greater poverty had statistically lower
performance in reading and mathematics when compared to students with lesser poverty”
(Bentzel, 2012, p. 136).
Similarly, Martinez-Perez (2013) conducted a study among 843 third, fourth, and
fifth grade students in Texas. The researcher looked at archival data from the 2012-2013
State of Texas Assessment of Academic Readiness (STAAR). The researcher conducted
a binary logistical regression to analyze the data. The researcher found “socioeconomic
status had a significant impact on third, fourth, and fifth grade STAAR reading passing
scores” (Martinez-Perez, 2013, p. 63). Specifically, if a student was classified as having
a low socioeconomic status, they were not as likely to pass the reading test.
Findings in the report Poverty in Missouri (Missouri Association for Community
Action, 2016) showed poverty negatively impacts student achievement. “For children
who were eligible for free/reduced lunch—a key indicator of child poverty—the average
scores for math and reading proficiency were 21 to 27 points lower than students who
were not eligible” (Missouri Association for Community Action, 2016, p. 6).
Attendance and Academic Achievement
High student achievement has been linked to regular attendance. Daugherty
(2008) conducted a study that involved 6,656 students in grades eight and ten in a school

28
district in Delaware. During this study, the students took the required state assessment
from the Delaware State Testing Program (DSTP) during 2004-2005, 2005-2006, and
2006-2007. Additionally, attendance rates were tracked for these students. The
researcher conducted a cross-sectional design study to compare attendance rates and
academic achievement. Daugherty (2008) found a “linear pattern existed for students in
both eighth and tenth grade… the more days absent from school, the lower the DSTP
scale score in both reading and math” (p. 109).
Jones (2010) conducted a study that involved 454 middle schools in Georgia
during the 2007-2008 school year. During the study the researcher used data from the
Georgia Criterion Referenced Competency Test (CRCT), which was a mandated test
throughout Georgia during the 2007-2008 school year. After comparing student
attendance and CRCT reading and mathematics scores, the researcher found students who
missed more than 15 days of school score lower on the CRCT test.
Similarly, Parke and Kanyongo (2012) conducted a study that involved 32,000
students from 80 schools. Of the 80 schools, 53 were elementary schools with grade
levels kindergarten to fifth grade. During the 2004-2005 school year, attendance was
tracked for the students involved in the study. Additionally, the researchers quantified
student achievement by looking at how students scored on the Pennsylvania System of
School Assessment (PSSA). Using an ANOVA, the researchers found the attendance
rate of a student had a direct correlation with the lower academic achievement in
mathematics. Parke and Kanyongo (2012) found “significant effects of attendance-
mobility on mathematics achievement for each grade level tested by the state assessment”
(p. 172).
29
Sprick, Alabiso, and Yore (2015) elaborated on concerns about chronic
absenteeism.
A growing body of research indicates that missing 10% of the year or more for
any reason- including unexcused absence, excused absence, and suspension-
places students at a significant risk of negative outcomes, including academic
difficulty and failure, increased involvement in the juvenile justice system, and
dropping out. (p. 51)
Although student achievement and attendance studies have been done, no known research
studies have been completed that link a teacher’s gender to attendance rates. Instead, the
research focuses on ways to increase attendance to promote student achievement.
Summary
Chapter two provided a review of the literature that relates to this study. The first
topic was the establishment of school systems in the United States. This included a brief
look into the gender of teachers throughout the history of public education. Teaching as a
profession was also discussed. This included literature that pertained to selecting
teaching as a career. The chapter then reviewed studies on student academic performance
and the gender of students in the classroom. Next, literature exploring socioeconomic
status and the impact of poverty on education was discussed. Chapter two concluded
with a review of attendance and the impact attendance has on academic growth.
In chapter three, the methods used to study the relationship between teacher
gender and student academic growth are described. Research design and selection of
participants are the first component of chapter three. Then, measurement tools are

30
described and include validity and reliability. Chapter three ends with data collection
procedures, data analysis and hypothesis testing, limitations, and a summary.
31
Chapter Three
Methods
The primary purpose of this study was to determine the extent there was a
difference in academic growth between students in classrooms with male teachers and
students in classrooms with female teachers. A second purpose of this study was to
determine the extent there was a difference in academic growth between female and male
students. A third purpose of the study was to determine the extent student socioeconomic
status impacted differences in academic growth and attendance between students in
classrooms with male teachers and students in classrooms with female teachers. A final
purpose of the study was to determine the extent there was a difference in student
attendance between students with a male teacher and students with a female teacher.
Chapter three begins with a description of the research design including the identification
of the independent and dependent variables. The selection of the participants used
throughout the study are then discussed. This chapter also provides an overview of
measurement, the validity and reliability of the measurement and data collection
procedures. The chapter also includes a description of the data analysis, hypothesis
testing, and limitations.
Research Design
A quantitative research design was used to investigate the researcher’s
hypotheses. The independent variables for this research were teacher gender, student
gender, and student socioeconomic status (SES). The dependent variables included
academic achievement using the scaled score on the STAR Reading and STAR
Mathematics assessments, and student attendance.
32
Selection of Participants
The population for this research study was third, fourth, and fifth grade students
in District X. Students in five classrooms with male teachers were selected for this study.
Additionally, five classrooms with female teachers were selected for this study.
Purposive sampling was used in this study to identify students related to the
researcher’s prior knowledge of the group being sampled (Lunenburg & Irby, 2008).
Data was collected from third, fourth, and fifth grade students enrolled in District X. To
be included in the sample, students were enrolled for the duration of the 2015-2016
school year. Additionally, this same group of students completed the fall and spring
STAR Reading and Mathematics assessments. The fall test was administered during the
months of September and October in 2015 and the spring test was administered in April
and May 2016.
Measurement
The STAR Assessments are standards-based tests that measure student
performance in key reading and mathematics skills (Research Foundation for STAR
Assessments, 2014). The STAR Reading Assessment and STAR Mathematics
Assessment are administered to all third and fifth grade students in District X.
Students take these assessments at the beginning of the year as required by
District X. The assessments are computer adaptive and change in difficulty based on
whether the student correctly answers the question or not. Based on the answer the
student provides, the test either increases or decreases in difficulty.
The STAR Reading and Mathematics Assessments are timed. Students are
permitted one minute to answer each question in both reading and mathematics. At the

33
end of the assessment, the STAR Reading and STAR Mathematics Assessment generate
a Student Report that provides multiple scores including criterion-referenced and norm-
referenced scores (Renaissance Learning, 2015b). Special accommodations are provided
for students with an Individualized Education Program (IEP). If a student has an IEP or
504 plan that allows extended time on testing, the computer testing program adds an
additional 30 seconds for each problem. Other accommodations include the text to be
read aloud to the student and increased font size, depending on the IEP or 504 for the
student.
STAR Reading Assessment. Renaissance Learning, the company that designed
the STAR Reading Assessment provided the following description:
[The STAR Reading assessment] is a challenging, interactive, and brief (about 15
minutes) assessment, consisting of 34 questions per test, that evaluates a breadth
of reading skills appropriate for grades K–12. The assessment’s repeatability and
flexibility in administration provide specific advantages for everyone responsible
for the education of students. (Renaissance Learning, 2014, p. 3)
STAR reading assesses 46 reading skills in 11 domains (Renaissance Learning, 2015b).
These are separated into four categories, including foundational skills, reading literature,
reading informational text, and language.
Academic growth in reading is determined by the scaled score. Academic growth
is determined by subtracting the fall 2015 STAR Reading scaled score from the spring
2016 STAR Reading scaled score (Renaissance Learning, 2015a). The range of the
scaled score is between 0 and 1400.
34
STAR Mathematics Assessment. The STAR Mathematics Assessment is also a
computer adaptive test that adjusts the difficulty of questions based on student answers.
Renaissance Learning (2014) provided the following description:
[The STAR Mathematics Assessment] is a challenging, interactive, and brief
(about 20 minutes) assessment, consisting of 34 items per test, that evaluates
students’ mathematical abilities in grades K–12. Like STAR Reading Enterprise,
its repeatability and flexibility in administration provide specific advantages for
educators. (p. 5)
STAR Mathematics assesses 214 mathematical skills in 8 strands. The strands include
numeration concepts; computation processes; estimation; geometry; measurement; data
analysis and statistics; word problems; and algebra (Renaissance Learning, 2016).
Academic growth in mathematics will be determined by the scaled score.
Academic growth will be determined by subtracting the fall 2015 STAR Mathematics
scaled score from the spring 2016 STAR Mathematics scaled score (Renaissance
Learning, 2015a). The range of the scaled score is between 0 and 1400.
Socioeconomic status. School districts in the United States classify each student
based on lunch payment status as determined by the National School Lunch Program
(NSLP) (United States Department of Agriculture, 2016). All families are given the
opportunity to apply for the Free and Reduced Price School Meals Program. For this
study, three groups were used to define SES. The groups included free lunch, reduced
lunch, and regular priced lunch.
Attendance. Attendance is tracked each day by classroom teachers. Office
personnel are required to confirm all student absences via phone calls or e-mail messages.
35
After confirmation of absences, the office personnel input absent students’ names into the
Student Information System (SIS). Throughout the day, the office staff also updates SIS
regarding late arrivals, students dismissed early, and other times students are not in
session. By continuously implementing these procedures each school day throughout the
year, SIS generates a report of the attendance history of each student. School days are
seven hours long, and the school year in District X consisted of 170 days. Therefore, a
student who attended every hour of each day attended 1190 hours during the 2015-2016
school year. The final report generated by SIS at the end of the school year shows the
percentage of time, rounded to the nearest percent, a student has been present at school
which is a dependent variable of this research study (Tyler Technologies, 2016).
Validity and reliability. Lunenburg and Irby (2008) identified content validity as
the degree an instrument measures what it purports to measure. The STAR Reading and
Mathematics assessments align with the Missouri Assessment Program (MAP) test given
the end of each school year (Renaissance Learning, 2014). Renaissance Learning (2014)
consistently analyzes tests for validity:
Content is a crucial facet of test validity; content-related evidence of validity lies
in the degree of correspondence, or alignment, between the knowledge and skills
measured by an assessment’s test items and the knowledge and skills intended to
be taught and learned in a given curriculum at a given grade level or levels.
(Renaissance Learning, 2014, p. 22)
STAR Reading validity and reliability. In order to check the validity of the
STAR Reading tests, Renaissance Learning collected data based on how students
performed on the STAR test and the MAP test. Over 200,000 students were involved
36
with the STAR Reading test for validity. Renaissance Learning (2014) stated the
following:
Renaissance Learning collected a wide range of correlations between scores on
STAR Reading and scores on other recognized, established measures of different
aspects of reading achievement, such as survey achievement tests, diagnostic
reading measures, and state accountability tests, among others. (p. 23)
Since both the STAR Reading Assessment and MAP are aligned to state standards, the
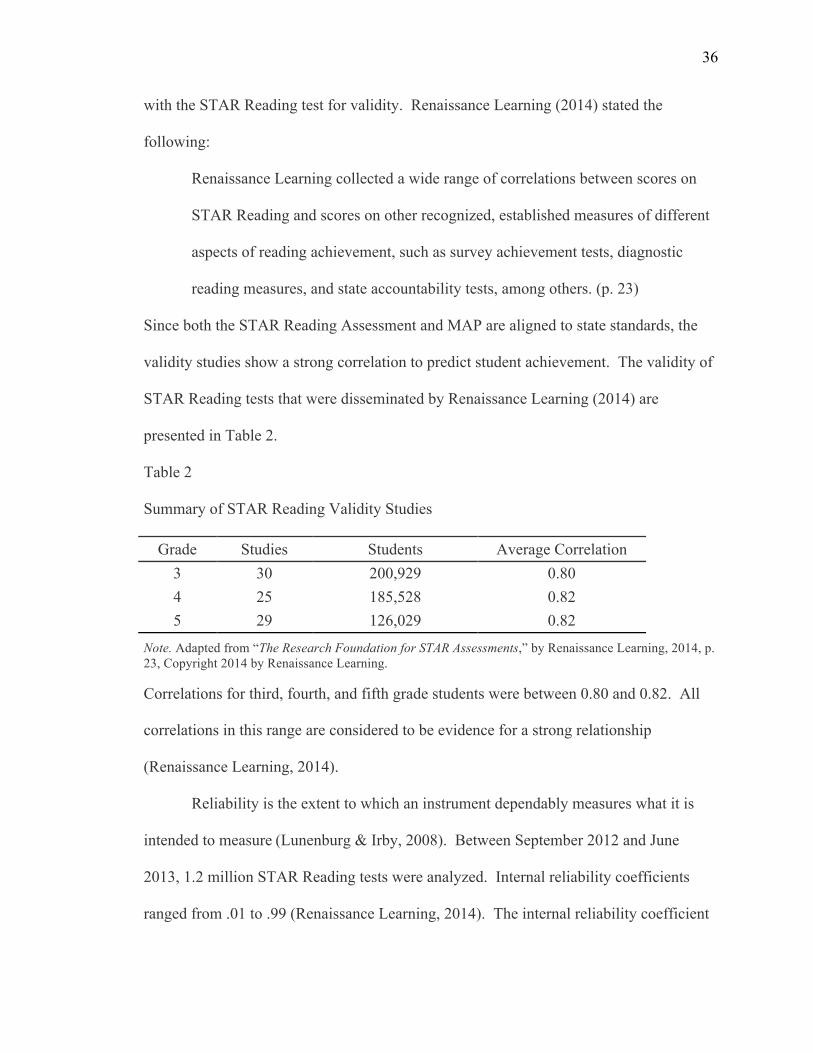
validity studies show a strong correlation to predict student achievement. The validity of
STAR Reading tests that were disseminated by Renaissance Learning (2014) are
presented in Table 2.
Table 2
Summary of STAR Reading Validity Studies
Grade Studies Students Average Correlation 3 30 200,929 0.80 4 25 185,528 0.82 5 29 126,029 0.82
Note. Adapted from “The Research Foundation for STAR Assessments,” by Renaissance Learning, 2014, p. 23, Copyright 2014 by Renaissance Learning.
Correlations for third, fourth, and fifth grade students were between 0.80 and 0.82. All
correlations in this range are considered to be evidence for a strong relationship
(Renaissance Learning, 2014).
Reliability is the extent to which an instrument dependably measures what it is
intended to measure (Lunenburg & Irby, 2008). Between September 2012 and June
2013, 1.2 million STAR Reading tests were analyzed. Internal reliability coefficients
ranged from .01 to .99 (Renaissance Learning, 2014). The internal reliability coefficient

37
for the STAR Reading tests averaged between 0.93 and 0.94, which is considered a
strong coefficient. Therefore, the reliability of the STAR Reading Assessment
consistently produces reliable test scores.
STAR Mathematics validity and reliability. Over 52,000 students were
involved with the STAR Mathematics test for validity (Renaissance Learning, 2014).
Table 3 shows the validity of STAR Math tests that were disseminated by Renaissance
Learning. Since both the STAR Mathematics Assessment and MAP are aligned to state
standards, the validity studies show a strong correlation to predict student achievement.
The validity of STAR Mathematics tests that were disseminated by Renaissance Learning
(2014) are presented in Table 3.
Table 3
Summary of STAR Mathematics Validity Studies
Grade Studies Students Average Correlation 3 30 52,604 0.66 4 23 55,285 0.69 5 29 39,869 0.70
Note. Adapted from “The Research Foundation for STAR Assessments,” by Renaissance Learning, 2014, p. 26, Copyright 2014 by Renaissance Learning.
Average correlations in the math validity study ranged from .66 to .70. All correlations
in this range are considered to be evidence for a moderately strong relationship
(Renaissance Learning, 2014). Additionally, a subset of students retook the STAR
Mathematics test to check for internal reliability. After retaking this test, students in
grades three through five had a reliability coefficient between 0.81 and 0.83 (Renaissance
Learning, 2014). The reliability coefficient shows the internal consistency is “very high,
38
equaling or exceeding those of most major published assessments” (Renaissance
Learning, 2014, p. 25).
Data Collection Procedures
The researcher received approval from District X on July 11, 2016 to gather data
by filling out a request form from the Assistant Superintendent (see Appendix A). Prior
to conducting the study, the researcher submitted an Institutional Review Board (IRB)
application to Baker University requesting permission to conduct the quantitative
research (see Appendix B). Permission was received from Baker University on August 1,
2016 (see Appendix C) to proceed with the research project.
The independent variables were teacher gender, student gender, and student
socioeconomic status. This information was gathered from the School Information
System (SIS). The SIS stores data for each teacher and student. Teacher data includes
the gender of the teacher. Student data includes student gender and student
socioeconomic status. District X classifies each student into a socioeconomic group in
SIS by labeling them as free, reduced, or standard lunch pricing. The dependent
variables were student academic growth in reading and mathematics and student
attendance. STAR pretest and posttest scores were collected for students in the 10
selected classrooms. Of these 10 classrooms, 5 were led by males and 5 were led by
females. Attendance rates were gathered from archived SIS data. The independent and
dependent variables were imported into IBM SPSS Statistics Faculty Pack 24 for
Windows for the analysis.
39
Data Analysis and Hypothesis Testing
The following research questions and hypotheses guided the study. The section
includes nine research questions with corresponding hypotheses. Additionally, a
description of the statistical analysis used to test each hypothesis is included in this
section.
RQ1. To what extent is there a difference in academic growth in reading, as
measured by the difference in the fall STAR scaled score and the spring STAR scaled
score, between third and fifth grade students in classrooms taught by male teachers and
third and fifth grade students in classrooms taught by female teachers?
H1. There is a difference in academic growth in reading, as measured by the
difference in the fall STAR scaled score and the spring STAR scaled score, between third
and fifth grade students in classrooms with male teachers and third and fifth grade
students in classrooms with female teachers.
RQ2. To what extent is the difference in academic growth in reading, as
measured by the difference in the fall STAR scaled score and the spring STAR scaled
score, between third and fifth grade students in classrooms with male teachers and third
and fifth grade students in classrooms with female teachers affected by student gender?
H2. The difference in academic growth in reading, as measured by the difference
in the fall STAR scaled score and the spring STAR scaled score, between third and fifth
grade students in classrooms with male teachers and third and fifth grade students in
classrooms with female teachers is affected by student gender.
A two-factor ANOVA was conducted to test H1 and H2. The two categorical
variables used to group the dependent variable, academic growth in reading, were teacher

40
gender and student gender. The two-factor ANOVA was used to test two hypotheses
including a main effect for teacher gender and a two-way interaction effect (Teacher
Gender x Student Gender). The main effect for teacher gender was used to test H1. The
interaction effect for teacher gender by student gender was used to test H2. The level of
significance was set at .05.
RQ3. To what extent is the difference in academic growth in reading, as
measured by the difference in the fall STAR scaled score and the spring STAR scaled
score, between third and fifth grade students in classrooms with male teachers and third
and fifth grade students in classrooms with female teachers affected by student
socioeconomic status?
H3. The difference in academic growth in reading, as measured by the difference
in the fall STAR scaled score and the spring STAR scaled score, between third and fifth
grade students in classrooms with male teachers and third and fifth students in classrooms
with female teachers is affected by student socioeconomic status.
A second two-factor ANOVA was conducted to test H3. The two categorical
variables used to group the dependent variable, academic growth in reading, were teacher
gender and student socioeconomic status. The two-factor ANOVA was used to test one
hypothesis for an interaction effect for teacher gender by student socioeconomic status.
The level of significance was set at .05.
RQ4. To what extent is there a difference in academic growth in mathematics, as
measured by the difference in the fall STAR scaled score and the spring STAR scaled
score, between third and fifth grade students in classrooms taught by male teachers and
third and fifth grade students in classrooms taught by female teachers?
41
H4. There is a difference in academic growth in mathematics, as measured by the
difference in the fall STAR scaled score and the spring STAR scaled score, between third
and fifth grade students in classrooms taught by male teachers and third and fifth grade
students in classrooms taught by female teachers.
RQ5. To what extent is the difference in academic growth in mathematics, as
measured by the difference in the fall STAR scaled score and the spring STAR scaled
score, between third and fifth grade students in classrooms taught by male teachers and
third and fifth grade students in classrooms taught by female teachers affected by student
gender?
H5. The difference in academic growth in mathematics, as measured by the
difference in the fall STAR scaled score and the spring STAR scaled score, between third
and fifth grade students in classrooms with male teachers and third and fifth grade
students in classrooms with female teachers is affected by student gender.
A third two-factor ANOVA was conducted to test H4 and H5. The two
categorical variables used to group the dependent variable, academic growth in
mathematics, were teacher gender and student gender. The two-factor ANOVA was used
to test two hypotheses including a main effect for teacher gender and a two-way
interaction effect (Teacher Gender x Student Gender). The main effect for teacher gender
was used to test H4 and the interaction effect for teacher gender by student gender was
used to test H5. The level of significance was set at .05.
RQ6. To what extent is the difference in academic growth in mathematics, as
measured by the difference in the fall STAR scaled score and the spring STAR scaled
score, between third and fifth grade students in classrooms taught by male teachers and
42
third and fifth grade students in classrooms taught by female teachers affected by student
socioeconomic status?
H6. The difference in academic growth in mathematics, as measured by the
difference in the fall STAR scaled score and the spring STAR scaled score, between third
and fifth grade students in classrooms with male teachers and third and fifth grade
students in classrooms with female teachers is affected by student socioeconomic status.
A fourth two-factor ANOVA was conducted to test H6. The two categorical
variables used to group the dependent variable, academic growth in mathematics, were
teacher gender and student socioeconomic status. The two-factor ANOVA was used to
test one hypothesis for an interaction effect for teacher gender by student socioeconomic
status. The level of significance was set at .05.
RQ7. To what extent is there a difference in attendance between third and fifth
grade students in classrooms with male teachers and third and fifth grade students in
classrooms with female teachers?
H7. The difference in attendance between third and fifth grade stduents in
classrooms with male teachers and third and fifth grade students in classrooms with
female teachers is affected by teacher gender.
RQ8. To what extent is the difference in attendance rates between third and fifth
grade students in classrooms with male teachers and third and fifth grade students in
classrooms with female teachers affected by student gender?
H8. The difference in attendance between third and fifth grade students in
classrooms with male teachers and third and fifth grade female teachers is affected by
student gender.
43
A fifth two-factor ANOVA was conducted to test H7 and H8. The two
categorical variables used to group the dependent variable, attendance, were teacher
gender and student gender. The two-factor ANOVA was used to test two hypotheses
including a main effect for teacher gender and a two-way interaction effect (Teacher
Gender x Student Gender). The main effect for teacher gender was used to test H7 and
the interaction effect for teacher gender by student gender was used to test H8. The level
of significance was set at .05.
RQ9. To what extent is the difference in attendance between third and fifth grade
students in classrooms with male teachers and third and fifth grade students in classrooms
with female teachers affected by student socioeconomic status?
H9. The difference in attendance between third and fifth grade students in
classrooms with male teachers and third and fifth grade students in classrooms with
female teachers is affected by student socioeconomic status.
A sixth two-factor ANOVA was conducted to test H9. The two categorical
variables used to group the dependent variable, attendance, were teacher gender
and student socioeconomic status. The two-factor ANOVA was used to test one
hypothesis for an interaction effect for teacher gender by student socioeconomic status.
The level of significance was set at .05.
Limitations
Lunenberg and Irby (2008) identified limitations as external factors that are out of
control of the researcher. Limitations for the current study included the following:
• The quality of reading and mathematics instruction varies by teacher regardless of
gender.
44
• The pacing of curriculum coverage may vary by teacher.
• Some students who qualify for reduced SES status do not apply for services.
• Illnesses, family emergencies, and other external factors impact student
attendance.
Summary
Chapter three provided an overview of the research design utilized for the current
study. The chapter began by reviewing the research design as well as information on the
selection of participants, and sampling procedures. Chapter four provides the results of
the hypothesis tests.
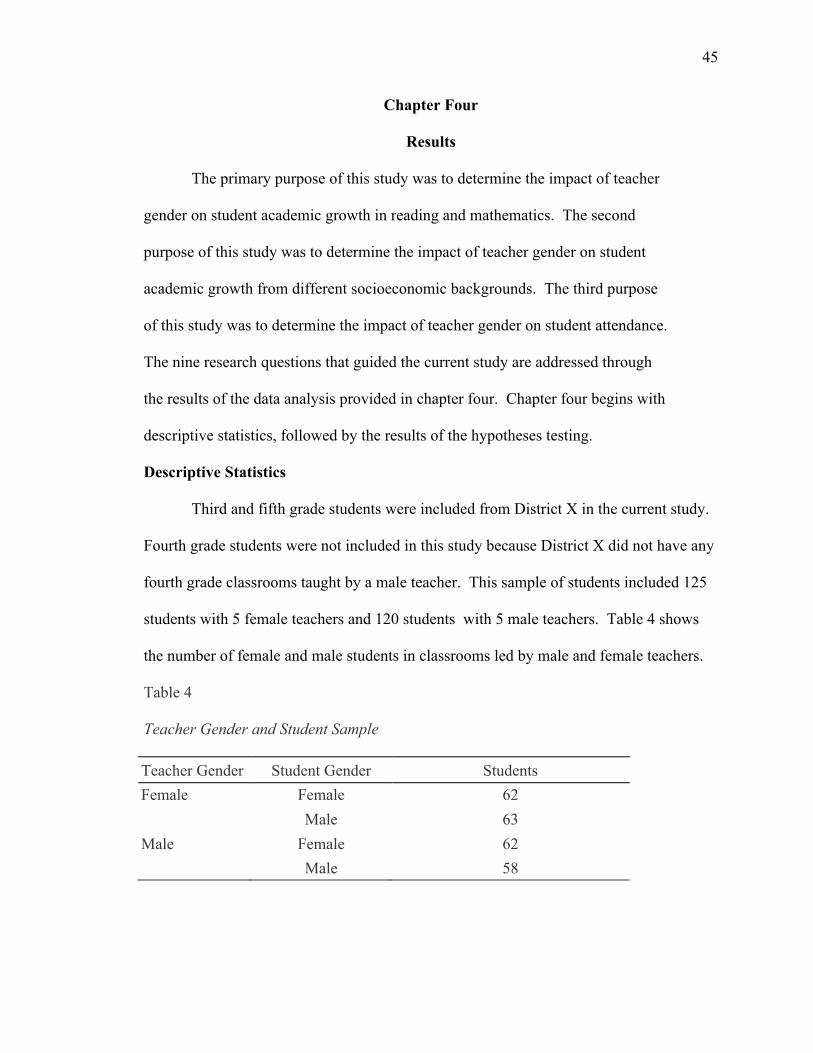
45
Chapter Four
Results
The primary purpose of this study was to determine the impact of teacher
gender on student academic growth in reading and mathematics. The second
purpose of this study was to determine the impact of teacher gender on student
academic growth from different socioeconomic backgrounds. The third purpose
of this study was to determine the impact of teacher gender on student attendance.
The nine research questions that guided the current study are addressed through
the results of the data analysis provided in chapter four. Chapter four begins with
descriptive statistics, followed by the results of the hypotheses testing.
Descriptive Statistics
Third and fifth grade students were included from District X in the current study.
Fourth grade students were not included in this study because District X did not have any
fourth grade classrooms taught by a male teacher. This sample of students included 125
students with 5 female teachers and 120 students with 5 male teachers. Table 4 shows
the number of female and male students in classrooms led by male and female teachers.
Table 4
Teacher Gender and Student Sample
Teacher Gender Student Gender Students Female Female 62 Male 63 Male Female 62
Male 58

46
Hypothesis Testing
This section includes the results of the hypotheses testing. The nine research
questions and nine hypotheses are listed followed by an analysis of the results from the
six ANOVA tests. The IBM Statistics 24.0 Faculty Pack for Windows was used to
analyze the data for the research questions.
RQ1. To what extent is there a difference in academic growth in reading, as
measured by the difference in the fall STAR scaled score and the spring STAR scaled
score, between third and fifth grade students in classrooms taught by male teachers and
third and fifth grade students in classrooms taught by female teachers?
H1. There is a difference in academic growth in reading, as measured by the
difference in the fall STAR scaled score and the spring STAR scaled score, between third
and fifth grade students in classrooms with male teachers and third and fifth grade
students in classrooms with female teachers.
The results of the analysis for H1 indicated there was not a statistically significant
difference between the means, F = .742, df = 1, 241, p = .390. See Table 5 for the means
and standard deviations for this analysis. No post hoc was warranted. The difference in
academic growth in reading, as measured by the difference in the fall STAR scaled score
and the spring STAR scaled score, between third and fifth grade students in classrooms
with male teachers and third and fifth grade students in classrooms with female teachers
was not statistically significant.

47
Table 5
Descriptive Statistics for the Results of the Test for H1
Teacher Gender M SD N
Female 72.21 118.30 125
Male 59.12 112.77 120
RQ2. To what extent is the difference in academic growth in reading, as
measured by the difference in the fall STAR scaled score and the spring STAR scaled
score, between third and fifth grade students in classrooms with male teachers and third
and fifth grade students in classrooms with female teachers affected by student gender?
H2. The difference in academic growth in reading, as measured by the difference
in the fall STAR scaled score and the spring STAR scaled score, between third and fifth
grade students in classrooms with male teachers and third and fifth grade students in
classrooms with female teachers is affected by student gender.
The results of the analysis for H2 indicated a marginally significant difference
between at least two of the means, F = 3.366, df = 1, 241, p = .068. See Table 6 for the
means and standard deviations for this analysis. The mean reading score for female
students of female teachers (M = 84.66) was higher than the mean for male students of
female teachers (M = 59.95). The mean for female students of male teachers (M = 44.92)
was lower than the mean for male students of male teachers (M = 74.29). The effect of
student gender in academic growth in reading, as measured by the difference in the fall
STAR scaled score and the spring STAR scaled score, between third and fifth grade
students in classrooms with male teachers and third and fifth grade students in classrooms
with female teachers was marginally significant.
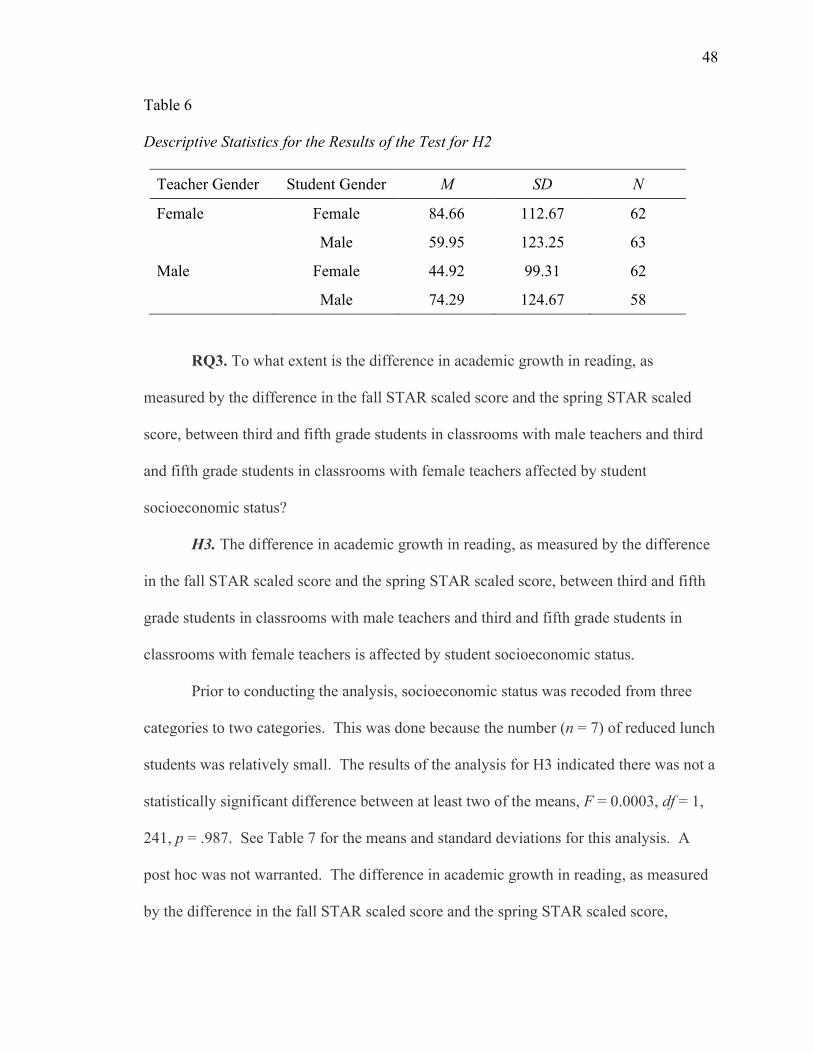
48
Table 6
Descriptive Statistics for the Results of the Test for H2
Teacher Gender Student Gender M SD N
Female Female 84.66 112.67 62
Male 59.95 123.25 63
Male Female 44.92 99.31 62
Male 74.29 124.67 58
RQ3. To what extent is the difference in academic growth in reading, as
measured by the difference in the fall STAR scaled score and the spring STAR scaled
score, between third and fifth grade students in classrooms with male teachers and third
and fifth grade students in classrooms with female teachers affected by student
socioeconomic status?
H3. The difference in academic growth in reading, as measured by the difference
in the fall STAR scaled score and the spring STAR scaled score, between third and fifth
grade students in classrooms with male teachers and third and fifth grade students in
classrooms with female teachers is affected by student socioeconomic status.
Prior to conducting the analysis, socioeconomic status was recoded from three
categories to two categories. This was done because the number (n = 7) of reduced lunch
students was relatively small. The results of the analysis for H3 indicated there was not a
statistically significant difference between at least two of the means, F = 0.0003, df = 1,
241, p = .987. See Table 7 for the means and standard deviations for this analysis. A
post hoc was not warranted. The difference in academic growth in reading, as measured
by the difference in the fall STAR scaled score and the spring STAR scaled score,
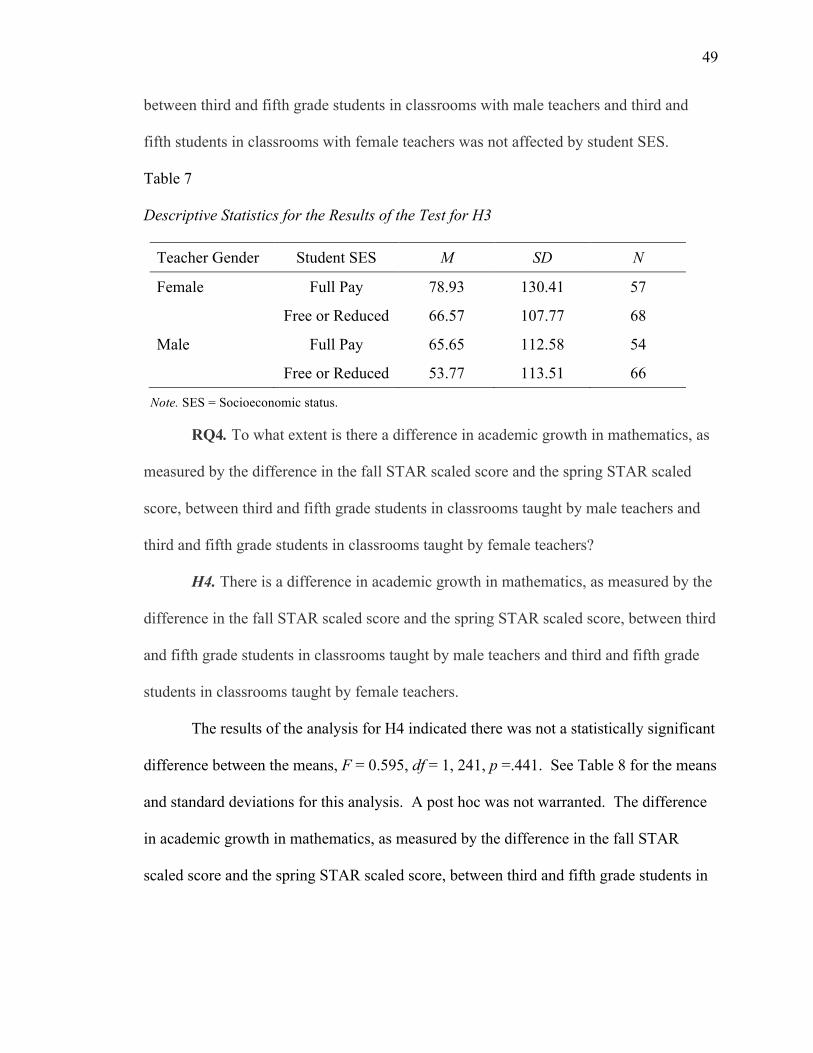
49
between third and fifth grade students in classrooms with male teachers and third and
fifth students in classrooms with female teachers was not affected by student SES.
Table 7
Descriptive Statistics for the Results of the Test for H3
Teacher Gender Student SES M SD N
Female Full Pay 78.93 130.41 57
Free or Reduced 66.57 107.77 68
Male Full Pay 65.65 112.58 54
Free or Reduced 53.77 113.51 66
Note. SES = Socioeconomic status.
RQ4. To what extent is there a difference in academic growth in mathematics, as
measured by the difference in the fall STAR scaled score and the spring STAR scaled
score, between third and fifth grade students in classrooms taught by male teachers and
third and fifth grade students in classrooms taught by female teachers?
H4. There is a difference in academic growth in mathematics, as measured by the
difference in the fall STAR scaled score and the spring STAR scaled score, between third
and fifth grade students in classrooms taught by male teachers and third and fifth grade
students in classrooms taught by female teachers.
The results of the analysis for H4 indicated there was not a statistically significant
difference between the means, F = 0.595, df = 1, 241, p =.441. See Table 8 for the means
and standard deviations for this analysis. A post hoc was not warranted. The difference
in academic growth in mathematics, as measured by the difference in the fall STAR
scaled score and the spring STAR scaled score, between third and fifth grade students in
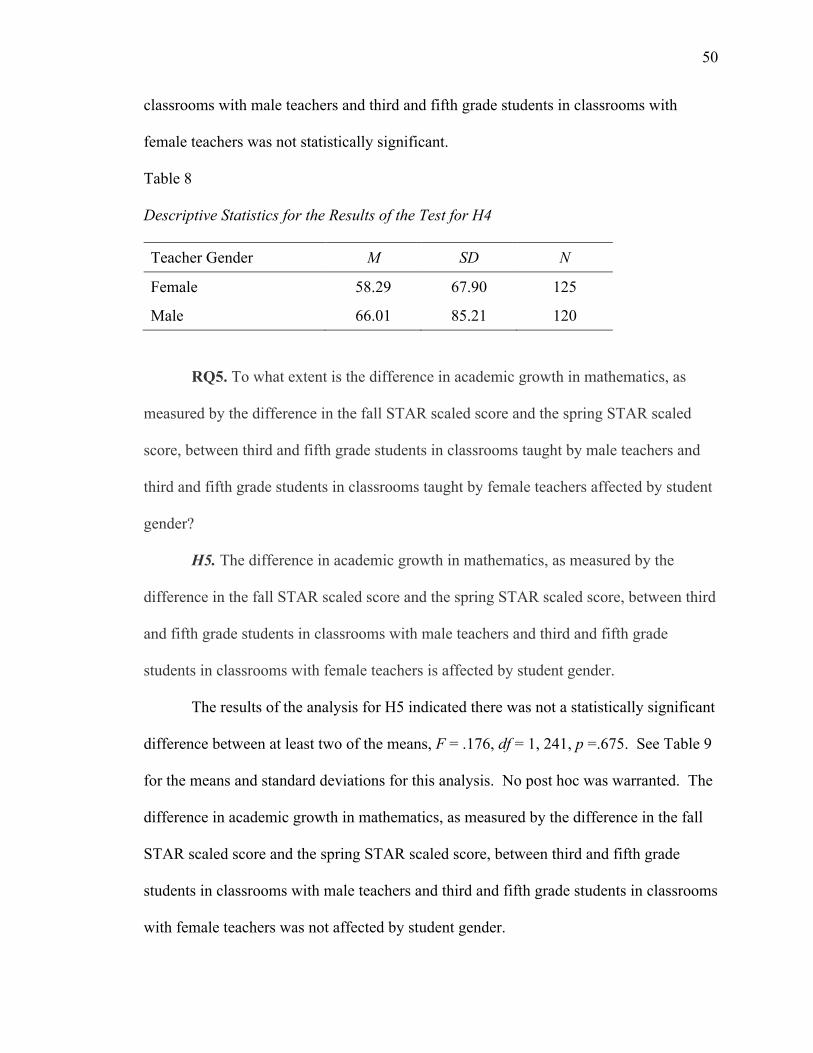
50
classrooms with male teachers and third and fifth grade students in classrooms with
female teachers was not statistically significant.
Table 8
Descriptive Statistics for the Results of the Test for H4
Teacher Gender M SD N
Female 58.29 67.90 125
Male 66.01 85.21 120
RQ5. To what extent is the difference in academic growth in mathematics, as
measured by the difference in the fall STAR scaled score and the spring STAR scaled
score, between third and fifth grade students in classrooms taught by male teachers and
third and fifth grade students in classrooms taught by female teachers affected by student
gender?
H5. The difference in academic growth in mathematics, as measured by the
difference in the fall STAR scaled score and the spring STAR scaled score, between third
and fifth grade students in classrooms with male teachers and third and fifth grade
students in classrooms with female teachers is affected by student gender.
The results of the analysis for H5 indicated there was not a statistically significant
difference between at least two of the means, F = .176, df = 1, 241, p =.675. See Table 9
for the means and standard deviations for this analysis. No post hoc was warranted. The
difference in academic growth in mathematics, as measured by the difference in the fall
STAR scaled score and the spring STAR scaled score, between third and fifth grade
students in classrooms with male teachers and third and fifth grade students in classrooms
with female teachers was not affected by student gender.
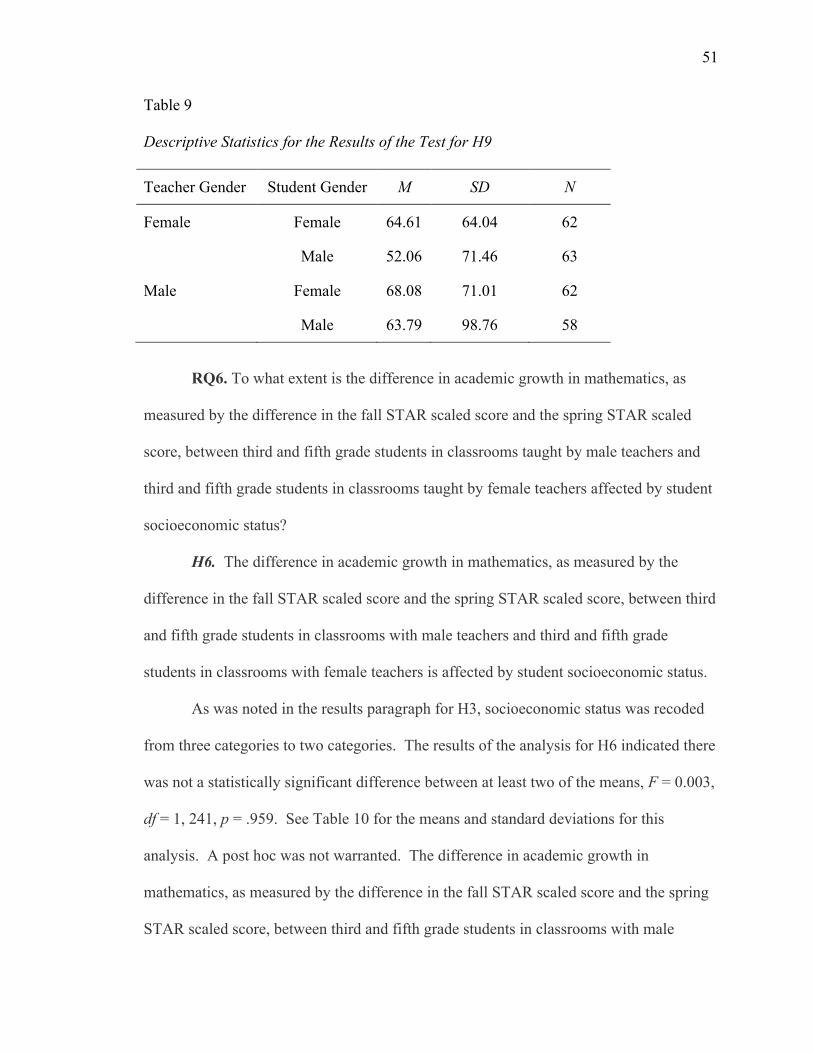
51
Table 9
Descriptive Statistics for the Results of the Test for H9
Teacher Gender Student Gender M SD N
Female Female 64.61 64.04 62
Male 52.06 71.46 63
Male Female 68.08 71.01 62
Male 63.79 98.76 58
RQ6. To what extent is the difference in academic growth in mathematics, as
measured by the difference in the fall STAR scaled score and the spring STAR scaled
score, between third and fifth grade students in classrooms taught by male teachers and
third and fifth grade students in classrooms taught by female teachers affected by student
socioeconomic status?
H6. The difference in academic growth in mathematics, as measured by the
difference in the fall STAR scaled score and the spring STAR scaled score, between third
and fifth grade students in classrooms with male teachers and third and fifth grade
students in classrooms with female teachers is affected by student socioeconomic status.
As was noted in the results paragraph for H3, socioeconomic status was recoded
from three categories to two categories. The results of the analysis for H6 indicated there
was not a statistically significant difference between at least two of the means, F = 0.003,
df = 1, 241, p = .959. See Table 10 for the means and standard deviations for this
analysis. A post hoc was not warranted. The difference in academic growth in
mathematics, as measured by the difference in the fall STAR scaled score and the spring
STAR scaled score, between third and fifth grade students in classrooms with male
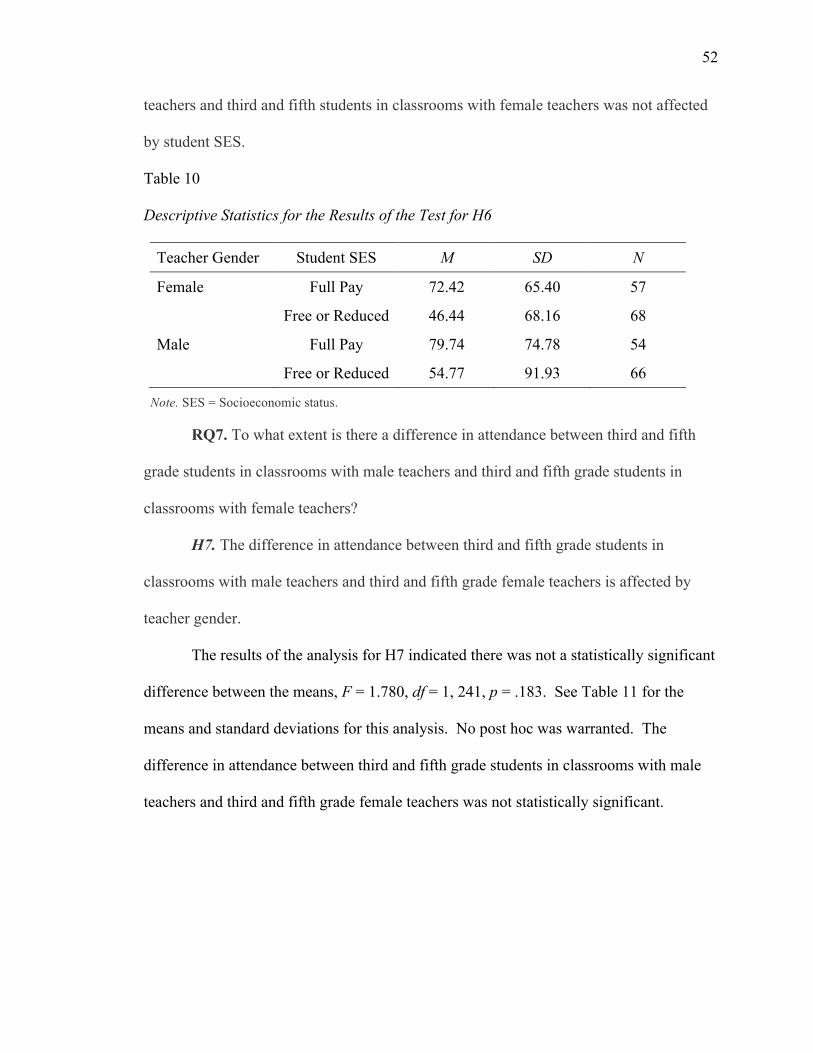
52
teachers and third and fifth students in classrooms with female teachers was not affected
by student SES.
Table 10
Descriptive Statistics for the Results of the Test for H6
Teacher Gender Student SES M SD N
Female Full Pay 72.42 65.40 57
Free or Reduced 46.44 68.16 68
Male Full Pay 79.74 74.78 54
Free or Reduced 54.77 91.93 66
Note. SES = Socioeconomic status.
RQ7. To what extent is there a difference in attendance between third and fifth
grade students in classrooms with male teachers and third and fifth grade students in
classrooms with female teachers?
H7. The difference in attendance between third and fifth grade students in
classrooms with male teachers and third and fifth grade female teachers is affected by
teacher gender.
The results of the analysis for H7 indicated there was not a statistically significant
difference between the means, F = 1.780, df = 1, 241, p = .183. See Table 11 for the
means and standard deviations for this analysis. No post hoc was warranted. The
difference in attendance between third and fifth grade students in classrooms with male
teachers and third and fifth grade female teachers was not statistically significant.
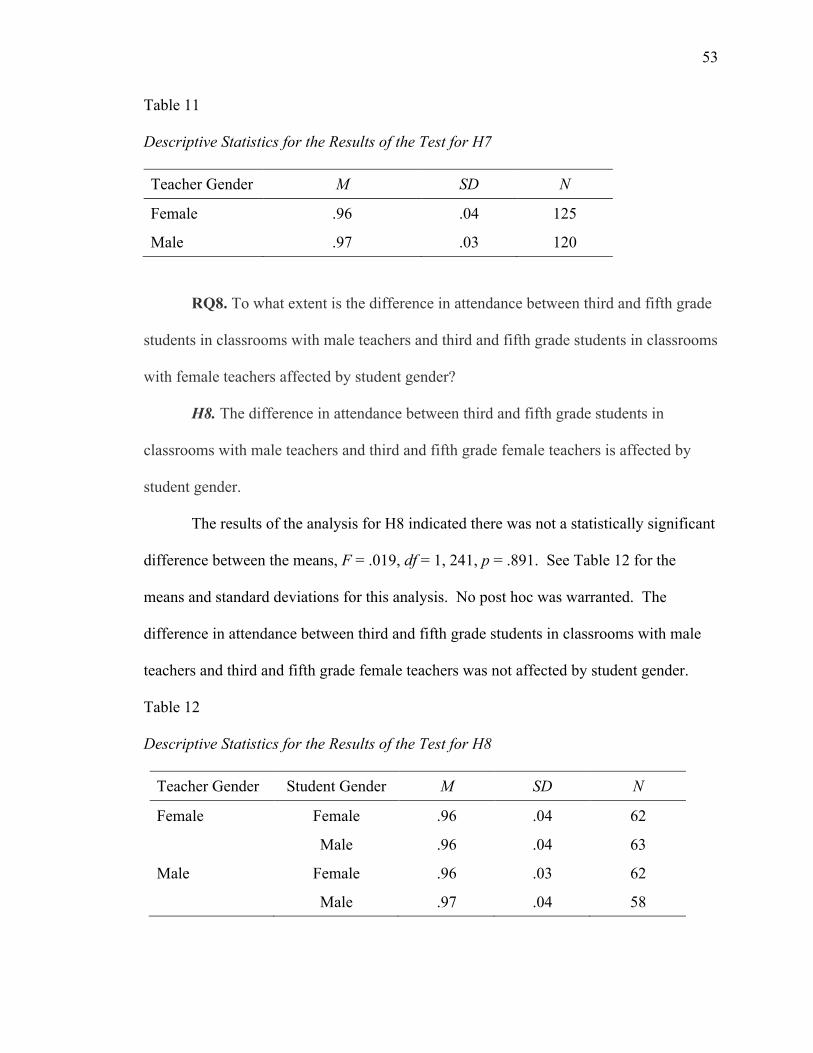
53
Table 11
Descriptive Statistics for the Results of the Test for H7
Teacher Gender M SD N
Female .96 .04 125
Male .97 .03 120
RQ8. To what extent is the difference in attendance between third and fifth grade
students in classrooms with male teachers and third and fifth grade students in classrooms
with female teachers affected by student gender?
H8. The difference in attendance between third and fifth grade students in
classrooms with male teachers and third and fifth grade female teachers is affected by
student gender.
The results of the analysis for H8 indicated there was not a statistically significant
difference between the means, F = .019, df = 1, 241, p = .891. See Table 12 for the
means and standard deviations for this analysis. No post hoc was warranted. The
difference in attendance between third and fifth grade students in classrooms with male
teachers and third and fifth grade female teachers was not affected by student gender.
Table 12
Descriptive Statistics for the Results of the Test for H8
Teacher Gender Student Gender M SD N
Female Female .96 .04 62
Male .96 .04 63
Male Female .96 .03 62
Male .97 .04 58
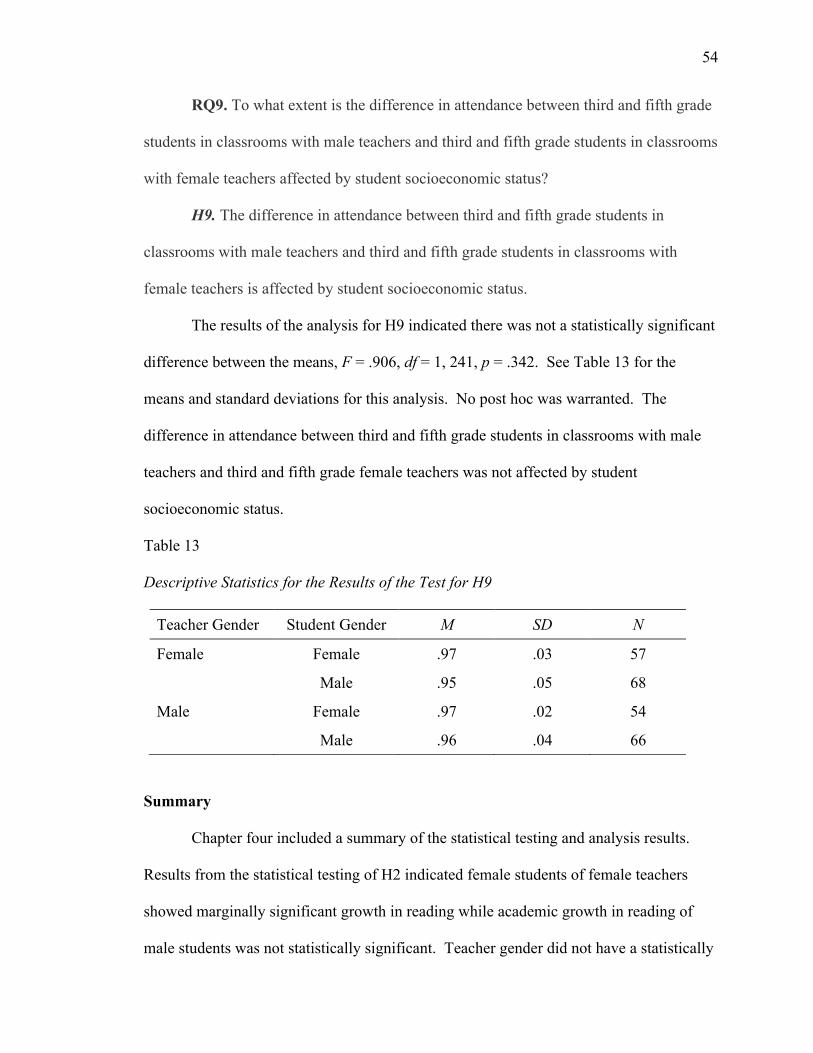
54
RQ9. To what extent is the difference in attendance between third and fifth grade
students in classrooms with male teachers and third and fifth grade students in classrooms
with female teachers affected by student socioeconomic status?
H9. The difference in attendance between third and fifth grade students in
classrooms with male teachers and third and fifth grade students in classrooms with
female teachers is affected by student socioeconomic status.
The results of the analysis for H9 indicated there was not a statistically significant
difference between the means, F = .906, df = 1, 241, p = .342. See Table 13 for the
means and standard deviations for this analysis. No post hoc was warranted. The
difference in attendance between third and fifth grade students in classrooms with male
teachers and third and fifth grade female teachers was not affected by student
socioeconomic status.
Table 13
Descriptive Statistics for the Results of the Test for H9
Teacher Gender Student Gender M SD N
Female Female .97 .03 57
Male .95 .05 68
Male Female .97 .02 54
Male .96 .04 66
Summary
Chapter four included a summary of the statistical testing and analysis results.
Results from the statistical testing of H2 indicated female students of female teachers
showed marginally significant growth in reading while academic growth in reading of
male students was not statistically significant. Teacher gender did not have a statistically
55
significant impact on student academic growth in mathematics. Teacher gender did not
have a statistically significant impact on academic growth of students from different
socioeconomic backgrounds. Also, teacher gender did not have a statistically significant
impact on student attendance. Chapter five includes a summary of the study, an overview
of the problem and purpose statement, review of methodology, major findings, findings
related to literature, conclusions, implications for action, and recommendations for future
research.
56
Chapter Five
Interpretation and Recommendations
The population of female elementary teachers has long outnumbered male
elementary teachers (Snyder & Dillow, 2012). The majority of research dedicated to
teacher gender has focused on male teachers as role models (McGrath & Sinclair, 2013;
Petersen, 2014; Roulston & Mills, 2000). The few studies that have investigated the
impact of teacher gender on student growth have shown conflicting results (Krieg, 2005;
Martin & Marsh, 2005; Marsh, Martin & Cheng, 2008). Chapter five includes a
summary of the study, an overview of the problem, a review of the purpose statement, a
review of the methodology, major findings, and findings related to the literature. The
chapter concludes with implications for school districts and leaders, recommendations for
future research, and concluding remarks.
Study Summary
This study provided an in-depth analysis of the impact of teacher gender on
student academic growth and attendance of third and fifth grade students. Research
questions included a comparative analysis of teacher gender and student gender, student
socioeconomic status, and attendance. The study utilized archival data from District X.
Nine research questions were generated with nine corresponding hypotheses. Six two-
factor ANOVAs were conducted using STAR assessment data and student attendance in
District X.
Overview of the problem. The majority of the literature and research currently
dedicated to teacher gender focuses on male teachers as role models. The studies called
for more male teachers in the classroom because of the perceived need for a positive male
57
role model at the elementary level (Cushman, 2008; Dee, 2006; Gibbs, 2012; Tucker,
2015). However, the number of men entering the teaching profession continues to
stagnate and remain low when compared to the number of women (Jones, 2007; Saban,
2003; Weaver-Hightower, 2011). Though the previously mentioned studies focused on
teacher gender, the quantitative studies on the impact of teacher gender on student
academic growth is limited and shows discrepancies (Krieg, 2005; Piechura-Couture,
Heins, & Tichenor, 2013).
Purpose statement and research questions. The purpose of this study was to
determine the extent there was a difference in academic growth between students in
upper elementary classrooms with male teachers and students in classrooms with female
teachers. Another purpose of this study was to determine the extent there was a
difference in academic growth between students of different socioeconomic backgrounds
with male teachers and students with female teachers. The final purpose of this study
was to determine the extent there was a difference in attendance between male students
with male teachers and students with female teachers.
Review of the methodology. A quantitative research design was used to
investigate the impact teacher gender has on student academic growth and attendance.
The population for this study included third and fifth grade students from District X.
Students involved in the study took the STAR reading and mathematics assessments in
the fall of 2015 and spring of 2016. The independent variables for this research were
teacher gender, student gender, and student socioeconomic status. The dependent
variables included student academic growth on the STAR Reading and STAR
Mathematics assessments and student attendance. To test the nine hypotheses, six two-
58
factor ANOVAs were conducted using the IBM Statistics 24.0 Faculty Pack for
Windows.
Major findings. In the current research study, eight out of nine hypotheses tested
showed teacher gender had no impact on student results on the STAR reading or STAR
Mathematics Assessment. In addition, teacher gender did not impact student attendance.
However, the two-factor ANOVA utilized to test H2 indicated a marginally significant
difference. The effect of student gender in academic growth in reading, as measured by
the difference in the fall STAR scaled score and the spring STAR scaled score, between
third and fifth grade students in classrooms with male teachers and third and fifth grade
students in classrooms with female teachers was marginally significant. Teacher gender
did not have a statistically significant impact on the academic growth of students from
various socioeconomic backgrounds. Finally, teacher gender did not impact the
attendance of male or female students from various socioeconomic backgrounds.
Findings Related to the Literature
The researcher conducted a review of literature related to gender differences in
the teaching profession, academic achievement differences between male and female
students, implications of socioeconomic status on academic achievement, and attendance
of students. The research related to the gender differences in the teaching profession
showed conflicting results. Krieg (2005) studied a cohort of almost 50,000 fourth grade
students. After analyzing the results of the study, Krieg (2005) found students showed
the highest achievement when they had a female teacher. Marsh, Martin, and Cheng
(2008) contradicted Krieg’s (2008) findings and found that teacher gender had no
relationship to student achievement. In the current research study, female students with
59
female teachers showed marginal growth in reading that male students of female
teachers. However, female and male students, taught by either a male or female teacher,
did not show a statistically significant difference in academic growth in mathematics.
Dee (2006) analyzed data from 24,599 8th grade students. Dee (2006) found that
when female students were placed with a female teacher, female students scored 4%
higher on the state mandated assessment. Orr (2011) analyzed data amongst 6,394
kindergarten students. The results of Orr’s (2011) study indicated girls outperformed
boys. In the current research study, female students of female teachers showed
marginally significant growth compared to male students of female teachers.
Research has been done to understand the relationship between socioeconomic
status and student achievement. Bentzel (2012) conducted a study by analyzing archival
standardized testing data. The researcher found students from poverty performed
significantly lower than students from non-poverty families. Martinez-Perez (2013)
analyzed archival data amongst third, fourth, and fifth grade students. The researcher
found students from poverty were less likely to pass the state required test. In the current
research study, the differences in academic growth of students from different
socioeconomic classes in classrooms with male teachers and in classes with female
teachers was not statistically meaningful.
Conclusions
This study aimed to identify the impact of teacher gender on student academic
growth and attendance of third and fifth grade students. The study utilized archival data
from the STAR Reading and Mathematics Assessment to determine if teacher gender
statistically impacted academic growth. Additionally, the study utilized the same data to
60
determine if teacher gender statistically impacted academic growth of students from
different socioeconomic backgrounds. The study also utilized archival data to determine
if teacher gender statistically impacted attendance of third and fifth grade students. The
following section includes implications for action by educational leaders to assist in
understanding the impact teacher gender has on academic growth and attendance. This
section then makes recommendations for future research and ends with concluding
remarks.
Implications for action. The current quantitative study investigated the impact of
teacher gender on student academic growth and attendance. While the research presented
in this study indicated teacher gender had no impact on student academic growth in
mathematics, the interaction between teacher and student gender did impact student
academic growth in reading. Female students with a female teacher showed marginally
significant growth in reading when compared to male students with a female teacher.
Since the female students showed more growth in reading when they had a female
teacher, district leaders could focus observations on best strategies used by female
teachers when working with female students.
Recommendations for future research. Below are recommendations for future
research on the impact of teacher gender in the education environment.
1. It is recommended that future researchers replicate the current study but
disaggregate the data based on the ethnicity of the students as an extension of the
study.
2. It is recommended that future researchers replicate the current study but
expand the study to include other grade levels, including middle and high school.
61
3. It is recommended that future researchers replicate the current study but focus
on the correlation between teacher gender and disciplinary issues within the
classroom.
4. It is recommended that future researchers replicate the current study and
expand the student growth indicators to include other subject areas, including
science and social studies.
5. It is recommended that future researchers replicate the current study and focus
on single-gender classrooms.
6. It is recommended that future researchers replicate the current study and
compare results between urban, suburban, and rural school districts. This type of
study would expand the current body of knowledge to include a more varied
group of students.
7. It is recommended that future researchers replicate the current study and
include more participants by gathering data from larger school districts.
8. It is recommended that future researchers replicate the current study and
disaggregate data based on the initial achievement levels of students. Students
could then be grouped into a lower achieving group, on-target group, and exceeds
expectations group. At the conclusion of the school year, the student academic
growth of students in these groups could vary by teacher gender.
Concluding remarks. The current literature and research regarding teacher
gender focuses on qualitative studies related to male role models in the classroom,
specifically the elementary and middle school levels. Although this has proven to be an
62
important topic worthy of discussion, additional studies should be conducted to increase
the amount of research dedicated to the topic of teacher gender.
This study indicated teacher gender only impacted female students of female
teachers because they showed marginally significant growth in reading. Teacher gender
did not impact student academic growth in mathematics regardless of student gender.
Additionally, teacher gender did not impact the academic growth of students from
various socioeconomic backgrounds. Finally, teacher gender did not impact attendance
of students. While most of this study revealed teacher gender does not impact various
facets of the educational environment, one important part of this study did show a
marginally significant difference. Therefore, research should continue to expand upon
this study.

63
References
Bentzel, E. J. (2012). The combined effects of low socioeconomic status and high mobility
on elementary achievement scores in Pennsylvania. Available from ProQuest
Dissertations & Theses Full Text Database. (UMI No. 945731927)
Berry, B. (1986). Why bright college students won’t teach. Urban Review, 18(4), 269–
280. doi:10.1007/bf01112133
Bureau of Labor Statistics. (2013). Household data annual averages. Retrieved from
http://www.bls.gov/cps/cpsaat11.pdfhttp://www.bls.gov/cps/cpsaat11.pdf
Bureau of Labor Statistics. (2014). Occupational outlook handbook: Kindergarten and
elementary school teachers. Retrieved from http://www.bls.gov/ooh/education-
training-and-library/kindergarten-and-elementary-school-teachers.htm
Carrington, B., & Skelton, C. (2003). Re-thinking “role models”: Equal opportunities in
teacher recruitment in England and Wales. Journal of Education Policy, 18(3),
253.
Chicosky, C. L. (2015). Restructuring the modern education system in the United States:
A look at the value of compulsory education laws. Brigham Young University
Education & Law Journal, 2015(1), 1-75.
Cleaver, S. (2010). Mr. teacher. Instructor, 119(6), 48-50.
Common Core State Standards Initiative. (2015) What parents should know. Retrieved
from http://www.corestandards.org/what-parents-should-know/
Cooney, M. H., & Bittner, M. T. (2001). Men in early childhood education: Their
emergent issues. Early Childhood Education Journal, 29(2), 77-82.
64
Cunningham, B., & Watson, L. W. (2002). Recruiting male teachers. Young Children,
57(6), 10-15.
Cushman, P. (2008). So what exactly do you want? What principals mean when they say
“male role model'? Gender and Education, 20(2), 123-136.
Daugherty, M. B. (2008). Attendance and other factors that influence student
achievement in a Delaware public school district. Retrieved from ProQuest
Dissertations & Theses Full Text Database. (UMI No. 304826752)
Dee, T.S. (2006). The why chromosome: How a teacher’s gender affects boys and girls.
Education Next, (6)4. 69–75.
Department of Elementary and Secondary Education. (2016a). District demographic
data. Retrieved from
http://mcds.dese.mo.gov/guidedinquiry/District%20and%20Building%20Student
%20Indicators/District%20Demographic%20Data.aspx
Department of Elementary & Secondary Education. (2016b). Compulsory attendance
law. Retrieved from https://dese.mo.gov/governmental-
affairs/freqaskques/Attendance
Dexter, E. (1904). A history of education in the United States. New York, NY: The
MacMillan Company.
Dundar, S. (2010). Reasons for choosing the teaching profession and beliefs about
teaching: A study with elementary teacher candidates. College Student Journal,
48(3), 445-460.
65
Genc, E., & Ogan-Bekiroglu, F. (2006). Patterns in teaching styles of science teachers in
Florida and factors influencing their preferences. Retrieved from
http://files.eric.ed.gov/fulltext/ED490781.pdf
Gibbs, N. (2012). Record numbers of men teaching in primary schools but more still
needed. Retrieved from https://www.gov.uk/government/news/record-numbers-
of-men-teaching-in-primary-schools-but-more-still-needed
Gosse, D. (2011). Race, sexual orientation, culture and male teacher role models: "Will
any teacher do as long as they are good?" Journal of Men's Studies, 19(2), 116-
137. doi:10.3149/jms.1902.116
Hussain, S., Ali, R., Khan, M. S., Ramzan, M., & Qadeer, M. Z. (2011). Attitude of
scholarly school teachers towards teaching profession. International Journal of
Academic Research, 3(1), 985-990.
Jones, D. (2007). Millennium man: Constructing identities of male teachers in early years
contexts. Educational Review, 59(2), 179-194. doi:10.1080/00131910701254973
Jones, W. (2010). A correlational study of student achievement and student
attendance. Retrieved from ProQuest Dissertations & Theses Full Text Database.
(UMI No. 597943924).
Kelly, M. (2015, February 14). Facts and founding dates for the 13 colonies. Retrieved
from http://americanhistory.about.com/od/colonialamerica/a/colonylist.htm
Krieg, J. (2005). Student gender and teacher gender: What is the impact on high stakes
test scores? Current Issues in Education. Retrieved from
http://faculty.wwu.edu/kriegj/Econ.%20Documents/Teacher%20and%20Student
%20Gender.pdf
66
Lett, D. (2013, February, 21). Only male teachers need apply. Winnipeg Free Press.
Retrieved from http://www.winnipegfreepress.com/local/only-male-teachers-
need-apply-192213421.html
Lunenburg, F. C., & Irby, B. J. (2008). Writing a successful thesis or dissertation: Tips
and strategies for students in the social and behavioral sciences. Thousand Oaks,
CA: Corwin Press.
Malaby, M., & Ramsey, S. J. (2010/2011). The dilemmas of male elementary preservice
teachers. Curriculum and Teaching Dialogue, 13, 1-17.
Marsh, H. W., Martin, A. J., & Cheng, J. S. (2008). A multilevel perspective on gender in
classroom motivation and climate: Potential benefits of male teachers for boys?
Journal of Educational Psychology, 100(1), 78-95.
Martin, A., & Marsh, H. (2005). Motivating boys and motivating girls: Does teacher
gender really make a difference? Australian Journal Of Education (ACER Press),
49(3), 320-334.
Martinez-Perez, F. (2013). The impact of socioeconomic status on elementary student
achievement in rural south Texas schools. Retrieved from ProQuest Dissertations
& Theses Database. (UMI No. 1496772902)
Marzano, R. J., & Marzano, J. S. (2003). The key to classroom management. Educational
Leadership, 61(1), 6-13.
McGrath, K., & Sinclair, M. (2013). More male primary-school teachers? Social benefits
for boys and girls. Gender and Education, 25(5), 531-547.
doi:10.1080/09540253.2013.796342
67
Mills, M., Haase, M., & Charlton, E. (2008, March). Being the “right” kind of male
teacher: The disciplining of John. Pedagogy, Culture and Society, 16(1), 71-84.
Missouri Association for Community Action. (2016). Poverty in Missouri. Retrieved
from http://www.communityaction.org/poverty-reports/
National Education Association. (2014). Rankings of the states 2013 and estimates of
school statistics 2014. Missouri School Breakfast and Lunch Program
Washington D.C.: National Education Association. Retrieved from
http://www.nea.org/assets/docs/NEA-Rankings-and-Estimates-2013-2014.pdf
New South Wales Department of Education and Communities. (2014). Male school
teachers. Retrieved from https://www.det.nsw.edu.au/media/downloads/about-
us/statistics-and-research/key-statistics-and-reports/staff-information/male-
school-teachers.pdf
O'Neil, J. M., & Luján, M. L. (2009). Preventing boys' problems in schools through
psychoeducational programming: A call to action. Psychology in the Schools,
46(3), 257-266.
Orr, A. (2011). Gendered capital: Childhood socialization and the “boy crisis” in
education. Sex Roles, 65(3/4), 271-284. doi:10.1007/s11199-011-0016-3
Parke, C. S., & Kanyongo, G. Y. (2012). Student attendance, mobility, and mathematics
achievement in an urban school district. Journal of Educational Research, 105(3),
161-175. doi:10.1080/00220671.2010.547231
Petersen, N. (2014). The 'good', the 'bad' and the 'ugly'? Views on male teachers in
foundation phase education. South African Journal of Education, 34(1), 1-13.
68
Piechura-Couture, K., Heins, E., & Tichenor, M. (2013). The boy factor: Can single-
gender class reduce the over-representation of boys in special education? College
Student Journal, 47(2), 235-243.
Porter, G. (2008) The status of male teachers in public education today. Retrieved from
http://ceep.indiana.edu/projects/PDF/PB_V6N4_Winter_2008_EPB.pdf
Ravitch, D. (2003, August 23). A brief history of teacher professionalism - White House
conference on preparing tomorrow’s teachers. Retrieved from
http://www2.ed.gov/admins/tchrqual/learn/preparingteachersconference/ravitch.ht
ml
Renaissance Learning. (2014). The research foundation for STAR Assessments. Retrieved
from http://doc.renlearn.com/KMNet/R001480701GCFBB9.pdf.
Renaissance Learning. (2015a). STAR definitions. Retrieved from
http://doc.renlearn.com/KMNet/R001316312GB442F.pdf.
Renaissance Learning. (2015b). STAR reading technical manual. Wisconsin Rapids, WI:
Renaissance Learning.
Renaissance Learning. (2016). STAR math technical manual. Retrieved from
doc.renlearn.com/KNIT/Roo54119FEC4FEC4F604.pdf
Roulston, K., & Mills, M. (2000). Male teachers in feminised teaching areas: Marching to
the beat of the men's movement drums? Oxford Review of Education, 26(2), 221-
237. doi:10.1080/03054980050031417
Rubie-Davies, C. M., Flint, A., & McDonald, L. G. (2012). Teacher beliefs, teacher
characteristics, and school contextual factors: What are the relationships? British
69
Journal of Educational Psychology, 82(2), 270-288. doi:10.1111/j.2044-
8279.2011.02025.x
Saban, A. (2003). A Turkish profile of prospective elementary school teachers and their
views of teaching. Teaching & Teacher Education, 19(8), 829.
doi:10.1016/j.tate.2003.03.004
Sadowski, M. (2010). Putting the “boy crisis” in context. Education Digest, 76(3), 10-13.
Schwartz, W. (2002). Helping underachieving boys read well and often. Retrieved from
http://files.eric.ed.gov/fulltext/ED467687.pdf
Skelton, C. (2003). Male primary teachers and perceptions of masculinity. Educational
Review, 55(2), 195.
Snyder, T. & Dillow, S. (2012). Digest of education statistics 2011. National Center for
Education Statistics, Institute of Education Sciences, U.S. Department of
Education. Washington, DC. Retrieved from
http://nces.ed.gov/pubs2012/2012001.pdf
Sprick, J., Alabiso, J., & Yore, K. (2015). Dramatically improving
attendance. Educational Leadership, 73(3), 50-54.
Starr, J. (2015). Make teaching more professional. Phi Delta Kappan. 97(2), 52-57.
doi:10.1177/0031721715610092
Stull, J. C. (2013). Family socioeconomic status, parent expectations, and a child's
achievement. Research in Education, 90(1), 53-67. doi:10.7227/RIE.90.1.4
Tucker, S. I. (2015). Three men and a maybe: Identity and privilege in male preservice
elementary school teachers. Journal of Men's Studies, 23(1), 3-20.
doi:10.1177/1060826514561988
70
Tyler Technologies. (2016). Tyler SIS attendance. Retrieved from
http://www.tylertech.com/solutions-products/tyler-sis-product-suite/attendance
United States Department of Agriculture. (2016). National school lunch program
(NSLP). Retrieved from http://www.fns.usda.gov/nslp/national-school-lunch-
program-nslp
U.S. Census Bureau. (1999). Statistical abstract of the United States. Retrieved from
https://www.census.gov/prod/99pubs/99statab/sec31.pdfhttps://www.census.gov/
prod/99pubs/99statab/sec31.pdf
U.S. Department of Labor, Benefits.gov. (2016). Missouri school breakfast and lunch
program. Retrieved from http://www.benefits.gov/benefits/benefit-details/2000
Weaver-Hightower, M. (2011). Male preservice teachers and discouragement from
teaching. The Journal of Men's Studies, 19(2), 97-115.

71
Appendices

72
Appendix A: Request and Approval from District X
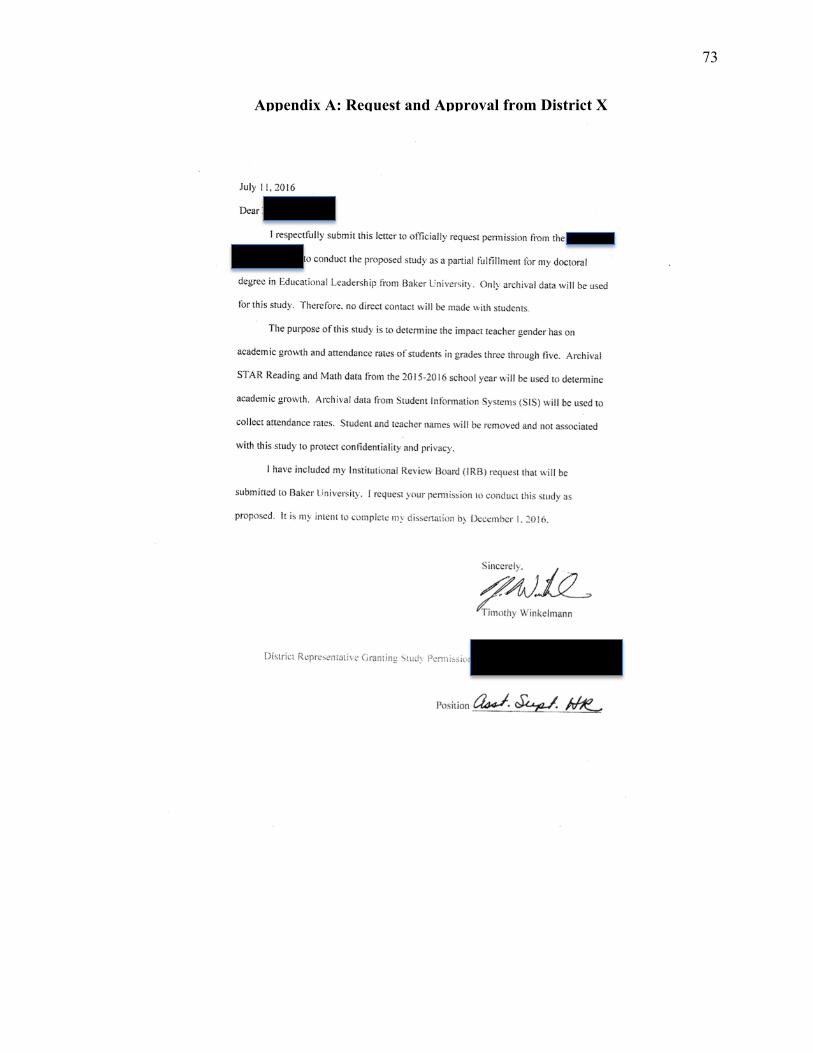
73
Appendix A: Request and Approval from District X

74
Appendix B: Proposal for Research to Baker University
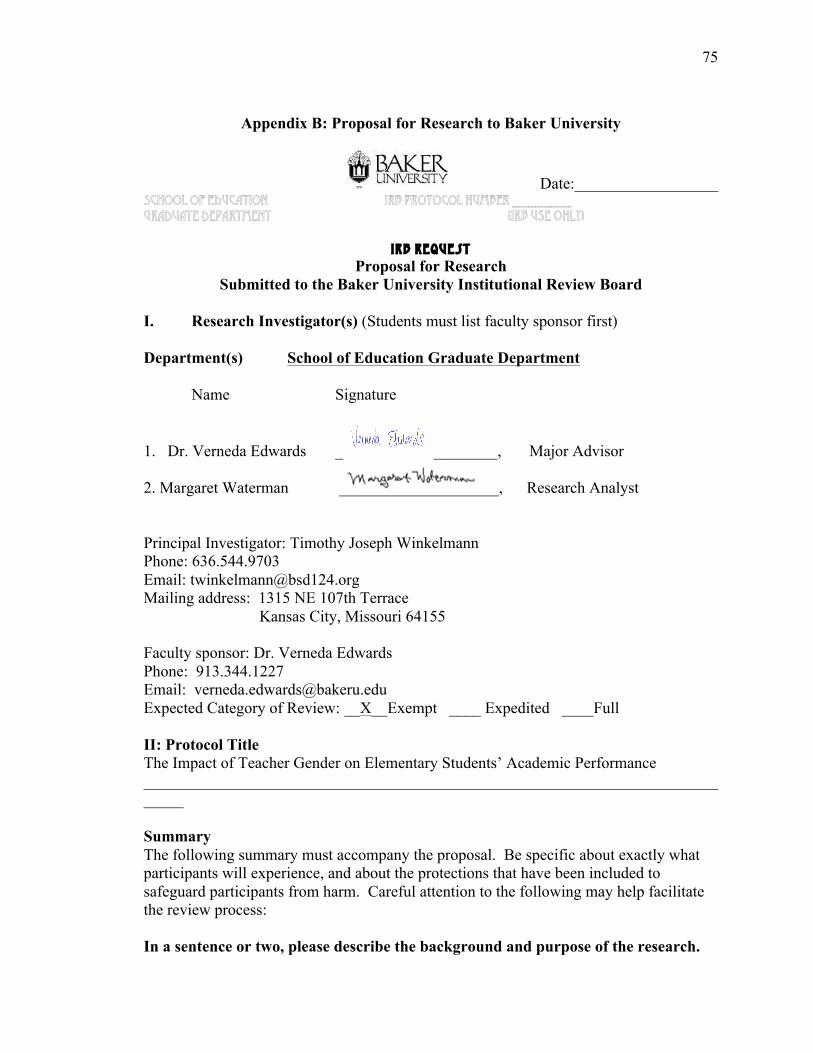
75
Appendix B: Proposal for Research to Baker University
Date:__________________ School of education IRB PROTOCOL NUMBER __________________ Graduate department (irb USE ONLY)
IRB Request Proposal for Research
Submitted to the Baker University Institutional Review Board
I. Research Investigator(s) (Students must list faculty sponsor first) Department(s) School of Education Graduate Department Name Signature
1. Dr. Verneda Edwards _ ________, Major Advisor 2. Margaret Waterman ____________________, Research Analyst Principal Investigator: Timothy Joseph Winkelmann Phone: 636.544.9703 Email: [email protected] Mailing address: 1315 NE 107th Terrace Kansas City, Missouri 64155 Faculty sponsor: Dr. Verneda Edwards Phone: 913.344.1227 Email: [email protected] Expected Category of Review: __X__Exempt ____ Expedited ____Full II: Protocol Title The Impact of Teacher Gender on Elementary Students’ Academic Performance _____________________________________________________________________________ Summary The following summary must accompany the proposal. Be specific about exactly what participants will experience, and about the protections that have been included to safeguard participants from harm. Careful attention to the following may help facilitate the review process: In a sentence or two, please describe the background and purpose of the research.

76
The purpose of this study is to explore the difference in academic performance and attendance between students in classrooms with male teachers and students in classrooms with female teachers. The research will be conducted in the Belton School District, a midsized suburban district that is comprised of four elementary schools, one K-6 school, and one 5/6th grade school. Briefly describe each condition or manipulation to be included within the study. There is no manipulation within this study. The research sample will consist of 10 school teachers and archived student data during the 2015-2016 school year. No identifiable teacher or student information will appear on the spreadsheet. What measures or observations will be taken in the study? If any questionnaire or other instruments are used, provide a brief description and attach a copy. Student growth is measured by subtracting a fall score from a spring score. Student mathematics growth scores will be measured by using STAR data from Fall 2015 to Spring 2016. STAR assessments are a product of Renaissance Learning. Additionally, socioeconomic status and attendance will be accessed through the Student Information System (SIS). Will the subjects encounter the risk of psychological, social, physical, or legal risk? If so, please describe the nature of the risk and any measures designed to mitigate that risk. The subjects will not encounter the risk of psychological, social, physical, or legal risk. Only archival data will be used. Will any stress to subjects be involved? If so, please describe. Archival data will be used so no stress will be involved. Will the subjects be deceived or misled in any way? If so, include an outline or script of the debriefing. The subjects will not be deceived or misled in any way. Will there be a request for information that subjects might consider to be personal or sensitive? If so, please include a description. Individual identification will not occur throughout the research study. Will the subjects be presented with materials that might be considered to be offensive, threatening, or degrading? If so, please describe.
77
The subjects will not be presented with materials that might be considered to be offensive, threatening, or degrading. Approximately how much time will be demanded of each subject? The subjects will not be contacted as part of the study, and therefore the study will not ask for any time from any of the subjects. Subjects will not actively participate in any aspect of the study. Who will be the subjects in this study? How will they be solicited or contacted? Provide an outline or script of the information which will be provided to subjects prior to their volunteering to participate. Include a copy of any written solicitation as well as an outline of any oral solicitation. Third through fifth grade students in the Belton School District will be the subjects of study. Data used will be archived and subjects will be anonymous. What steps will be taken to ensure that each subject’s participation is voluntary? No steps will be taken as the district collects STAR Reading, Mathematics, attendance, and socioeconomic data. What if any inducements will be offered to the subjects for their participation? No inducements will be offered to students to participate. How will you ensure that the subjects give their consent prior to participating? Will a written consent form be used? If so, include the form. If not, explain why not. No consent is required for this study. All data is archived, therefore no inducements will be offered. Will any aspect of the data be made a part of any permanent record that can be identified with the subject? If so, please explain the necessity. No aspect of the data will be identified with any subjects. Will the fact that a subject did or did not participate in a specific experiment or study be made part of any permanent record available to a supervisor, teacher or employer? If so, explain. Data generated for this study will not be used for any other purposes. No names or other identification will be available to identify the subjects in the study. The data will be stored on a password-protected flash drive, which will be kept in a locked drawer. The data will be stored for one year. Afterwards, the data will be destroyed.

78
What steps will be taken to ensure the confidentiality of the data? Where will it be stored? How long will it be stored? What will be done with it after the study is completed? All subjects involved in the study will remain anonymous. Data will be stored in a password protected Microsoft Excel spreadsheet only accessible to the researcher. The data will be stored for three years before it will be deleted and destroyed. If there are any risks involved in the study, are there any offsetting benefits that might accrue to either the subjects or society? No risks are involved with this study. Will any data from files or archival data be used? If so, please describe. Archival data will be used for this study. Data from STAR Reading and Mathematics and SIS will be downloaded and imported into IBM® SPSS® Faculty Pack 22 for Windows.

79
Appendix C: IRB Letter of Approval
80
Appendix C: IRB Letter of Approval


![[NAME OF SCHOOL] Single... · Web view2019-11-14 · Is information collected on race, disability and gender with regards to both students and staff e.g. student achievement, attendance,](https://img.pdfslide.net/doc/110x75/5e61817c99989c03ac1fe04c/name-of-school-single-web-view-2019-11-14-is-information-collected-on-race.jpg)