Embed Size (px)
Citation preview

THE IMPACT OF TECHNOLOGY IN PROVIDING PUBLIC
SERVICE: A CASE OF TRAFFIC POLICE AT KINONDONI
DISTRICT IN DAR ES SALAAM
By
Winfrida Alfred Minde
Dissertation Submitted in Partial Fulfilment of the Requirements for the
Award of the Degree of Master of Business Administration Corporate
Management (MBA – CM) of Mzumbe University
2019

i
CERTIFICATION
The undersigned, certify that we have read and hereby recommend for acceptance by
the Mzumbe University, a dissertation entitled The Impact of Technology in
providing public service: A case of Traffic Police at Kinondoni district in Dar Es
Salaam in partial /fulfillment of the requirements for award of the degree of Master of
Business Administration of Mzumbe University.
_______________
Principal Supervisor
________________
Internal Examiner
________________
External Examiner
Accepted for Mzumbe University, Dar Es Salaam Campus College
___________________________________________________________
CHAIRPERSON, DAR ES SALAAM CAMPUS COLLEGE BOARD

ii
DECLARATION
AND
COPYRIGHT
I, Minde, Winfrida A. declare that this dissertation is my own original work and that
it has not been presented and will not be presented to any other university for a similar
or any other degree award.
Signature……………………………………..
Date …………………………………………
© 2019
This Dissertation is copyright material protected under the Berne Convention, the
Copyright Act 1999 and other international and national enactments, in that behalf, on
intellectual property. It may not be reproduced by any means in full or in part, except
for short extracts in fair dealings, for research or private study, critical scholarly review
or discourse with an acknowledgement, without the written permission of Mzumbe
University, on behalf of the author.

iii
ACKNOWLEDGEMENT
In the course of having this work completed, I couldn’t have made it without the help
and support from a number of individuals to whom I feel greatly indebted.
First and foremost, I would like to thank my supervisor DR JOSEPH SUNGAU for
his continuous support and directions, it wasn’t an easy study I will always cherish his
patience, going through a number of drafts I sent and made sure I received them on
time, his valuable support made this study possible.
I would also like to extend my thanks to the traffic department at Kinondoni district,
especially to SP SADICK RAMADHAN MSANGI the Regional Traffic officer apart
from his busy schedule on serving the public, he always had time to answer my
questions, he made sure I got all the necessary information from him or his
subordinates and data to make this study possible.
Most significantly, I would like to thank my family that is my husband RAYMOND
SAMSON and my kids SINYORITHA, VIANE-AMOR and RICARDO for their
continuous support, and for bearing with a missing wife and mother now and then, it
was not easy but I am glad they all supported me to date, I am nothing without them.
Lastly, I would like to thank all of the people who helped me throughout this course,
their support won’t go unnoticed, thank you.

iv
DEDICATION
To my Papa

v
LIST OF ACRONYMS AND ABBREVIATION
APNR Automated Plate number recognition
DOI Diffusion of Innovation
IDT Innovation Diffusion Theory
MOFEA Ministry of Finance and Economic Affairs
NECTA National Examination Council Tanzania
PEOU Perceived ease of use
PO-PSM President Office Public Service Management
POS Point of Sale
PSRP Public Service Reform Program
SUMATRA Surface and Marine Transport Regulatory Authority
TAM Technology Acceptance Model
TANESCO Tanzania National Electricity Corporation
TCU Tanzania Commission for Universities
TIN Tax Identification Number
TIRA Tanzania Insurance Regulatory Authority
TMS Traffic Management System
TPF Tanzania Police Force
TRA Tanzania Revenue Authority
TTF Technology Task Fit
TZDL Tanzania Driving License
TZS Tanzanian Shillings
UN United Nations
URT United Republic of Tanzania
VIP Very Important person
WWW World Wide Web
vi
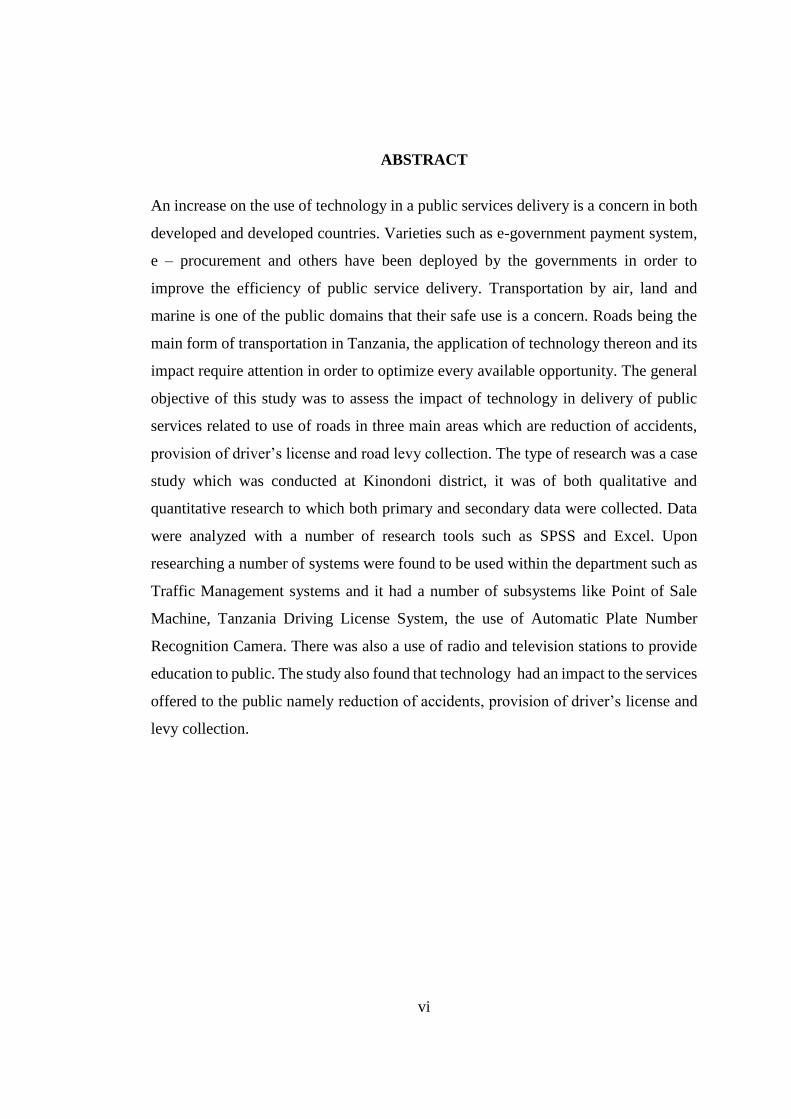
ABSTRACT
An increase on the use of technology in a public services delivery is a concern in both
developed and developed countries. Varieties such as e-government payment system,
e – procurement and others have been deployed by the governments in order to
improve the efficiency of public service delivery. Transportation by air, land and
marine is one of the public domains that their safe use is a concern. Roads being the
main form of transportation in Tanzania, the application of technology thereon and its
impact require attention in order to optimize every available opportunity. The general
objective of this study was to assess the impact of technology in delivery of public
services related to use of roads in three main areas which are reduction of accidents,
provision of driver’s license and road levy collection. The type of research was a case
study which was conducted at Kinondoni district, it was of both qualitative and
quantitative research to which both primary and secondary data were collected. Data
were analyzed with a number of research tools such as SPSS and Excel. Upon
researching a number of systems were found to be used within the department such as
Traffic Management systems and it had a number of subsystems like Point of Sale
Machine, Tanzania Driving License System, the use of Automatic Plate Number
Recognition Camera. There was also a use of radio and television stations to provide
education to public. The study also found that technology had an impact to the services
offered to the public namely reduction of accidents, provision of driver’s license and
levy collection.

vii
TABLE OF CONTENTS
CERTIFICATION ...................................................................................................... i
DECLARATION AND COPYRIGHT .................................................................... ii
ACKNOWLEDGEMENT ........................................................................................ iii
DEDICATION ........................................................................................................... iv
LIST OF ACRONYMS AND ABBREVIATION ................................................... v
ABSTRACT ............................................................................................................... vi
LIST OF TABLES .................................................................................................... ix
LIST OF FIGURES ................................................................................................... x
CHAPTER ONE ........................................................................................................ 1
INTRODUCTION AND BACKGROUND .............................................................. 1
1.0 Introduction ............................................................................................................ 1
1.1 Background of the problem .................................................................................... 1
1.2 Statement of the Problem ....................................................................................... 6
1.3 Research objectives ................................................................................................ 7
1.3.1 General objective ................................................................................................ 7
1.3.2 Specific objectives .............................................................................................. 7
1.3.3 Research questions .............................................................................................. 8
1.4 Significance of the study ........................................................................................ 8
1.5 Scope of the study .................................................................................................. 8
CHAPTER TWO ..................................................................................................... 10
LITERATURE REVIEW ........................................................................................ 10
2.0 Introduction .......................................................................................................... 10
2.1 Concepts and definition........................................................................................ 10
2.2 Theoretical review ................................................................................................ 22
2.3 Empirical framework ........................................................................................... 32
2.4 Conceptual framework ......................................................................................... 39
2.5 Research gap ........................................................................................................ 39
CHAPTER THREE ................................................................................................. 41
RESEARCH METHODOLOGY ........................................................................... 41

viii
3.0 Introduction .......................................................................................................... 41
3.1 Research design .................................................................................................... 41
3.2 Study (Geographical) Area .................................................................................. 41
3.3 Sources of Data .................................................................................................... 41
3.4 Sample size........................................................................................................... 42
3.5 Data Collection..................................................................................................... 42
3.6 Data Analysis ....................................................................................................... 42
3.7 Ethical consideration ............................................................................................ 42
CHAPTER FOUR .................................................................................................... 43
RESEARCH FINDINGS ......................................................................................... 43
4.0 Introduction .......................................................................................................... 43
4.1 Data analysis and Interpretations. ........................................................................ 43
4.2 Preliminary data analysis ..................................................................................... 43
4.2.1 Missing data check ............................................................................................ 43
4.2.2 Descriptive analysis: ......................................................................................... 44
4.3 The impact of technology in reduction of road accidents .................................... 46
4.4 The impact of technology in license provision .................................................... 50
4.5 The impact of technology in levy collection ........................................................ 52
CHAPTER FIVE ...................................................................................................... 56
SUMMARY OF FINDINGS ................................................................................... 56
5.0 Introduction .......................................................................................................... 56
5.1 The impact of technology in reducing road accidents ......................................... 56
5.2 The impact of technology in licenses provision ................................................... 57
5.3 The impact of technology on levy collection ....................................................... 57
5.4 Conclusion ........................................................................................................... 58
5.5 Recommendations ................................................................................................ 59
REFERENCES ......................................................................................................... 61
APENDIX ................................................................................................................. 63

ix
LIST OF TABLES
Table 2.1: Injuries and deaths for the past six years .................................................. 21
Table 4.1: Missing data check .................................................................................... 43
Table 4.2: Frequency table ......................................................................................... 45
Table 4.3: Group Statistics ......................................................................................... 45

x
LIST OF FIGURES
Figure 2.1: Sample of a driving license ..................................................................... 18
Figure 2.2: Technology Acceptance Model ............................................................... 24
Figure 2.3: Diffusion of Innovation Model ................................................................ 29
Figure 2.4: Diffusion of Innovation Acceptance model............................................. 30
Figure 2.5: UTAUT Model ....................................................................................... 32
Figure 2:6 Conceptual framework ............................................................................. 39
Figure 4.1: The impact of implementation of technology on number of road accidents
.................................................................................................................................... 47
Figure 4.2: The impact of technology on accident reduction on average yearly ....... 48
Figure 4.3: The impact of technology on license provision ....................................... 51
Figure 4.4: The impact of technology on license provision on average yearly ......... 51
Figure 4.5 The impact of Levy collection after technology ....................................... 53
Figure 4.6: The impact of technology on levy collection on average yearly ............. 53

1
CHAPTER ONE
INTRODUCTION AND BACKGROUND
1.0 Introduction
This chapter presents the background of the problem , statement of the problem and
rationale of the study. The chapter also outlines the objectives of the study as well as
research questions, the significance the study andr scope of the study.
1.1 Background of the problem
The rapid development of technology all over the world and Tanzania in particular,
due to globalization and unlimited innovations has un-doubtable impact on human
life.. Thus, it is the very aspect that the definitions of technology are relative because
it is dynamic in nature. Of course, it is often worth relating technology to its contents
as time erupts. The discussion on the concept of technology is crucial in getting a
clear understanding of the nature of technology and examining what the technology
consists of. In its narrowest sense, technology in early ages consisted of
manufactured objects like tools including axes, arrowheads and their modern
equivalents like containers including pots, water reservoirs and buildings. Their
purpose was to enhance human capabilities to earn the living. With objects like a
hammer one can either apply a strong force to an object or to enable humans perform
tasks they could not perform otherwise; with a pot a person can transport large
amounts of water; with hands one cannot. Engineers call such objects “hardware”.
Anthropologists speak of “artifacts”. The term ‘technology’ is inherently abstract
concept which is difficult to interpret, observe and evaluate (Blomstrom and Kokko,
1998).
It is important to understand that, occasionally when a new technology comes into
place, it promises to change human lives for the better level. It either improves
performance by working more simply and at a faster rate than ever before or it creates
possibilities and options that did not previously exist. Computational machine is one
but such an example of technology. Computers tirelessly perform calculations far

2
beyond human capabilities. They also create different possibilities for interacting
with the world by applying these calculations to information processing and thus,
form a new arena for social interaction. Through computers, information and
communication technologies have become a major vehicle for change in the
information age (Castells, 2000). Technologies like the Internet continue the social
evolution of communications and information that began with speech, writing and
printing (Ong, 1982). The Internet and the World-Wide Web (Web) represent the
latest “disruptive” technologies (Christensen, 1997) by creating new opportunities
for identity formation that disturb values that have been the mainstay of
communication for a long period of time. In the process, the computer is generating
new ethical challenges in many areas of modern life. All the norms of a pre-computer
society, including those associated with education, are now open to question (Kizza,
1998).
For the most part, decisions to adopt these technologies for teaching are justified on
technical grounds. Yet, despite a seemingly straightforward technical criterion of
using the most appropriate tool for the job, there is little research that unambiguously
shows whether the implementation of exchange of information electronically as the
result of technology from teachers to students as one of the teaching tool improves
the ease in which students can grasp the knowledge being parted to them.
Technology is changing from time to time and other previous studies of the
distinctive marks of technology do not provide answers that remain meaningful for
very long. Without a normative dimension to guide decision-making, it is not
surprising that Heinich (1984) found that the research on comparative performance
has never influenced teachers’ use of technology. By ignoring the values in technical
objects, scientific accounts of technology have simply been unable to give guidance
on the right way to teach. Meanwhile, evaluative reports continue to criticize
technology for failing to live.
Technology in Tanzania got its latest definition from the time the country received
the first computer, an ICT 1500, that was installed at the Ministry of Finance in the

3
year 1965. Coming to 1974, there were up to seven computers in the country at the
same time, the Ministry of Finance had already acquired another computer, an ICL
1900. The introduction of computers was associated with implementation challenges
in most of the departments were they were installed. Installations were totally
dependent on foreign experts. In some cases these experts were not adequately
qualified or experienced. Applications tended not to be properly documented and
thus could run only if these foreign experts were around; when they left the country
the applications stopped functioning (Mgaya, 1994).
Having failed to modernize the accounting system of the government by using
computers which was associated with substantial financial loss, members of
parliament being elected representatives of the people and the public in general
heavily criticized the government. In view of the above in, 1974, the government
using its legislations machinery banned the importation of computers with all their
associated accessories through Government Gazette into Tanzania. Later on the
Ministry of Finance made a decision to appoint two separate teams to undertake due
diligence of the feasibility, viability and ideal utilisation of computers and their
corresponding software in the country. One of the teams constituted experts drawn
from the National Institute of Productivity and the International Labour Organization
arm of the United Nations. This team was giving advice to the government to
generate a policy on computer technology (acquisition and utilization) and a national
training program in computer science. The other team was named as the Government
Computer Task Force. The majority of its members were drawn from the
Government Computer Service Centre a department at the Ministry of Finance. The
second team was to give an in-depth analysis and findings on computer utilization in
the then installations; software maneuverability on the computers; the people’s
knowledge base in the country. The team was also to give out recommendation on
those computers which were to be returned to suppliers. The team further advised
that a computer advisory committee be established to give guidance to the Minister
for Finance on computer related issues. The team also recommended that the
government needed to give detailed procedures and guidelines on the procurement

4
of computer in Tanzania. The team advised against returning any computers to
suppliers (Mgaya, 1994).
In the year 1996, through the Ministry of Science, Technology and Higher
Education, Tanzania developed the National Science and Technology policy to
replace the 1985 policy on the same (URT, 1996). Among the objectives were
incorporation of technology in transport and communication, food and agriculture,
industry, energy, natural resources, environment, health, sanitation and population
as well as education and manpower. That means the country considered
incorporation of science and technology in planning her economy.
Tanzania Police Force under its traffic department has been undertaking a number
of technological changes as well shifting from analogue to digital technology in order
to deliver different services efficiently. Kinondoni district has been lucky enough to
be the pilot study of a number of technological changes or advancement. After the
increase of motor vehicles owners within the district and the population that has been
increasing notably, it was later seen as an indicator to start diverting from the analogy
and start using technology to improve their services offered to the public. If a certain
technology is applied and results to a desired outcome then it later spread to the entire
country. Kinondoni traffic police department like any other Police departments
throughout the country has a number of services to offer to the public. Among many
services hereunder are some of services delivered to general public: -
Provide education to drivers and other users of roads
Tanzania Police force under traffic department uses different means of media
such as television and radio stations to educate the public on the good use of
roads. The common media used within Kinondoni district are Tanzania
Broadcasting Corporation (TBC1), Independent Television (ITV), Radio One
Stereo, Clouds FM and EFM Radio. There are special campaigns such as
‘USALAMA KWANZA’ and many others. There are also weekly programs such
as insurance for motors, duties of the traffic police officer while on duty and
5
many others only to ensure that the public is enriched with the proper education
about their day to day use of both public and private roads.
The department also offers education to the students of different levels especially
primary and secondary schools. Police officers visit different schools and educate
these students appropriate use of the roads.
To control and supervise all driving schools
Traffic department is responsible in controlling all the driving schools in the
country when learners graduate they get tested by the inspectors from Traffic
department before they are allowed to process their driving license.
Driver’s license provision in collaboration with Tanzania Revenue Authority
After a person graduates from driving school then he/she is to be tested by Police
under traffic department and later submit the documents to both TRA and Traffic
in order to get a driving license.
Vehicle tracking system with collaborating with Surface and Marine Transport
Regulatory Authority (SUMATRA).
Levy collection via notification done by road offenders
Among many other duties, Tanzania Police Force is to collect government levy.
This levy is collected upon occurrence of various incidences such as money paid
for the loss report which is on TZS 500. It is collected also by enforcing different
government laws, rules and regulations like renewal of license for fire arms
ownership. In this study the areas of concentration is on the levy collected on
fines issued to offenders on roads.
In order to make these duties possible, a number of systems have been used and have
been put into action since late 2015 so as to reduce the workload and yet serve the
public efficiently. Systems such as Traffic Enforcement Management Information

6
System (TMS), Vehicle Tracking Systems, Tanzania Driving License System
(TZDL) and Automatic Plate Number Recognition Camera are some of them. Also
there are uses of wireless radios and other means of communications such as Radio
stations some of them being Radio One, Radio Free Africa and Clouds Radio to alert
the public in case of either any traffic congestion or accidents which cause congestion
at a certain place and also inform the road users alternative roads they can use to
avoid inconveniences.
1.2 Statement of the Problem
The Tanzanian transport sector is divided into two main categories namely, the
surface transport which includes roads and railways, inland waterways (lakes and
rivers), air transport and sea transport. Tanzania’s transport sector rose by 55% in
value during 2009–2014, from USD 1.3 billion to USD 2.1 billion. The strong reason
for such an increase was singled out to be the number of passengers using that
services and freight carried out through road transportation. According to Tanzania’s
2025 Development Vision, capital flow in the infrastructure, mainly in the design
and construction of the roads, rank amongst the the Government’s topmost in the
investment portfolio. The World Bank (WB) and the African Development Bank
(AfDB) on the other side assist implementations of projects in Tanzania by providing
loans, credits and/or grants in attaining her infrastructure development targets.
Road Transportation system in Tanzania is extensively used carrying over 90% of
passengers, 75% of the goods and other related cargo in the country. In Tanzania,
the road network is currently made up of 86,472 km of roads, out of which 12,786
km are in the category of trunk roads, 21,105 km are regarded as regional roads and
52,581 km are categorized as district, urban and feeder roads.
(https://www.tanzaniainvest.com/transport ). Road transport being the most used
form of transport in Tanzania has been causing a number of challenges to public
service providers especially the Traffic Police and also the general public as a whole.
It is not without attention that in urban localities, traffic congestion is a pervasive
problem. This is due to the fact that car ownership is increasing each day with

7
various development effects (Cremton et al, 2007). With studies exploring several
alternatives including road extensions and multiplicity, it was discovered that the
capacity increase does not relieve congestion (Duranton &Turner, 2011). There a
number of efforts made to relieve the public service providers and receivers in order
to make this procedure manageable such as:-
Introduction of electronic verification of driving licenses for motor vehicles and
motorcycle drivers around the country in order to establish their identities,
reprimand them and as a quality assurance of driving competencies.
The use of paper fine notice to road traffic law offenders has been replaced with
a Traffic Enforcement Management System Dependency System known as Point
of Sale machine (POS) whereby any traffic offender is given an electronic receipt
linked to the entire data concerning the driver’s license and particulars of
vehicles/motor vehicles involved.
The entire backdrop to the introduction of technology in the traffic management
system in Tanzania is an interest of the researcher. This study aims to assess the
impact of technology in providing public services by the traffic police as a section
of public service domain.
1.3 Research objectives
The study is grounded on a general objective and specific research objectives.
1.3.1 General objective
To assess the impact of technology in delivery of public services
1.3.2 Specific objectives
i. To assess the impact of technology in reducing road accidents
ii. To assess the impact of technology in provision of drivers’ license in the
traffic police department.
iii. To determine the impact of technology in levy collection
8
1.3.3 Research questions
i. What is the impact of technology in reducing road accidents?
ii. What is the impact of technology used by the traffic police officers in the
provision of driver’s license?
iii. What is the impact of technology in levy collection?
1.4 Significance of the study
The study findings were significant to a number of stakeholders in road traffic
management and the general public; to the traffic Police department, the study
revealed a number of issues (strength and weaknesses) related to the use of
technology in road traffic management and control. The assessment of which its
findings and recommendations influenced either motivation the department to
intensively engage technology further to its activities, to shift to better technologies
or to seal up the gaps that are caused by the use of technology in their duty
dispensation. To the academic society, the findings of the study add new knowledge
to the generation. The study ought to contribute a portion of knowledge concerning
the study variables that have been engaged for scrutiny. This means that the study is
added to the archives of knowledge in student learning libraries and literature
referencing. The study also laid foundation for further researches by future
researchers who may wish to work on the gaps as of the study findings.
To the public, it broadens their knowledge on the effectiveness of the technology and
therefore makes them take preventive usage of road services. At the end, road
accidents will be reduced to save unnecessary loss of people’s lives. On the other
side, knowledge impacted to the public may attract other stakeholders to take an
interest and invest their resources (in the form of Public-Private-Partnership) to
broaden the use of technology for safe and effective use of roads.
1.5 Scope of the study
This study focuses on the impact of technology in providing public services,
specifically on services provided by Tanzania Police Force under traffic department
in Kinondoni Dar Es Salaam. Such services will include the provision of driver’s

9
license, levy collection via notifications to road offenders and finally on how it has
helped reducing road accidents.

10
CHAPTER TWO
LITERATURE REVIEW
2.0 Introduction
This chapter is a review of the relevant available literature related to the study
variables. The chapter presents the definitions of key concepts included in the study,
the relevant theories, empirical studies that relate to the variables under study as well
as the conceptual framework.
2.1 Concepts and definition
Technology
Previous literatures define technology using different parameters and hence there
are various definitions. According to Kumar et. al (1999) technology is made up of
two primary ingredients: a physical part which includes such items as products,
tooling, equipment, blueprints, techniques, and processes; and the informational
ingredient which comprises of knowledge in areas production, quality control,
management, marketing, reliability, functional areas and skilled labor. The previous
definition by Sahal (1981) regards technology being ‘configuration’, calling that the
transfer object of technology depends on a subjectively identified but specifiable set
of processes and products. According to Dunning (1994) those time studies on the
transfer of technology connected technology directly with human knowledge and
specific attention was paid to the research process and respective development.
In the analysis of definitions of technology, two basic components are identified
which are; ‘knowledge’ or technique; and ‘doing things’. The use of technology is
in many cases associated with getting specific and identifiable result, finding
solutions for some problems, achieving tangible tasks using human skills, employing
knowledge and making use of assets (Lan and Young, 1996). The technology
concept does not limit its relationship to the technology that the product of made of
but it is also covers about the information or knowledge of it use, how it is applied

11
and the various stages in developing that particular product (Lovell, 1998; Bozeman,
2000). The concept regarding technology as information maintains the position that
the technology is applicable generally and it can easily be reproduce as well as being
reused (Arrow, 1962). However, Reddy and Zhoa (1990) were of the opinion that
the early concept of technology is not in line with a strand of available literatures on
international technology transfer which contend that “technology is conceived as
firm-specific information concerning the characteristics and performance properties
of the production process and product design”. They additionally contend that the
process of production and/or technology operation is inserted in the equipment or the
mechanism to produce a determined product. On the other perspective, the design of
the product or technology part of it is that which is observed in the finished product.
Pavitt (1985), came up with the suggestion that technology is a differentiated
knowledge mainly of specific application, tacit, in many cases uncodified and
extensively cumulative within firms. Therefore, based on above discussions,
technology is conceived as the firm’s ‘intangible assets’ or ‘firm-specific’ which
creates the basis of a firm’s competitiveness and is generally release under special
condition (Dunning, 1981).
According to Tihanyi and Roath (2002) technology includes such information which
is not easy to reproduce and transfer. Based on their views, technology is regarded
as “tacit knowledge or firm-specific, secrets or knowledge known by one
organization”. Technology as the precious treasure of any firm and it is built in the
firm’s schedules It is by no means easy to transfer that treasure due to the delicate
process of learning and exorbitant expenses related with transferring tacit knowledge
(Rodasevic,1999). Valuable knowledge of technology which is the precious treasure
of the firm cannot be easily transferred from one firm to the other due to the
technological learning process which is needed to assimilate and internalized the
transferred technology. According Rosenberg and Frischtak (1985) regarded
technology as firm-specific information about characteristics and parameters of
performance of processes of production and designs of the product; therefore,
technology is tacit and cumulative in its nature.
12
Public service
The definition of any term depends on the way it is used and understood in practice,
and so the process of understanding what a “public service” is must begin with an
examination of its use. According to Spiker (2009), Public service can be defined in
four ways which are; policy based; providing services to the public; acts of a trust
and are redistributive. These absolutely operate differently from profit oriented
production. When the United Kingdom Cabinet Office published its review of public
service reform, it did not explain directly what a “public service” is, but it did claim:
“we have restored our nation’s pride in our public services and they are more firmly
than ever part of the fabric of British national life. Some of our public services have
done even better. Our top schools, hospitals, universities, and police forces – as well
as our armed forces - are admired around the world. But we should also not shy away
from the fact that in some places public services are still not good enough” (Cabinet
Office, 2008, p 5). There is clarity of what constitute public services: which are
health, education, policing and defense.
To add on what constitute of public services, other areas of income maintenance,
social housing, family and community services are included (HM Government,
2007). It is evidently correct that the term “public services” is typically applied to;
Activities of public domain by government, such as policing and public health;
Activities done for the benefit of the public, like public service broadcasting or
Rubbish collection; and
‘Social services’, like medical care, housing, education and social care.
This definition might be regarded to be based on function, but public services cannot
be identified simply in terms of the things they do. Services like energy supply,
medical care or transport can be public services, but they can also be commercial
activities. Some public services deliver things that might, in other circumstances,
be considered to be part of industrial production - communications, roads, or water.
Government support for industry or agriculture is not commonly thought of in terms
13
of public service, but it could be: crop insurance has been treated in some Southern
European countries as a form of social security.
The term “public service” is used not just descriptively, but normatively. Saying that
something is a public service makes a moral claim about the way that organizations
should behave. So, for example, there have been claims that “public services” might
include:
Post Offices: “Britain is a place where the Post Office cannot be understood
merely as a business seeking profits: it should be understood like sanitation or
public parks or the NHS, which are things that make life livable and which are
maintained for the public good. We are happy to pay for them, both at the counter
and via the tax system, but they must at all costs be understood as services.”
(O’Hagan, 2008)
Banking: “The Canadian banking system ... has always been considered as a
public service.” (Canadian Parliament, 1998)
Public telephones: “This phone box is needed in case of emergency and regarded
as an important public service” (Waverley Council, 2008); or
Pharmacies: “Is the pharmacy a public service? The answer to this question is:
yes! And how could it be otherwise?” (Hibbs, 2007)
A clutch of books with “public service” in the title either assume we know (such as
Common, Flynn, Mellon, 1992; Pollitt, 1993; Lawton, McKevitt, 1996), or take it
that discussion of public services is equivalent to the role of the public sector
(Willocks, Harrow, 1992; Farnham, Horton, 1996). The very fact that they are using
the term so prominently implies that there is something different, distinctive and
recognizable about the term.
Traffic Enforcement Management Information system – Is a system used by
Tanzania Police Force under Traffic Police Department in collaboration with other
Government agencies such as SUMATRA, Tanzania Insurance Regulatory
Authority (TIRA), Tanzania Revenue Authority (TRA) and MAXCOM AFRICA as

14
the controller of the system. The role of this system is to manage, control and
monitoring of traffic offences electronically.
Using the system, one can separate the traffic offences according to who is
responsible, that is to say the offences caused by a personal (driver liabilities or
personal liabilities) and those which are a result of Motor vehicle defective (owner’s
liabilities). For example, driving without fasting seat belt, ignoring traffic lights and
driving beyond the allowed speed limits are driver’s offence and they have direct
effect to his/her driving license. When a person (Driver) commits traffic offence
his/her particulars are entered in the machine (system) known as Point of sale
machine. Particulars include driving license number, amount of defaulting fine,
motor vehicle registration number, offence and Law (section) contravened and the
name of the Police Officer who issued the notification to the said driver or motor
vehicle including his/her force number. Then the driver will be handled with a
printout with payment reference number to deposit the prescribed fine.
The above mentioned stakeholders have the access to the system according to their
needs, but TPF is the major user of the system and the main executors of the system,
SUMATRA shows the registration of motor vehicle registered for commercial
purpose including the assigned route in the system, when the motor vehicle commits
traffic offence the system shows the particulars of the motor vehicle and the driver
concerned and the status of registration of the motor vehicle.
TIRA deals with insurance matters, uses the system to make sure all information
concerning insurance in relation to the said motor vehicle are available and can be
accessed in the system by different users of the system.
TRA is the one mandated with issuance of driving license and motor vehicle
registration. The TMS system is integrated with TRA system to the extent that one
can have the particulars pertaining registration of motor vehicle or driving license
from TRA through TMS System by finger tips. In that way, one can have additional
information of the Motor vehicle such as chassis and engine numbers.

15
MAXCOM AFRICA is a company contracted by TPF with a duty to collect fine
associate with traffic offence in an efficient manner. The company uses the system
to collect government revenue from traffic notification (fine) by integrating all
mobile phone networks including Banks to create several options upon which a
person paying notification can use to pay his/her fine. As a result, the system creates
flexible and efficient way on payment of government revenue.
Automatic Plate Number Recognition Camera (APNR): These cameras have
been connected to the computers (laptop) installed with the TMS loaded with
information from TIRA, TRA and SUMATRA. Once the motor vehicle in motion it
is captured using these cameras in few minutes all information concerned the said
motor vehicle including the amount that motor vehicle is owed are sent to the laptop.
The TMS System has made the inspection of those owed motor vehicle to be done
in smooth and easiest way.
Tanzania Driving License
There were a number of reasons that caused Tanzania Police force start using
technology. Before 1st October, 2010 every procedure was done manually fro
attaining the driving license up to the type of license issued. Some of the reasons that
were major were the increase of people who own motor vehicles and the people who
would like to acquire license. The procedure used at that particular time made it a
very tiring procedure to both the service providers and the general public, another
main reason was it was hard to control the drivers who abuse the law. With all those
reason it led to an introduction of an electronic system.
This system was initiated on 1st day of October 2010, whereby there was a shift from
the manual provision of driving license to the current electronic system. This system
can accomplish a number of issues such as: -
Getting a total number of people who owns license in a second.

16
It also helped to have the fingerprints of all drivers, we all know that the
every single person has her/his own prints that cannot be like another person.
A driver’s mobile number, photo is saved into the system thus easy to track
this person wherever he is.
A person can be confiscated his license online without being apprehended.
There is a system of points to which when a person violates a number of
traffic laws, he is confiscated his license and is supposed to go back to
college before attaining another license.
With the past procedure it was not easy to accomplish all those issues as after a
person receives his license it’s not easy to track him down unless apprehended. With
the current system every license has its number to which when a person is charged
his license number is recorded online.
In order for a person to acquire a driving license he should have the following
qualification: -
1. Must have attended any recognized driving college and awarded a certificate
2. Must have more than 18 years of age for motor vehicles and 16 years of
age onwards for motorcycles
3. Must have a learner/provisional driving license
4. Must undergo test and pay test fee
5. Must have an eye test certificate
6. Must have applied to Traffic police for testing
7. Must go to traffic police with a car for testing
There are a number of procedure that has to be followed before a person is awarded
with a driving license. This system is run by two government entities which are TRA
and TPF under its department of traffic. The following are the procedure one has to
go through so that he/she can acquire a driving license: -

17
A person has to get a Tax Identification Number (TIN) that is produced by
TRA
After getting a TIN, a person is taken through biometric procedures that
include taking a passport photograph, fingerprints and signing into the system
electronically.
He/she is issued a provision driving license which remains valid for three
months, within which a person is required to attend a driving school. After
completing the course the applicant is supposed to be tested by the Traffic
department. This test is done both theoretically and practically.
Finally, this person is issued with a driving license that lasts three years,
specifying the driving license class.
There are about seven classes of driving license. Each class is divided into sub-
classes. Hereunder are driving license classes and their respective sub-classes: -
1. Class A
a. A - A person who is qualified for this driving license is allowed to drive
a motorcycle which has more than 125cc or 230kg.
b. A1 – A person who is qualified for this driving license is allowed to drive
a motor cycle with less than 125cc or 230kg
c. A2 – a person holding this license is qualified to drive a tricycle or
quadracycle.
d. A3 – a person holding this license is allowed to drive a motorcycle of less
than 50cc
2. Class B – a person who is qualified for this license is allowed to drive all motor
vehicles except motorcycles, commercial vehicles, heavy duty and public service
motor vehicle
3. Class C – a person is allowed to drive public service vehicles of sitting capacity
of thirty passengers or more and trailers of more than 750kg
a. C1- public service vehicles of fifteen passengers or less than thirty
passengers, also a trailer of less than 750kg.
18
b. C2 – public service vehicles seating capacity of four people or less than
fifteen passengers.
c. C3 – public service vehicle seating capacity of less than four people
4. Class D – all type of motor vehicles except motorcycles, heavy duty and public
service vehicles.
5. Class E – all motor vehicle except motorcycles and public service vehicles
6. Class F – a person is allowed to drive track laying vehicles
7. Class G – a person is allowed to drive farm or mine vehicles.
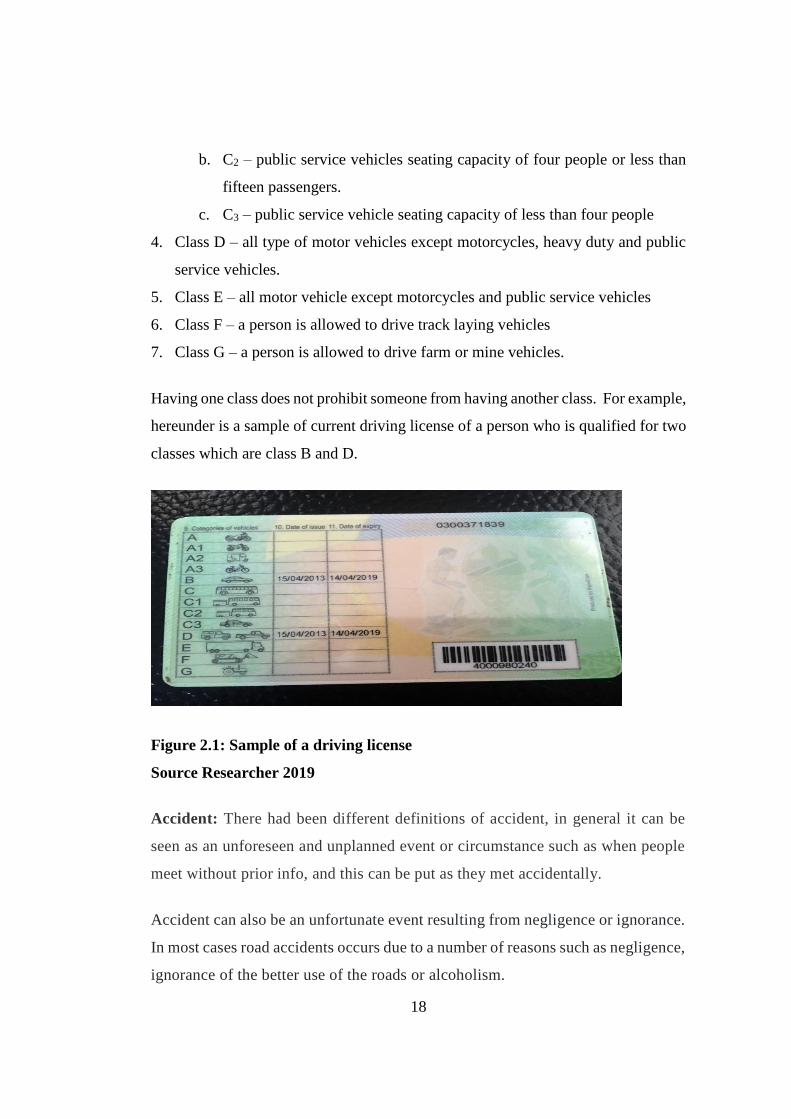
Having one class does not prohibit someone from having another class. For example,
hereunder is a sample of current driving license of a person who is qualified for two
classes which are class B and D.
Figure 2.1: Sample of a driving license
Source Researcher 2019
Accident: There had been different definitions of accident, in general it can be
seen as an unforeseen and unplanned event or circumstance such as when people
meet without prior info, and this can be put as they met accidentally.
Accident can also be an unfortunate event resulting from negligence or ignorance.
In most cases road accidents occurs due to a number of reasons such as negligence,
ignorance of the better use of the roads or alcoholism.

19
Accident in a law perspective is defined as unexpected event happening and cause
bodily injury which is not due to any faulty or misconduct on the part of the person
injured but for which legal relief may be sought. (http://www.meriam-
webster.com/dictionary/accident )
According to Wikipedia there a different types of accidents such as:
Physical and nonphysical accidents
accidents that such as motor vehicle collision of fall, a person hitting his leg
on a bed corner, colliding with a person these are all physical accidents and
usually tend to leave a person hurting physically or loss of life, or wreckage
of a property. . While the non physical accidents are such as unintentionally
revealing something you were not supposed to reveal, be it a secret or saying
something that you didn’t intend to, or forgetting an important appointment.
Accident by Activity
These are accidents occurring while executing a certain activity or duty, or
an accident that arise while performing a certain duty. According to the
Labour Organization (ILO) more than 337 million accidents happen when
people are executing their daily duties each year. Together with occupation
diseases it results in 2.3million deaths each year. In a simple term they are
known as work accidents.
On a Daily News newspaper published on 20th February, 2019 there is an article with
the heading ‘Tanzania in a steady progress towards road fatalities reduction’. It is
stated that although Tanzanian roads are ranked among the deadliest in the world
with the latest WHO Global Road safety status report testifying to that fact. The
country is apparently making steady progress in the reduction of road fatalities.
According to the report released by WHO last December, based its findings from the
2016 research which used official traffic police statistics showed that there were a

20
total number of 3,256 deaths. It was therefore concluded that the rate of a person
dying due to road accident in Tanzania is 29.2 deaths per 100,000 people.
The head of Legal department at the Traffic Police Headquarters, ASP DEUS
SOKONI stated that the Tanzania road safety measures has improved as the country
continues to record a reduction of accidents throughout the country, both fatal and
normal accidents.
Some of the measures taken to help the reduction of accidents throughout the country
are such as; the introduction of speed cameras on highway, there is always a little
negligence on drivers especially those who drive on long distances, these cameras
have helped control them hence reduce a lot of accidents.
There are some of the operations done by the Tanzania Polce force such as operation
known as ‘NYAKUA NYAKUA’ to which all road offenders are arrested and
instead of being fines are taken into custody and later taken to court, this operation
received a lot of backing up from different people and suggestions that it should be
sustained. This operation has helped a lot too in reducing road accidents.
More of the causes of road accidents and fatalities are mentioned and explained here
under: -
Speed: speed is said to be the main reason to causes of crashes. In Tanzania
there are only three general limits as stipulated by the law. Section 51 of
Road Traffic Act of 1973states that; the speed limit for vehicles with more
than 3.5 tones should not exceed the speed limit of 80km/hr, for truck and
buses the general speed limit should not exceed 80km/hr with exception of
urban roads. On built – up areas the speed should not exceed 50km/hr and
occasionally 60km/hr.
Drink – driving: Drinking is another spike in road safety stakeholders in the
country. Apart from introducing a number of measures such as the

21
instrument that measures the level of alcohol in a driver there should be a
number of both formal and informal education on the effects of drinking and
driving. According to RTA the level of alcohol that a person is allowed to
drink and drive is 0.0g/dl to 0.05/dl.
Helmet use: - It was estimated that 22 percent of fatalities were caused by
three wheelers in the country, having the deadliest fatal and injuries from
motorcycle riders. And the main reason to such deaths being the injuries
inflicted on them on heads after accidents. One thing that cannot be
emphasized is the use of helmet to motorcycle passengers as RTA provides
mandatory helmet wearing to riders only.
Seatbelt wearing: people tend to wear seat belts only when are seating at
the front, most times the passengers at the back do not fasten their belts, upon
accident its easy for them o face injuries and sometimes death as there is
nothing to hold them back.
Hereunder is the table showing number of deaths for the past six years that is from
2013 to 2018.
Table 2.1: Injuries and deaths for the past six years
Year Injuries Deaths Reduction Percentage
2013 20,680 4,002
2014 14,530 3,760 242 -6.5%
2015 9,383 3,468 292 -7.76%
2016 8,958 3,256 212 -6.1%
2017 5,489 2,581 675 -20.7%
2018 1,788 1,788 793 -31%
Source – Daily News (20th February, 2019)

22
Levy as defines by Collins dictionary is the sum of money collected by government
using its authority in form of tax or fines. A government demands this levy from
different people or organizations.
Tanzanian Police force has been collecting government levy indirectly due to
different activities performed within the force. Some of the activities that result into
collection of government are payments made for loss report, the amount paid is only
TZS 500 but the total amount collected countrywide is a huge amount as people tend
to lose a lot of things either accidentally or by negligence.
Another activity is the payment of license to own arms and ammunition, this depends
on the type of an arm that a person owns such as shotgun and rifles a person is
supposed to pay TZS 35,000.00 annually, while a person owning a pistol is supposed
to pay TZS 70,000.00 annually. If a person fails to pay for these fees then he/she
loses the validity of owning such an arm.
Another way a government receives levy through Tanzanian police force is via fines
issued to traffic offenders, year by year there had been an increase of motor vehicles
and drivers within the country, the increase of these motor vehicles using same roads
has increased traffic jam this has increases a good number of minor offenses when
people find an easy way out. For the minor offenses a person is issued with a ticket
that holds TZS 30,000.00. All these levy collected are used by the government to
provide for the public important services such as building hospital, schools,
constructing roads improving communication systems.
2.2 Theoretical review
Technology Acceptance Model (TAM)
The Technology Acceptance Model (TAM) is a system of information theory which
models how users appreciates and use a technology. The model implies that once
users are given gateway for a new technology, two distinctive factors motivate them
to make decisions on when and how they will use the technology. Two distinctive

23
factors have been identified as fundamental determinants of an individual’s appetite
to use a technology notably: perceived usefulness (PU), in which it reflects the extent
to which a person appreciates that using a specific system application, would
improve performance of his or her work. The perceived ease-of-use (PEOU) is the
extent at which an individual believes that by applying a specific system makes it to
be free from effort (Davis, 1989).
TAM theoretical model has been established to be a useful in assisting gaining
knowledge and explaining use behavior in the implementation of information
system. It has been empirically tested in many researches and the means used with
the model have established to be of quality and to yield reliable statistically results.,
Nonetheless, parsimony has been singled out as one of TAM’s strong point but also
a fundamental soft spot as it has narrow boundaries in explaining users’ behavior
appetite to adopt complicated mobile services Venkatesh et al. (2003). As a result of
the weaknesses, many authors have granted TAM with additional constructs. Mbogo
(2010) for example applied TAM and extended it to cover other areas of perceived
low cost, perceived ease of accessibility, perceived security, perceived satisfaction,
perceived convenience and perceived support to find out the success factors
attributable to use of online social media by business operators at micro and macro
levels in Kenya.
Tobbin (2011) created a model of adaptation of transferring money through online
media expanding TAM and DoI to find out the behavior of the consumer towards
online social media adaptation in Ghana. On the same footing, Bosire (2012)
engaged DOI alongside TAM to explain factors which created success of adaptation
of online media in Kenya. Odia (2012) also adapted TAM with additional factors
such as perceived security, perceived convenience and perceived trust to find out
factors affecting consumer appetite to use online media in Nigeria. Sayid, et al.
(2011), used TAM to examine online media appreciation in Somalia. In another
study, Omwansa (2012) used TAM together with technology task fit (TTF) on
modeling adaptation of online media by the low income earners in Kenya. Lule et

24
al. (2012) in their study carry out in Kenya used TAM and made extension to cover
factors such as perceived credibility and perceived self-efficacy to test the factors
which are influencing the adaptation of online media.
In Germany, Pousttchi and Wiedemann (2007) made a combination of TAM and
Task –technology fit to investigate acceptance by consumer of making payment
through online media Amin (2012) established the factors which determine bank
customers’ desire to use online media banking in Malaysia by engaging an extended
TAM model.
Source: Google 2019
Figure 2.2: Technology Acceptance Model
Diffusion of Innovation Theory (DOI)
Rogers’ (1983) Diffusion of Innovation (DOI) is another theory which has been used
to describe acceptance of information systems. Sometimes is called the Innovation
Diffusion Theory (IDT).
Innovation is defined as a practice, idea or object while diffusion is the way by which
perceived new technology or innovation is communicated through certain means
over time among individuals of a certain social system (Rogers, 1995). DOI
comprises five substantial innovation parameters: compatibility, relative advantage,
complexity, Observability and Triability. Innovation diffusion is built on the

25
foundation with the understanding that adoption of an innovation engages the
spontaneous or planned spread of new ideas. Rogers made a definition of innovation
as: “... an idea, practice, or object that is perceived as new.” (Rogers 1995)
Relative advantage is defined as the extent at which the innovation is viewed as being
better than the existing way of undertaking the same task. It is believed in the theory
that relative advantage has a positive influence on customers’ behavior.
Compatibility is defined as the extent at which adopting the innovation is in line with
what is being done by people, needs, existing values and experiences. Complexity is
defined as the extent at which an innovation is perceived as relatively complicated
to understand and make of use it. Triability is defined as the extent at which an
innovation may be tested on a limited basis before deciding an adoption (or
rejection). Observability is defined as the extent at which the results of an innovation
are tangible and visible to others. Rogers (1995), stresses that it is the perception of
change which is important; if the knowledge seems new to the potential adopter then
it should be regarded to be an innovation.
Rogers approaches the concept of innovation diffusion by putting into place a variety
of studied cases on topics of: controlling scurvy in the British Navy, Iowa diffusion
of hybrid corn, news diffusion, third world bottle feeding of babies, the way
refrigerator got its hum, Xerox PARC and Apple computer, black music in white
America, Minitel in France, the non-diffusion of the Dvorak keyboard and causes of
the Irish potato famine. The underlying concern in all the above studies is the finding
factors which affect the ease and magnitude at which an innovation is adopted, or
which hider its complete adoptability.
The work by Tobbin (2011) combining DOI and TAM to investigate behavior of
consumer related to online media adaptation in Ghana. Similarly, Bosire (2012)
implemented DOI in combination with TAM to elaborate factors regarded as
fundamental drivers of technology adaptation making gateway to the success of
adaptation of online media in Kenya. Abdelghani and Aziz (2013) applied DOI to
find out the appetite of Moroccan customers to adopt money transfer through online

26
media. In another study, Shambare (2011, utilized DoI framework to investigate
consumers’ perceptions in the banking sector of online banking attributes in South
Africa. Similarly, Brown et al. (2003) adopted DOI to examine the predictors of
online banking adaptation in South Africa.
In diffusion theory the presence of an innovation is regarded as cause of uncertainty
in the mindsets of envisaged adopters (Berlyne 1962), and uncertainty is the basis of
lack of information and predictability. Diffusion is regarded as the process of
exchange of information amongst individuals of a communicating social network
instigated by the desire to reduce uncertainty (Rogers 1995). Uncertainty can be
regarded as the level to which a set of alternatives are perceived in with perception
to the occurrence of some particular events, along with the respective probabilities
of every of these alternatives happening. Those involved in weighing up adoption of
the innovation are encouraged to find information to minimize this uncertainty
(Rogers 1995). Diffusion theory presents that a information is embodied in
technological innovation and so its adoption helps to keep uncertainty at the low
level. In explaining that, Rogers gave example of innovation of solar panels as
cutting down uncertainty over the costs of energy in future and energy supply
reliability. The new concepts upon which an innovation is developed are
communicated from time to time, through different ways of communication systems,
among the individuals’ social system.
Therefore, there are four fundamental elements of any theory of innovation diffusion:
the passage of time, the nature of the communication channels, characteristic of the
innovation itself and the social system in which the innovation diffuses (Rogers
1995). Characteristics of the innovation by themselves Rogers puts the case down
that the attributes and characteristics of the innovation itself are critical in
determining the way of its diffusion and the speed of its adoption. Making reference
from the work of Thomas and Znaniecki (1927) he underscores that it is what
anticipated adopters conceive to be the attributes of an innovation what matters. In
the case of innovation of technology and greatly all innovations studied fit into this

27
category. Rogers gave accounts of two components to be considered: a hardware
aspect constituting of technology embodied in a tool as a physical object, and an
aspect of tool’s information base called a software. An innovation like a camera has
a hardware component: the camera itself, and the film as an aspect of software. Other
examples include videotapes and VCRs, compact disc players and CDs, as well as
computers and their programs. Rogers urges that despite the component of software
of a technology in some cases not easy to observe, as in the case for example of a
new washing machine, technology mainly represents a combination of software and
hardware. He appreciates however, that few innovations have a software component
only. New religious or political ideologies as well as the concept of quality assurance
are ‘idea-only’ innovations of that category. Ideally innovations are much
cumbersome to observe, and Rogers concludes that they are in many cases less often
researched on by scholars of diffusion. Rogers accounts for five fundamental
characteristics of an innovation which, he suggests, affect its diffusion:
• Relative advantage. This is the level on which an innovation is perceived being
better than the idea it overtakes. Relative advantage is largely explained in form of
social prestige, economic profitability or other benefits of the same nature. Rogers
gives the opinion that an innovation’s relative advantage is exponentially related to
its speed of adoption.
Compatibility, or the level on which an innovation is perceived by likely adopters
as being consistent with their current values and experiences of the past.
Compatibility with what is existing makes the new idea seem more familiar, less
uncertain and assists in giving it the meaning. This is important because “the rate
of adoption of a new idea is affected by the old idea that it supersedes” (Rogers
1995:227). Rogers assert that the perceived compatibility of an innovation is
largely related to its level of adoption.
Complexity, or the level at which an innovation is perceived as hard to
understand and make use. Rogers assert that the more complex the innovation is,
the less likely it is to be adopted quickly. In support of this argument Rogers,

28
Daley and Wu (1980) expressed that in the late 1970s, a time frame of six to eight
weeks of severe frustration characterized the adoption of a new computer for
home use.
Triability is the level at which a specific innovation may be subjected to few
selected experimentations. Rogers’ research reveals that if a potential adopter is
capable to ‘play’ with the innovation well before facing an adoption decision,
then adoption is more likely than ever before.
Observability. The more the outcome of an innovation is visible to others, the
more likely the innovation is to be adopted. Rogers explains that there is high
Observability in public places and in the media as an explanation for the quick
take-up of video games such as Nintendo, and of mobile telephones. Potential
adopter attributes are also seen as an important ingredient in the adoption of an
innovation. Rogers keeps confidence that these attributes include level of
education, social status, amount of innovativeness and degree of
cosmopolitanism. A slightly different slant on adoption is suggested by
Abrahamson and Rosenkopf (1993) who explain what they call the ‘bandwagon
effect’. They asserts that there are moments when people or organizations adopt
innovations, not simply because of their technical properties, but because of the
large number of others that have made the adoption already. The bandwagon
effect would appear to be proportionate to the ‘Observability’ characteristics of
an innovation discussed hereinbefore. O’Neill et al. (1998) make use of this
implication in explanation of observed trends of diffusion of strategies in
business cutting across several commercial organizations.

29
Source : Google 2019
Figure 2.3: Diffusion of Innovation Model
There are five known adopter categories while most of them fall under the middle
categories, it is important to know the characteristics of the target population. Here
below are different strategies which appear in different adopter categories: -
Innovators –these are the people who desire to try new innovations every time.
They are always anxious to know new ideas, they offer to take risks and are
always the first on the line to initiate new ideas.
Early adopters – this is the group of people who enjoy changes, they fit into
opinion leaders, they cherish leadership roles and appreciate the change
opportunities, they know there is a desire for change and are they comfortable to
in adopting new ideas.
Early majority – these are rarely leaders but they desire changes, they adopt
changes ahead of average person. All they require is to see evidence that the
innovation performs before they adopt it.

30
Late Majority – These are the people who are hesitant and doubtful of changes.
They will only adopt innovation after having seen it has been tried by the
majority and that it gives positive results. These are not risk takers.
Laggards – these people are conservative people by their nature. They are very
pessimistic of changes and they are the hardest to accept change. The only way
they will abide to changes is through high pressure from people in other adopter
groups.
Figure 2.4: Diffusion of Innovation Acceptance model
Source –Google 2019
Unified Technology Acceptance User Theory (UTAUT)
The Unified Technology Acceptance user theory (UTAUT) suggested by Venkatesh
et al., 2003 was developed through a review and amalgamation of eight IT adaptation
theories: TAM, theory of reasoned action, the motivational model, theory of planned
behavior/technology acceptance model, innovation diffusion theory, model of PC
utilization, and social cognitive theory (Vankatesh et al, 2003).
The UTAUT focus to explain user intent to use an IS and subsequent usage behavior.
The theory proposes that four key constructs (performance expectancy; refers to the
level at which an individual believes that using a system will assist him or her achieve

31
good results on the task; effort expectancy: refers to the level at which the ease
associated with the use of the system; social influence: refers to the level at which an
individual perceives that important others believe he or she should use the new
system: and facilitating conditions; refers to the level at which an individual believes
that technical infrastructure and organizational exists to support use of the system
are direct determinants of usage intention and behavior (Venkatesh et al, 2003).
Gender, experience, age and voluntariness of use are posited to mitigate the impact
of the four key constructs usage intention and behavior (Venkatesh et al, 2003).
However, UTAUT is not perfect. To apply UTAUT in some IT applications such as
online transaction, revisions and modification are needed as recommended by
Venkatesh et, al (2003).

32
Source: - Venkatesh et al 2003
Figure 2.5: UTAUT Model
2.3 Empirical framework
E-government in Tanzania
The government of Tanzania is continually committed to implementing e-
Government. As seen in the National ICT policy 2003 (URT, 2003) that is highly
insistence on the use of ICT in all public sector offices for transformation of the the
public sector services provision through ICT. An evaluation of websites usage in
Tanzania using the World Bank’s e-government maturity model is instructive.
Yonazi (2010) revealed that the website evolution stage is between interactive and
publish stages. During 2004, the President’s Office - Public Service Management
(PO-PSM) was entrusted with power to formulate e-government policy and follow
up its implementations (Shame 2009). Another substantial development is on local

33
content and the sharing knowledge. There has been an upward trends in the number
of local portals and websites. Tanzania in his put in place the agenda, the e-
government is now one of the ten priority areas of the National ICT Policy of 2003
(URT 2003).
The UN (2012) reports upward trends in the presence of government institutions with
websites available online. Further, several e-Government related initiatives have
been put into practice. They cover implementation of government networks,
awareness raising, capacity building, service transformation and others. Of recent
several government Institutions have entrenched themselves in to transforming the
provision of their services into digital formats. A significant achievement has been
made regarding online presence. For instance, The Tanzania National Electricity
Corporation (TANESCO) has commenced allowing its customers to purchase
electricity credits using their mobile phones (TANESCO, 2012). The Tanzania
Commission for Universities (TCU) has a gateway for online application and
response to higher learning education through its website (http://www.tcu.go.tz/).
The National Examinations Council of Tanzania (NECTA) the government
department is responsible for formulating, conducting and regulating examinations
in Tanzania. NECTA deals with all examinations other than high learning. Since
May 2008; NECTA deployed e-government to realize examination results. It slowly
is minimizing the traditional channels (newspapers, fax, phone, and post), the
website (www.necta.go.tz), and email ([email protected]). TRA is a central
government revenue body responsible for assessing and collecting specified revenue,
and administering and enforcing the tax related to government revenue (URT, 2006).
TRA is entrusted to conduct its revenue correction business in the Tanzania
mainland. It integrated Tax Administration System, Computerized Motor Vehicle
Registration system, radio and data communication infrastructure, and the TRA
website (www.tra.go.tz) (TRA, 2006).
The Ministry of Finance and Economic Affairs (MoFEA) is a Tanzania government
union ministry entrusted with the mandate of the overall management of government

34
revenue and expenditure. The ministry also provides professional advice to the
government on financial and economic affairs. In recent years, the Ministry has
benefited from the Public Sector Reform Program (PSRP) in which E government is
a key agenda (PoPSM, 2006). These include installation of telecommunications
networks, implementation of various inter and intra ministerial systems, and the
creation of a website (www.mof.go.tz). The UN report (2012), Tanzania has made
some significant progress in e-government. For instance, in 2010, the world average
e-readiness index was 0.4406 while that of Tanzania was 0.2926. In 2012 the
country’s e-readiness index is 0.3311 at 0.4882 world average.
Road traffic control systems
In his study about impacts of traffic calming on speed, safety and traffic noise in
residential neighborhoods of New Zealand, Daniel (2012) noted that speed humps
and raised angled slow points were most used to control speed related offences on
roads. In a selected 21 residential streets in Christchurch city, traffic calming
measures were already installed with speed humps, speed tables, angled slaw points
and narrowing’s. Some streets had speed photograph devices, ProLaser III light
detection and LIDAR speed guns all used to detect road traffic offences and mitigate
possible effects.
Road crashes represent a major social cost to most societies and their management
has thus been a high priority (Leggett, 1994) Efforts of in management have been at
the levels of both prevention and cure. That despite the police involvement, causes
of some road crushes cannot be solely blamed as crimes but for those causes that are
attached to breaking the laws can be managed. Studies in Australia show that
deployment of traffic police officers by road sides in order to change the motorists
‘road environment in a permanent way and to reduce traffic offenders. In evaluating
the outcomes from panel data of then technologies of using Breathalyzers and
Victorian speed cameras, Leggatt (1994) notes a reduction in road accidents
Arvidsson (2011), on Traffic violations and insurance data in Stockholm Sweden
notes that traffic violations certainly signal risky driving behavior but the analysis to

35
link traffic violations, individual and vehicle characteristics was hampered by the
difficulty of gaining access to appropriate disaggregate data. Countries’ data set
comprise of insurance policies of all the large insurance companies in Sweden. They
also comprise of information on fines and convictions for traffic violations. The
probability of getting speeding tickets increases if annual mileage increases, while
traffic violations and convictions are more likely for individuals with lower annual
mileage. This implies that the majority of drivers with fines and convictions for
traffic violations drive in the lower kilometer classes. Owners of older vehicles are
more likely to be fined and convicted for traffic offences, but less likely get speeding
tickets. Violations further increase the probability of reporting an at-fault claim.
Use of technology in traffic control
Sudesh et al (2001) in a study of technology usage in fine collection in India, smart
cards was central since it is classified by a chip that portably carries data. The
issuance of smart card in driving licenses is one way of maintaining non-exhaustive
schematic data and information to the authority. In the course therefore of renewals,
issue of duplicates against damage or loss, issue of international driving permit(IDP)
are all parallel to being crossed checked for pending fines for driving offences
Advanced traffic management systems in city traffic give possibility to give priority
of passage to selected type of users, such as public transport, VIP users, and
emergency services. In Republic of Croatia at present time there is no existent
developed adaptive algorithms that can give priority to vehicles of Emergency
services through the intersection (Mlinaric, 2016). Biggest problem in the Croatian
metropolis, Zagreb, is that there is no existent city traffic central management center.
Current data exchange methods are manual. Traffic management in city traffic light
adaptive management is only implemented locally on some intersections. A good
priority to emergency vehicles can be given only after adaptation to new technologies
and data infrastructure
According to Mlinaric (2016), there is a wide perception of the operation of over-
roadway and in-roadway traffic flow sensors that are largely in use currently. Those

36
sensors are in the form of magnetometers, inductive-loop detectors, passive infrared
sensors, microwave radar sensors, laser radar sensors, ultrasonic sensors, video
image processors and passive acoustic sensors. Similar applications comprises
freeway ramp metering, traffic signal control, incident detection, freeway mainline
control and gathering of volume of vehicles and classification data to achieve the
State and Federal reporting requirements. These devices are either installed in,
below, or above the roadway (Mlinaric, 2016)
The system controlling traffic in Malaysia has not essentially been appropriately
equipped with the method when there is emergency case in place (Hashim et al,
2013). That is the main reason of failure of ambulances and other emergency vehicles
to negotiate and arrive in time to destinations due to traffic jam. It comes a point,
especially at the traffic lights whereby other vehicles have to give way to ambulances
and other emergency vehicles. It becomes cumbersome in those kind of situations
and eventually causes a delay of time and may turn emergency case worse than
expected. In some cases where the emergency vehicles have to override red light
signals at traffic lights collisions with other vehicles driving from other direction
might occur These challenges facing ambulances and other emergency vehicles with
the use of this traffic light control system based on radio frequency they can be
avoided. Hashim et al (2013) gives an additional opinion that traffic light system
design by Levi L. Rose is used only for emergency vehicles. Sensors are used in
transmitting signals which are installed in every emergency vehicle to the receiver
positioned at every traffic light intersection. Therefore, in this way a special route is
created for emergency vehicle from other vehicles to reach the destination. Other
invention, the emergency vehicle is fitted with the transmitter which transmits a
signal to the receivers fixed at the traffic lights whenever it is on emergency mode.
Then the master controller processes the signal received which in turn rearranges
automatically the sequence of the traffic light to control the traffic flow at the
intersection which taken by the emergency vehicle. Additionally, the display system
indicates whether the emergency vehicle has passed through the intersection or not.

37
Road Traffic systems in Tanzania
Msese A.J (2015) in his study on effects of road safety measures in reducing road
traffic accidents in Dar Es Salaam, asserts that the occurrence of road accidents
cannot be explained by violations of road safety measures alone but are it can be
linked to the available recourses and capacity of the national and local authorities.
Among the conditions mentioned that lead to road offences are a wrong sense of
driving involving drunk driving, over speeding, bypassing traffic lights, lane
violations and not fastening of seat belts. Among the recommendations, involves the
intensive use of telephones to report on drivers who do violate traffic laws
Haji (2017) noted that Traffic police records offences in road traffic from the side of
the road, they then stop the offenders and sanction them immediately of their
offences. The traffic police are responsible for apprehending traffic violators and
assesses the risk levels of certain behaviors of road users. Haji (2017) also quotes
that, “They are responsible for safety, appropriate punishment for traffic violators
and the perceived risk level of certain behaviors by road users (Magableh et al.,
2014)”. He also asserts that offenders of the traffic rules are subject to various
penalties such as (not by order of priority); confiscation of their vehicles, fines,
mandatory participation in rehabilitation and penalty points (temporary) driving
license suspensions, and mandatory participation in rehabilitation. Monetary
penalties are the commonly fines sanctioned by officers of traffic police or
administrative officer. The extent of monetary penalties is usually normative, it is
either a subject of provisions of special legislative or prescribed by law, as part of a
road traffic Act (ETSC, 2011).
In his reference, HAJI notes a record of out of every ten fines, eight of them in
Mauritius were due to exceeding limit of the speed which was set at the maximum
of 25 kilometers per hour. The use of a hand held or telephone handset accounted to
some 7% of the payments effected followed by 6% due to failing to wear seat belt
when driving a motor vehicle (Republic of Mauritius, 2013). Most offences of traffic
rules in Tanzania attract a fine of TZS 30,000. A total of TZS 19,504,015,000 was

38
collected in 2015 by the traffic police compared to TZS 16,633,018,000 in 2014 in
the form of notification fines.

39
2.4 Conceptual framework
The conceptual framework is a set of ideas and principles that are derived from
relevant sources of inquiry that are used to create a structure of academic
presentations (Kombo et al, 2006). In this study variables concerning technology and
road traffic management, its conceptual framework is grounded on the specific
objectives in order to provide a lead to data collection
Source: Researcher 2019
Figure 2:6 Conceptual framework
2.5 Research gap
A section of literature has been reviewed quite in-depth in order to establish so far
what has been studied and revealed concerning the study variables that include the
impact of technology in public service delivery but main focus being on road traffic
management. Technology has been defined extensively right through several stages
of technology revolution and technology transfer. Public service has also been
explained adversely and the linkage with good governance has been widely covered
however, the impact of technology upon providing public service delivery has never
been put into consideration but rather it has been limited to E-governance and a few
elements of road traffic.
Technology
Road accident reduction
Driving license provision
Levy collection

40
The study therefore comes in timely to effect the study on the gaps noted. No such
studies have covered the impact of technology in public service delivery focusing on
a crucial area like road traffic in a scenario of a developing country like Tanzania to
which road transport is the main means of transport for business, sick people,
children, VIPs and public servants themselves. Literary no such studies as well have
been conducted on the subject understudy particularly in Dar Es Salaam or
Kinondoni district.

41
CHAPTER THREE
RESEARCH METHODOLOGY
3.0 Introduction
Research methodology relates to the method the researcher uses to conduct the
research, the type, data sources, collection procedures and analysis. This chapter
therefore provides presents the research design, sampling design, data collection and
analysis deployed in the study.
3.1 Research design
Research design is the arrangement for the conditions of collection and analysis of
data in a manner that aims to combine the relevance of the research purpose with
economy in procedure (Kothari, 2004). A number of researchers have argued that
research always uses quantitative and qualitative research designs. Cateora and
Graham (2005) recommended using both qualitative and quantitative research
designs for gaining interesting knowledge about the market or the product.
The study used a case study design to which both qualitative and quantitative
methods were used. The study was also explanatory in its nature as it related the
Impact of Technology in Public services delivery with focus on the traffic Police at
Kinondoni district.
3.2 Study (Geographical) Area
This study was conducted in Dar Es Salaam region at Kinondoni district due to
limited resources and time to carry out the study in wider geographical area.
3.3 Sources of Data
This study collected both Primary and secondary data. Both primary and secondary
data were collected from Tanzania Police Force and TRA. From TPF data collected
were the number of accidents occurred before and after technology, levy collected
before and after technology and from TRA data collected were license produced
before and after collected within Kinondoni district.

42
3.4 Sample size
The sample size for this study was limited to four people who were interviewed
though unstructured so as to find out the ‘know-how’ of the technology in question
and who were the once to provide data in question.
3.5 Data Collection
Secondary data were collected from TPF and TRA. Primary data were collected
through unstructured interviews with the people operating the systems and the
specific data of operation.
3.6 Data Analysis
The data analysis was done through SPSS and Excel. The case study approach was
deployed in order to provide in depth findings on the impact of technology on public
service delivery especially at Kinondoni district under traffic department. The
results of the case studies and interviews are presented in chapter four, chapter five
comprises the interpretation of the result while recommendations and the conclusion
are presented in chapter six.
3.7 Ethical consideration
The researcher observed confidentiality especially from the information given on the
interviews. The respondent’s information was not passed to a third party. The
respondent’s names do not appear on the interview guide. The respondents’ consent
were sought before administering interviews. The researcher did personal
identification before the respondents and explained the mission of the research.
According to Kothari (2004) respondents are willing to provide accurate and
required information if they are approached friendly as it convinces them that such
collected information is legitimately for research purpose only. With that fact in
mind, the researcher ensured that the use of a friendly way in asking the related
questions in order to create required good atmosphere for respondents to answer
freely with trust. All respondents were treated with sufficient respect.

43
CHAPTER FOUR
RESEARCH FINDINGS
4.0 Introduction
This chapter discusses the research findings, data analysis and the interpretations of
the findings as of the objectives of the study. It also presents the data analysis and
interpretation whereby the researcher carried out preliminary data analysis and
inferential data analysis based on the objectives of the study.
4.1 Data analysis and Interpretations.
The research data collected were analyzed using Excel software and SPSS.
Histograms were drawn to show the impact of technology before and after its
implementation. Statistical Package for Social Science (SPSS) software was used for
descriptive and inferential statistics. Preliminary analysis was performed (missing
data check and descriptive analysis). Means (SD) were compared before and after
implementation of technology.
4.2 Preliminary data analysis
4.2.1 Missing data check
The researcher conducted the missing data check as sometimes it might happen that
while data collection is conducted some mistakes can be made during data entry.
Table below shows the results of missing data check.
Table 4.1: Missing data check
Before technology After technology
accidents license levy accidents license levy
Valid 24 24 24 36 36 36
Missing 0 0 0 0 0 0
Source – The Researcher (2019)

44
The results on the table 4.1 reveal that there was no missing data as all variables in
the second row show 0 in all columns.
4.2.2 Descriptive analysis:
Researcher undertook the descriptive statistics of the data to establish Mode, Mean,
Median, Minimum Data, Maximum Data and Standard Deviation. Descriptive
analysis of statistics is the quantitatively a discipline depicting the main
characteristics and features of data or the quantitative descriptions. Even when main
conclusion is drawn from a data analysis using inferential statistics, generally
descriptive statistics are also presented. Some commonly used measures which are
known to explain a data set are measures of variability or dispersion and measures
of central tendency. Measures of central tendency comprises the mean, median and
mode, while measures of variability comprises the variance, standard deviation,
minimum and maximum values of the variables. McGraw (2008) defined the
measures of descriptive statistics analysis as the mean of a set of observations in their
average. It is equivalent to the total of all observations distributed or divided by the
units of observations in the set. The term median is meant for the data set in the
middle value of the information being analyzed while the mode stands for the data
set is the value with most frequency occurrence. The (positive) square root of the
variance of the set is called standard deviation of a set of observations. The minimum
data is the minimum value of the data set and the maximum data is the largest value
in the data set.
The period to which this data was collected before technology comprised of 24
months while the period after technology was 36 months. Looking at the table below
it shows the comparison in mean, median mode standard deviation, minimum
number and maximum number of both periods.

45
Table 4.2: Frequency table
N Mean Median Mode
Std.
Deviation Minimum Maximum
accident Before
24 251.58 197.5 118 150.04 118 641
After 36 109.11 90 46 54.16 42 225
license Before
24 1606.92 1643 970 424.49 970 2401
After 36 4904.17 50.67 26 1254.8 26 7279
levy Before
24 21694333 112930000 92660000 139963802 92660000 490260000
After 36 503712750 332936250 39540000 449900638 39540000 1439647000
Source: Researcher 2019
The mean number before technology was 251 accidents and 109 accidents after
technology and the difference being 142 accidents which is 56 percent. The mean
number of license produced before technology was 1606 while after technology it
was 4904 license produced. It rose for about 3298 which is 204 percent. The mean
number for levy collected before technology was TZS 21,694,333/= and TZS
503,712,750/=.
Table 4.3: Group Statistics
Group
statistics
p-value Confidence interval
N mean Std Deviation lower upper
Accidents before 24 251 150.045
after 36 109 54.161 0.000 87.913 197.032
License before 24 1606 424.497
after 36 4904 1254.814 0.000 -3830.421 -2764.079
Levy before 24 216943333 139963802
after 36 503712750 449900638 0.004 -476897978 -96640854
Source: Researcher 2019

46
1. On average there number of accidents declined after the use of technology from
251 to 109.
t (58) = 5.22 p<0.001
2. On average the number of license produced increased after the use of technology
from 1606 to 4904.
t (58) = -12.379 p<0.001
3. On average there was an increase in levy collection after the use of technology
from TZS. 21,6943,333/= to TZS 503,712,750/=
t (58) = -12.379 p<0.004
4.3 The impact of technology in reduction of road accidents
Data collected before and after technology were first analyzed through excel
software to which one set of data for years 2014 and 2015 was calculated to find the
average number of accidents that happened for each month. Another set was for years
2016 to 2018 was also calculated to find the average of each month. Hereunder is a
figure 4:1 representing he analysis in histograms. The figure shows the average
number of accidents that occurred during the two seasons: -

47
Source – The researcher (2019)
Figure 4.1: The impact of implementation of technology on number of road
accidents
The data collected for the two periods were later calculated to find the annual average
of the two seasons, which is before and after technology. The afore period was 2014
and 2015, and the after period was 2016 to 2018. Later it was presented hereunder
on pie chart. Considering the figure 4.2 shows that the period before the use of
technology the level of accidents was very high comparing to the level of accidents
that occurred after the use of technology.
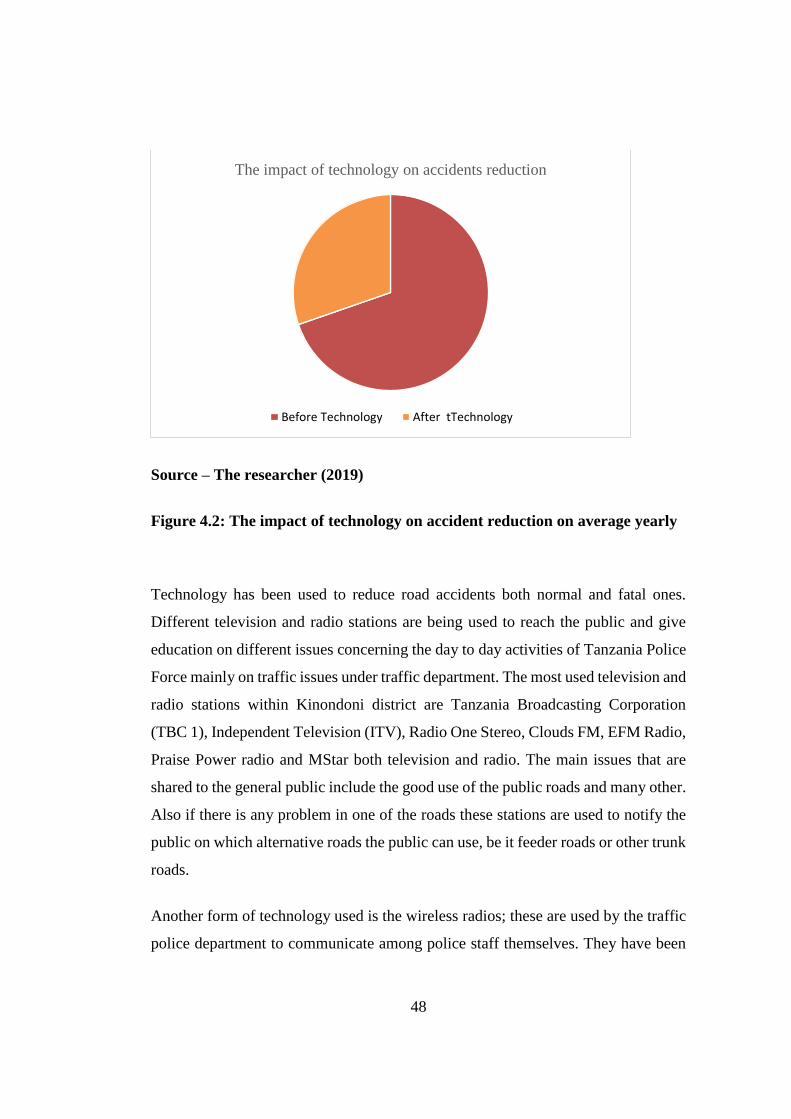
48
Source – The researcher (2019)
Figure 4.2: The impact of technology on accident reduction on average yearly
Technology has been used to reduce road accidents both normal and fatal ones.
Different television and radio stations are being used to reach the public and give
education on different issues concerning the day to day activities of Tanzania Police
Force mainly on traffic issues under traffic department. The most used television and
radio stations within Kinondoni district are Tanzania Broadcasting Corporation
(TBC 1), Independent Television (ITV), Radio One Stereo, Clouds FM, EFM Radio,
Praise Power radio and MStar both television and radio. The main issues that are
shared to the general public include the good use of the public roads and many other.
Also if there is any problem in one of the roads these stations are used to notify the
public on which alternative roads the public can use, be it feeder roads or other trunk
roads.
Another form of technology used is the wireless radios; these are used by the traffic
police department to communicate among police staff themselves. They have been
The impact of technology on accidents reduction
Before Technology After tTechnology

49
useful as Police officers at one point of reference knows what is happening on the
other point. This helps to provide quality services to the public.
The use of speed radars to monitor speed has reduced road accidents, if a person
drives beyond the allowed speed limit he/she is caught and get fined. Bearing this in
mind among many other reasons, speed has been the major cause of several road
accidents. Speed radars have helped a lot in reducing road accidents. In that way
technology has had a positive impact on accident reduction within Kinondoni
district.
The study found that technology had a tremendous impact on reduction of road
accidents. Statistically, the mean level of accidents occurrence before the use of
speed radars technology was 251 accidents while after technology it dropped to 109
accidents. The minimum number of accidents before use of technology was 118
accidents while the maximum number was 641 accidents. After the use of technology
the number dropped to 42 accidents as a minimum (being reduction by 64 per cent)
and 225 accidents as a maximum number (accounting for 65 per cent drop).
Looking at the figures above, the average number of accidents that occurred for two
years, that is, 2014 and 2015 were 3,019 accidents, but after the introduction of speed
radars and the vehicle tracking system, education communicated to the public, it
brought the positive change to which in the period of three years that followed (years
2016, 2017 and 2018) the average number of accidents were 1,309. Therefore,
difference between the averages of two periods of before and after use of technology
is 1,710 accidents. The study concluded that technology had an impact on road
accidents reduction by an average of 56.6 per cent.
Upon doing the research the researcher deployed a number of theories that would
make the study more appealing. Among the theories applied was TAM, into which
the main reason why Tanzania Police force under traffic department use technology
to improve its performance on different services offered to the public. Secondary
data collected from Kinondoni Police department shows that there was a high change

50
on all matters covered by research. There was a big decline of road accidents both
fatal and normal ones.
The study conducted by Msese (2015) on the effect of road safely measures in
reducing traffic accidents in Dar Es Salaam, concluded that the violation of road
safety measures is not the only thing that cause accidents but there are a number of
other factors that led to accidents such as alcoholism, negligence, over speeding, not
fastening seat belts and bypassing traffic lights. With regard to this study the
accidents were minimized by a good number due to a number of systems that have
been used, from the use of speed radars, to the education provided to the public.
4.4 The impact of technology in license provision
Data collected for years 2008 and 2009 that was before technology and 2016 to 2018
were analyzed using excel software. The data for two years were calculated to find
the average and also the data for three years were calculated to find the average and
later being compared. The figure hereunder shows the impact of technology on
license provision.
0
1000
2000
3000
4000
5000
6000
7000
Before Technology After Technology

51
Source: The researcher (2019)
Figure 4.3: The impact of technology on license provision
Data collected for two consecutive years that is before the use of technology that is
year 2008 and 2009 were calculated in order to find its average, same way to the data
after technology that was year 2016 to 2018. Both averages are presented hereunder
in figure 4.5. Looking at figure 4.4 it shows that the provision of license before
technology was very low comparing to the season after technology.
Source: the Researcher (2019)
Figure 4.4: The impact of technology on license provision on average yearly
The study found that the introduction of Tanzania Driving License system on 1st
October 2010 had a major impact on the provision of driver’s licenses. Before the
introduction of TZDL everything was done manually that hindered the production of
The impact of technology on license provision
Before Technology After tTechnology

52
driving licenses. The average number of licenses produced yearly before the
introduction of technology was 18,774 licenses. After the introduction of TZDL the
average number of license produced went up to 57,083 licenses, being an increase of
204 percent as per the figure 4.4.
The production mean rate before use of technology was 1,606 licenses while after
technology it is 4,904 licenses. The minimum production of licenses before
technology was 970 licenses while the maximum number of licenses produced was
2,401. After technology it increased exponentially at which the minimum number
was 26 and the maximum number was 7,279 license provided. Looking at the amount
of licenses produced there was an impact after the introduction of technology.
This technology has helped the Police Force under traffic department to provide
services more efficiently than ever before. The data collected on the provision of
license proves there was a tremendous positive change asmany people were able to
get their driving licenses among many other factors for the many licenses offered the
technology has helped every person who wishes and qualified for the license to get
it. So to say, with the technology it has become very easy to get a license to which it
takes a person less than three working days to get a driving license.
4.5 The impact of technology in levy collection
Data collected for years 2013 and 2014 before the introduction of TMS system which
include a number of sub-systems such as POSS and APNR were calculated to find
the average of levy collected monthly during that period. These data were later
compared to the data collected for the period 2016 to 2018. Year 2015 was left as its
data comprises two periods before and after technology. Hereunder is the figure 4.5
showing the comparison between before technology and after technology.

53
Source: The researcher (2019)
Figure 4.5 The impact of Levy collection after technology
Data collected before and after technology were later calculated and find the average
and were later communicated on a pie chat. Looking at the figure 4.5 hereunder, the
period before technology presented in a blue color shows that the average collection
yearly was very low comparing to the period after technology.
Source – The researcher (2019)
Figure 4.6: The impact of technology on levy collection on average yearly
0100000000200000000300000000400000000500000000600000000700000000800000000
Before Technology After Technology
The impact of technology on levy collection
Before Technology After tTechnology

54
The study found that the introduction of traffic enforcement management systems
(TMS) under the traffic department in collaboration with SUMATRA, TRA, TIRA
and MAXCOM AFRICA (the system that manages the traffic offenses
electronically) had a major impact on levy collections. The traffic department at
Kinondoni district ensures that the government receives its levy. In the eyes of public
it might be seen as an intimidation process but looking at it in a different perspective,
this levy is used to help the public in different ways, such as financing construction
of roads, public school, public hospital, water services and other related public
facilities.
Road offenders especially those with minor offenses are fined right away after the
offense. Before use of technology everything it was done manually. The offender
was issued with a ticket and was supposed to pay it upfront and if it happens an
offender has no cash he/she was supposed to leave his motor vehicle with the Police
Officers until he/she got the money to pay. With the current system an offender is
issued an electronic ticket of which he or she is given a grace period of seven days
to pay a pending fine, although if an offender fails to pay this fine, they are charged
25% more of the initial fine. An example is if a person was charged TZS 30,000.00
it has to be settled within one week, after a week it is TZS 37,500.00 if this fine is
not paid for four weeks it doubles. A person who was once charged TZS 30,000.00
is supposed to pay TZS 60,000.00
It may happens that a person ignores to pay the fine for more than a month then there
is a system known as APNR which captures a number plate of a motor
vehicle/motorcycle, sends it to the TMS and get the entire report of the said motor
vehicle/motorcycle including any pending fines. This system has helped a lot in
apprehending offenders with accumulated fines hence increase the amount of levy
collected both monthly and yearly.
The study found out that before the use of technology the average levy collection per
year was TZS 2,603,320,000.00 while after the introduction of technology it went
up to TZS 6,051,220,000.00 yearly on average representing an increase of 132 per

55
cent. The levy collection mean rate before use of technology was TZS 21,694,333.00
while after technology it was TZS 503,712,750.00. The minimum and maximum
amount collected before technology was TZS 92,660,000.00 and TZS
490,260,000.00 respectively. While the minimum and maximum collection after
technology is TZS 39,540,000.00 and TZS 1,439,647,000.00 respectively. Thus it
was concluded there was a positive impact after the introduction of technology.
Haji(2017) in his study ‘Impact of traffic fines on road accidents’ stated that traffic
offenders can be penalised in various ways such as fines, penalty point which is a
temporal punishment, or a person can face license suspension or termination. He
therefore concluded that the most common used form of punishment to road
offenders is a fine that is paid either to the police force or the court. The amount of
fines a person is charged depends on the severity of the offense or the number of
offenses that a person committed.
In this study, the researcher concentrated on the amount of the levy collected from
traffic offenders. These are minor offences as the major offenses are treated by the
court of law. According to collected data and the number of offenses it shows that
the people didn’t pay their fines on time thus resulting to an increase of 25 percent
penalty.
56
CHAPTER FIVE
SUMMARY OF FINDINGS
5.0 Introduction
This chapter presents the summary findings as presented and analyzed in chapter
four. The discussion of the findings has been done as of the objectives of the study
categorized hereinbefore.
5.1 The impact of technology in reducing road accidents
A number of technologies have been used to assist the reduction of accidents in
Kinondoni. The introductions of speed radars was introduced back in 2010 but were
later replaced by speed radars that had cameras and in 2016 Other measures were
also applied such as the use of radio and Television stations to educate people on
better usage of roads. These speed radars with cameras assist to apprehend the traffic
offenders and if a person speeds of, they are arrested at another traffic point.
Looking at the data collected from Kinondoni district traffic office, the researcher
compared two sets of data that comprised period before that is 2014 and 2015, and
2016 to 2018 after the use of technology. The average difference between the two
sets of data was 1710 accidents. Putting it into percentage there was 56.6 percent
reduction of accidents. It was therefore concluded that technology had an impact on
accident reduction.
The researcher discovered that the traffic police department as a whole has been
going through a number of transformational changes technologically for the good
performance of its daily activities. Kinondoni Police has been lucky enough to be a
pilot experimental place of many technologies of which after being tested and found
their applicability they are distributed to other parts of the country.
DOI under relative advantage it is to see if an innovated technology can help
performing a same task better than the former technology. Under this theory the
researcher looked if there was innovation done for the past years and found out that

57
one particular system was innovated. Years back there was a use of speed radars to
control those people who drove above the allowed speed. It was not possible to
apprehend offenders when they decide to speed off. Currently there are radars which
have cameras and if an offender speeds off, the image of the motor vehicle is
captured and gets reported to other police officers on different points to be
apprehended. This has inflicted the sense of responsibility to road users by knowing
that irrespective of circumstances, if they make any road offence anywhere in the
country they will be apprehended. In a positive way, as it has reduced a number of
accidents just as how it shows on the data provided hereinbefore.
5.2 The impact of technology in licenses provision
Before 2010 the provision of license was done manually. This procedure hindered
the issuing of many licenses. It took a long time thus make the number of license
produced be very minimal. The type of license produced also was very hard to handle
and could be easily destroyed by water. On 1st October 2010, there was an
introduction of a system that is known as TZDL came as a savior to a number of
issues from production of license to time for a person getting a license monthly and
yearly.
Two sets of data was collected from Kinondoni traffic police office for two periods.
Two years that is year 2008 and 2009 a period before the introduction of TZDL after
being calculated the average production of license yearly was 18,774 license.
Another set of data collected was after the introduction of TZDL that is 2016 to 2018,
after the calculation the average license produced yearly was 57,083 licenses. The
difference between the two periods was 38,309 licenses. Putting it into percentage
there was an increase of 204 percent. It was therefore concluded that technology had
an impact on license provision.
5.3 The impact of technology on levy collection
Tanzania Police Force like many other government organs collects levy on behalf of
the government. There are a number of activities within the force that results into

58
levy collection. Some of the activities are loss report payments, fire – arm license
payments and from the fines issued to minor traffic offenders.
This study focused on levy collected under traffic office within Kinondoni district
for minor traffic offenses. Of course, before 2015 everything were done manually.
When a person violated a law while on road, he was awarded a paper ticket and was
supposed to pay the fine upfront. If a person had no cash on him he was supposed to
leave the motor vehicle with the Police officers until when he gets the money. But
with the current system a person is issued with an electronic ticket and is given at
least seven days to pay the fine.
Data collected from traffic Police office at Kinondoni district for the two periods
before and after technology comprises 2013, 2014 for period before technology and
years 2016 to 2018 for a period after technology. The year 2015 was left out because
in the same year the electronic system was introduced therefore its data comprises
both before and after technology. The average collection for the two years yearly
before technology was TZS 2,603,320.00 while the data collected for years 2016,
2017, 2018 on average yearly was TZS 6,051,220,000.00. The difference between
the two periods is TZS. 3,447,900,000.00. the collection rose up to 132 percent.
Therefore the study concludes that technology had an impact on levy collection.
5.4 Conclusion
It has been found that among the main drivers of efficiency in the delivery of public
services is revolving around introduction of new technologies in their respective
departments. The reasons why the use of technology has developed, its impact and
consequences in the delivery of public services have been examined from various
aspects by using cases of traffic police department in this study. Some important
technology attributes and how they influence efficiency in the performance of traffic
police force were discussed. In addition, the technology makes the services delivery
process transparent to the public enabling them to check on information recorded by
the traffic police department. It is by no means an exhaustive list of other attributes
exists. As the research upon which this study is based will now create a platform for

59
the government to compare the impacts of technology in other of its departments and
encourage its usability.
The descriptive and inferential of statistics using Statistical Package for Social
Science (SPSS) software analysis has provided valuable statistical evidence which
help to explain the impact technology in increasing efficiency in public service
delivery process. The reduction of road accidents at the level of 56.6 per cent,
increased rate of provision of driving licenses at the level of 204 per cent and
increased levy collections by 132 percent explains the impact of technology in the
right perspective than otherwise it could have been.
The useful application of this study is that, it proves within statistical constraints and
sample definition that application of technology has a strong association with public
services delivery efficiency. The study also draws to the conclusion that continued
innovation in the use of technology on part of the traffic police department can
further reduce road accidents, increase provision of driving licenses and increase
levy correction. On the same vein technology can improve efficiency in the delivery
of other services of the traffic police department which were not studied in this study.
5.5 Recommendations
By its very nature, the impact of technology explored under this study represents
only the knowledge and expertise of the researcher. The present work should be seen
as a start to what promises to be continuing development in the application of
technology to the provision of services. It can be taken as a model to further find the
impacts on technology for other government departments in their services delivery
to the public.
It is recommended that additional impact on the use of technology might be realized
if new packages, software and other innovations are explored in future. Such
packages, software and innovations may attract other stakeholders particularly from
private sector to invest their capital for the development of the public service delivery
process. Of course, w such policy as Public - Private - Partnership (PPP) in place

60
individual experts might then find it practicable to develop new technologies which
might ultimately increase efficiency in the delivery of services by the public sector.

61
REFERENCES
Arvidsson S. (2011) Traffic violations and Insurance data, Swedish National Road
and Transport research institute, Centre for Transport studies,
Stockholm, Sweden
Bozeman, B. (2000) Technology transfer and Public Policy: A Review of Research
and Theories.
Daniel B.D (2012) Impacts of neighborhood traffic management; University of
Canterbury, New Zealand
Fernburg A. (2006) Critical Theory of Technology, in Democratizing Technology,
State University of New York press. United States of America
Haji M.H (2017) Impact of traffic Police fines on Road accidents; a case of Arusha,
Open University of Tanzania
Hashim N.M.Z, Jaafar A.S, Ali N.A, Salahuin L. Mohamad N.R & Ibrahim M.A
(2013) Traffic Light Control systems for Emergency Vehicles Using
Radio frequency, IOSR Journal of Engineering, Vol 3, issue 7, p43-
52
Kothari C.R (2004) Research Methodology, Methods and Techniques, 2nd Edition,
New Age, International Publishers, New Delhi
Leggett L.M.W (1994) Using police enforcement to prevent road crashes:
Randomised scheduled management system, Land transport and
Safety division, Queensland Transport, Brisbane Queensland,
Australia
Mlinaric M. (2016) Intelligent Traffic Control with priority for emergency vehicles,
University of Zagred, Croatia

62
Msese A.J (2015), The effect Road safety measures in reducing road traffic accidents
in Dar es salaam, Open University of Dar es salaam
Newspaper, Daily News 20th February, 2019, “Tanzania in steady progress towards
road fatalities reduction” pp.12
Philip R. Cateora and John L. Graham (2005) International Marketing 13th Edition
Ping Lang and Stephen Young (1996) International technology Transfer examined
at Technology component level: A case of study in China
Sudash M.D, Gupta M.P, Chakravorty and Rajesh Taneja (2001), India Institute of
Technology
United Republic of Tanzania(1996) The National Science and Technology Policy for
Tanzania, Ministry of Science and Technology
Vinod K, Umar K and Aditha P. (1999) Building Technology Capability through
Importing Technology: The case of Indonesian Manufacturing firm
Zhang W. (2011) , Managing traffic congestion, Hangzhou

63
APENDIX
Interview Guide
1. Does Tanzania Police force under traffic department use any specific
technology in its day to day activities?
2. If yes, what technology?
3. Traffic Management system does it include any other government organs
4. If yes, what organs?
5. What system is used in license provision?
6. What are the causes of accidents