Embed Size (px)
Citation preview

• Union membership in each state during 2009 and 2010
• Tennessee Historical Civilian Labor Force Series, 1980 to Present
• County UnemploymentRates
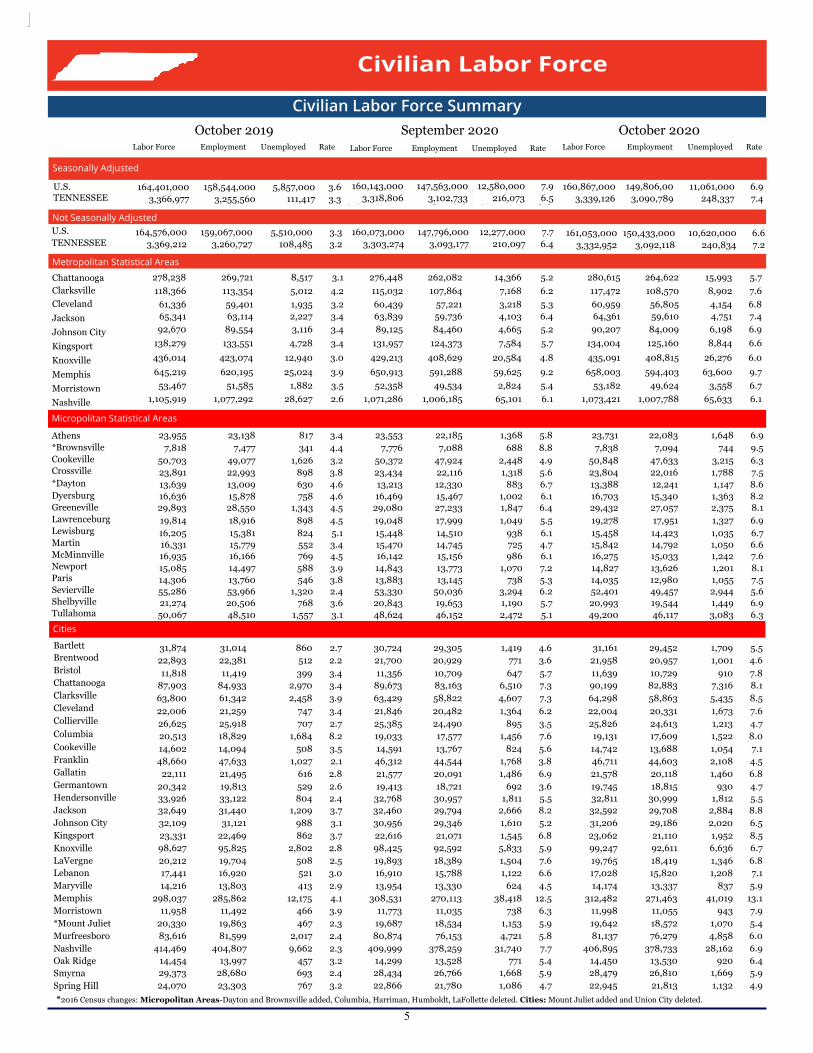
• Civilian Labor Force Summary
• State UnemploymentInsurance Activities
Inside This Issue:
The Impact of the Government Shutdown
De
pa
rtm
en
t o
f L
ab
or
an
d W
ork
forc
e D
eve
lop
me
nt
The detailed industries listed below in-creased in employment over the year from October 2019 to October 2020, continuing to grow from September 2020 through Oc-tober 2020. Included are industries in both the goods-producing and service-providing industries. Essential industries, needed for survival while individuals sheltered at home or began working from home and many students were no longer in person in school, included food and beverage stores (such as grocery stores) and other stores which sell food (gas stations and general merchandise stores).
Construction of buildings, which added 1,000 jobs over the year, continued its growth as projects in the pipeline were be-ing completed. Providing products for build-ing interiors, furniture and home furnishing stores in turn grew slightly over the year and now employ 400 more employees than a year ago. This demand has caused furni-ture manufacturing to continue slightly pos-itive employment growth over the year as well.
A positive trend for engineering and tech-nology could be re-shoring of manufactur-ing industries, since COVID-19 has disrupt-ed global supply chains. Besides furniture manufacturing, durable goods manufactur-ing industries with employment greater than in October 2019 included the ad-vanced manufacturing industries of non-metallic mineral products, primary metal, fabricated metal, machinery, and miscella-neous manufacturing, as well as fabricated metal.
In the service-providing industries, both finance and insurance and real estate post-ed positive growth, with finance and insur-ance adding 1,200 jobs over the year. Banks were responsible for distributing funding for the federal CARES Act. Insurance indus-tries experienced cost savings (fewer cars on the road; fewer patients with elective surgery) which aided their bottom line.1 Real estate grew slightly, as completed buildings came on the market. Manage-
ment of companies and enterprises added 400 more jobs than the industry had in Octo-ber 2019.
From October 2019 to October 2020, the educational and health services industries lost 12,100 jobs, but they have started grow-ing again and remain among Tennessee’s largest industries. Growth this October was in the ambulatory care industries, while hos-pitals continued to shed jobs. Although gov-ernment lost 13,600 jobs over the year, near-ly 4,000 jobs returned in October, especially in state and local education services.
For the month of October 2020, the occupa-tions with the most jobs listed on jobs4tn.gov requiring a high school educa-tion or more included:
• Registered nurses (12,676 jobs) and criti-cal care nurses (912 jobs)
• General, operations, and all other man-agers (3,126 jobs)
• Nursing assistants (2,922 jobs)
• Licensed practical nurses (2,772 jobs)
• Physicians and surgeons, all other (1,722jobs)
• Production workers, all other (1,542jobs)
• Heavy and tractor-trailer truck drivers(1,491 jobs)
• Production supervisors (1,189 jobs)
• Medical assistants (983 jobs)
• Pharmacy technicians (802 jobs)
• Executive secretaries and administrativeassistants (736 jobs)
• Computer programmers (719 jobs)
According to economists, control of the coro-navirus will be needed before consumer confidence comes back and the economy returns to higher growth. In the next year, this will likely mean increased demand for nurses, public health workers, and laborato-ry personnel. Computer specialists are also developing new technologies for contact tracing. ______________________________________ 1 Amanda Holpuch. (August 14, 2020). U.S. health insurers doubled profits in second quarter amid pandemic. PNHP Fall 2020 Newsletter, p. 24.
Industries & Occupations Adding Jobs During the COVID-19 Pandemic in TN
Highlights
Pages 1-2 The industries and occupations that grew during the COVID-19 pandemic in Tennessee
Page 3 The annual average nonfarm employment rates and the not seasonally adjusted monthly labor force data
Pages 6-9 Monthly nonfarm employment, long-term graphs of theunemployment and a brief explanation for each major MSA in Tennessee
Page 10 Monthly nonfarm employment for each small MSA in Tennessee
Page 11 The monthly consumer price index and wages by industries for production workers
Goods-Producing Industries
Service-Providing Industries
Occupations

2
Source: TN Department of Labor and Workforce Development, WIR2ED Division, Current Employment Statistics, 2019-2020
Tennessee October 2020 Current Employment Statistics (CES) Data for All Workers (thousands)
October 2019
(Previous Year)
September 2020
(Previous Month)
October 2020
(Current Month)
October 2019-October 2020; Net Change
September 2020-
October 2020; Net Change
Construction of Buildings 28.6 28.8 29.6 1.0 0.8
Nonmetallic Mineral Product Manufacturing 14.2 14.6 14.7 0.5 0.1
Primary Metal Manufacturing 11.3 12.2 12.3 1.0 0.1
Fabricated Metal Product Manufacturing 37.9 38.7 39.3 1.4 0.6
Machinery Manufacturing 25.9 26.6 27.0 1.1 0.4
Furniture and Related Products Manufacturing 9.8 10.1 10.3 0.5 0.2
Misc. Manufacturing Durable Goods 16.8 17.6 17.9 1.1 0.3
Furniture and Home Furnishing Stores 10.3 10.2 10.7 0.4 0.5
Food and Beverage Stores 54.9 55.4 56.7 1.8 1.3
Gasoline Stations 24.2 24.1 24.5 0.3 0.4
General Merchandise Stores 72.8 76.9 78.2 5.4 1.3
Finance and Insurance 130.9 132 132.1 1.2 0.1
Real Estate, Rental, and Leasing 42.8 43.3 43.4 0.6 0.1
Management of Companies and Enterprises 52.3 51.8 52.7 0.4 0.9
Educational and Health Services 449 436.3 436.9 -12.1 0.6
Government 449.7 432.3 436.1 -13.6 3.8
-13.6
-12.1
0.4
0.6
1.2
5.4
0.3
1.8
0.4
1.1
0.5
1.1
1.4
1.0
0.5
1.0
-15 -10 -5 0 5 10
Government
Educational and Health Services
Management of Companies and Enterprises
Real Estate, Rental, and Leasing
Finance and Insurance
General Merchandise Stores
Gasoline Stations
Food and Beverage Stores
Furniture and Home Furnishing Stores
Misc. Manufacturing Durable Goods
Furniture and Related Products Manufacturing
Machinery Manufacturing
Fabricated Metal Product Manufacturing
Primary Metal Manufacturing
Nonmetallic Mineral Product Manufacturing
Construction of Buildings
All Workers (thousands)
October 2019-October 2020; Net Change

3
Tennessee Civilian Labor Workforce 1990-Present County Unemployment Rates*
Oct Oct Oct Oct
County 2019 2020 County 2019 2020
Anderson 3.4 6.6 Lauderdale 5.1 10.1
Bedford 3.6 6.9 Lawrence 4.5 6.9
Benton 4.5 8.2 Lewis 5.8 7.6
Bledsoe 4.8 9.0 Lincoln 4.3 7.5
Blount 3.0 6.0 Loudon 3.1 6.2
Bradley 3.1 6.7 Macon 3.1 6.7
Campbell 4.4 7.8 Madison 3.5 7.8
Cannon 2.9 6.0 Marion 4.1 7.4
Carroll 4.4 7.6 Marshall 5.1 6.7
Carter 3.6 7.3 Maury 6.0 6.5
Cheatham 2.4 5.4 McMinn 3.4 6.9
Chester 3.2 6.0 McNairy 4.6 9.4
Claiborne 3.8 6.6 Meigs 3.9 8.4
Clay 5.2 8.2 Monroe 3.4 6.8
Cocke 3.9 8.1 Montgomery 3.6 7.7
Coffee 3.1 6.6 Moore 2.7 4.8
Crockett 3.2 6.3 Morgan 3.5 7.5
Cumberland 3.8 7.5 Obion 4.1 8.0
Davidson 2.3 6.9 Overton 3.1 6.0
Decatur 6.4 8.4 Perry 8.3 8.1
DeKalb 5.2 8.4 Pickett 4.0 6.0
Dickson 2.7 5.6 Polk 3.4 7.3
Dyer 4.6 8.2 Putnam 3.1 6.3
Fayette 3.7 7.4 Rhea 4.6 8.6
Fentress 3.9 7.8 Roane 3.6 6.8
Franklin 3.2 6.1 Robertson 2.6 5.9
Gibson 4.1 7.6 Rutherford 2.4 5.8
Giles 4.4 7.1 Scott 4.1 8.5
Grainger 3.5 7.3 Sequatchie 4.2 7.8
Greene 4.5 8.1 Sevier 2.4 5.6
Grundy 4.2 8.5 Shelby 3.7 11.0
Hamblen 3.7 6.7 Smith 2.8 5.5
Hamilton 3.1 6.7 Stewart 3.8 6.8
Hancock 5.4 9.7 Sullivan 3.4 7.6
Hardeman 5.1 9.4 Sumner 2.5 5.9
Hardin 3.9 7.8 Tipton 3.7 7.5
Hawkins 4.3 7.5 Trousdale 2.7 6.1
Haywood 4.4 9.5 Unicoi 4.3 9.0
Henderson 4.9 7.6 Union 3.6 6.8
Henry 3.8 7.5 Van Buren 4.4 8.0
Hickman 3.2 6.0 Warren 4.5 7.6
Houston 4.0 8.4 Washington 3.2 6.4
Humphreys 3.4 6.4 Wayne 4.7 7.9
Jackson 3.9 7.4 Weakley 3.4 6.6
Jefferson 3.3 6.6 White 3.6 6.6
Johnson 3.0 6.8 Williamson 2.3 4.6
Knox 2.7 5.7 Wilson 2.6 5.7
Lake 4.7 10.4 *Data Not Seasonally Adjusted
3.0
3.9
4.8
5.7
6.6
7.5
8.4
9.3
10.2
11.1
U n e m p l o y m e n t R a t e
Unemployment Rates 2005-2019
55.0
55.9
56.8
57.7
58.6
59.5
60.4
61.3
62.2
63.1
64.0
64.9
65.8
Lab
or F
orc
e P
arti
cip
ati
on
Ra
te
Labor Force Participation Rates 2005-2019
(N UM B ER S IN THOUS A N D S )
Total Total Rate (%) Total Rate (%)
1990 3,765.4 2,394.7 63.6% 2,266.8 60.2% 128.0 5.3%
1991 3,822.5 2,413.7 63.1 2,250.6 58.9 163.1 6.8
1992 3,875.8 2,457.2 63.4 2,297.4 59.3 159.8 6.5
1993 3,936.5 2,526.9 64.2 2,380.5 60.5 146.4 5.8
1994 4,003.3 2,659.9 66.4 2,531.1 63.2 128.8 4.8
1995 4,075.6 2,732.2 67.0 2,591.5 63.6 140.7 5.2
1996 4,150.1 2,767.0 66.7 2,623.8 63.2 143.2 5.2
1997 4,218.9 2,786.1 66.0 2,639.2 62.6 146.9 5.3
1998 4,272.7 2,812.4 65.8 2,691.5 63.0 120.9 4.3
1999 4,317.6 2,852.4 66.1 2,739.2 63.4 113.3 4.0
2000 4,358.4 2,843.1 65.2 2,733.3 62.7 109.8 3.9
2001 4,401.2 2,861.3 65.0 2,731.0 62.1 130.4 4.6
2002 4,444.9 2,906.6 65.4 2,756.1 62.0 150.5 5.2
2003 4,492.3 2,912.2 64.8 2,748.1 61.2 164.0 5.6
2004 4,541.6 2,878.7 63.4 2,725.1 60.0 153.6 5.3
2005 4,610.1 2,904.8 63.0 2,743.4 59.5 161.4 5.6
2006 4,692.4 3,036.0 64.7 2,878.5 61.3 157.6 5.2
2007 4,760.1 3,063.7 64.4 2,920.4 61.4 143.3 4.7
2008 4,821.7 3,054.8 63.4 2,853.7 59.2 201.0 6.6
2009 4,868.4 3,052.7 62.7 2,733.1 56.1 319.6 10.5
2010 4,925.2 3,090.8 62.8 2,792.1 56.7 298.7 9.7
2011 4,972.7 3,125.3 62.8 2,844.7 57.2 280.6 9.0
2012 5,019.0 3,100.7 61.8 2,857.9 56.9 242.7 7.8
2013 5,062.6 3,067.4 60.6 2,828.5 55.9 239.0 7.8
2014 5,107.2 3,024.2 59.2 2,825.1 55.3 199.1 6.6
2015 5,155.9 3,057.3 59.3 2,885.1 56.0 172.2 5.6
2016 5,209.9 3,123.3 59.9 2,976.1 57.1 147.2 4.7
2017 5,267.4 3,185.2 60.5 3,065.3 58.2 120.0 3.8
2018 5,323.7 3,254.3 61.1 3,139.9 59.0 114.4 3.5
2019 5,379.5 3,344.8 62.2 3,231.5 60.1 113.3 3.4
2020
January 5,411.0 3,331.9 61.6% 3,204.5 59.2% 127.5 3.8%
February 5,415.2 3,352.9 61.9 3,225.6 59.6 127.4 3.8
March 5,419.6 3,382.0 62.4 3,272.7 60.4 109.3 3.2
April 5,424.1 3,219.2 59.4 2,736.3 50.4 482.9 15.0
May 5,428.9 3,294.6 60.7 2,942.6 54.2 351.9 10.7
June 5,433.8 3,202.7 58.9 2,879.9 53.0 322.9 10.1
July 5,439.1 3,178.4 58.4 2,856.9 52.5 321.5 10.1
August 5,444.5 3,383.0 62.1 3,090.8 56.8 292.2 8.6
September (r) 5,449.9 3,303.3 60.6 3,093.2 56.8 210.1 6.4
October (p) 5455.3 3,333.0 61.1 3,092.1 56.7 240.8 7.2
November
December
(r)=rev ised
(p)=preliminary
Year
and
Month
Civilian
noninstitutional
population
Labor Force
Participation
Rate (%)
MONT HLY DA T A NOT SEA SONA LLY A DJUST ED
Employed Unemployed
Civilian Labor Force

4
201 9
Oct.
Oct. Oct.
Nonfarm Employment & Labor Workforce Narrative
Estimated Nonfarm Employment (in thousands)
Total Nonfarm 3,159.3 3,013.0 3,048.9 -110.4 35.9
Total Private 2,709.6 2,580.7 2,612.8 -96.8 32.1
Goods Producing 486.4 459.6 461.6 -24.8 2.0
Mining, Logging & Construction 136.3 131.8 131.4 -4.9 -0.4
Natural Resources & Mining 4.5 3.9 3.9 -0.6 0.0
Construction 131.8 127.9 127.5 -4.3 -0.4
Construction of Buildings 28.6 28.8 29.6 1.0 0.8
Heavy an Civil Engineering 17.2 15.6 15.5 -1.7 -0.1
Specialty Trade Contractors 86.0 83.5 82.4 -3.6 -1.1
Manufacturing 350.1 327.8 330.2 -19.9 2.4
Durable Goods Manufacturing 223.3 206.3 208.6 -14.7 2.3
Wood Product Manufacturing 12.7 13.5 13.5 0.8 0.0
Nonmetallic Mineral Product Manufacturing 14.2 14.6 14.7 0.5 0.1
Primary Metal Manufacturing 11.3 12.2 12.3 1.0 0.1
Fabricated Metal Product Manufacturing 37.9 38.7 39.3 1.4 0.6
Machinery Manufacturing 25.9 26.6 27.0 1.1 0.4
Computer & Electronic Product Manufacturing 5.6 5.8 5.8 0.2 0.0
Electrical Equipment & Appliance Manufacturing 17.4 17.9 17.9 0.5 0.0
Transportation Equipment Manufacturing 71.7 49.3 49.9 -21.8 0.6
Furniture & Related Product Manufacturing 9.8 10.1 10.3 0.5 0.2
Miscellaneous Manufacturing Durable Goods 16.8 17.6 17.9 1.1 0.3
Nondurable Goods Manufacturing 126.8 121.5 121.6 -5.2 0.1
Food Manufacturing 36.1 33.5 33.4 -2.7 -0.1
Beverage & Tobacco Product Manufacturing 7.7 7.3 7.4 -0.3 0.1
Paper Manufacturing 12.8 12.7 12.6 -0.2 -0.1
Printing & Related Support Activities 8.9 6.9 7.0 -1.9 0.1
Chemical Manufacturing 26.0 25.8 25.8 -0.2 0.0
Plastics & Rubber Products Manufacturing 24.4 21.8 22.0 -2.4 0.2
Service Providing 2,672.9 2,553.4 2,587.3 -85.6 33.9
Trade, Transportation, & Utilities 643.3 633.2 637.4 -5.9 4.2
Wholesale Trade 121.4 117.7 116.9 -4.5 -0.8
Merchant Wholesalers, Durable Goods 71.6 70.0 69.6 -2.0 -0.4
Merchant Wholesalers, Nondurable Goods 42.5 40.9 40.6 -1.9 -0.3
Wholesale Electronic Markets 7.3 6.8 6.7 -0.6 -0.1
Retail Trade 336.4 334.6 339.2 2.8 4.6
Motor Vehicle & Parts Dealers 47.4 45.4 45.3 -2.1 -0.1
Furniture & Home Furnishings Stores 10.3 10.2 10.7 0.4 0.5
Building Material, Garden Equipment, & Supplies 29.6 32.5 32.0 2.4 -0.5
Food & Beverage Stores 54.9 55.4 56.7 1.8 1.3
Health & Personal Care Stores 23.3 21.4 21.7 -1.6 0.3
Gasoline Stations 24.2 24.1 24.5 0.3 0.4
Clothing & Clothing Accessories Stores 23.1 14.9 15.2 -7.9 0.3
Sporting Goods, Hobby, Book, & Music Stores 12.3 11.2 11.3 -1.0 0.1
General Merchandise Stores 72.8 76.9 78.2 5.4 1.3
Miscellaneous Store Retailers 18.3 16.7 17.0 -1.3 0.3
Nonstore Retailers 8.9 8.2 8.3 -0.6 0.1
Transportation, Warehousing, & Utilities 185.5 180.9 181.3 -4.2 0.4
Utilities 3.6 3.2 3.2 -0.4 0.0
Transportation & Warehousing 181.9 177.7 178.1 -3.8 0.4
Truck Transportation 61.5 60.8 59.7 -1.8 -1.1
Information 46.5 43.4 43.6 -2.9 0.2
Financial Activities 173.7 175.3 175.5 1.8 0.2
Finance & Insurance 130.9 132.0 132.1 1.2 0.1
Real Estate, Rental, & Leasing 42.8 43.3 43.4 0.6 0.1
Professional & Business Services 434.1 410.5 427.7 -6.4 17.2
Professional, Scientific, & Technical Services 150.7 142.8 144.9 -5.8 2.1
Management of Companies & Enterprises 52.3 51.8 52.7 0.4 0.9
Administrative, Support, & Waste Management 231.1 215.9 230.1 -1.0 14.2
Educational & Health Services 449.0 436.3 436.9 -12.1 0.6
Educational Services 65.5 64.1 65.1 -0.4 1.0
Health Care & Social Assistance 383.5 372.2 371.8 -11.7 -0.4
Ambulatory Health Care Services 157.6 153.0 153.9 -3.7 0.9
Hospitals 109.9 107.5 106.9 -3.0 -0.6
Nursing & Residential Care Facilities 63.8 61.5 60.8 -3.0 -0.7
Social Assistance 52.2 50.2 50.2 -2.0 0.0
Leisure & Hospitality 355.3 304.4 310.1 -45.2 5.7
Arts, Entertainment, & Recreation 43.9 33.4 33.1 -10.8 -0.3
Accommodation & Food Services 311.4 271.0 277.0 -34.4 6.0
Accommodation 40.6 27.6 28.0 -12.6 0.4
Food Services & Drinking Places 270.8 243.4 249.0 -21.8 5.6
Other Services 121.3 118.0 120.0 -1.3 2.0
Government 449.7 432.3 436.1 -13.6 3.8
Federal Government 50.1 55.2 52.1 2.0 -3.1
State Government 102.3 93.4 95.6 -6.7 2.2
State Government Educational Services 61.0 52.4 54.7 -6.3 2.3
Local Government 297.3 283.7 288.4 -8.9 4.7
Local Government Educational Services 147.7 140.0 142.2 -5.5 2.2
The data from all the nonfarm employment estimates tables include all full- and part-time nonfarm wage and salary employ-ees who worked during or received pay for any part of the pay period that includes the 12th of the month. This is a count of jobs by place of work. Agricultural workers, proprietors, self-employed persons, workers in private households, and unpaid family workers are excluded. These numbers may not add due
Total nonfarm employment decreased by 110,400 jobs from October 2019 to Octo-ber 2020. There were decreases in leisure & hospitality (down 45,200 jobs), which includes decreases of 21,800 jobs in food services & drinking places; transportation equipment manufacturing (down 21,800 jobs; government (down 13,600 jobs), which includes decreases of 8,900 jobs in local government; education & health ser-vices (down 12,100 jobs), which includes decreases of 11,700 jobs in health care & social assistance; clothing & clothing ac-cessories stores (down 7,900 jobs).
These decreases were partially offset by increases in general merchandise stores (up 5,400 jobs); building material/garden equipment/supplies (up 2,400 jobs); feder-al government (up 2,000 jobs); financial activities (up 1,800 jobs).
During the past month, nonfarm employ-ment increased by 35,900 jobs. There were increases in professional & business ser-vices (up 17,200 jobs), which includes in-creases of 14,200 jobs in administrative/support/waste management; accommoda-tion & food services (up 6,000 jobs), which includes increases of 5,600 jobs in food services & drinking places; local govern-ment (up 4,700 jobs).
These increases were partially offset by decreases in federal government (down 3,100 jobs); truck transportation and spe-cialty trade contractors (both down 1,100 jobs); wholesale trade (down 800 jobs); nursing & residential care facilities (down 700 jobs).
Tennessee's seasonally adjusted estimated unemployment rate for October 2020 was 7.4 percent, up from the revised Septem-ber 2020 rate of 6.5 percent. The United States unemployment rate for October 2020 was 6.9 percent, down from the re-vised September 2020 rate of 7.9 percent. In October 2019, the U.S. seasonally ad-justed rate was 3.6 percent while the state rate was 3.3 percent.
The not seasonally adjusted unemploy-ment rate increased in 93 counties and decreased in 2 counties. Williamson Coun-ty had the lowest rate at 4.6 percent, up from the revised September rate of 3.8 percent. The highest rate was Shelby County at 11.0 percent, up from the re-vised unemployment rate of 10.3 percent in September.
Sep.October Sep.
5
Civilian Labor Force Summary
U.S. TENNESSEE
U.S.
TENNESSEE
Labor Force Employment Unemployed Rate Labor Force Employment Unemployed Rate Labor Force Employment Unemployed Rate
Bartlett
Brentwood
Bristol
Chattanooga
Clarksville
Cleveland
Collierville
Columbia
Cookeville
Franklin
Gallatin
Germantown
Hendersonville
Jackson
Johnson City
Kingsport
Knoxville
LaVergne
Lebanon
Maryville
Memphis
Morristown
*Mount Juliet
Murfreesboro
Nashville
Oak Ridge
Smyrna
Spring Hill
Chattanooga
Clarksville
Cleveland
Jackson
Johnson City
Kingsport
Knoxville
Memphis
Morristown
Nashville
Athens
*Brownsville
Cookeville
Crossville
*Dayton
Dyersburg
Greeneville
Lawrenceburg
Lewisburg
Martin
McMinnville
Newport
Paris
Sevierville
Shelbyville
Tullahoma
23,955 23,138 817 3.4 23,553 22,185 1,368 5.8 23,731 22,083 1,648 6.9
7,818 7,477 341 4.4 7,776 7,088 688 8.8 7,838 7,094 744 9.5
50,703 49,077 1,626 3.2 50,372 47,924 2,448 4.9 50,848 47,633 3,215 6.3
23,891 22,993 898 3.8 23,434 22,116 1,318 5.6 23,804 22,016 1,788 7.5
13,639 13,009 630 4.6 13,213 12,330 883 6.7 13,388 12,241 1,147 8.6
16,636 15,878 758 4.6 16,469 15,467 1,002 6.1 16,703 15,340 1,363 8.2
29,893 28,550 1,343 4.5 29,080 27,233 1,847 6.4 29,432 27,057 2,375 8.1
19,814 18,916 898 4.5 19,048 17,999 1,049 5.5 19,278 17,951 1,327 6.9
16,205 15,381 824 5.1 15,448 14,510 938 6.1 15,458 14,423 1,035 6.7
16,331 15,779 552 3.4 15,470 14,745 725 4.7 15,842 14,792 1,050 6.6
16,935 16,166 769 4.5 16,142 15,156 986 6.1 16,275 15,033 1,242 7.6
15,085 14,497 588 3.9 14,843 13,773 1,070 7.2 14,827 13,626 1,201 8.1
14,306 13,760 546 3.8 13,883 13,145 738 5.3 14,035 12,980 1,055 7.5
55,286 53,966 1,320 2.4 53,330 50,036 3,294 6.2 52,401 49,457 2,944 5.6
21,274 20,506 768 3.6 20,843 19,653 1,190 5.7 20,993 19,544 1,449 6.9
50,067 48,510 1,557 3.1 48,624 46,152 2,472 5.1 49,200 46,117 3,083 6.3
14,597 13,993 604 4.1 14,471 13,660 811 5.6 14,761 13,598 1,163 7.9
31,874 31,014 860 2.7 30,724 29,305 1,419 4.6 31,161 29,452 1,709 5.5
22,893 22,381 512 2.2 21,700 20,929 771 3.6 21,958 20,957 1,001 4.6
11,818 11,419 399 3.4 11,356 10,709 647 5.7 11,639 10,729 910 7.8
87,903 84,933 2,970 3.4 89,673 83,163 6,510 7.3 90,199 82,883 7,316 8.1
63,800 61,342 2,458 3.9 63,429 58,822 4,607 7.3 64,298 58,863 5,435 8.5
22,006 21,259 747 3.4 21,846 20,482 1,364 6.2 22,004 20,331 1,673 7.6
26,625 25,918 707 2.7 25,385 24,490 895 3.5 25,826 24,613 1,213 4.7
20,513 18,829 1,684 8.2 19,033 17,577 1,456 7.6 19,131 17,609 1,522 8.0
14,602 14,094 508 3.5 14,591 13,767 824 5.6 14,742 13,688 1,054 7.1
48,660 47,633 1,027 2.1 46,312 44,544 1,768 3.8 46,711 44,603 2,108 4.5
22,111 21,495 616 2.8 21,577 20,091 1,486 6.9 21,578 20,118 1,460 6.8
20,342 19,813 529 2.6 19,413 18,721 692 3.6 19,745 18,815 930 4.7
33,926 33,122 804 2.4 32,768 30,957 1,811 5.5 32,811 30,999 1,812 5.5
32,649 31,440 1,209 3.7 32,460 29,794 2,666 8.2 32,592 29,708 2,884 8.8
32,109 31,121 988 3.1 30,956 29,346 1,610 5.2 31,206 29,186 2,020 6.5
23,331 22,469 862 3.7 22,616 21,071 1,545 6.8 23,062 21,110 1,952 8.5
98,627 95,825 2,802 2.8 98,425 92,592 5,833 5.9 99,247 92,611 6,636 6.7
20,212 19,704 508 2.5 19,893 18,389 1,504 7.6 19,765 18,419 1,346 6.8
17,441 16,920 521 3.0 16,910 15,788 1,122 6.6 17,028 15,820 1,208 7.1
14,216 13,803 413 2.9 13,954 13,330 624 4.5 14,174 13,337 837 5.9
298,037 285,862 12,175 4.1 308,531 270,113 38,418 12.5 312,482 271,463 41,019 13.1
11,958 11,492 466 3.9 11,773 11,035 738 6.3 11,998 11,055 943 7.9
20,330 19,863 467 2.3 19,687 18,534 1,153 5.9 19,642 18,572 1,070 5.4
83,616 81,599 2,017 2.4 80,874 76,153 4,721 5.8 81,137 76,279 4,858 6.0
414,469 404,807 9,662 2.3 409,999 378,259 31,740 7.7 406,895 378,733 28,162 6.9
14,454 13,997 457 3.2 14,299 13,528 771 5.4 14,450 13,530 920 6.4
29,373 28,680 693 2.4 28,434 26,766 1,668 5.9 28,479 26,810 1,669 5.9
24,070 23,303 767 3.2 22,866 21,780 1,086 4.7 22,945 21,813 1,132 4.9
278,238 269,721 8,517 3.1 276,448 262,082 14,366 5.2 280,615 264,622 15,993 5.7
118,366 113,354 5,012 4.2 115,032 107,864 7,168 6.2 117,472 108,570 8,902 7.6
61,336 59,401 1,935 3.2 60,439 57,221 3,218 5.3 60,959 56,805 4,154 6.8
65,341 63,114 2,227 3.4 63,839 59,736 4,103 6.4 64,361 59,610 4,751 7.4
92,670 89,554 3,116 3.4 89,125 84,460 4,665 5.2 90,207 84,009 6,198 6.9
138,279 133,551 4,728 3.4 131,957 124,373 7,584 5.7 134,004 125,160 8,844 6.6
436,014 423,074 12,940 3.0 429,213 408,629 20,584 4.8 435,091 408,815 26,276 6.0
645,219 620,195 25,024 3.9 650,913 591,288 59,625 9.2 658,003 594,403 63,600 9.7
53,467 51,585 1,882 3.5 52,358 49,534 2,824 5.4 53,182 49,624 3,558 6.7
1,105,919 1,077,292 28,627 2.6 1,071,286 1,006,185 65,101 6.1 1,073,421 1,007,788 65,633 6.1
164,401,000 158,544,000 5,857,000 3.6 162, 156, 5,82 3.6 162, 156, 5,88 3.6 3,366,977 3,255,560 111,417 3.3 3,30 3,19 106, 3.2 3,32 3,21 109, 3.3
160,143,000 147,563,000 12,580,000 7.9
3,318,806 3,102,733 216,073 6.5
160,867,000 149,806,00 11,061,000 6.9
3,339,126 3,090,789 248,337 7.4
164,576,000 159,067,000 5,510,000 3.3
3,369,212 3,260,727 108,485 3.2
160,073,000 147,796,000 12,277,000 7.7
3,303,274 3,093,177 210,097 6.4
October 2019 September 2020 October 2020
*2016 Census changes: Micropolitan Areas-Dayton and Brownsville added, Columbia, Harriman, Humboldt, LaFollette deleted. Cities: Mount Juliet added and Union City deleted.
161,053,000 150,433,000 10,620,000 6.6
3,332,952 3,092,118 240,834 7.2
Seasonally Adjusted
Not Seasonally Adjusted
Metropolitan Statistical Areas
Micropolitan Statistical Areas
Cities
6
Chattanooga MSA
Revised Preliminary Net Change
Industry October September October Oct. 2019 Sep. 2020
2019 2020 2020 Oct. 2020 Oct. 2020
Estimated Nonfarm Employment (in thousands)
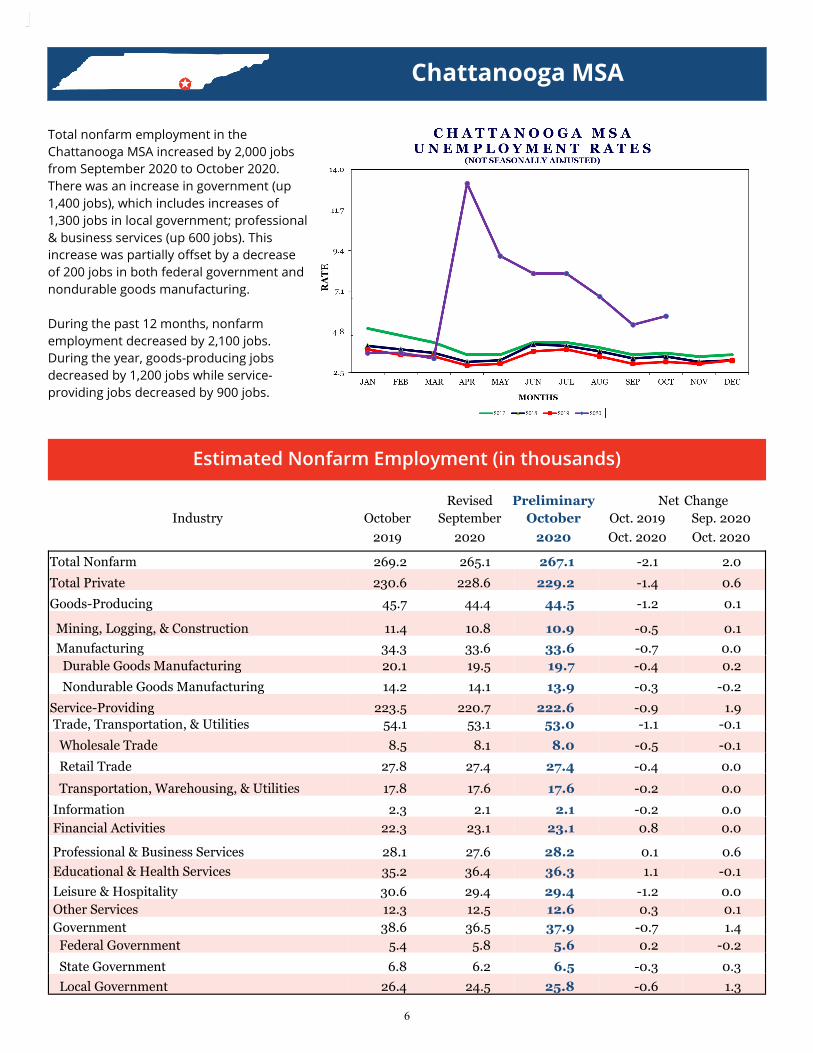
Total Nonfarm 269.2 265.1 267.1 -2.1 2.0
Total Private 230.6 228.6 229.2 -1.4 0.6
Goods-Producing 45.7 44.4 44.5 -1.2 0.1
Mining, Logging, & Construction 11.4 10.8 10.9 -0.5 0.1
Manufacturing 34.3 33.6 33.6 -0.7 0.0
Durable Goods Manufacturing 20.1 19.5 19.7 -0.4 0.2
Nondurable Goods Manufacturing 14.2 14.1 13.9 -0.3 -0.2
Service-Providing 223.5 220.7 222.6 -0.9 1.9
Trade, Transportation, & Utilities 54.1 53.1 53.0 -1.1 -0.1
Wholesale Trade 8.5 8.1 8.0 -0.5 -0.1
Retail Trade 27.8 27.4 27.4 -0.4 0.0
Transportation, Warehousing, & Utilities 17.8 17.6 17.6 -0.2 0.0
Information 2.3 2.1 2.1 -0.2 0.0
Financial Activities 22.3 23.1 23.1 0.8 0.0
Professional & Business Services 28.1 27.6 28.2 0.1 0.6
Educational & Health Services 35.2 36.4 36.3 1.1 -0.1
Leisure & Hospitality 30.6 29.4 29.4 -1.2 0.0
Other Services 12.3 12.5 12.6 0.3 0.1
Government 38.6 36.5 37.9 -0.7 1.4
Federal Government 5.4 5.8 5.6 0.2 -0.2
State Government 6.8 6.2 6.5 -0.3 0.3
Local Government 26.4 24.5 25.8 -0.6 1.3
Total nonfarm employment in the
Chattanooga MSA increased by 2,000 jobs
from September 2020 to October 2020.
There was an increase in government (up
1,400 jobs), which includes increases of
1,300 jobs in local government; professional
& business services (up 600 jobs). This
increase was partially offset by a decrease
of 200 jobs in both federal government and
nondurable goods manufacturing.
During the past 12 months, nonfarm
employment decreased by 2,100 jobs.
During the year, goods-producing jobs
decreased by 1,200 jobs while service-
providing jobs decreased by 900 jobs.

7
Knoxville MSA
Estimated Nonfarm Employment (in thousands)
Total Nonfarm 410.6 398.7 403.1 -7.5 4.4
Total Private 349.2 341.3 344.3 -4.9 3.0
Goods-Producing 60.3 59.2 59.0 -1.3 -0.2
Mining, Logging, & Construction 19.3 20.0 19.6 0.3 -0.4
Manufacturing 41.0 39.2 39.4 -1.6 0.2
Durable Goods Manufacturing 30.8 28.9 29.1 -1.7 0.2
Nondurable Goods Manufacturing 10.2 10.3 10.3 0.1 0.0
Service-Providing 350.3 339.5 344.1 -6.2 4.6
Trade, Transportation, & Utilities 79.6 76.3 77.5 -2.1 1.2
Wholesale Trade 16.4 15.4 15.4 -1.0 0.0
Retail Trade 48.4 46.5 47.7 -0.7 1.2
Transportation, Warehousing, & Utilities 14.8 14.4 14.4 -0.4 0.0
Information 6.0 6.0 6.1 0.1 0.1
Financial Activities 19.7 19.1 19.0 -0.7 -0.1
Professional & Business Services 66.4 66.6 68.4 2.0 1.8
Educational & Health Services 55.5 58.0 57.5 2.0 -0.5
Leisure & Hospitality 45.6 40.7 41.1 -4.5 0.4
Other Services 16.1 15.4 15.7 -0.4 0.3
Government 61.4 57.4 58.8 -2.6 1.4
Federal Government 5.4 6.1 5.6 0.2 -0.5
State Government 20.7 18.2 19.5 -1.2 1.3
Local Government 35.3 33.1 33.7 -1.6 0.6
Revised Preliminary Net Change
Industry October September October Oct. 2019 Sep. 2020
2019 2020 2020 Oct. 2020 Oct. 2020
Total nonfarm employment in the Knoxville
MSA increased by 4,400 jobs from
September 2020 to October 2020. There
were increases in professional & business
services (up 1,800 jobs); government (up
1,400 jobs), which includes increases of
1,300 jobs in state government; retail trade
(up 1,200 jobs).
These increases were partially offset by a
decrease of 500 jobs in federal government
and education and health services.
During the past 12 months, nonfarm
employment decreased by 7,500 jobs.
During the year, goods-producing jobs
decreased by 1,300 jobs while service-
providing jobs decreased by 6,200 jobs.

8
Memphis MSA
Estimated Nonfarm Employment (in thousands)
Industry October
Revised September
Preliminary October
Net Oct. 2019
Change Sep. 2020
2019 2020 2020 Oct. 2020 Oct. 2020
Total nonfarm employment in the Mem-phis MSA increased by 10,200 jobs from September 2020 to October 2020. There were increases in professional & business services (up 5,300 jobs), which includes increases of 4,700 jobs in ad-ministrative/support/waste manage-ment; trade/transportation/utilities (up 2,400 jobs); leisure& hospitality (up 2,100 jobs).
These increases were partially offset by decreases in federal government (down 300 jobs); educational & health services (down 100 jobs).
During the past 12 months, nonfarm employment decreased by 23,900 jobs. During that time, goods-producing jobs decreased by 5,200 jobs, while service-providing jobs decreased by 18,700 jobs.
Total Nonfarm 658.3 624.2 634.4 -23.9 10.2
Total Private 572.0 539.4 549.3 -22.7 9.9
Goods-Producing 68.1 62.8 62.9 -5.2 0.1
Mining, Logging, & Construction 23.7 23.9 23.8 0.1 -0.1
Manufacturing 44.4 38.9 39.1 -5.3 0.2 Durable Goods Manufacturing 26.6 23.5 23.5 -3.1 0.0
Nondurable Goods Manufacturing 17.8 15.4 15.6 -2.2 0.2
Service-Providing 590.2 561.4 571.5 -18.7 10.1
Trade, Transportation, & Utilities 176.6 171.4 173.8 -2.8 2.4
Wholesale Trade 35.0 34.2 34.2 -0.8 0.0
Retail Trade 64.3 64.5 66.1 1.8 1.6
Transportation, Warehousing, & Utilities 77.3 72.7 73.5 -3.8 0.8
Information 5.5 5.4 5.4 -0.1 0.0
Financial Activities 29.5 27.6 27.5 -2.0 -0.1
Professional & Business Services 94.4 88.6 93.9 -0.5 5.3
Professional, Scientific, & Technical Services 23.1 21.0 21.6 -1.5 0.6
Management of Companies & Enterprises 9.8 9.8 9.8 0.0 0.0
Administrative, Support, & Waste Management 61.5 57.8 62.5 1.0 4.7
Educational & Health Services 100.0 96.7 96.6 -3.4 -0.1
Leisure & Hospitality 70.2 61.7 63.8 -6.4 2.1
Other Services 27.7 25.2 25.4 -2.3 0.2
Government 86.3 84.8 85.1 -1.2 0.3
Federal Government 13.7 14.7 14.4 0.7 -0.3
State Government 16.2 15.8 15.9 -0.3 0.1
Local Government 56.4 54.3 54.8 -1.6 0.5
9
Nashville MSA
Estimated Nonfarm Employment (in thousands)
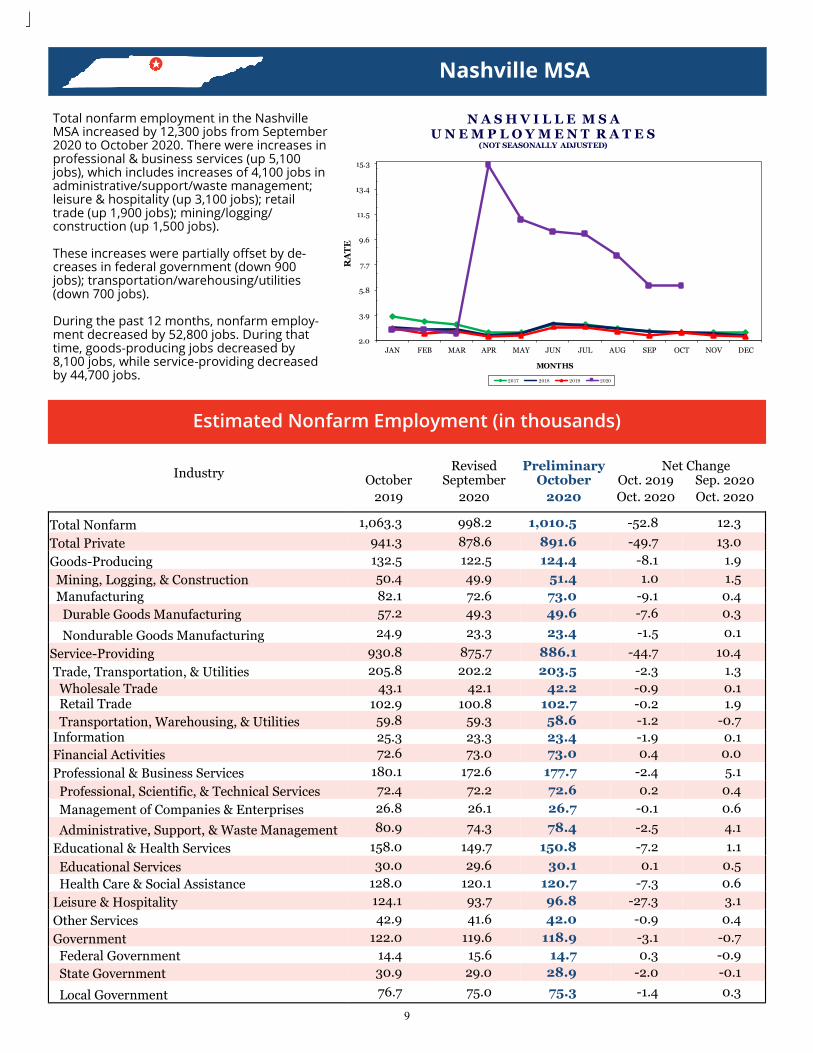
Total nonfarm employment in the Nashville MSA increased by 12,300 jobs from September 2020 to October 2020. There were increases in professional & business services (up 5,100 jobs), which includes increases of 4,100 jobs in administrative/support/waste management; leisure & hospitality (up 3,100 jobs); retail trade (up 1,900 jobs); mining/logging/construction (up 1,500 jobs).
These increases were partially offset by de-creases in federal government (down 900 jobs); transportation/warehousing/utilities (down 700 jobs).
During the past 12 months, nonfarm employ-ment decreased by 52,800 jobs. During that time, goods-producing jobs decreased by 8,100 jobs, while service-providing decreased by 44,700 jobs.
Industry October
Revised September
Preliminary October
Net Oct. 2019
Change Sep. 2020
2019 2020 2020 Oct. 2020 Oct. 2020
Total Nonfarm 1,063.3 998.2 1,010.5 -52.8 12.3
Total Private 941.3 878.6 891.6 -49.7 13.0
Goods-Producing 132.5 122.5 124.4 -8.1 1.9
Mining, Logging, & Construction 50.4 49.9 51.4 1.0 1.5
Manufacturing 82.1 72.6 73.0 -9.1 0.4
Durable Goods Manufacturing 57.2 49.3 49.6 -7.6 0.3
Nondurable Goods Manufacturing 24.9 23.3 23.4 -1.5 0.1
Service-Providing 930.8 875.7 886.1 -44.7 10.4
Trade, Transportation, & Utilities 205.8 202.2 203.5 -2.3 1.3
Wholesale Trade 43.1 42.1 42.2 -0.9 0.1 Retail Trade 102.9 100.8 102.7 -0.2 1.9
Transportation, Warehousing, & Utilities 59.8 59.3 58.6 -1.2 -0.7
Information 25.3 23.3 23.4 -1.9 0.1
Financial Activities 72.6 73.0 73.0 0.4 0.0
Professional & Business Services 180.1 172.6 177.7 -2.4 5.1
Professional, Scientific, & Technical Services 72.4 72.2 72.6 0.2 0.4
Management of Companies & Enterprises 26.8 26.1 26.7 -0.1 0.6
Administrative, Support, & Waste Management 80.9 74.3 78.4 -2.5 4.1
Educational & Health Services 158.0 149.7 150.8 -7.2 1.1
Educational Services 30.0 29.6 30.1 0.1 0.5
Health Care & Social Assistance 128.0 120.1 120.7 -7.3 0.6
Leisure & Hospitality 124.1 93.7 96.8 -27.3 3.1
Other Services 42.9 41.6 42.0 -0.9 0.4
Government 122.0 119.6 118.9 -3.1 -0.7
Federal Government 14.4 15.6 14.7 0.3 -0.9
State Government 30.9 29.0 28.9 -2.0 -0.1
Local Government 76.7 75.0 75.3 -1.4 0.3
2.0
3.9
5.8
7.7
9.6
11.5
13.4
15.3
JAN FEB MAR APR MAY JUN JUL AUG SEP OCT NOV DECR
AT
E
MONTHS
N A S H V I L L E M S A U N E M P L O Y M E N T R A T E S
(NOT SEASONALLY ADJUSTED)
2017 2018 2019 2020

10
Clarksville MSA is Montgomery County, Christian County, KY, & Trigg County, KY. Cleveland MSA is Bradley & Polk counties. Jackson MSA is Chester, Crockett, & Madison counties. Johnson City MSA is Carter, Unicoi, & Washington counties. Kingsport-Bristol MSA is Hawkins County, Sullivan County, Scott County, VA, Wash-ington County, VA, & Bristol City, VA. Morristown MSA is Hamblen & Jefferson counties.
Clarksville, TN-KY MSA Cleveland, TN MSA Jackson, TN MSA
Sep. 2020 Oct. 2020 Sep. 2020 Oct. 2020 Sep. 2020 Oct. 2020
Revised Prelim. Revised Prelim. Revised Prelim.
Johnson City, TN MSA Kingsport-Bristol, TN-VA MSA Morristown, TN MSA
Sep. 2020 Oct. 2020 Sep. 2020 Oct. 2020 Sep. 2020 Oct. 2020
Revised Prelim. Revised Prelim. Revised Prelim.
Total Nonfarm 77,600 77,900 114,100 115,500 46,000 46,800
Total Private 61,500 61,700 97,900 99,400 39,500 40,000
Goods Producing 10,400 10,400 25,200 25,700 14,400 14,300
Mining, Logging & Construction 2,400 2,300 6,100 6,400 1,900 1,800
Manufacturing 8,000 8,100 19,100 19,300 12,500 12,500
Service Providing 67,200 67,500 88,900 89,800 31,600 32,500
Trade, Transportation, & Utilities 13,300 13,300 22,800 22,700 9,600 9,700
Wholesale Trade 2,300 2,300 3,000 3,000 1,200 1,300
Retail Trade 10,100 10,100 15,400 15,300 6,100 6,000
Transportation, Warehousing, & Utilities 900 900 4,400 4,400 2,300 2,400
Information 1,000 1,000 1,100 1,200 300 300
Financial Activities 4,600 4,600 3,700 3,700 900 900
Professional & Business Services 7,900 8,100 11,400 11,900 3,500 3,800
Educational & Health Services 13,600 13,600 16,700 16,700 5,800 5,900
Leisure & Hospitality 8,000 8,000 11,400 12,000 3,800 3,900
Other Services 2,700 2,700 5,600 5,500 1,200 1,200
Government 16,100 16,200 16,200 16,100 6,500 6,800
Federal Government 3,200 3,100 1,100 900 400 300
State Government 5,400 5,400 2,300 2,300 1,400 1,500
Local Government 7,500 7,700 12,800 12,900 4,700 5,000
Total Nonfarm 90,800 91,900 48,500 48,300 66,600 67,000
Total Private 73,100 73,900 42,700 42,700 52,600 52,900
Goods Producing 16,700 16,900 10,600 10,700 13,900 14,000
Mining, Logging & Construction 3,400 3,500 1,900 1,900 3,000 3,000
Manufacturing 13,300 13,400 8,700 8,800 10,900 11,000
Service Providing 74,100 75,000 37,900 37,600 52,700 53,000
Trade, Transportation, & Utilities 18,400 18,500 10,400 10,400 11,400 11,500
Wholesale Trade N.A. N.A. 800 800 2,800 2,800
Retail Trade 13,300 13,400 5,400 5,400 7,100 7,200
Transportation, Warehousing, & Utilities 2,500 2,500 4,200 4,200 1,500 1,500
Information 900 900 300 200 500 500
Financial Activities 3,100 3,100 1,300 1,300 2,100 2,100
Professional & Business Services 8,700 9,100 6,700 6,500 6,300 6,700
Educational & Health Services 11,800 11,800 5,700 5,700 10,600 10,500
Leisure & Hospitality 10,300 10,400 5,400 5,500 5,900 5,700
Other Services 3,200 3,200 2,300 2,400 1,900 1,900
Government 17,700 18,000 5,800 5,600 14,000 14,100
Federal Government 4,800 4,800 400 300 600 500
State Government 2,300 2,300 800 800 1,900 2,000
Local Government 10,600 10,900 4,600 4,500 11,500 11,600

11
U.S. Consumer Price Index — October 2020
All Employee Hours And Earnings
3.0
7.3
11.6
15.9
JAN FEB MAR APR MAY JUN JUL AUG SEP OCT NOV DEC
RATE
T E N N E S S E E & U N I T E D S T A T E S
U N E M P L O Y M E N T R A T E S(Seasonally Adjusted/ TN Solid Line)
2017 2018 2019 2020 2017-US 2018-US 2019-US 2020-US
Group
U.S. City Average All Items (1982-84=100) Food and beverages
Housing
Apparel
Transportation
Medical care
South All Items (1982-84=100) Food and beverages
Housing
Apparel
Transportation
Medical care
Index
1.3
1.9 0.0
Yearly
250.542
-5.5-3.52.9
1.3
-0.3
273.014119.172
203.086520.725
-2.70.4
3.60.1
-6.3
-0.2
3.5
Yearly
0.10.3
2.0
3.80.00.3
0.2
254.076268.349269.363118.681203.174528.847
502.577
-5.5-2.93.3
3.6
0.2-0.2
2.1
200.128-0.3
Monthly
-5.9-3.23.3
1.2
0.00.10.0-0.4
All Urban Consumers Wage & Clerical Earners
260.388269.169
0.00.3
Percent Change
1.2
Index Monthly
265.137251.051126.286202.628491.017
2.1
245.847264.115251.388124.382
Percent Change
0.30.10.5-0.1
4.0
0.1
Hours And Earnings Of Production Workers
Average Weekly Earnings Average Hourly Earnings Average Weekly Hours
Oct. Sep. Oct. Oct. Sep. Oct. Oct. Sep. Oct.
2019 2020 2020 2019 2020 2020 2019 2020 2020
Manufacturing $819.81 $785.62 $801.72 $19.85 $20.62 $20.40 41.3 38.1 39.3
Durable Goods Manufacturing $828.76 $819.50 $829.58 $19.97 $21.68 $21.66 41.5 37.8 38.3
Non-Durable Goods Manufacturing $803.69 $731.82 $755.42 $19.65 $18.91 $18.47 40.9 38.7 40.9
Average Weekly Earnings Average Hourly Earnings Average Weekly Hours
Oct. Sep. Oct. Oct. Sep. Oct. Oct. Sep. Oct.
2019 2020 2020 2019 2020 2020 2019 2020 2020
Total Private $850.85 $878.08 $888.15 $24.31 $25.16 $25.16 35.0 34.9 35.3
Goods-Producing $1,031.02 $1,021.16 $1,040.80 $25.27 $26.05 $26.02 40.8 39.2 40.0
Mining, Logging & Construction $1,082.20 $1,021.22 $1,056.26 $26.14 $26.32 $26.21 41.4 38.8 40.3
Manufacturing $1,011.75 $1,019.44 $1,035.01 $24.92 $25.94 $25.94 40.6 39.3 39.9
Private Service-Providing $812.89 $847.96 $855.44 $24.05 $24.94 $24.94 33.8 34.0 34.3
Trade, Transportation, & Utilities $774.84 $812.93 $817.88 $22.59 $23.77 $23.57 34.3 34.2 34.7
Information $1,081.55 $1,135.79 $1,125.82 $29.47 $30.45 $30.51 36.7 37.3 36.9
Financial Activities $1,265.30 $1,332.98 $1,365.24 $33.21 $36.52 $37.20 38.1 36.5 36.7
Professional & Business Services $1,013.86 $1,029.19 $1,042.72 $27.93 $28.12 $28.03 36.3 36.6 37.2
Education & Health Services $808.18 $835.65 $835.90 $23.77 $23.74 $23.68 34.0 35.2 35.3
Leisure & Hospitality $412.34 $394.20 $398.93 $14.94 $14.60 $14.83 27.6 27.0 26.9
Other Services $726.68 $795.26 $795.85 $22.78 $24.32 $24.19 31.9 32.7 32.9


![How The Government Shutdown Affects Your Credit and Finances [Infographic]](https://img.pdfslide.net/doc/110x75/5568fa86d8b42aff2e8b4ea9/how-the-government-shutdown-affects-your-credit-and-finances-infographic.jpg)