Embed Size (px)
Citation preview

Working Paper Series: WP No 1605
The Impact of the Real Effective Exchange Rate on Real Export Earnings in Bangladesh
Rubana Hassan
Shampa Chakraborty
Nasrin Sultana
Md. Mokhlesur Rahman
May, 2016
Monetary Policy and Research Department
Bangladesh Bank

1
The Impact of the Real Effective Exchange Rate on Real Export Earnings in Bangladesh
Rubana Hassan1
Shampa Chakraborty
Nasrin Sultana
Md. Mokhlesur Rahaman
Abstract
The purpose of this study is to estimate the long run and short run effects of the Real Effective
Exchange Rate (REER) on real export earnings of Bangladesh. This paper uses the unit root tests,
cointegration techniques, and the Error Correction Model (ECM) with time series data for the period from
2003M6 to 2015M5. The main findings of the study demonstrate that the REER has a significant impact on
real export earnings in the long run while it has no effect in the short run. The study shows that appreciation
in the REER has a negative impact on real export earnings in Bangladesh. This study has policy implications
in designing monetary framework to influence the REER in other developing economics as well as in
Bangladesh.
Keywords: Real effective exchange rate, cointegration, export earnings, VECM
JEL Classification: C22, F31, F43
1
The authors of this article Rubana Hassan and Nasrin Sultana are Joint Directors of Monetary Policy Department
and Shampa Chakraborty and Md. Mokhlesur Rahaman are Joint Directors of Research Department at Bangladesh
Bank. The views expressed are the authors' own and do not reflect that of Bangladesh Bank. The authors would like to
thank Khawaja Mamun, Anupam Das and Aasha Mehreen Amin for their valuable comments. The authors are also
thankful to Chief Economist and Economic Advisor of Bangladesh Bank for their important suggestions to improve this
paper. Corresponding author's email : [email protected]

2
1. Introduction
The Real Effective Exchange Rate (REER) is an important determinant of measuring the global
competitiveness of a country and, therefore, has a strong influence on export earnings, improvements in
balance of payments and long term growth (Soutar and Santoya 2011). Hence, the impact of the REER on
real export earnings is an important issue of discussion for many developed and developing countries.
Guechari (2012), for instance, finds a significant positive and negative impact of the REER in the long and
short run respectively in Algeria's total trade balance. Aziz (2012) explores the impact of real devaluation on
the trade balance in Bangladesh during the period of 1976-2009 and finds a significantly positive impact of
the REER devaluation on the trade balance. Younus and Chowdhury (2014) estimate the depreciation effect
of the real exchange rate on Bangladesh’s exports, imports and trade balance. The estimated result shows
that the real exchange rate has a significant impact on export, import and trade balance in the short and long
run indicating a reverse L-shaped impact. The empirical results, however, does not find any significant
relation among the REER, trade balance, imports and exports. This raises a number of questions such as: 1)
how does an appreciation or depreciation of the REER impact on real export earnings in the short and long
run in Bangladesh? 2) Can Bangladesh maintain export competitiveness by intervening in the foreign
exchange market?
As part of the trade policy reform, Bangladesh formally adopted a floating exchange rate regime
since May 31, 2003 (Circular no. 01, 2003). To keep exports competitive, Bangladesh Bank continues to
operate a managed floating of the Bangladeshi taka. But in recent time between FY12 to FY14, the REER
has appreciated by 17.29 percent (Bangladesh Bank, Annual Report 2013-14). Overall, the REER has been
appreciated by 27.77 percent from FY06 to FY14.
Numerous empirical studies show how the REER affects the trade balance in the long and short run
(Guechari 2012, Aziz 2012, Younus and Chowdhury 2014). But, this paper tries to analyze the effect of the
REER on real export earnings. It should be noted that there is no published paper on the effect of the REER,
only on real export earnings for the economy of Bangladesh. Hence, this study aims to fill this gap.
This paper can be differentiated from the mentioned studies by the sample size, types of data, base
year of the REER (base year is 2010-11), and the number of countries included in the currency basket for
calculating the REER. This study finds convincing evidence in support of the loss of competitiveness of
exports due to the REER appreciation in Bangladesh.
The rest of the paper is organized as follows: section 2 provides an overview of policies related to
exports and exchange rates. Section 3 presents the empirical studies related to the paper, section 4 contains
3
data analysis, model specifications and section 5 includes empirical results and diagnostic tests. Finally,
section 6 presents policy recommendations and concluding remarks.
2. An overview of policies related to exports and exchange rate related policies
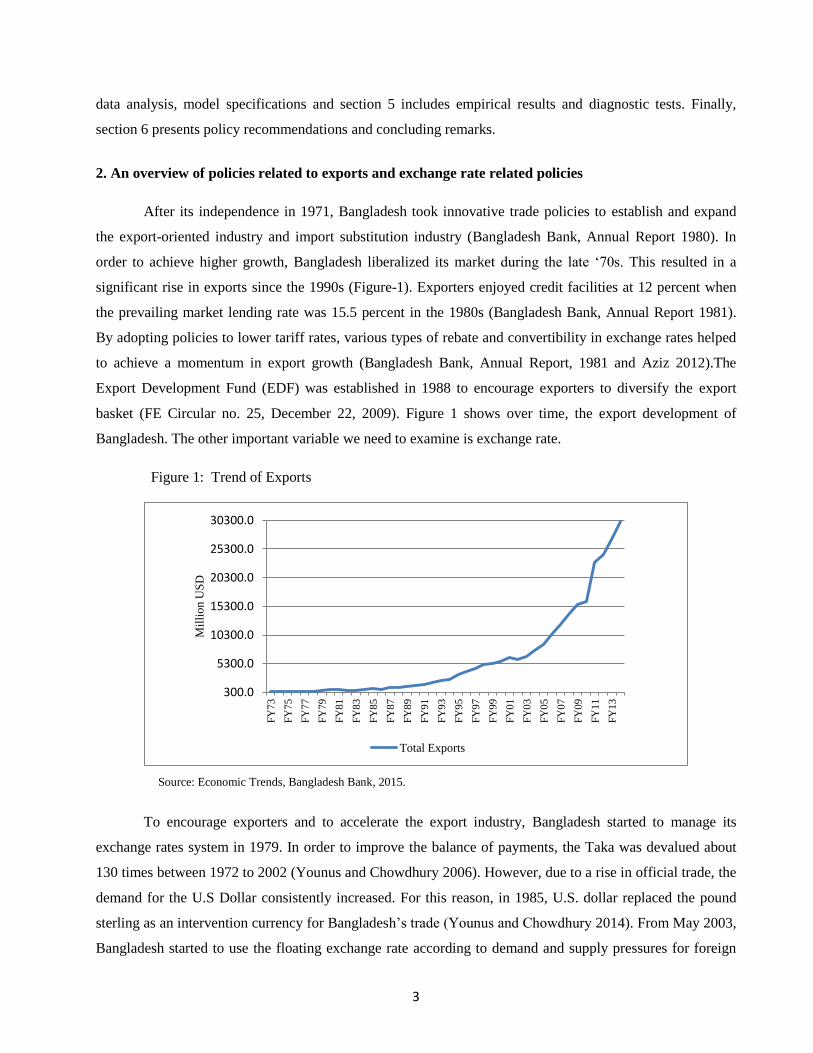
After its independence in 1971, Bangladesh took innovative trade policies to establish and expand
the export-oriented industry and import substitution industry (Bangladesh Bank, Annual Report 1980). In
order to achieve higher growth, Bangladesh liberalized its market during the late ‘70s. This resulted in a
significant rise in exports since the 1990s (Figure-1). Exporters enjoyed credit facilities at 12 percent when
the prevailing market lending rate was 15.5 percent in the 1980s (Bangladesh Bank, Annual Report 1981).
By adopting policies to lower tariff rates, various types of rebate and convertibility in exchange rates helped
to achieve a momentum in export growth (Bangladesh Bank, Annual Report, 1981 and Aziz 2012).The
Export Development Fund (EDF) was established in 1988 to encourage exporters to diversify the export
basket (FE Circular no. 25, December 22, 2009). Figure 1 shows over time, the export development of
Bangladesh. The other important variable we need to examine is exchange rate.
Figure 1: Trend of Exports
Source: Economic Trends, Bangladesh Bank, 2015.
To encourage exporters and to accelerate the export industry, Bangladesh started to manage its
exchange rates system in 1979. In order to improve the balance of payments, the Taka was devalued about
130 times between 1972 to 2002 (Younus and Chowdhury 2006). However, due to a rise in official trade, the
demand for the U.S Dollar consistently increased. For this reason, in 1985, U.S. dollar replaced the pound
sterling as an intervention currency for Bangladesh’s trade (Younus and Chowdhury 2014). From May 2003,
Bangladesh started to use the floating exchange rate according to demand and supply pressures for foreign
300.0
5300.0
10300.0
15300.0
20300.0
25300.0
30300.0
FY
73
FY
75
FY
77
FY
79
FY
81
FY
83
FY
85
FY
87
FY
89
FY
91
FY
93
FY
95
FY
97
FY
99
FY
01
FY
03
FY
05
FY
07
FY
09
FY
11
FY
13
Mil
lio
n U
SD
Total Exports

4
currencies in the inter-bank market in Bangladesh to stabilize the exchange rate (Bangladesh Bank, Annual
Report 2004). Bangladesh Bank often intervenes in the inter-bank market to control the volatility of the
money market to ensure market friendly exchange rates. Actually, exchange rate policies influence
Bangladesh’s trade balance which means exchange rate policies may have a significant impact on the export
(Aziz 2008).
3. Literature Review
In the last fifteen years, researchers have been studying this interesting topic (Guechari 2012, Genc
2014, Fidan 2006, Cheung and Sengupta 2012, Mehare and Edriss 2012, Fang, Lai and Miller 2005, Aziz
2012, Alam 2010, Younus and Chowdhury 2014). Guechari (2012) investigates the short and long run
effects of the REER on Algeria’s trade balance. The study is divided into two cases: the general case
(Algeria-world case) and the specific case (Algeria-France and Algeria-US case). Using the cointegration,
Error Correction Model (ECM) and impulse response techniques with time series data covering 1981Q1-
2009Q4, the author finds that the REER has a significant impact (positive in the long run and negative in the
short run) on the Algeria’s bilateral trade balance with US and France, and on the total trade balance.
Exchange rates can affect not only exports but also imports but the relationship varies from country
to country and region to region. Using the panel cointegration method, Genc (2014) explores the impact of
the exchange rate on imports and exports in economically developing countries separately for the period of
1985-2012. The findings indicate that in the long run, there is a cointegrated relationship between effective
exchange rates and exports-imports of emerging countries. In the case of Turkey, Fidan (2006) uses similar
techniques and observes a smaller impact of the REER on exports and imports in the short run.
Cheung and Sengupta (2012) examine the effects of the REER on specific types of exports instead of
total exports. Their study explores the effects of the REER on the share of exports of Indian non-financial
sector firms for the period 2000 to 2010. The empirical analysis reveals that firms with small export shares
are more affected by the real effective exchange rate fluctuations.
With the help of annual time series data (1992-2010) from various institutions in Ethiopia’s and
using the autoregressive distributive lag (ARDL) method, Mehare and Edriss (2012) show that the effect of
the exchange rate variability on export of oilseeds of Ethiopia. The hypothesis is that ‘there is no short run
and long run relationship between export of oilseeds and explanatory variables included in the model’. The
outcome shows a negative relationship between oilseeds’ exports and exchange rates variability. The terms
of trade (TOT) is found to be negative and significant. The underlined hypothesis is rejected confirming that
there is only a long run relationship between export of oilseeds and other explanatory variables.

5
Due to the limitations or unavailability of relevant data, particularly the REER index data in
Bangladesh, studies explain the dynamics of the REER changes in the context of Bangladesh. Aziz (2012)
explores the impact of real devaluation on the trade balance in Bangladesh during the period of 1976-2009.
The empirical results show a significant positive impact of the REER devaluation on the trade balance in
Bangladesh. Error correction model, multivariate cointegration tests and impulse response functions are used
to test the impact of the exchange rate policy in both the short and long run. The author also finds the
existence of a J-curve effect in Bangladesh.
Alam (2010) uses cointegration test, Granger causality test from the VAR model. The author
concludes that the real exchange rate and export earnings have no significant relation in Bangladesh using
yearly data from 1977-2005.
Younus and Chowdhury (2014) estimate the depreciation effect of the real exchange rate on
Bangladesh’s exports, imports and trade balance. The paper includes real exchange rate, REER, domestic
income and foreign income in the model to examine the behavior of the trade balance. Authors use
cointegration techniques, vector error correction model and impulse response functions derived from the
unrestricted VAR for time series data covering 2003M6-2014M6. The estimated result shows that the real
exchange rate has significant impact on exports, imports and trade balance both in the short run and the long
run which also indicates the reverse L-shaped impact. But the empirical result does not find any significant
relation among the REER, trade balance, imports and exports.
It is important to note that, almost all past studies are based on the impact of the real exchange rate
and other variables on trade balance and used yearly or quarterly data. In this paper, monthly data has been
used which should better represent the relationship between the REER and real export earnings. Younus and
Chowdhury (2014) show that trade-weighted REER has no significant effect either on the trade balance or
exports or imports. This paper is different from the study of Younus and Chowdhury due to the sample size
of data, base year and number of countries included in the currency basket for calculating the REER.
During the period from June 2003 to May 2015, the data for the REER is available in two base
periods 2010-11 and 2000-01. Therefore, in the study, all values of REER have been converted into 2010-11
base instead of 2000-01 base within the period. The previous study used eight major trading partner
countries' exchange rates and the consumer price index for calculating the REER (Younus and Chowdhury
2014). In the study, the REER is calculated by using ten major trading partner countries' exchange rates and
the consumer price index which indicates an increased competitiveness of Bangladesh in the international
market.

6
The ten major trading partners (India, Japan, Euro Area, China, Singapore, USA U.K, Malaysia,
Korea and Canada) together account for almost 80 percent of total trade with Bangladesh whereas the eight
major trading partners account for 60 percent of total trade with Bangladesh. The three newly added
countries (Malaysia, Korea and Canada) account for about 12 percent of total trade with Bangladesh (Policy
Note, MPD, BB 2014). So, the reasons mentioned above may differ with the results in this study from the
findings of other mentioned papers. In the following section we will discuss the data, model specification
and empirical results that will help to understand the relationship between real export earnings and the
REER.
4. Data, Model Specification and Empirical results
4.1 Data:
The variables of the REER and real export earnings have been collected from the Bangladesh Bank.
This series starts from June 2003 and ends in May 2015. The data for real export earnings is constructed
using export earnings adjusted by consumer price index (CPI) of Bangladesh. CPI data is collected from the
International Financial Statistics Site published by IMF (2015). The REER and real export earnings - both
variables - are expressed in log form and real export earnings are in million taka terms. Base years 2010-11
and 2010 have been used for the REER and CPI respectively. The REER, itself is an index calculated by
using the exchange rate and consumer price indices of ten major trading partner countries.
The REER has been calculated by using following formula:
jt jit
where, NEERjit= itEit , j implies the home country, i stands for trading partner countries (i=1.....k), t
indicates time, wi is the trade weight of trading partner countries, Ei indicates the bilateral exchange rates
between the home country and its trading partner countries, pit indicates the price level of home country and
p*jt implies the price level of trade partner countries.
The following figure delineates the movement of both the REER and the NEER in Bangladesh for the
period of June 2003 to May 2015. It shows the NEER is steadily declining over the sample period, while the
REER follows a steadily upward trend. Thus, an appreciation of the REER indicates that the domestic price
level in Bangladesh is rising over the reported period compared to its trading partner countries.

7
Figure 2: Trends of the REER and NEER in Bangladesh
Source: Monetary Policy Department, Bangladesh Bank, 2015
4.2 Model Specification
The empirical model can be written as,
where,
REXP = Real Export Earnings
REER = Real Effective Exchange Rate
A log-linear time series specification for studying the real effective exchange rate effects is given
by:
1 t
where, β0 is the constant, β1 is the co-efficient of the REER and t indicates error term with zero mean
and constant variance.
An appreciation of the REER of taka is expected to lower the demand for Bangladesh's products.
Depending on the absolute value of 1, Bangladesh's exports can be price-elastic ( or price inelastic
40
50
60
70
80
90
100
110
120
130
140
20
03
M6
20
03
M1
1
20
04
M4
20
04
M9
20
05
M2
20
05
M7
20
05
M1
2
20
06
M5
20
06
M1
0
20
07
M3
20
07
M8
20
08
M1
20
08
M6
20
08
M1
1
20
09
M4
20
09
M9
20
10
M2
20
10
M7
20
10
M1
2
20
11
M5
20
11
M1
0
20
12
M3
20
12
M8
20
13
M1
20
13
M6
20
13
M1
1
20
14
M4
20
14
M9
20
15
M2
Ind
ex V
alue
REER NEER

8
.1 If the coefficient on the REER is not different from zero, Bangladesh's exports can be
interpreted as unresponsive to the real exchange rate-based trade liberalization.
5. Empirical Results and Diagnostic Tests
5.1 Test for order of Integration
Nelson and Plosser (1982) find that unit-root processes distinguish most macroeconomics variables.
The time series behavior of each of the series using the Augmented Dickey-Fuller is represented in the table
below.
Table 1: Augmented Dickey-Fuller Test
Variables Model Level First Difference Integration
lnREXP Intercept and Trend -1.40
(0.58)
-2.88
(0.04)**
I(1)
lnREER Intercept -0.35
(0.91)
-8.61
(0.00)*
I(1)
Note: The null hypothesis states that the variable has a unit root. p-values are shown in the parentheses following each
adjusted t -statistics. * and ** indicate significant at 1 percent level and 5 percent level respectively.
The above results show (in table 1) that both variables are non- stationary and exhibit unit roots.
Thus, all of them are integrated of order one, I(1) and ready for the cointegration test.
5.2. Granger causality test
Granger causality test is used to examine the causality between real export earnings and the REER,
especially in the short-run (Yaya and Lu 2012). Based on this test, it’s possible to determine the direction of
causality between two variables.
Table 2: Granger Causality Test
Null Hypothesis Observations F-Statistic Prob
DREER does not Granger Cause DREXP 122 0.96 0.049*
DREXP does not Granger Cause DREER 1.25 0.026*
Note: * indicates 5 percent level of significance.
1 Asian Development Bank (2007) has developed a view: “The depreciation (appreciation) of a currency lowers (raises) the foreign-
currency price of exports but also increases (reduces) the home currency price of component imports. To the extent that import
content costs rise (decline), this will offset any expansion in demand induced by depreciation (appreciation)''.

9
In the above table the results indicate that DREER does granger cause of DREXP as well as
DREXP does granger cause of DREER. The findings imply that in the short run, a change in the REER does
cause a movement in the real export earnings and vice versa.
5.3. Cointegration test
The Johansen cointegration test procedure uses two tests to determine the number of cointegration
vectors: The Maximum Eigen value test and the Trace test (Asari, Baharuddin, Jusoh, Mohamad, Shamsudin
and Jusoff 2011). The Maximum Eigen value statistic tests the null hypothesis of cointegrating relations
against the alternative of r+1 cointegrating relations for r = 0, 1, 2…n-1.
This test statistics are computed as:
where λ is the Maximum Eigen value and T is the sample size. Trace statistics investigate the null
hypothesis of r cointegrating relations against the alternative of n cointegrating relations, where n is the
number of variables in the system for r = 0, 1, 2…n-1.
The equation is computed according to the following formula:
In some cases Trace and Maximum Eigen value statistics may yield different results, in which case
the results of Maximum Eigen value test should be preferred (Asari et.al 2011).
Table 3: Johansen’s Co-integration Test
Null Hypothesis Alternative
Hypothesis
Trace test
Statistics
5% Critical Value
r = 0* r = 1 29.86 25.87
r ≤ 1 r = 2 7.04 12.52
Maximum Eigen Value
Statistics
5% Critical Value
r = 0** r = 1 22.82 19.39
r ≤ 1 r = 2 7.04 12.52
Note: r denotes the number of cointegrating relations. * and ** denote rejection of null hypothesis at the 5 percent level.

10
Based on the Schwarz Bayesian Criterion (SBC) and minimum lag requirement for stability, thirteen
lags [just over a year] are selected for both variables as the optimal lag length. Both Trace and Maximal
Eigen Value tests exhibit no evidence of cointegration under option 3 but they indicate one cointegration
under option 4.
The existence of a cointegration relationship among the two I(1) variables implies that there exists a
long-term relation between real export earnings and the REER (Enders 2010). The estimated long run
equation is given below:
The cointegration equation shows a long run relationship between REXP and the REER in lag level
form. The relationship between REXP and the REER is significant at 5 percent level and the value in
parentheses against the coefficient is standard error. The coefficient of the REER appears with a negative
sign in the cointegration equation, suggesting that, with the appreciation of the REER the price of domestic
goods increase. So exports seem expensive to foreigners as a result of a decrease in real export earnings.
5.4. Vector Error Correction (VEC) Model
The vector error correction model restricts the long run behavior of the endogenous variables to
converge to their cointegrating relationships while allowing for short run adjustment dynamics (Khan and
Hossain 2010).
Since lnREXP and lnREER are cointegrated, a vector error correction model representation could
have the following form:
1j t-j t-1 t
where, is the first difference and ut is the error term with mean zero.
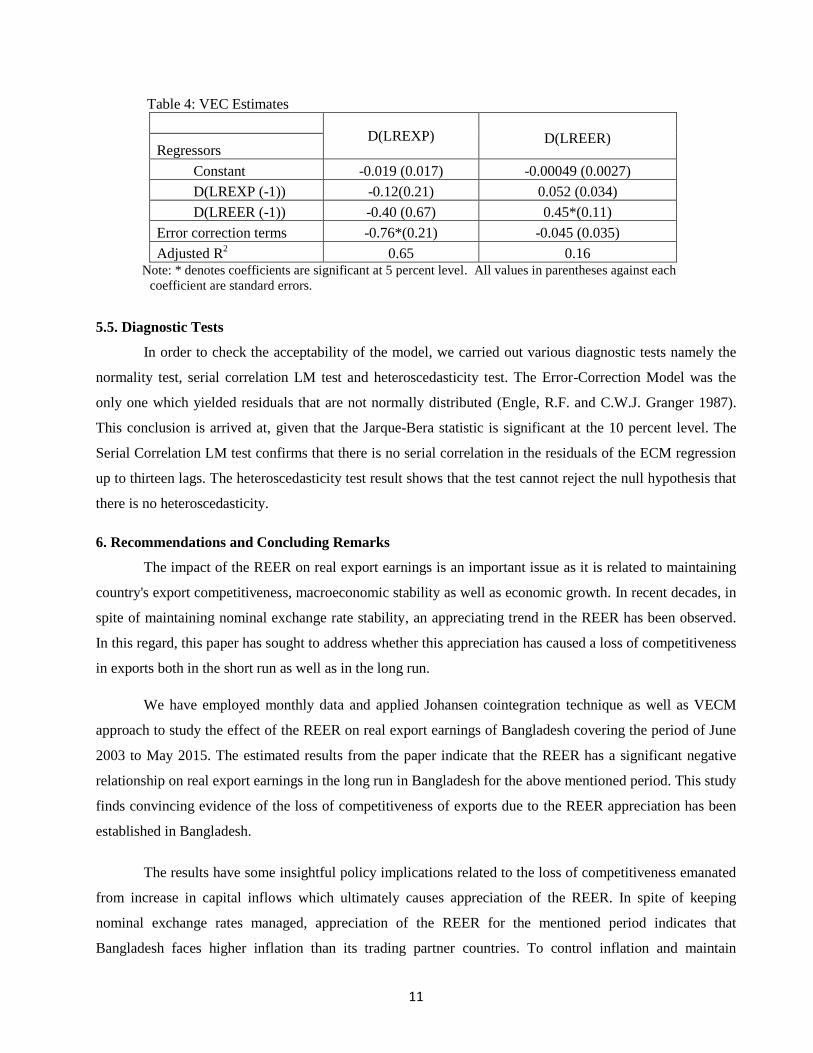
Table 4 presents VEC estimates with Bangladesh's real export earnings (REXP) and the REER. The
corresponding sign of the first differenced REER is negative but insignificant. The error correction term has
a negative sign as expected that is -.76 which is statistically significant. This implies that 76 percent of the
last month's disequilibrium is corrected this month, requiring only 1.32 months to bring the system into the
steady state once it is disturbed.
11
Table 4: VEC Estimates
D(LREXP)
D(LREER) Regressors
Constant -0.019 (0.017) -0.00049 (0.0027)
D(LREXP (-1)) -0.12(0.21) 0.052 (0.034)
D(LREER (-1)) -0.40 (0.67) 0.45*(0.11)
Error correction terms -0.76*(0.21) -0.045 (0.035)
Adjusted R2 0.65 0.16
Note: * denotes coefficients are significant at 5 percent level. All values in parentheses against each
coefficient are standard errors.
5.5. Diagnostic Tests
In order to check the acceptability of the model, we carried out various diagnostic tests namely the
normality test, serial correlation LM test and heteroscedasticity test. The Error-Correction Model was the
only one which yielded residuals that are not normally distributed (Engle, R.F. and C.W.J. Granger 1987).
This conclusion is arrived at, given that the Jarque-Bera statistic is significant at the 10 percent level. The
Serial Correlation LM test confirms that there is no serial correlation in the residuals of the ECM regression
up to thirteen lags. The heteroscedasticity test result shows that the test cannot reject the null hypothesis that
there is no heteroscedasticity.
6. Recommendations and Concluding Remarks
The impact of the REER on real export earnings is an important issue as it is related to maintaining
country's export competitiveness, macroeconomic stability as well as economic growth. In recent decades, in
spite of maintaining nominal exchange rate stability, an appreciating trend in the REER has been observed.
In this regard, this paper has sought to address whether this appreciation has caused a loss of competitiveness
in exports both in the short run as well as in the long run.
We have employed monthly data and applied Johansen cointegration technique as well as VECM
approach to study the effect of the REER on real export earnings of Bangladesh covering the period of June
2003 to May 2015. The estimated results from the paper indicate that the REER has a significant negative
relationship on real export earnings in the long run in Bangladesh for the above mentioned period. This study
finds convincing evidence of the loss of competitiveness of exports due to the REER appreciation has been
established in Bangladesh.
The results have some insightful policy implications related to the loss of competitiveness emanated
from increase in capital inflows which ultimately causes appreciation of the REER. In spite of keeping
nominal exchange rates managed, appreciation of the REER for the mentioned period indicates that
Bangladesh faces higher inflation than its trading partner countries. To control inflation and maintain

12
exchange rate stability, the central bank tries to sterilize the excess capital inflows through open market
operation. However, open market operation has some practical limits which include high fiscal cost,
ineffectiveness to sterilize the capital inflows. This ultimately encourages capital inflows further by raising
interest rates and the lack of availability of financial instruments stems from less developed financial markets
in developing countries. Capital inflows, therefore, can be sterilized partially and exchange rate stability can
be achieved in the short run for developing countries (Lee, 1997). As a whole, long term policy measures are
required to sterilize the capital inflows, maintain the exchange rate stability as well as export competitiveness
in Bangladesh, such as:
1) Sterilization should be accompanied by increase in reserve requirement or tightening the access of central
bank credit with a view to reducing the monetary base and containing inflation as well.
2) Bringing efficiency in the financial system, turning to more market based exchange rate-as well as making
the economy financially more liberalized can be a step forward in developing the financial market.
3) Changing discount policy can be a way to contract the money supply as well as inflation. There remains
the fear of increasing the lending rates, however, in case of developing countries, increased discount rates do
not necessarily increase the lending rates, thereby, it helps to contract the money supply without reducing
economic activity (Lee 1997).
4) In order to sterilize the persistent capital inflows, the central bank can take other policy measures such as
encouraging private investment overseas and allowing the foreigners to borrow from the local markets.
5) Widening the exchange rate by allowing the exchange rates to appreciate to some extent can be a policy
initiative also.
6) Along with the policy measures for reducing appreciation of the REER, other policy measures are
required to boost exports in Bangladesh which comprises investment on human capital, widening the scope
of technological innovation, reducing infrastructure inadequacies, promoting export diversification, more
value addition to export and exploring new markets for exportable products etc.
Overall, the estimated result over the above sample period indicates that appreciation to the REER
has an adverse impact on exports that is also similar to other studies on developing countries.

13
References
Alam, R. (2010). The Link between real exchange rate and export earning: A cointegration and Granger
causality analysis on Bangladesh. International review of Business Research papers, 6(1), 205-214.
Asian Development Bank (ADB). (2007). Asian Development Outlook 2007 Update. Manila: Export
Dynamics in East Asia. ADB.
Annual Report. (1980, 1981, 2003 & 2004), Bangladesh Bank.
Arize, A. C. (2001). Traditional Export Demand Relation and Parameter Instability: An Empirical
Investigation. Journal of Economic Studies, 28(6), 378–396.
Asari, F. F. A. H., Baharuddin, N. S., Jusoh, N., Mohamad, Z., Shamsudin, N., & Jusoff, K. (2011). A vector
error correction model (VECM) approach in explaining the relationship between interest rate and
inflation towards exchange rate volatility in Malaysia. World Applied Sciences Journal, 12(3), 49-56.
Athukorala, P. C. (1981). Import Substitution, Structural Transformation and Import Dependence: A Case
Study of Sri Lanka. Developing Economies, 19(2), 119–142.
Aziz, N. (2012). Does a real devaluation improve the balance of trade?: empirics from Bangladesh economy.
The Journal of Developing Areas, 46(2), 19-41.
Balassa, B. (1978). Exports and Economic Growth: Further Evidence. Journal of Development Economics.
5, 181–189.
Bahmani-Oskooee, M. (1996). Determinants of International Trade Flows: The Case of Developing
Countries. Journal of Development Economics, 20, 107–123.
Cheung, Y. W., and Sengupta, R. (2013). Impact of exchange rate movements on exports: an analysis of
Indian non-financial sector firms. Journal of International Money and Finance, 39, 231-245.
Circular no. 01, May 29, 2003, Foreign Exchange Policy Department, Bangladesh Bank.
Circular no.25, December 22, 2009, Foreign Exchange Policy Department, Bangladesh Bank.
Enders, W. (2010). Applied Economics Time Series. (3e). Wiley, NJ.
Engle, R. F., and Granger, C.W.(1987). Co-integration and error correction: representation, estimation, and
testing. Econometrica: journal of the Econometric Society, 251-276.
Fang, W., Lai, Y., and Miller, S. M.(2005). Export Promotion through Exchange Rate Policy: Exchange Rate
Depreciation or Stabilization? Economics Working Paper, University of Connecticut.
Fidan, H. (2006). Impact of the real effective exchange rate (Reer) on Turkish agricultural trade.
International Journal of Social Sciences, 1(2), 70.
Genc, E. G., and Artar, O. K. (2014). The Effect of Exchange Rates on Exports and Imports of Emerging
Countries. European Scientific Journal, 10(13).
14
Giles, J. A. and Williams, C. L. (2000). Export-Lead Growth: A Survey of the Empirical Literature and
Some Non-Causality Results, Part 1. Journal of International Trade and Economic Development, 9,
261–337.
Guechari, Y. (2012). An empirical study on the effects of real effective exchange rate on Algeria’s trade
balance. International Journal of Financial Research, 3(4), p102.
Hossain, A. A. (2011). The Foreign-Income and Real-Exchange-Rate Elasticities of Bangladesh Exports.
The Pakistan Development Review, 119-144.
Houthakker, H. S. and Magee, S. P. (1969). Income and Price Elasticities in World Trade. Review of
Economics and Statistics, 51(2), 11–125.
Khondker, B.H., Bidisha, S. H. & Razzaque, M. A. (2012). The Exchange Rate Economic Growth: An
Empirical Assessment on Bangladesh. International Growth Center, Working Paper, October 2012.
Lee, J. (1997). Sterilizing Capital Inflows. Economic Issues, International Monetary Fund, 7.
Masih, R. and Mashi, A. M. M. (2000). A Reassessment of Long-run Elasticities of Japanese Import
Demand. Journal of Policy Modelling, 22(5), 625–639.
Mehare, A., and Edriss, A. K. (2012). Evaluation of Effect of Exchange Rate Variability on Export of
Ethiopia’s Agricultural Product: Case of Oilseeds. Journal of Economics and Sustainable
Development, 3(11), 41-52.
Nelson, C., and Plosser, C. (1982). Trends and Random Walks in Macroeconomics Time Series: Some
Evidence and Implications. Journal of Monetary Economics. 10, 130-162.
Paul, B. P. (2014). Testing Export-Led Growth in Bangladesh: An ARDL Bounds Test Approach.
International Journal of Trade, Economics and Finance, 5(1), 1.
Policy Note (2014), Monetary Policy Department, Bangladesh Bank.
Roy, D. K. (1991). Export Performance of Bangladesh: A Constant Market Share Analysis. Bangladesh
Development Studies, 19(4), 63–81.
Saadullah Khan, Z., and Ismail Hossain, M. (2010). Democracy and trade balance: a vector autoregressive
analysis. Bangladesh Development Studies, 33(4), 23.
Singh, T. (2002). India’s Trade Balance: The Role of Income and Exchange Rates. Journal of Policy
Modelling, 24, 437–452.
Soutar, C. and Santoya, J. (2011). Estimating the Real Effective Exchange Rate (REER) for Belize. Working
Paper, Central Bank of Belize.
Stucka, T. (2004). The effects of exchange rate change on the trade balance in Croatia (No. 4-65).
International Monetary Fund.

15
Tyler, W. (1981). Growth and Export Expansion in Developing Countries: Some Empirical Evidence.
Journal of Development Economics, 9, 121–130.
Various Monetary Policy Statement, Bangladesh Bank.
Yaya, E. M., and Lu, X. (2012). The Short-run Relationship between Real Effective Exchange Rate and
Balance of Trade in China. International Journal of Applied Economics, 9(1), 15-27.
Younus, S., and Chowdhury, M. I. (2006). An Analysis of Bangladesh's Transition to Flexible Exchange
Rate Regime. Policy Analysis Unit, Research Department, Bangladesh Bank.
Younus, S., Chowdhury, M. M. I. (2014). Real exchange rate and its impact on export, import and trade
balance: Is there any J curve effect in Bangladesh? Working Paper, Monetary Policy Department &
Research Department.

16
Appendix
Diagnostic Tests
Autocorrelation LM test
VEC Residual Serial Correlation LM Tests
H0: no serial correlation at lag order h
Lags LM-Stat Prob
1 5.669758 0.2252
2 3.291659 0.5103
3 1.727989 0.7856
4 3.036031 0.5518
5 1.651971 0.7994
6 2.414120 0.6601
7 0.646436 0.9578
8 4.919712 0.2956
9 1.602262 0.8084
10 2.906541 0.5736
11 4.256999 0.3723
12 0.940214 0.9187
13 5.006007 0.2867
VEC Residual Normality Tests
Orthogonalization: Cholesky (Lutkepohl)
H0: residuals are multivariate normal
Component Skewness Chi-sq df Prob.
1 -0.362966 2.854461 1 0.0911
2 -0.247349 1.325599 1 0.2496
Joint 4.180060 2 0.1237
Component Kurtosis Chi-sq df Prob.
1 3.819563 3.638282 1 0.0565
2 3.355249 0.683592 1 0.4084
Joint 4.321874 2 0.1152
Component Jarque-Bera df Prob.
1 6.492743 2 0.0389
2 2.009191 2 0.3662
Joint 8.501934 4 0.0748
17
VEC Residual Heteroskedasticity Tests: No Cross Terms (only levels and squares)
Individual components:
Dependent R-squared F(54,75) Prob. Chi-sq(54) Prob.
res1*res1 0.508174 1.435055 0.0736 66.06262 0.1257
res2*res2 0.466498 1.214452 0.2165 60.64468 0.2487
res2*res1 0.513565 1.466352 0.0623 66.76346 0.1139
Cointegration test:
Unrestricted Cointegration Rank Test (Trace)
Hypothesized Trace 0.05
No. of CE(s) Eigenvalue Statistic Critical Value Prob.**
None * 0.160994 29.85649 25.87211 0.0151
At most 1 0.052689 7.036605 12.51798 0.3407
Trace test indicates 1 cointegrating eqn(s) at the 0.05 level
* denotes rejection of the hypothesis at the 0.05 level
**MacKinnon-Haug-Michelis (1999) p-values
Unrestricted Cointegration Rank Test (Maximum Eigen value)
Hypothesized Max-Eigen 0.05
No. of CE(s) Eigenvalue Statistic Critical Value Prob.**
None * 0.160994 22.81988 19.38704 0.0152
At most 1 0.052689 7.036605 12.51798 0.3407
Maximum Eigen value test indicates 1 cointegrating eqn(s) at the 0.05 level
* denotes rejection of the hypothesis at the 0.05 level
**MacKinnon-Haug-Michelis (1999) p-values

18
Unrestricted Cointegrating Coefficients (normalized by b'*S11*b=I)
LREXP LREER @TREND
-25.6556 -42.71666 0.261096
7.515196 2.830351 -0.032138
Unrestricted Adjustment Coefficients (alpha)
D(LREXP) 0.029697 -0.011537
D(LREER) 0.001760 0.002994
Cointegrating Equation(s): Log likelihood 518.34
Normalized cointegrating coefficients (standard error in parentheses)
LREXP LREER @TREND
1.000000 1.665003 -0.010177
(0.21541) (0.00040)
Adjustment coefficients (standard error in parentheses)
D(LREXP) -0.761903
(0.21439)
D(LREER) -0.045159
(0.03467)
VECM:
Vector Error Correction Estimates
Standard errors in ( ) & t-statistics in [ ]
Cointegrating Eq: CointEq1
LREXP(-1) 1.000000
LREER(-1) 1.665003
(0.21541)
[ 7.72946]
@TREND(03M06) -0.010177
(0.00040)
[-25.2062]
C -4.93
Error Correction: D(LREXP) D(LREER)
CointEq1 -0.761903 -0.04516
(0.21439) (0.03467)
[-3.55388] [-1.30264]
D(LREXP(-1)) -0.11811 0.052581
(0.20975) (0.03392)
[-0.56310] [ 1.55024]
D(LREXP(-2)) 0.440669 0.058841

19
(0.20990) (0.03394)
[ 2.09941] [ 1.73355]
D(LREXP(-3)) 0.361825 0.028991
(0.20643) (0.03338)
[ 1.75280] [ 0.86850]
D(LREXP(-4)) 0.200135 0.026769
(0.19200) (0.03105)
[ 1.04237] [ 0.86218]
D(LREXP(-5)) 0.224416 0.025966
(0.18137) (0.02933)
[ 1.23734] [ 0.88535]
D(LREXP(-6)) 0.312096 0.030711
(0.16554) (0.02677)
[ 1.88530] [ 1.14724]
D(LREXP(-7)) 0.330949 -0.00961
(0.15867) (0.02566)
[ 2.08582] [-0.37467]
D(LREXP(-8)) 0.162009 -0.01403
(0.15268) (0.02469)
[ 1.06108] [-0.56811]
D(LREXP(-9)) 0.100883 0.012300
(0.14009) (0.02265)
[ 0.72014] [ 0.54296]
D(LREXP(-10)) -0.047704 -0.00188
(0.12382) (0.02002)
[-0.38526] [-0.09368]
D(LREXP(-11)) 0.112501 -0.03155
(0.11452) (0.01852)
[ 0.98235] [-1.70367]
D(LREXP(-12)) 0.634778 -0.02283
(0.11128) (0.01800)
[ 5.70412] [-1.26855]
D(LREXP(-13)) 0.342901 0.005296
(0.09519) (0.01539)
[ 3.60233] [ 0.34404]
D(LREER(-1)) -0.401568 0.452860
(0.67432) (0.10904)
[-0.59552] [ 4.15310]
D(LREER(-2)) 1.124607 -0.09319
(0.70857) (0.11458)
[ 1.58716] [-0.81335]

20
D(LREER(-3)) -0.104324 0.048488
(0.69962) (0.11313)
[-0.14912] [ 0.42860]
D(LREER(-4)) 0.204020 -0.05647
(0.69097) (0.11173)
[ 0.29527] [-0.50542]
D(LREER(-5)) -0.366436 0.061521
(0.69229) (0.11195)
[-0.52931] [ 0.54955]
D(LREER(-6)) 1.126777 0.069226
(0.67058) (0.10844)
[ 1.68031] [ 0.63840]
D(LREER(-7)) 0.475867 -0.26521
(0.66934) (0.10824)
[ 0.71095] [-2.45030]
D(LREER(-8)) 0.212700 0.148548
(0.68586) (0.11091)
[ 0.31012] [ 1.33938]
D(LREER(-9)) 0.062034 -0.07561
(0.68958) (0.11151)
[ 0.08996] [-0.67809]
D(LREER(-10)) -0.861108 0.064521
(0.67686) (0.10945)
[-1.27222] [ 0.58949]
D(LREER(-11)) 1.021783 -0.18894
(0.68130) (0.11017)
[ 1.49975] [-1.71499]
D(LREER(-12)) -0.070913 0.041645
(0.67689) (0.10946)
[-0.10476] [ 0.38047]
D(LREER(-13)) -0.307611 -0.02342
(0.60834) (0.09837)
[-0.50566] [-0.23804]
C -0.018766 0.000495
(0.01711) (0.00277)
[-1.09677] [ 0.17873]
R-squared 0.726566 0.340321
Adj. R-squared 0.654186 0.165701
Sum sq. resids 0.925918 0.024212
S.E. equation 0.095277 0.015407
F-statistic 10.03826 1.948917

21
Log likelihood 136.9307 373.7873
Akaike AIC -1.675857 -5.3198
Schwarz SC -1.058235 -4.70218
Mean dependent 0.004822 0.002109
S.D. dependent 0.162019 0.016868
Determinant resid covariance (dof adj.) 1.92E-06
Determinant resid covariance 1.18E-06
Log likelihood 518.3401
Akaike information criterion -7.06677
Schwarz criterion -5.76535