Embed Size (px)
Citation preview
Discussion Paper No. 28
THE IMPACT OF THE U.S. POLICY-MIX
ON U.S.-JAPAN ECONOMIES
Simulation Analysis using - -
the U.S.-Japan Link Model
by
World Economic Model Group
Economic Research Institute,
Economic Planning Agency,
Tokyo, Japan
Discussion Paper No. 28
THE IMPACT OF THE U.S. POLICY-MIX
ON U.S. -JAPAN ECONOMIES *
Simulat ion Analysis using - -
the U.S. -Japan Link Model
by
World Economic Model Group
December 1983
Economic Research Inst i tute
Economic Planning Agency
Tokyo, Japan
* This report was compiled by the Economic Research Inst i tute ,
the Economic Planning Agency. I t seeks to g ive an outl ine both
of the types of research currently underway at the Inst i tute
and of the ideas being formulated in the process .
We would also l ike to have the opinions of those reading this report
on i ts contents . This report is the work of the World Economic
Model Group, and does not represent the of f ic ia l v iew of the
Economic Research Inst i tute , the Economic Planning Agency.
Contents
Introduct ion · · · · · · · · · · · · · · · · · · · · · · · · · · · · · · · · · · · · · · · · · · · · · · · · · · · · · · · · · · · · · · · · 1
A. Object ives · · · · · · · · · · · · · · · · · · · · · · · · · · · · · · · · · · · · · · · · · · · · · · · · · · · · · 1
B. Methodology · · · · · · · · · · · · · · · · · · · · · · · · · · · · · · · · · · · · · · · · · · · · · · · · · · 2 I . Development of the U.S. Pol icy-Mix · · · · · · · · · · · · · · · · · · · · · · · · · · · 2 I I . Impact on the U.S. Economy · · · · · · · · · · · · · · · · · · · · · · · · · · · · · · · · · · · · · 4
A. On the business c l imate , interest rates , and inf lat ion · · · · · · · · · · · · · · · · · · · · · · · · · · · · · · · · · · · · · · · · · · · · · · · · · 4
B. On general government budget def ic i ts · · · · · · · · · · · · · · · 7
C. On the current account balance · · · · · · · · · · · · · · · · · · · · · · · · · · 8
D. On the dol lar e f fect ive exchange rate · · · · · · · · · · · · · · · · · · 9
III . Impact on the Japanese Economy · · · · · · · · · · · · · · · · · · · · · · · · · · · · · · · 10
A. Direct impact o f the U.S. pol icy-mix on the Japanese economy · · · · · · · · · · · · · · · · · · · · · · · · · · · · · · · · · · 10
B. Japanese monetary pol icy vis -a-v is the
depreciat ion of yen and the ef fects o f this pol icy · · · · · · · · · · · · · · · · · · · · · · · · · · · · · · · · · · · · · · · · · · · · · · · · · · · · · 11
C. Comparison of the impact o f U.S. economic
pol icy and Japanese f iscal pol icy on Japan's current account surplus · · · · · · · · · · · · · · · · · · · · · · · · · 12
IV. Conclusion · · · · · · · · · · · · · · · · · · · · · · · · · · · · · · · · · · · · · · · · · · · · · · · · · · · · · · · · · · · 14 Appendix 1 : Assumptions made in this Simulation · · · · · · · · · · · · · · 25
I . Assumptions Regarding the U.S. Pol icy-Mix II . Assumptions Regarding Japanese Economic Pol icy
Appendix 2 : Points for Consideration in Interpret ing
the Results · · · · · · · · · · · · · · · · · · · · · · · · · · · · · · · · · · · · · · · · · · · · · · · 29
-1-
Introduct ion
A. Object ives
The recent pol icy-mix of the United States is
characterized by a combination of a t ight monetary pol icy
deriving from the new operat ional procedures inaugurated in
October 1979, and the f iscal pol icy adopted by the Reagan
Administrat ion.
How did this pol icy-mix deepen the recession in the
United States (1980-82) tr iggered by the second oi l cr is is ,
and inf luence the appreciat ion of the dol lar (1980-83)? To
what extent did this pol icy-mix af fect the Japanese business
cyc le (1980-1983) , the depreciat ion of the yen (1981-83) and
the large current account surplus (1983)? Our object ive in
this s tudy is to c lar i fy these issues quantitat ively using
the U.S. -Japan l ink model ( to be explained later) . The
report does not seek to evaluate the U.S. pol icy-mix or
Japanese economic pol icy . With this point in mind, the
fo l lowing analys is was conducted for two di f ferent periods :
1) recession in the United States from 1980 to 1982; and 2)
recovery which began in early 1983.
-2-
B . Methodology
This analys is was conducted by l inking Japan and U.S.
econometric models with a world trade l inkage model . These
models have been completely reest imated, with good results
for the f inal tests , and are referred to as the "U.S. -Japan
l ink model . " The sample data for the reest imation covers
the period up to 1981. This report is based on a mult ipl ier
test appl ied to the f ive -year period 1977-81. In other words,
the ef fects o f var ious types o f pol icy combinations, such as
the U.S. pol icy-mix or the Japanese pol icy mentioned below,
were analyzed by this interpolat ion test period. The results
o f this s imulat ion were reinterpreted as the ef fect o f U.S.
pol icy-mix during 1980-83 (see "Points for Considerat ion in
Interpret ing the Results" in Appendix 2) .
Accordingly , this analysis should be understood as an
interim report on the work begun in Apri l 1983 with the aim
of ful ly revis ing the EPA World Economic Model . I t a lso
shows one appl icat ion of the model to be ut i l ized from here
on.
I . Development of the U.S. Pol icy-Mix
(1) In October 1979, i t was decided to shi f t the inter-
mediate target o f monetary pol icy of the Federal Reserve
-3-
Board from federal fund rates to quantitat ive indicators
such as bank reserves and money supply . Because of the
confusion fo l lowing this and other inst i tut ional changes,
the money market in the f irst hal f o f 1980 experienced
vio lent f luctuations in credit avai labi l i ty and interest
rates . In the meanwhile , inf lat ion continued to accelerate .
(2) Consequently , the Federal Reserve Board switched to a
t ight monetary pol icy from the end of 1980.
(3) After taking of f ice in 1981, the Reagan Administrat ion
continued the exist ing t ight monetary pol icy advocated by
monetarists , whi le i ts f iscal pol icy was based on supply-
s ide economics . This was a mixture o f money supply restraints
to bring down the inf lat ion rate , and tax reductions to
increase savings and product ivity .
(4) This t ight monetary pol icy resulted in unprecedentedly
high interest rates , which once again pushed business act ivity
into recession from the second hal f o f 1981 through 1982.
In 1982, unemployment soared to over 10 percent .
(5 ) The inf lat ion rate o f the consumer price index s lowed
considerably from 1982.
(6 ) From mid-1982, the Federal Reserve Board re laxed i ts
t ight monetary pol icy s l ightly and interest rates decl ined,
though they began to r ise again in ear ly 1983.
-4-
(7 ) The ef fects o f three separate reduct ions in personal
income tax (October 1981, July 1982 and July 1983) helped
the U.S. economy start a rapid recovery from 1983.
(8) The impact o f these pol ic ies on the U.S. and Japanese
economies were calculated through s imulat ion based on the
U.S. -Japan l ink model , with the fo l lowing results .
I I . Impact on the U.S. Economy
(Refer to Table 1 , Figs . 1-3. )
A. Impact on the Business Cl imate, Interest Rates , and
Inf lat ion
(1) The t ighter monetary pol icy init iated in the latter
hal f o f 1980 raised short -term interest rates by 4 .3
percentage points in the f irst hal f o f 1982.
(2 ) I t diminished personal consumption by 2 .9 percent ,
pr ivate investment in plant and equipment by 3 .8 percent ,
and housing investment by 13.4 percent . The result was a
3 .5 percent drop in GNP. I t is thus c lear that monetary
restraint had a major def lat ionary ef fect .
(3) The 5 percent cut in personal income taxes in the fourth
quarter of 1981 increased personal consumption by 0 .6 percent ,
pr ivate investment in plant and equipment by 0 .6 percent ,
and housing investment by 3 .8 percent in the f irst -hal f o f
-5-
1982. This tax reduct ion also caused a 0 .5 percent growth
in GNP. But because of the t ight monetary pol icy , the
recession continued and the net impact on GNP was a 3 .0
percent decl ine in the f irst hal f o f 1982.
(4) At the start o f the second hal f o f 1982, the t ight
monetary pol icy was re laxed to an extent , and personal
income taxes were cut for a second t ime, by 10 percent .
(5) In the second hal f o f 1982, the U.S. pol icy-mix
contr ibuted to a r ise in short -term interest rates o f 3 .1
percentage points . The breakdown showed that out o f this
total r ise , 2 .8 percentage points were attr ibutable to
expansionary f iscal pol icy result ing from the increased
demand for money, whi le 0 .3 percentage points were due to
monetary pol icy . In 1983, short -term interest rates rose by
4 .1 percentage points due mainly to the ef fects o f the f iscal
pol icy . Because long-term interest rates do not react
immediately to short -term rate increases ( the term structure
of interest rates ) , the impact o f the t ight monetary pol icy
on long term interest rates remained strong through 1982
(1 .9 percentage points higher) and 1983 (1 .6 percentage
points higher) . When the ef fects o f f iscal pol icy on
interest rates are included, the total e f fect o f the pol icy-
mix was a r ise in long term interest rates of 2 .5 percentage
points in 1982 and 3.3 percentage points in 1983.
-6-
(6 ) In the second hal f o f 1982, the ef fects o f monetary
pol icy on personal consumption were minus 1 .9 percent , whi le
those of tax cuts were plus 1 .4 percent . The pol icy-mix as
a whole continued to operate as a minus factor . Regarding
private investment in plant and equipment, monetary po l icy
ef fects were minus 2 .0 percent and tax cut ef fects were plus
1 .1 percent- -a combined total o f minus 0 .9 percent . In
housing investment, however , the minus ef fects o f the
monetary pol icy were exceeded by the favorable e f fects o f
tax reductions, g iving an overal l gain of 4 .2 percent . With
regard to the impact on GNP, the plus 1 .1 percent ef fect o f
the f iscal pol icy was of fset by a 2 .1 percent decl ine due to
monetary pol icy , result ing in an overal l 1 .0 percent decrease.
(7) In the f irst hal f o f 1983, the combined ef fect on
aggregated demand of tax reduct ions and re laxed monetary
controls f rom the second hal f o f 1982 was an 1 .9 percent
increase in GNP supported by increases in al l expenditure
i tems.
(8) In July 1983, income tax was cut for a third t ime, again
by 10 percent and i t is predicted that the expansionary ef fect
on GNP in the second hal f o f 1983 wil l be about 3 .8 percent .
This e f fect wi l l increase housing investment, pr ivate plant
and equipment investment and personal consumption, in that
order .
-7-
(9 ) The t ight monetary pol icy 's e f fect in curbing inf lat ion,
which was i ts primary object ive , helped lower the consumer
price index over the entire period, with a 1 .2 percent decl ine
in the second hal f o f 1982. Subsequently , however , the
decelerat ing inf lat ion rate of the consumer price index was
halted by the business recovery mentioned above .
B. Impact on General Government Budget Def ic i ts
(10) The general government budget def ic i t widened due to
tax reductions even when increased tax revenues stemming
from business improvements due to the tax reduct ion were
taken into account . The def ic i ts increased by $7 bi l l ion in
the f irst hal f o f 1982, $30 bi l l ion in the second hal f o f
1982, $16 bi l l ion in the f irst hal f o f 1983, and $38 bi l l ion
in the second hal f o f 1983.
(11) When the def ic i ts created by the t ight monetary pol icy
that tr iggered the recession are combined, they give a $58
bi l l ion def ic i t for the f irst hal f o f 1982 and $67 bi l l ion
def ic i t for the second hal f . In 1983, increased tax revenues
reduced the def ic i t to approximately $24.5 bi l l ion ( f igures
on annual basis ) .
(12) The fo l lowing factors are also behind recent def ic i t
increases , a l though they are not included in this model
analys is : 1 ) increases in interest payments on publ ic debt
-8-
due to the larger def ic i t and higher interest rates ; 2) lower
corporate tax revenues due to accelerated depreciat ion; 3 )
the def ic i t due to the recession induced by the second oi l
cr is is .
C. Impact on the Current Account Balance
(13) Regarding the ef fects on trade in goods and services ,
net exports , de f ined as exports minus imports , decl ined in
both 1982 and 1983. This was because forces working for
increases in net exports were more than of fset by counter-
forces working for decl ines in net exports . The former
forces inc luded the recession caused by t ight money and
strengthened internat ional competit iveness caused by the
s lowing inf lat ion rate . The latter counterforces inc luded a
contract ion in world trade due to the recession in the United
States , a decl ine in international competit iveness attr ibutable
to the appreciat ion of the dol lar , and the increased payments
o f investment income because of high interest rates , a l l o f
which contributed to a decrease in net exports in 1982-83.
Net exports decl ined ( in other words, net imports increased)
especial ly sharply in 1983, accounting for nearly 20 percent
o f the incremental o f domestic demand.
-9-
(14) Despite the decrease in net exports mentioned above,
the current account remained in surplus unti l mid-1982,
because o f the J-Curve ef fect tr iggered by the appreciat ion
of the dol lar . The subsequent business recovery increased
imports and weakened internat ional competit iveness because
the appreciat ion of the dol lar resulted in a massive current
account def ic i t in the second hal f o f 1983 (equivalent to
0 .6 percent of nominal GNP, approximately $16 bi l l ion on an
annual basis ) .
D. Impact on the Dol lar Effect ive Exchange Rate
(15) The high interest rates due to the t ight monetary pol icy
and expansionary f iscal pol icy widened the gap between
domestic and foreign interest rates , prompting an inf low of
capital into the U.S. and a consequently sharp appreciat ion
in the ef fect ive exchange dol lar rate . Namely, the monetary
pol icy boosted the value of the dol lar by approximately 22
percent during the f irst hal f o f 1982 and the subsequent
re laxation of monetary restr ict ions contributed less and
less to the dol lar appreciat ion. Instead, however , f iscal
pol icy contributed more and more to the appreciat ion of the
dol lar . In the latter hal f o f 1983, the combined ef fect o f
monetary and f iscal pol icy was a 28.4 percent appreciat ion
of the dol lar .
-10-
I II . Impact on the Japanese Economy
A. Direct Impact o f the U.S. Pol icy-Mix on the Japanese
Economy
(Refer to Table 2 , Figs . 4-6. )
(1) High interest rates result ing from the U.S. pol icy-mix
widened the gap between domestic and overseas interest rates ,
and generated incipient capital in f lows into the U.S. As a
consequence, the yen depreciated by 10.5 percent in the f irst
hal f o f 1982, by 9 .3 percent in the second hal f , by 7 .5
percent in the f irst hal f o f 1983 and by 6 .6 percent in the
second hal f . (A 10 percent depreciat ion represents approxi -
mately minus 25 yen to the dol lar . )
(2 ) The depreciat ion of the yen pushed the dol lar pr ice o f
Japanese export down by over 5 percent in 1982 and about 4
percent in 1983, thus strengthening Japan's internat ional
competit iveness .
(3) Despite the contract ion in world trade due to the U.S.
recession, Japan's strengthened international competi t iveness
boosted Japanese exports by 4 .1 percent in 1982. In 1983,
the U.S. economy recovered and world trade expanded, which
together with the internat ional competit iveness of Japanese
exports , resulted in a 5 .6 percent increase in Japanese
exports o f goods.
-11-
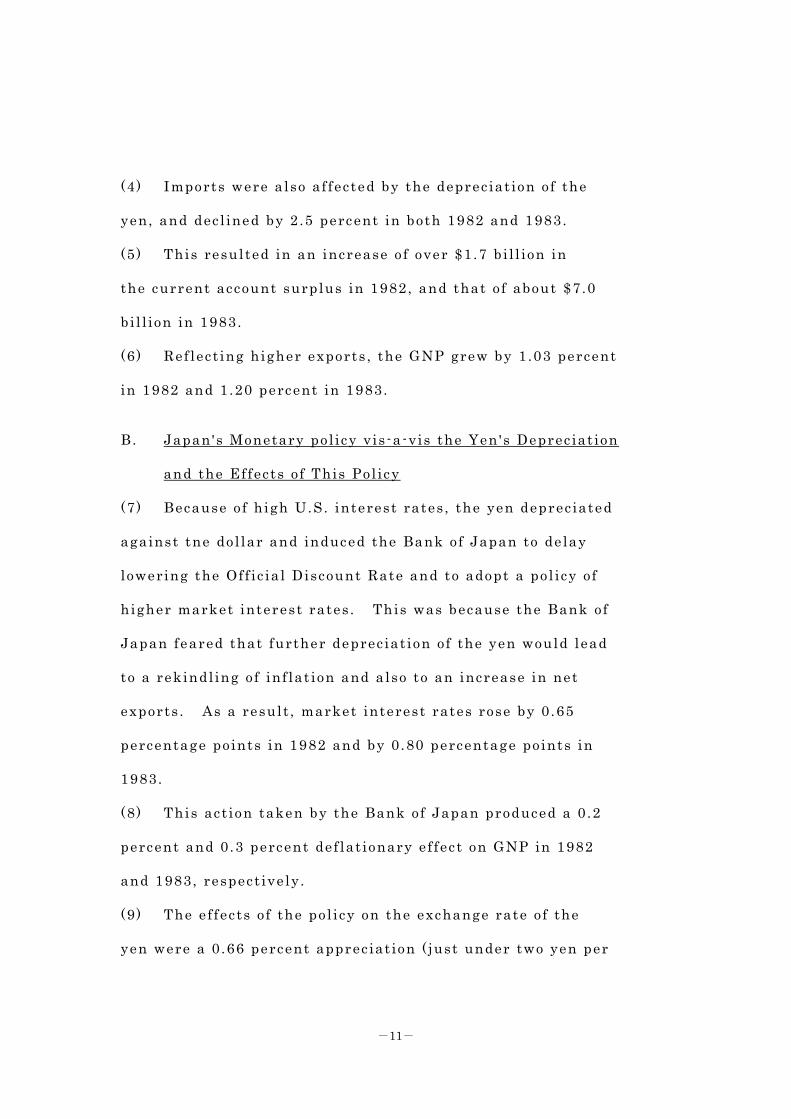
(4 ) Imports were also af fected by the depreciat ion of the
yen, and decl ined by 2 .5 percent in both 1982 and 1983.
(5) This resulted in an increase o f over $1.7 bi l l ion in
the current account surplus in 1982, and that o f about $7.0
bi l l ion in 1983.
(6) Ref lect ing higher exports , the GNP grew by 1 .03 percent
in 1982 and 1.20 percent in 1983.
B. Japan's Monetary pol icy vis -a-vis the Yen's Depreciat ion
and the Effects o f This Pol icy
(7) Because o f high U.S. interest rates , the yen depreciated
against tne dol lar and induced the Bank of Japan to delay
lowering the Off ic ial Discount Rate and to adopt a pol icy of
higher market interest rates . This was because the Bank of
Japan feared that further depreciat ion of the yen would lead
to a rekindl ing o f inf lat ion and also to an increase in net
exports . As a result , market interest rates rose by 0 .65
percentage points in 1982 and by 0 .80 percentage points in
1983.
(8) This act ion taken by the Bank of Japan produced a 0 .2
percent and 0.3 percent def lat ionary ef fect on GNP in 1982
and 1983, respect ively .
(9) The ef fects o f the pol icy on the exchange rate o f the
yen were a 0 .66 percent appreciat ion ( just under two yen per
-12-
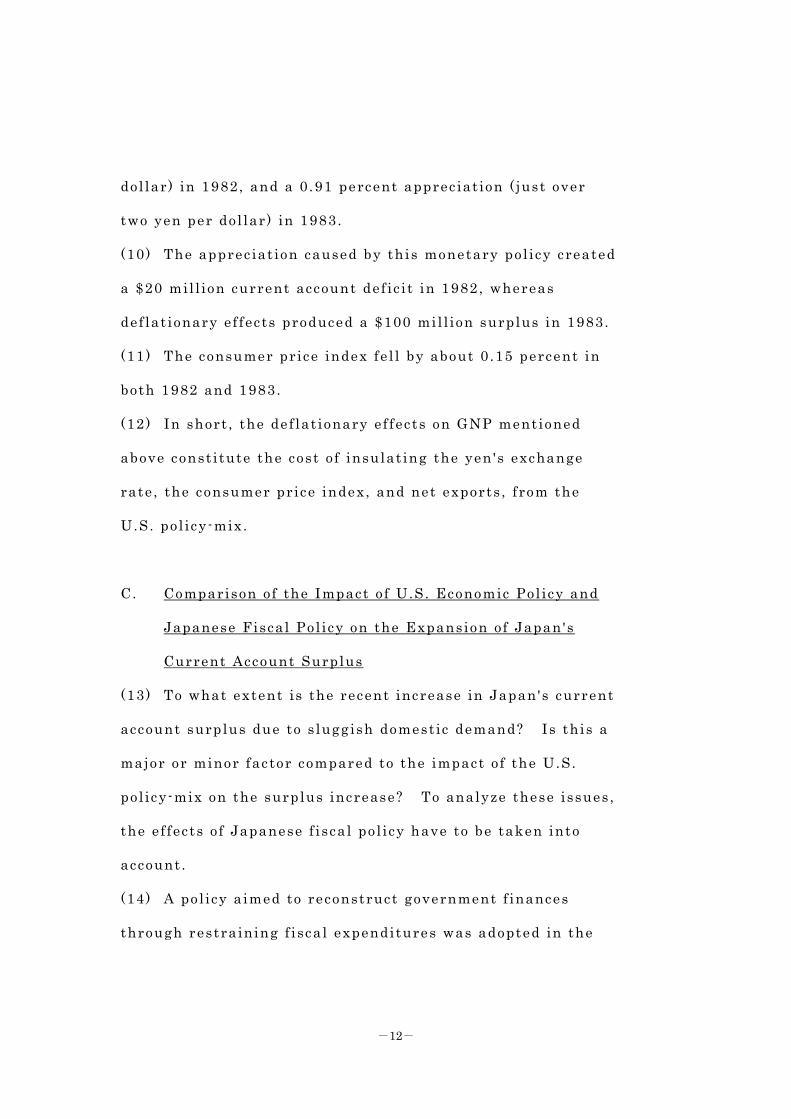
dol lar) in 1982, and a 0 .91 percent appreciat ion ( just over
two yen per dol lar) in 1983.
(10) The appreciat ion caused by this monetary pol icy created
a $20 mil l ion current account def ic i t in 1982, whereas
def lat ionary ef fects produced a $100 mil l ion surplus in 1983.
(11) The consumer price index fe l l by about 0 .15 percent in
both 1982 and 1983.
(12) In short , the def lat ionary ef fects on GNP mentioned
above const i tute the cost o f insulat ing the yen 's exchange
rate , the consumer price index, and net exports , f rom the
U.S. pol icy-mix.
C. Comparison of the Impact o f U.S. Economic Pol icy and
Japanese Fiscal Pol icy on the Expansion of Japan's
Current Account Surplus
(13) To what extent is the recent increase in Japan's current
account surplus due to s luggish domestic demand? Is this a
major or minor factor compared to the impact o f the U.S.
pol icy-mix on the surplus increase? To analyze these issues ,
the ef fects o f Japanese f iscal pol icy have to be taken into
account .
(14) A po l icy a imed to reconstruct government f inances
through restraining f iscal expenditures was adopted in the
-13-
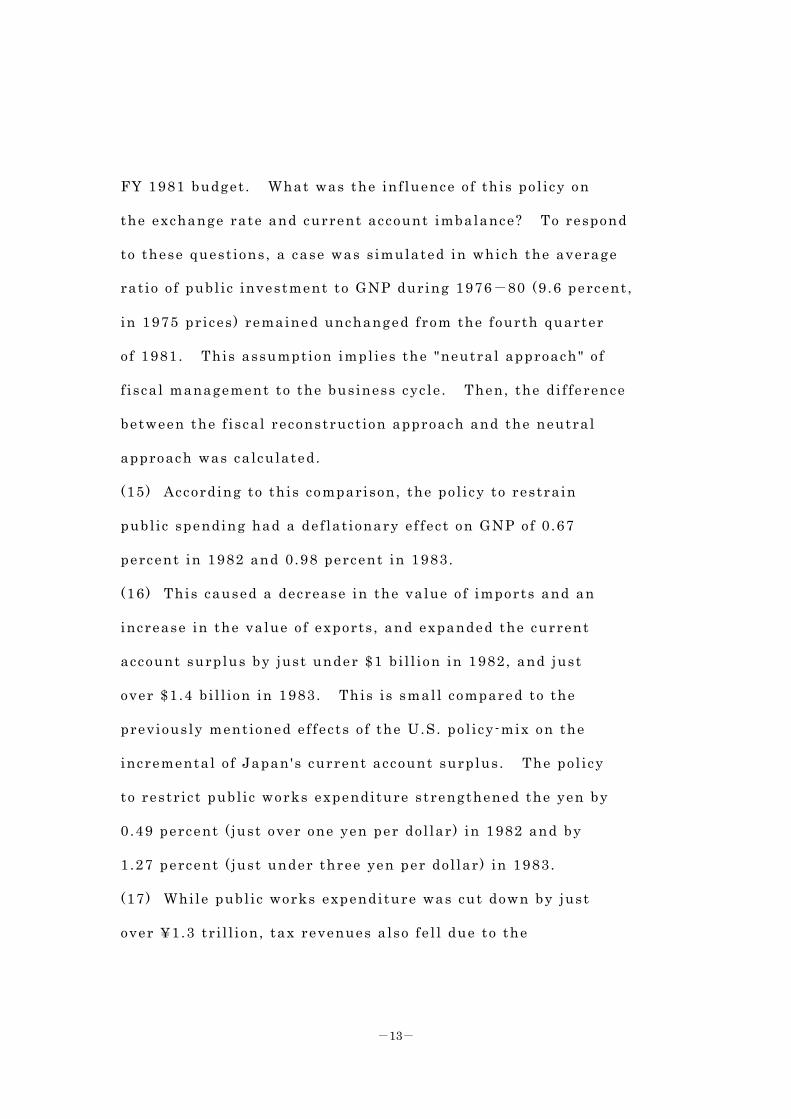
FY 1981 budget . What was the inf luence of this po l icy on
the exchange rate and current account imbalance? To respond
to these quest ions, a case was s imulated in which the average
rat io o f publ ic investment to GNP during 1976-80 (9 .6 percent ,
in 1975 prices) remained unchanged from the fourth quarter
of 1981. This assumption impl ies the "neutral approach" of
f iscal management to the business cycle . Then, the di f ference
between the f iscal reconstruct ion approach and the neutral
approach was calculated.
(15) According to this comparison, the pol icy to restrain
publ ic spending had a def lat ionary ef fect on GNP of 0 .67
percent in 1982 and 0.98 percent in 1983.
(16) This caused a decrease in the value of imports and an
increase in the value of exports , and expanded the current
account surplus by just under $1 bi l l ion in 1982, and just
over $1.4 bi l l ion in 1983. This is smal l compared to the
previously mentioned ef fects o f the U.S. pol icy-mix on the
incremental o f Japan's current account surplus . The pol icy
to restr ict publ ic works expenditure strengthened the yen by
0 .49 percent ( just over one yen per dol lar) in 1982 and by
1 .27 percent ( just under three yen per dol lar) in 1983.
(17) While publ ic works expenditure was cut down by just
over ¥1.3 tr i l l ion, tax revenues also fe l l due to the
-14-
def lat ionary ef fects o f such expenditure cuts , and when that
revenue decl ine is subtracted, improvements in the government
imbalance were just short o f ¥800 bi l l ion in 1982 and ¥600
bi l l ion in 1983.
IV. Conclusion
The above s imulat ion analysis can be summarized for the
major economic var iables as fo l lows.
(1) Causes of high U.S. interest rates
With regard to short -term interest rates , U.S. monetary
pol icy played an important ro le in a higher interest rate
(by 2 .4 percentage points in 1981, 2 .3 percentage points in
1982, and 0 .4 percentage points in 1983) , a lthough there is
a trend for f iscal pol icy to be more important in rais ing
interest rates (1 .8 percentage points in 1982 and 3.5
percentage points in 1983) .
(2) Increase in U.S. general government budget def ic i ts
Through 1982, the def ic i t created by the recession
tr iggered by the t ight monetary pol icy accounted for the
bulk of the total de f ic i t ($34 bi l l ion in 1981, and $44
bi l l ion in 1982) . S ince 1983, the def ic i t has increased due
mainly to tax reductions (amounting to $3 bi l l ion in 1981,
$19 bi l l ion in 1982 and further to $27 bi l l ion in 1983) .
-15-
(3 ) U.S. business recovery
The tax cut po l icy is a major contributor to the
recovery, rais ing GNP by 2 .7 percent in 1983. Regarding the
business recovery pattern, however , whi le personal consump-
t ion rose 2 .9 percent , housing investment by 28.7 percent ,
and pr ivate investment in plant and equipment by 4 .7 percent ,
net exports decl ined by c lose to 20 percent o f the incremental
o f the domestic demand in 1983, ref lect ing the strong dol lar
and expanded domestic demand.
(4 ) Ef fect ive dol lar exchange rate
Due to the U.S. pol icy-mix, the do l lar appreciated by
11.1 percent in 1981, 22.9 percent in 1982 and 26.8 percent
in 1983.
(5) Yen depreciat ion s ince 1981
This was primari ly the result o f the U.S. pol icy-mix,
which contr ibuted to the depreciat ion of the yen by 6 .0
percent in 1981, 9 .9 percent in 1982 and 7.1 percent in 1983
(a 10 percent depreciat ion represents a f loatdown of approxi -
mately 25 yen per dol lar ) . In contrast , both Japanese
monetary and f iscal pol ic ies strengthened the yen in 1982
and 1983, within the range of just over one yen to just under
three yen per dol lar .
-16-
(6 ) Japan's current account surplus increase in 1983
Here too the U.S. pol icy-mix played a major ro le .
While this pol icy-mix produced a $7 bi l l ion surplus in
Japan's current account , Japan's f iscal pol icy produced just
over $1.4 bi l l ion in surplus, and i ts monetary po l icy $100
mil l ion.
(7 ) Increase in Japan's real GNP in 1983
Expansion in net exports o f goods is the major factor ,
increasing GNP by 1 .1 percent . The greater part o f this
increase was the result o f the strengthened do l lar together
with the expanded U.S. domestic demand induced by the U.S.
pol icy-mix.
-17
-
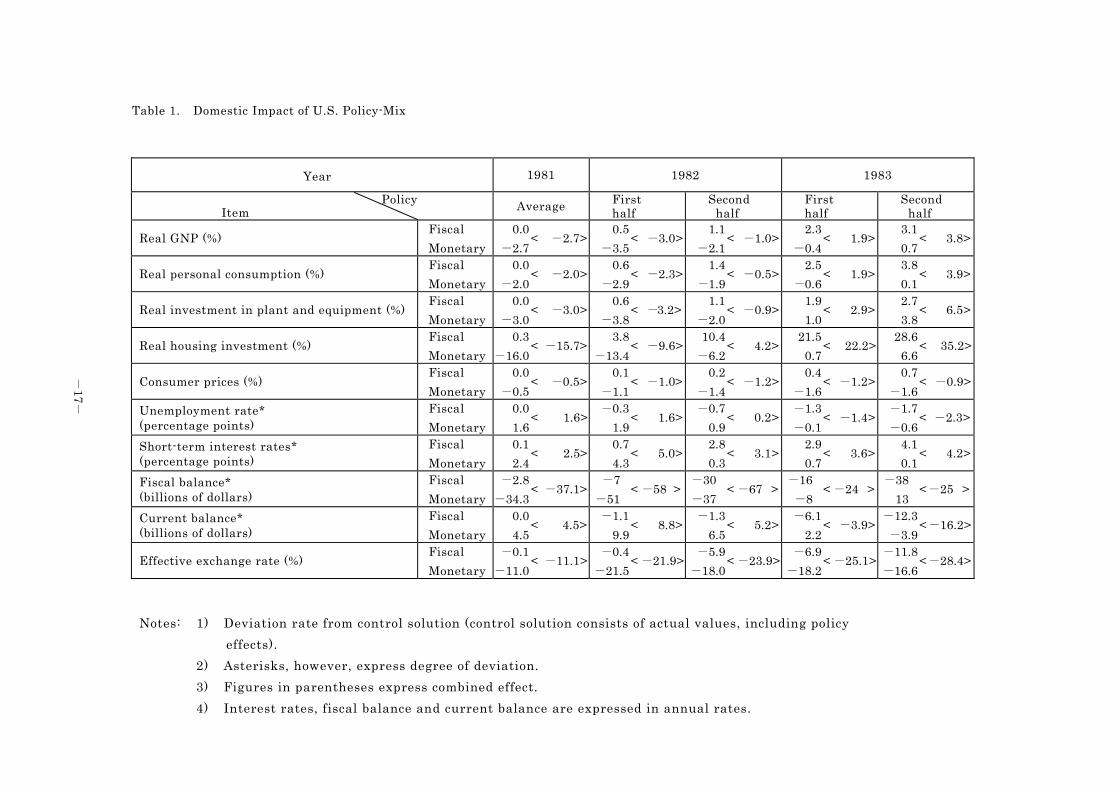
Table 1. Domestic Impact of U.S. Policy-Mix
Year 1981 1982 1983
Item Policy
Average First half
Secondhalf
Firsthalf
Secondhalf
Real GNP (%) Fiscal
Monetary
0.0
-2.7< -2.7>
0.5
-3.5 < -3.0>
1.1
-2.1< -1.0>
2.3
-0.4< 1.9>
3.1
0.7< 3.8>
Real personal consumption (%) Fiscal
Monetary
0.0
-2.0< -2.0>
0.6
-2.9 < -2.3>
1.4
-1.9< -0.5>
2.5
-0.6< 1.9>
3.8
0.1< 3.9>
Real investment in plant and equipment (%)Fiscal
Monetary
0.0
-3.0< -3.0>
0.6
-3.8 < -3.2>
1.1
-2.0< -0.9>
1.9
1.0< 2.9>
2.7
3.8< 6.5>
Real housing investment (%) Fiscal
Monetary
0.3
-16.0< -15.7>
3.8
-13.4 < -9.6>
10.4
-6.2< 4.2>
21.5
0.7< 22.2>
28.6
6.6< 35.2>
Consumer prices (%) Fiscal
Monetary
0.0
-0.5< -0.5>
0.1
-1.1 < -1.0>
0.2
-1.4< -1.2>
0.4
-1.6< -1.2>
0.7
-1.6< -0.9>
Unemployment rate* (percentage points)
Fiscal
Monetary
0.0
1.6< 1.6>
-0.3
1.9 < 1.6>
-0.7
0.9< 0.2>
-1.3
-0.1< -1.4>
-1.7
-0.6< -2.3>
Short-term interest rates* (percentage points)
Fiscal
Monetary
0.1
2.4< 2.5>
0.7
4.3 < 5.0>
2.8
0.3< 3.1>
2.9
0.7< 3.6>
4.1
0.1< 4.2>
Fiscal balance* (billions of dollars)
Fiscal
Monetary
-2.8
-34.3< -37.1>
-7
-51 < -58 >
-30
-37< -67 >
-16
-8< -24 >
-38
13<-25 >
Current balance* (billions of dollars)
Fiscal
Monetary
0.0
4.5< 4.5>
-1.1
9.9 < 8.8>
-1.3
6.5< 5.2>
-6.1
2.2< -3.9>
-12.3
-3.9<-16.2>
Effective exchange rate (%) Fiscal
Monetary
-0.1
-11.0< -11.1>
-0.4
-21.5 < -21.9>
-5.9
-18.0< -23.9>
-6.9
-18.2< -25.1>
-11.8
-16.6<-28.4>
Notes: 1) Deviation rate from control solution (control solution consists of actual values, including policy
effects).
2) Asterisks, however, express degree of deviation.
3) Figures in parentheses express combined effect.
4) Interest rates, fiscal balance and current balance are expressed in annual rates.
-18
-
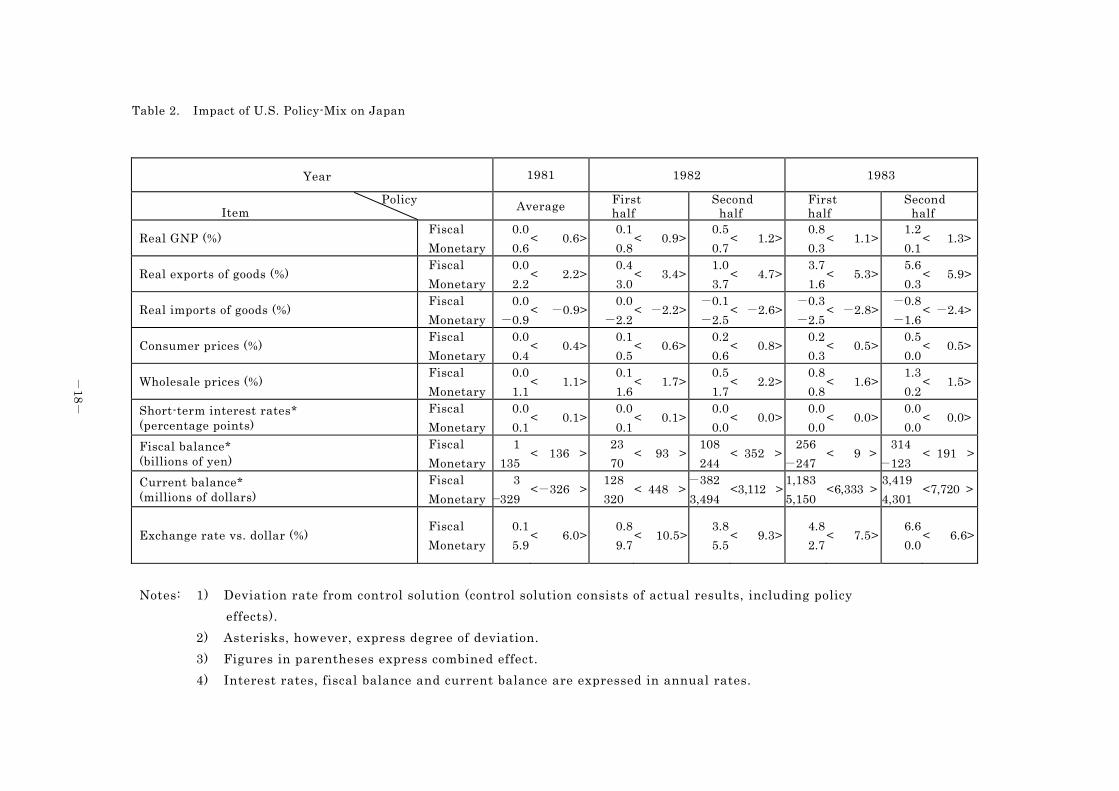
Table 2. Impact of U.S. Policy-Mix on Japan
Year 1981 1982 1983
Item Policy
Average First half
Secondhalf
Firsthalf
Secondhalf
Real GNP (%) Fiscal
Monetary
0.0
0.6< 0.6>
0.1
0.8 < 0.9>
0.5
0.7< 1.2>
0.8
0.3< 1.1>
1.2
0.1< 1.3>
Real exports of goods (%) Fiscal
Monetary
0.0
2.2< 2.2>
0.4
3.0 < 3.4>
1.0
3.7< 4.7>
3.7
1.6< 5.3>
5.6
0.3< 5.9>
Real imports of goods (%) Fiscal
Monetary
0.0
-0.9< -0.9>
0.0
-2.2 < -2.2>
-0.1
-2.5< -2.6>
-0.3
-2.5< -2.8>
-0.8
-1.6< -2.4>
Consumer prices (%) Fiscal
Monetary
0.0
0.4< 0.4>
0.1
0.5 < 0.6>
0.2
0.6< 0.8>
0.2
0.3< 0.5>
0.5
0.0< 0.5>
Wholesale prices (%) Fiscal
Monetary
0.0
1.1< 1.1>
0.1
1.6 < 1.7>
0.5
1.7< 2.2>
0.8
0.8< 1.6>
1.3
0.2< 1.5>
Short-term interest rates* (percentage points)
Fiscal
Monetary
0.0
0.1< 0.1>
0.0
0.1 < 0.1>
0.0
0.0< 0.0>
0.0
0.0< 0.0>
0.0
0.0< 0.0>
Fiscal balance* (billions of yen)
Fiscal
Monetary
1
135< 136 >
23
70 < 93 >
108
244< 352 >
256
-247< 9 >
314
-123< 191 >
Current balance* (millions of dollars)
Fiscal
Monetary
3
-329<-326 >
128
320 < 448 >
-382
3,494<3,112 >
1,183
5,150<6,333 >
3,419
4,301<7,720 >
Exchange rate vs. dollar (%) Fiscal
Monetary
0.1
5.9< 6.0>
0.8
9.7 < 10.5>
3.8
5.5< 9.3>
4.8
2.7< 7.5>
6.6
0.0< 6.6>
Notes: 1) Deviation rate from control solution (control solution consists of actual results, including policy
effects).
2) Asterisks, however, express degree of deviation.
3) Figures in parentheses express combined effect.
4) Interest rates, fiscal balance and current balance are expressed in annual rates.
-19
-
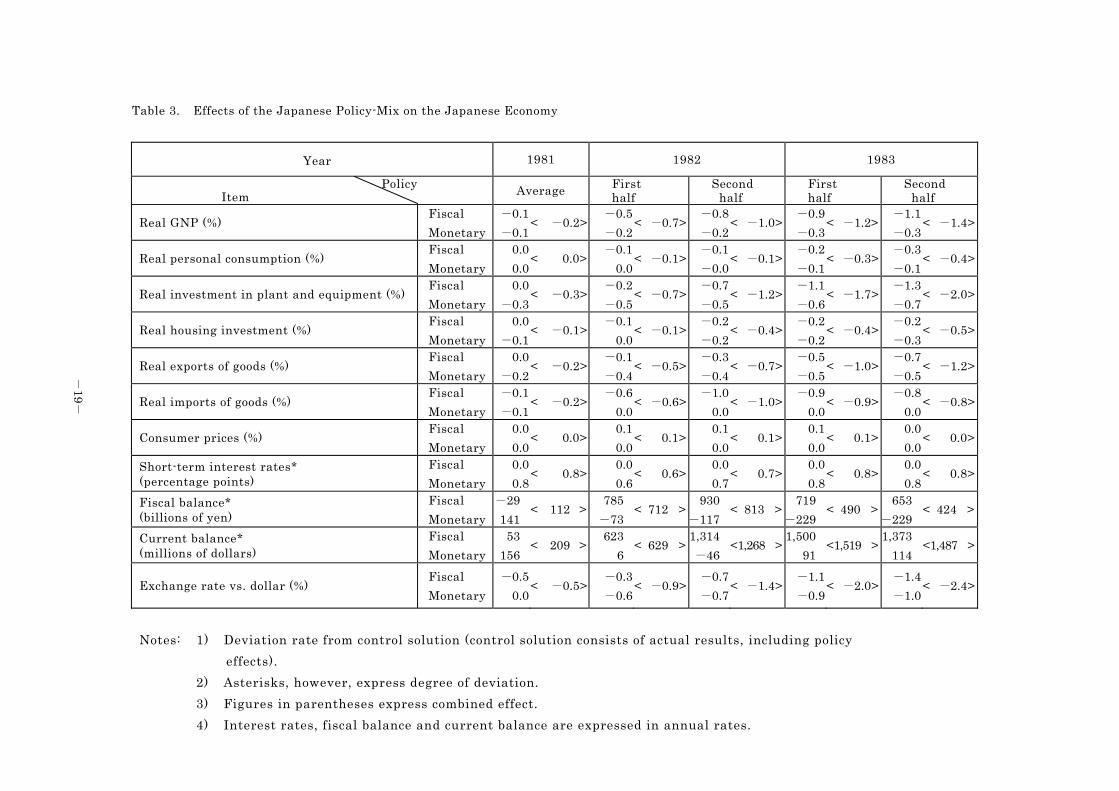
Table 3. Effects of the Japanese Policy-Mix on the Japanese Economy
Year 1981 1982 1983
Item Policy
Average First half
Secondhalf
Firsthalf
Secondhalf
Real GNP (%) Fiscal
Monetary
-0.1
-0.1< -0.2>
-0.5
-0.2 < -0.7>
-0.8
-0.2< -1.0>
-0.9
-0.3< -1.2>
-1.1
-0.3< -1.4>
Real personal consumption (%) Fiscal
Monetary
0.0
0.0< 0.0>
-0.1
0.0 < -0.1>
-0.1
-0.0< -0.1>
-0.2
-0.1< -0.3>
-0.3
-0.1< -0.4>
Real investment in plant and equipment (%)Fiscal
Monetary
0.0
-0.3< -0.3>
-0.2
-0.5 < -0.7>
-0.7
-0.5< -1.2>
-1.1
-0.6< -1.7>
-1.3
-0.7< -2.0>
Real housing investment (%) Fiscal
Monetary
0.0
-0.1< -0.1>
-0.1
0.0 < -0.1>
-0.2
-0.2< -0.4>
-0.2
-0.2< -0.4>
-0.2
-0.3< -0.5>
Real exports of goods (%) Fiscal
Monetary
0.0
-0.2< -0.2>
-0.1
-0.4 < -0.5>
-0.3
-0.4< -0.7>
-0.5
-0.5< -1.0>
-0.7
-0.5< -1.2>
Real imports of goods (%) Fiscal
Monetary
-0.1
-0.1< -0.2>
-0.6
0.0 < -0.6>
-1.0
0.0< -1.0>
-0.9
0.0< -0.9>
-0.8
0.0< -0.8>
Consumer prices (%) Fiscal
Monetary
0.0
0.0< 0.0>
0.1
0.0 < 0.1>
0.1
0.0< 0.1>
0.1
0.0< 0.1>
0.0
0.0< 0.0>
Short-term interest rates* (percentage points)
Fiscal
Monetary
0.0
0.8< 0.8>
0.0
0.6 < 0.6>
0.0
0.7< 0.7>
0.0
0.8< 0.8>
0.0
0.8< 0.8>
Fiscal balance* (billions of yen)
Fiscal
Monetary
-29
141< 112 >
785
-73 < 712 >
930
-117< 813 >
719
-229< 490 >
653
-229< 424 >
Current balance* (millions of dollars)
Fiscal
Monetary
53
156< 209 >
623
6 < 629 >
1,314
-46<1,268 >
1,500
91<1,519 >
1,373
114<1,487 >
Exchange rate vs. dollar (%) Fiscal
Monetary
-0.5
0.0< -0.5>
-0.3
-0.6 < -0.9>
-0.7
-0.7< -1.4>
-1.1
-0.9< -2.0>
-1.4
-1.0< -2.4>
Notes: 1) Deviation rate from control solution (control solution consists of actual results, including policy
effects).
2) Asterisks, however, express degree of deviation.
3) Figures in parentheses express combined effect.
4) Interest rates, fiscal balance and current balance are expressed in annual rates.
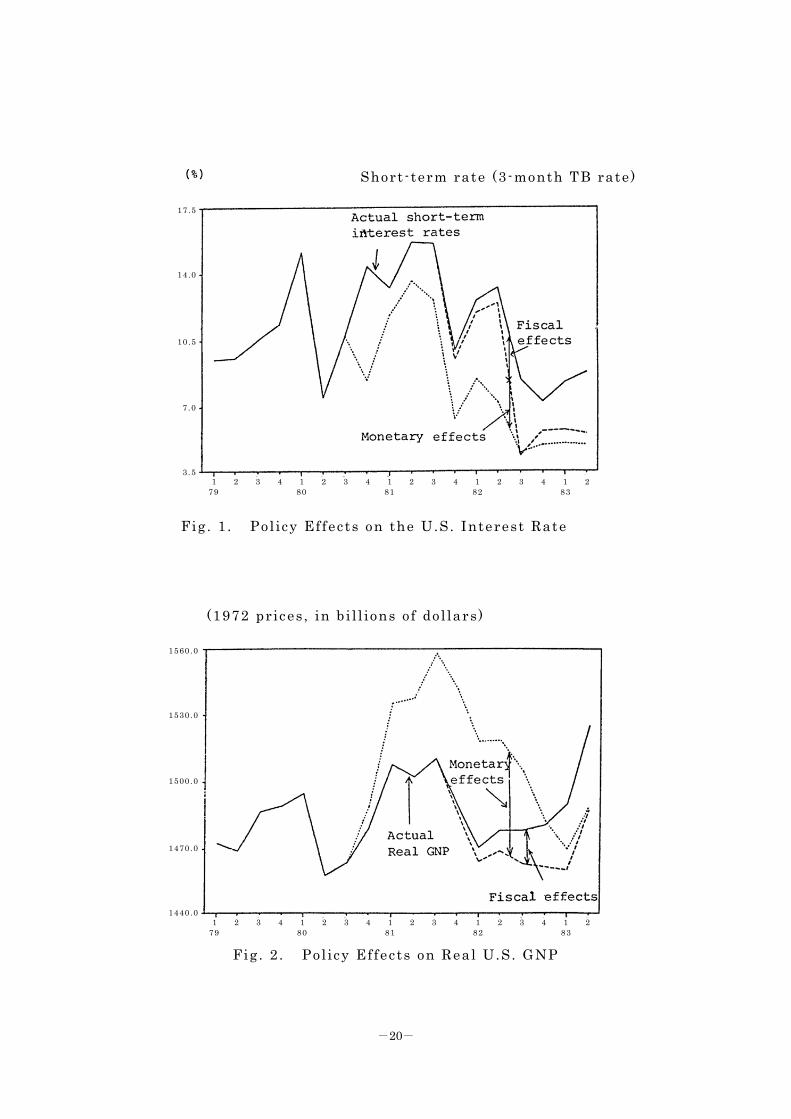
-20-
Short - term rate (3-month TB rate)
Fig . 1 . Pol icy Effects on the U.S. Interest Rate
(1972 prices , in bi l l ions of dol lars)
Fig . 2 . Pol icy Effects on Real U.S. GNP
1 2 3 4 1 2 3 4 1 2 3 4 1 2 3 4 1 2 79 80 81 82 83
1 2 3 4 1 2 3 4 1 2 3 4 1 2 3 4 1 2 79 80 81 82 83
17 .5
14 .0
10 .5
7 .0
3 .5
1560 .0
1530 .0
1500 .0
1470 .0
1440 .0
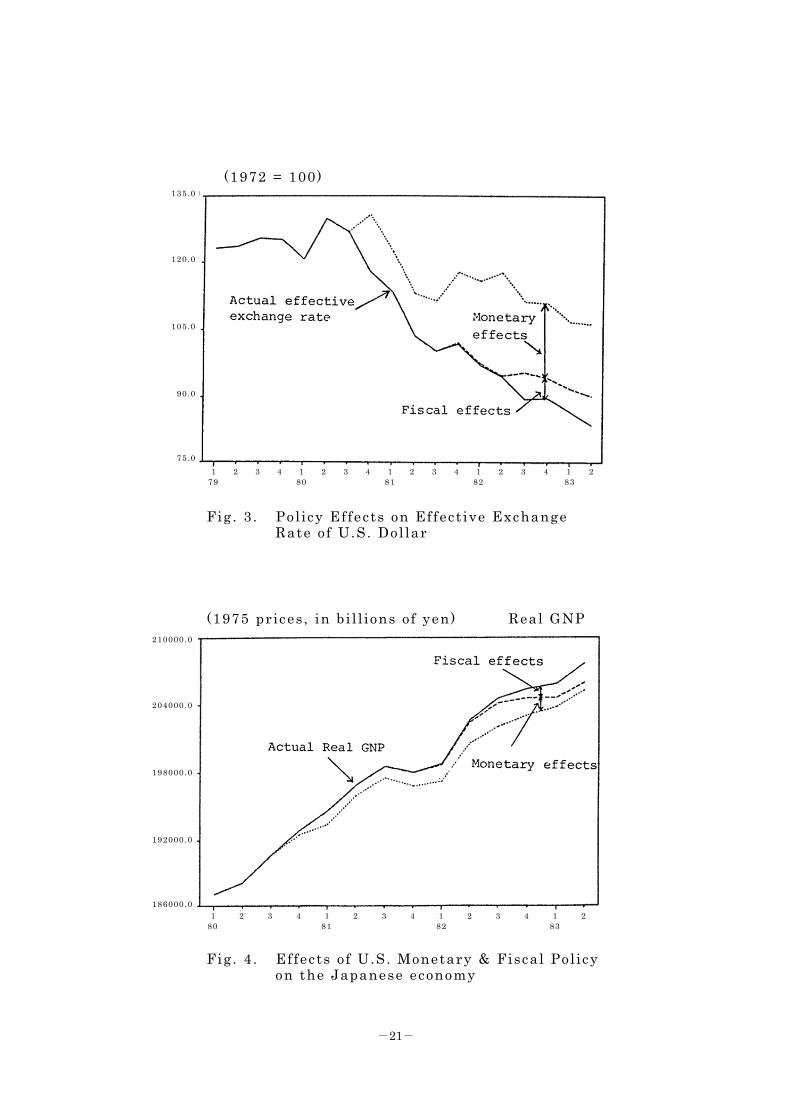
-21-
(1972 = 100)
Fig . 3 . Pol icy Effects on Effect ive Exchange
Rate of U.S. Dol lar
(1975 prices , in bi l l ions of yen) Real GNP
Fig . 4 . Ef fects o f U.S. Monetary & Fiscal Pol icy on the Japanese economy
1 2 3 4 1 2 3 4 1 2 3 4 1 2 3 4 1 2 79 80 81 82 83
1 2 3 4 1 2 3 4 1 2 3 4 1 2 80 81 82 83
135.0
120.0
105.0
90 .0
75 .0
210000.0
204000.0
198000.0
192000.0
186000.0
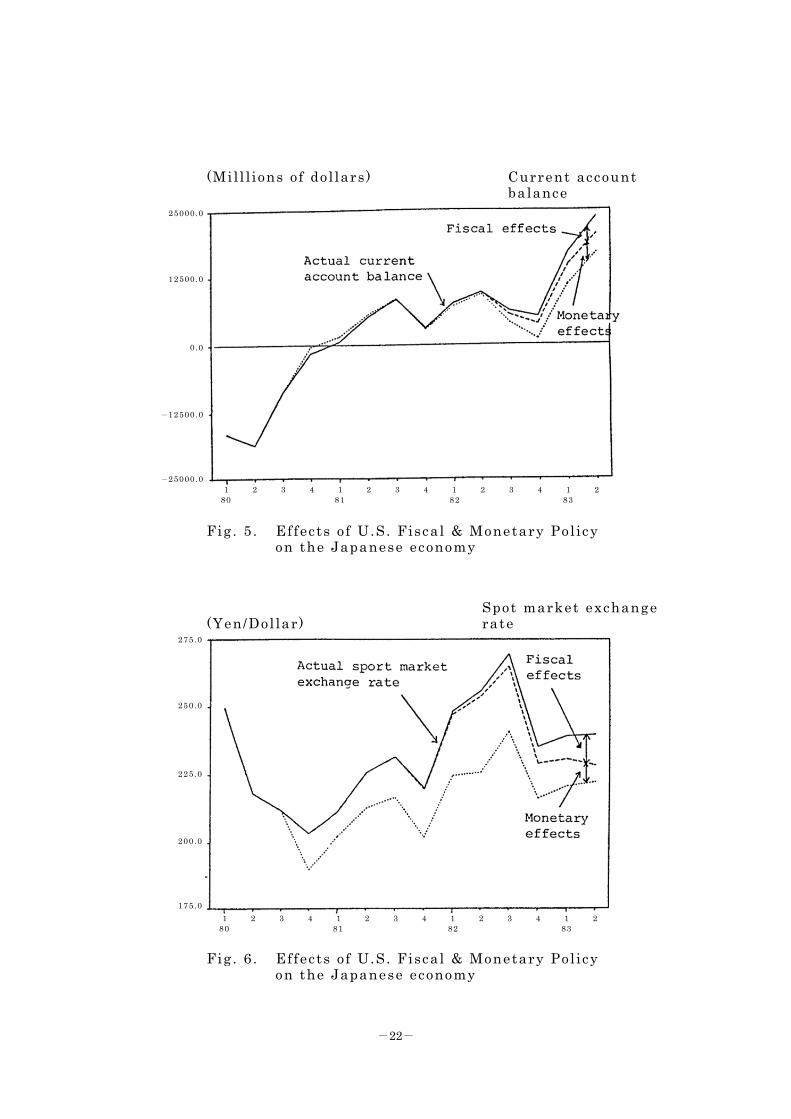
-22-
(Mi l l l ions of dol lars) Current account balance
Fig . 5 . Ef fects o f U.S. Fiscal & Monetary Pol icy on the Japanese economy
Spot market exchange (Yen/Dol lar) rate
Fig . 6 . Ef fects o f U.S. Fiscal & Monetary Pol icy
on the Japanese economy
1 2 3 4 1 2 3 4 1 2 3 4 1 2 80 81 82 83
1 2 3 4 1 2 3 4 1 2 3 4 1 2 80 81 82 83
275.0
250.0
225.0
200.0
175.0
25000.0
12500.0
0 .0
-12500.0
-25000.0
-23-
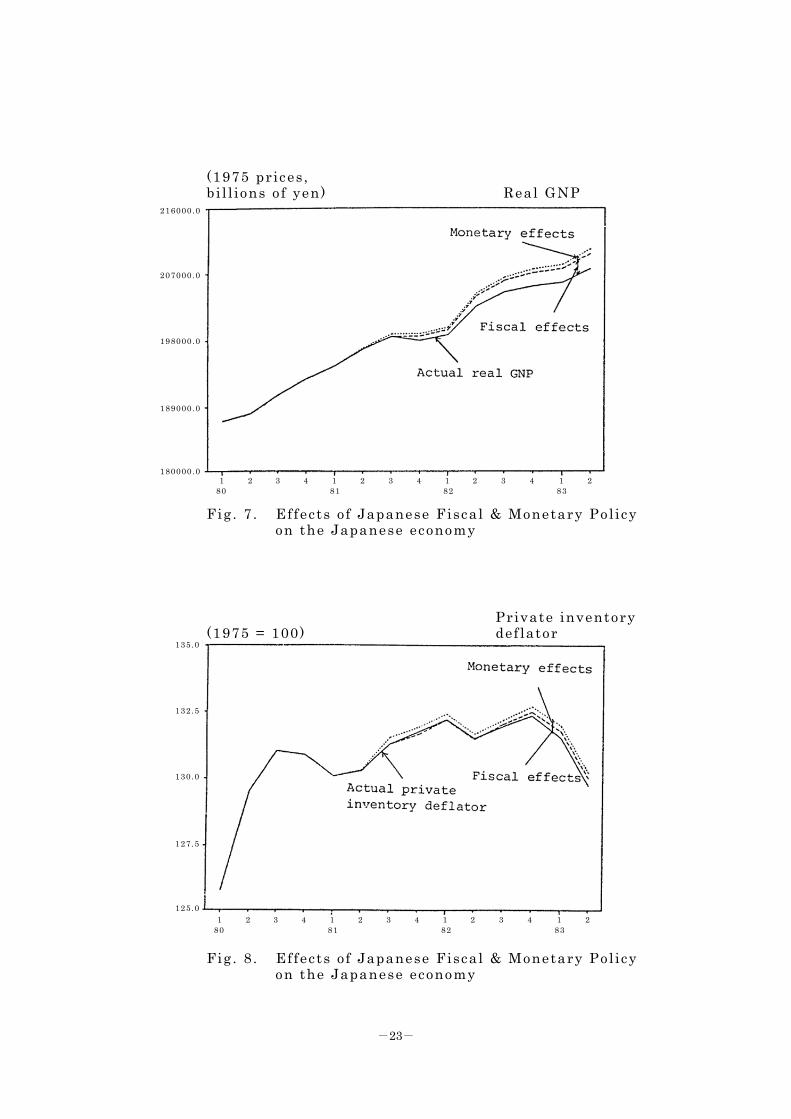
(1975 prices , b i l l ions o f yen) Real GNP
Fig . 7 . Ef fects o f Japanese Fiscal & Monetary Pol icy on the Japanese economy
Private inventory (1975 = 100) def lator
Fig . 8 . Ef fects o f Japanese Fiscal & Monetary Pol icy
on the Japanese economy
1 2 3 4 1 2 3 4 1 2 3 4 1 2 80 81 82 83
1 2 3 4 1 2 3 4 1 2 3 4 1 2 80 81 82 83
135.0
132.5
130.0
127.5
125.0
216000.0
207000.0
198000.0
189000.0
180000.0
-24-
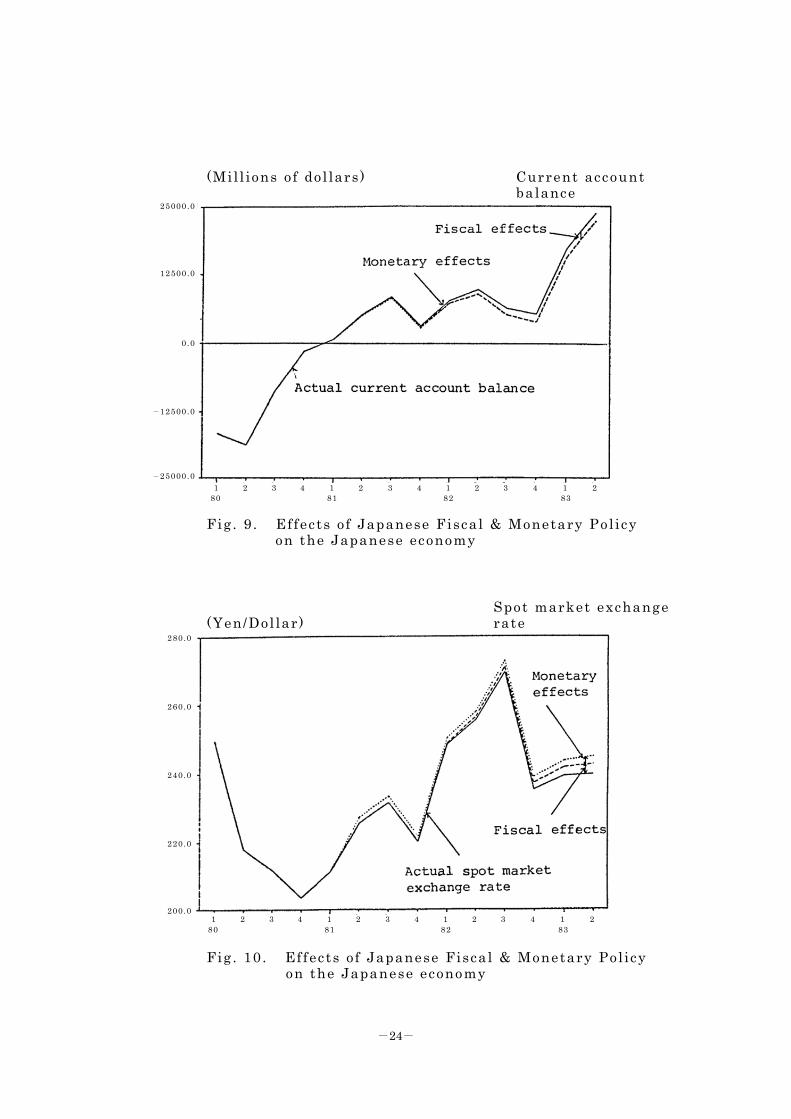
(Mi l l ions o f dol lars) Current account balance
Fig . 9 . Ef fects o f Japanese Fiscal & Monetary Pol icy on the Japanese economy
Spot market exchange (Yen/Dol lar) rate
Fig . 10. Ef fects o f Japanese Fiscal & Monetary Pol icy
on the Japanese economy
25000.0
12500.0
0 .0
-12500.0
-25000.0
280.0
260.0
240.0
220.0
200.0
1 2 3 4 1 2 3 4 1 2 3 4 1 2 80 81 82 83
1 2 3 4 1 2 3 4 1 2 3 4 1 2 80 81 82 83
-25-
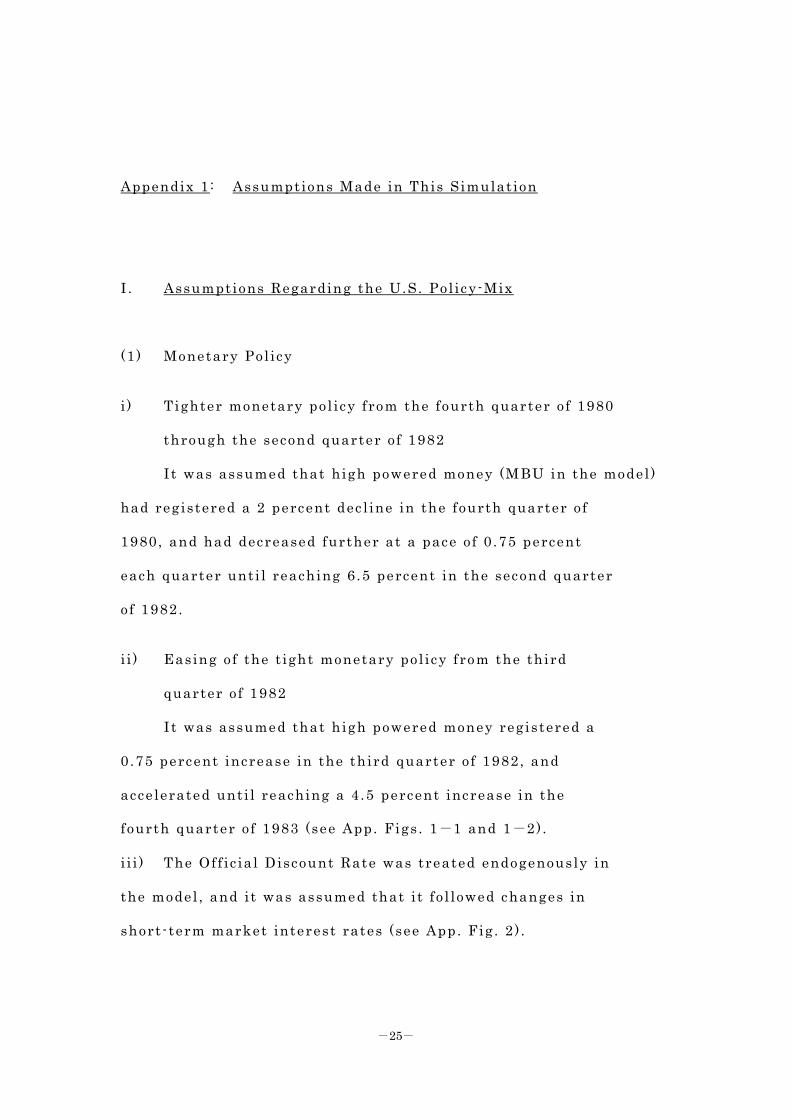
Appendix 1 : Assumptions Made in This Simulat ion
I . Assumptions Regarding the U.S. Pol icy-Mix
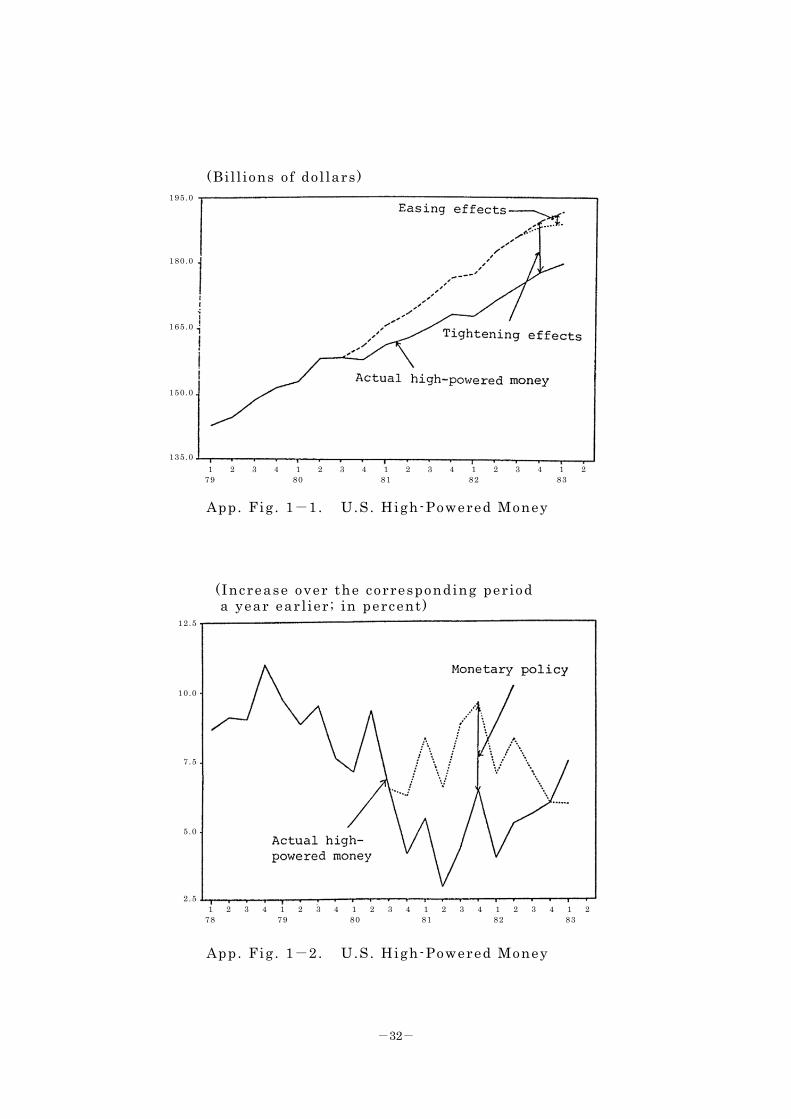
(1) Monetary Pol icy
i ) Tighter monetary pol icy from the fourth quarter o f 1980
through the second quarter o f 1982
It was assumed that high powered money (MBU in the model )
had registered a 2 percent dec l ine in the fourth quarter o f
1980, and had decreased further at a pace of 0 .75 percent
each quarter unti l reaching 6 .5 percent in the second quarter
o f 1982.
i i ) Easing o f the t ight monetary pol icy from the third
quarter of 1982
I t was assumed that high powered money registered a
0 .75 percent increase in the third quarter o f 1982, and
accelerated unti l reaching a 4 .5 percent increase in the
fourth quarter o f 1983 (see App. Figs . 1-1 and 1-2) .
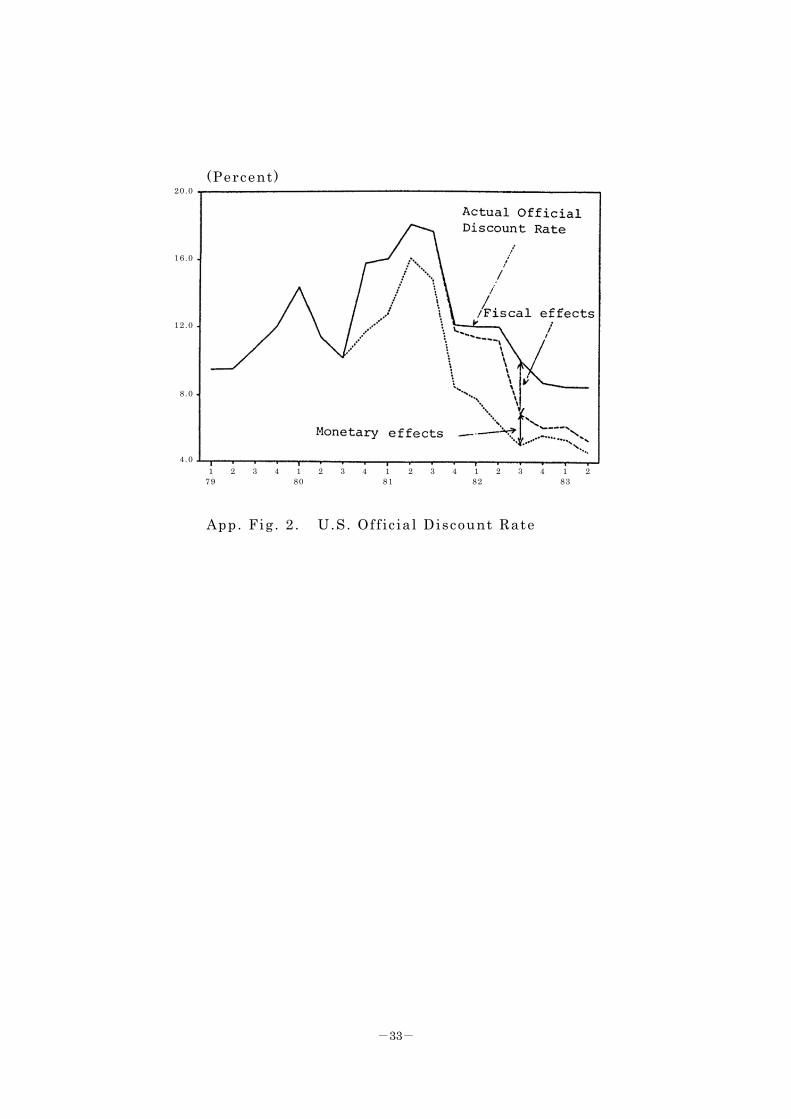
i i i ) The Off ic ial Discount Rate was treated endogenously in
the model , and i t was assumed that i t fo l lowed changes in
short -term market interest rates (see App. Fig . 2) .
-26-
(2 ) Fiscal Pol icy
i ) Cuts in Personal Income Tax
The marginal tax rate was reduced by approximately 25
percent over three years . The assumption made for our
s imulat ion was a total decl ine in revenues from personal
income tax of 25 percent over three years , as fo l lows:
Fourth quarter , 1981 . . . . . 5 percent
Third quarter , 1982 . . . . 10 percent
Third quarter , 1983 . . . . 10 percent
i i ) Other Fiscal Pol ic ies
In addit ion to cuts in personal income tax, the f iscal
pol icy of the Reagan Administrat ion included the fo l lowing:
1 . Changes in expenditure structure ( increase in
defence spending, curbs on social security and
other expenditures)
2 . Corporate tax reductions through accelerated
depreciat ion and easing investment taxes
3 . Increases in indirect tax
These three areas were not included in our analysis
mainly because of the di f f iculty in identi fy ing their content
quanti tat ively and the fact that the model s tructure is not
suf f ic ient ly equiped to handle these po l icy measures .
-27-
I I . Assumptions Regarding Japanese Economic Pol icy
(1 ) Of f ic ial Discount Rate
The actual Off ic ial Discount Rate was as fo l lows:
- Second to third quarter of 1981 . . . . 6 .25 percent
- Fourth quarter of 1981 to third quarter o f 1983 . . . . . . . . . . . . . . 5 .50 percent
- Since fourth quarter o f 1983 . . . . . . . 5 .00 percent
This represents a considerable delay in reducing the
of f ic ia l d iscount rate . The re lat ive scope of the t ight
monetary pol icy was indicated by the di f ference between these
actual rates and the present 5 percent Of f ic ial Discount
Rate (assuming that the rate was cut to 5 percent in the
second quarter of 1981) .
(2) Quanti tat ive Monetary Pol icy
Actual trends in high-powered money did not increase
from the second quarter o f 1982, remaining virtual ly on a
par with previous year levels . This indicated that the rate
of increase in high powered money was lower than the annual
average increase of about 12.5 percent during 1978-81, the
s lowdown in the rate o f increase being taken to represent
the quantitat ive scope of the t ight monetary po l icy .
-28-
(3 ) Fiscal Pol icy
The decrease in the rat io o f publ ic investment to GNP
after the second hal f o f 1981 compared to the average for
1976-80 (9 .6 percent , in 1975 pr ices) was interpreted as a
decl ine in publ ic investment attr ibutable to f iscal
reconstruct ion. This represents decreases in publ ic invest-
ment of 3 percent in the second hal f o f 1981, and of about 6
percent from the second quarter o f 1982.
-29-
Appendix 2 : Points for Considerat ions in Interpret ing the
Results
(1 ) The in-sample period used to compute mult ipl iers was
from 1977 to 1981, not from 1980 to 1983, when the pol ic ies
analysed here were actual ly implemented. In this report ,
the mult ipl ier analysis carr ied out for 1977-81 was inter-
preted as the actual pol icy e f fects in 1980-83.
Mult ipl iers are represented as deviat ions from the
control so lut ions, which were so adjusted as to trace actual
values in the in-sample period of 1977-81. Mult ipl iers were
calculated by applying shocks which were assumed ( in Appendix 1)
to represent economic pol ic ies actual ly undertaken in 1980-83
to the control so lut ions. These mult ipl iers are
interpreted as the ef fects o f actual pol ic ies and expressed
in percent or in terms of absolute values . Figures 1-10 in
the text were drawn by deducting such pol icy e f fects from
actual values of 1980-83.
(2) In calculat ing pol icy ef fects , monetary pol icy s imula-
t ion was used f irst and then s imulat ion of the whole pol icy-
mix was run. The di f ference between the two s imulat ions was
taken as the ef fects o f f iscal pol icy , though the model is
-30-
not perfect ly l inear . However , as the model maintains almost
total l inearit ies in the neighborhood o f the control so lut ion,
there are only minor discrepancies in the results , i f the
order o f pol icy s imulat ion is a ltered. This method of
calculat ion was appl ied to both the U.S. and Japan.
(3) Of the World Economic Model , only the Japanese , U.S.
and world trade l inkage models ( inc luding the regional model )
were used, whi le seven other countries (West Germany, France,
U.K. , I taly , Canada, Austral ia and South Korea) were treated
as exogenous.
(4) Because the models for the 7 countries apart from the
U.S. and Japan were treated exogenously , exchange rates
other than the yen-dol lar were also treated as exogeneous.
As such, the ef fect ive dol lar exchange rate ( the weighted
average o f dol lar rates in 10 currencies) was determined
through a " f lex" method in such a way that the U.S. overal l
balance of payments was balanced for each quarter .
(5 ) As the seven countries other than the U.S. and Japan
were treated exogenously , no considerat ion was given to 1)
the def lat ionary ef fect o f high interest rate pol ic ies which
-31-
European countries might be forced to adopt to combat inf la-
t ion imported through the appreciat ion of the dol lar ; 2) the
ef fects o f higher exports from various countries as a result
o f the weakening o f their currencies against the dol lar ; 3)
the ef fect o f the decl ine of the U.S. business c l imate on
other countries ' export demand. These factors can be taken
into considerat ion only when the EPA world econometric model
is fu l ly l inked up, a task which is expected to be achieved
by February 1984.
-32-
(Bi l l ions of dol lars )
App. Fig . 1-1. U.S. High-Powered Money
( Increase over the corresponding period a year ear l ier ; in percent)
App. Fig . 1-2. U.S. High-Powered Money
1 2 3 4 1 2 3 4 1 2 3 4 1 2 3 4 1 2 79 80 81 82 83
1 2 3 4 1 2 3 4 1 2 3 4 1 2 3 4 1 2 3 4 1 2 78 79 80 81 82 83
12 .5
10 .0
7 .5
5 .0
2 .5
195.0
180.0
165.0
150.0
135.0
-33-
(Percent)
App. Fig . 2 . U.S. Of f ic ial Discount Rate
1 2 3 4 1 2 3 4 1 2 3 4 1 2 3 4 1 2 79 80 81 82 83
20 .0
16 .0
12 .0
8 .0
4 .0

![SHIFTING TRADE WINDS: U.S. BILATERALISM & ASIA-PACIFIC ... · U.S. withdrawal from the TPP was the start of a more inward-looking U.S. trade policy, [Asia - Pacific economies] picked](https://img.pdfslide.net/doc/110x75/5f96a63de0efad0e205b0ad3/shifting-trade-winds-us-bilateralism-asia-pacific-us-withdrawal-from.jpg)