Embed Size (px)
Citation preview
The Impact of Washington State Achievers Scholarship on Student Outcomes
Stephen L. DesJardins
Center for the Study of Higher and Postsecondary Education
University of Michigan
and
Brian P. McCall
Center for the Study of Higher and Postsecondary Education and
Department of Economics
University of Michigan
Paper Presented in Fulfillment of Contract with the Bill and Melinda Gates Foundation
May, 2009
Disclaimer: The views contained herein are not necessarily those of the Bill & Melinda
Gates Foundation.
2
2
Abstract
This paper uses data from the fifth cohort of the Washington State Achievers (WSA) Program to
investigate the impact of receiving a WSA scholarship on various student outcomes. Using a regression
discontinuity approach, we find that receipt of a WSA scholarship has a large positive and statistically
significant impact on the probability of college enrollment in the year after high school. We also find
that receipt of the WSA scholarship lowers student debt, and that there are sub-group differences in the
effect of the program on a number of the multiple outcomes examined.
3
3
I. Introduction
The real cost of college attendance has been increasing for a long time. For example, student
tuition and fees at public four-year colleges has increased from $3,860 to $6,590 (in 2008 dollars) over
the fifteen year academic year period beginning in 1993-94 and ending in 2008-09 (College Board,
2008). Coupled with this rise in the real cost of attendance is the fact that college students are also
leaving college with increased levels of debt (see Pew Charitable Trust, 2008). The increased financial
burden is especially heavy for students from low-income families and may be a primary factor in the
lower college attendance rates of this group (see Pell Institute, 2008)
To help offset the rise in college costs, many states have introduced scholarship programs for
their citizens. However, many of these programs (e.g. Georgia's Hope scholarship) are not need-based
and undoubtedly provide funding to students who would have attended college whether they received
the scholarship or not. In addition to state-based funding of college students, community-based
scholarship programs are being implemented around the United States (e.g., the Kalamazoo Promise)
and a number of foundations (e.g., Jack Kent Cook Foundation) have also introduced college
scholarships. The largest foundation-based initiatives are those offered by the Bill and Melinda Gates
Foundation which funds the Gates Millennium Scholars (GMS) and the Washington State Achievers
(WSA) programs. A twenty-year, one billion dollar project, the GMS program was established in 1999
to improve access to and success in higher education for low-income and high-achieving minority
students by providing them with full tuition scholarships and other types of college-going support. The
WSA program is part of an initiative to fund and support 16 high schools in Washington State as they
redesign themselves to increase academic achievement for all their students thereby promoting college
attendance and success. Part of the WSA initiative is to provide college scholarships for select students
from each of the 16 high schools.
4
4
Although we have conducted evaluations of the GMS program (DesJardins and McCall, 2006a;
2006b; 2008), in this manuscript we focus on the effects of the WSA program on various college
outcomes. We do so by using standard multivariate regression methods, as well as a quasi-experimental
method known as regression discontinuity analysis (see Trochim, 1984 for a general explanation; see
Thistlewaite and Campbell, 1960, for an application to the study of the National Scholars program; see
DesJardins and McCall 2006a; 2006b; 2008 for an application to study the GMS program).
Although there are multiple cohorts of WSA recipients, the fifth cohort is particularly amenable
to use of the RD method because a student’s scholarship eligibility is determined (to some extent) by
their score on a non-cognitive test, and there is evidence of a discontinuous increase in the probability
of receiving a WSA scholarship across this non-cognitive score. This “discontinuity” in the chances of
selection into the program can be used to help identify the causal effects of the program on any number
of student choices (e.g., enrollment in college) and educational events once the student is enrolled in
college (e.g., credit hours taken, work behavior, loan accumulation).
Using the aforementioned techniques, we find that receipt of the WSA increases enrollment in
college compared to students who do not receive the scholarship but are alike on many other
observable factors. Our results also indicate that receiving a WSA scholarship lowers the average
student loans taken by scholarship recipients relative to their non-recipient counterparts. Finally, there
is some evidence that receipt of a WSA scholarship increases the chances that a recipient will work
while in college, but their average hours worked per week are lower than their non-recipient colleagues
who also work.
The structure of the paper is s follows. The next section presents some details of the WSA
program. Section 3 briefly covers them methods used in the paper. After presenting some summary
statistics in Section 4, Section 5 presents the results from linear regression and probit model estimates
as well as estimates from their regression discontinuity analogs.
5
5
II. The Washington State Achievers Program
The Washington State Achievers (WSA) program was introduced by the Bill and Melinda Gates
Foundation in 2001. The WSA scholarships support approximately 500 low-income students each year
from 16 high schools in the state of Washington (see Appendix A for a list of the high schools). The
first Achievers Scholars were selected in the spring of 2001 and began attending college in the fall of
that year. Subsequent cohorts of students have begun or will begin attending college each fall through
2010. Unlike the Gates Millennium Scholarship program, the WSA program is a holistic program that
involves, among other things, high school reform.1
WSA scholars are chosen in their junior year of high school. To be selected, students must
graduate from high school, demonstrate financial need, and apply for need-based financial aid at the
colleges they plan to attend. Regarding their need, an applicant’s family income must be lower than 35
percent of the Washington state average and the family assets must be below a specified threshold.
Within this group of low-income students, scholarships are also (partially) allocated on the basis of the
student's total score on a non-cognitive test they are given.
WSA scholarships pay for tuition and fees for a set of colleges and universities (including some
community colleges) in the state of Washington for up to five years.2 The program is a “top up”
program in that the WSA scholarship covers any differences in the cost of attendance once other
scholarships and grants (e.g. Pell grant) are taken into account. The WSA scholars are also provided
mentors in high school and for their first two years of college.
III. Methods
To investigate the impact of receipt of the WSA scholarship on a number of educational events
and outcomes, we estimate several multivariate regressions. Linear regression techniques are employed
1 For more information on the type of school reform see Ramsey (2008).
2 For a list of eligible colleges see
http://www.collegesuccessfoundation.org/achievers/achievers_awards.htm#eligible_colleges
6
6
when the dependent variable is continuously measured (e.g., loan amount; credits taken, hours worked,
while a freshman in college) and probit regression is used when the outcome is dichotomous (e.g.,
whether the student enrolled in college or not). In these regressions we control for observable factors
such as demographic and student characteristics, characteristics of the high school the student attended,
the total non-cognitive test score (and its square), and also for the eight sub-scores of the total score.
We include these controls to try to isolate the independent effect of the WSA program on the
aforementioned outcomes.
While this rich set of predictor variables may control for observed differences between program
recipients and non-recipients, there may still be unobserved differences between scholars and non-
scholars that are related to the outcome variables of interest, making valid inferences about the program
effects problematic. One method often used to remedy this inferential problem is regression
discontinuity (RD) design. RD is a non-experimental design (see Cook and Campbell, 1979) where
subjects are assigned to the treatment (e.g., WSA participation) and control groups (e.g., WSA non-
participants) based on a score on some pre-specified criterion (or criteria). Given the selection
mechanism operating we expect that students just above and just below the cut point on the total non-
cognitive test score are distributed in an approximately random fashion. If this is the case then the
observed and unobserved characteristics of students around the cut score are very similar, akin to a
randomized experiment around the cut point. Under these circumstances an evaluation of the effect of
the program near this cut score has strong causal implications. If the program has a positive (or
negative) effect on a particular educational outcome, we expect to observe a discontinuity at or near the
cut score. This discontinuity helps to identify the causal effect of the program.
Given that most high schools choose program recipients (within each racial group) based on
their total non-cognitive test score, at some point on the distribution of this test score there is a
7
7
discontinuous increase in the probability of receiving a WSA scholarship.3 Because this discontinuous
jump at the cut-point is in the probability of scholarship receipt, the RD is known as a “fuzzy” design
(see Lemieux and Imbens, 2008, for more detail).4 Our RD estimates are obtained using two-stage
least squares when the outcome is a continuous variable, or in the case of a dichotomous measure we
estimate a bivariate probit model with an endogenous variable. The coefficient of particular interest in
these regressions is associated with the dummy variable indicating whether the total non-cognitive test
score is above (=1) or below (=0) the point at which the probability of scholarship selection “jumps”
(i.e., at the cut-point). This coefficient estimate will provide us with statistical evidence of any net
effect of the WSA program on the outcome of interest.
IV. Summary Statistics
As noted above, the allocation of scholarships among students within a particular high school
and racial group is based, to a large extent, on the student’s total non-cognitive test score. Measures of
the total non-cognitive test scores, as well as the individual components of the test, were obtained for
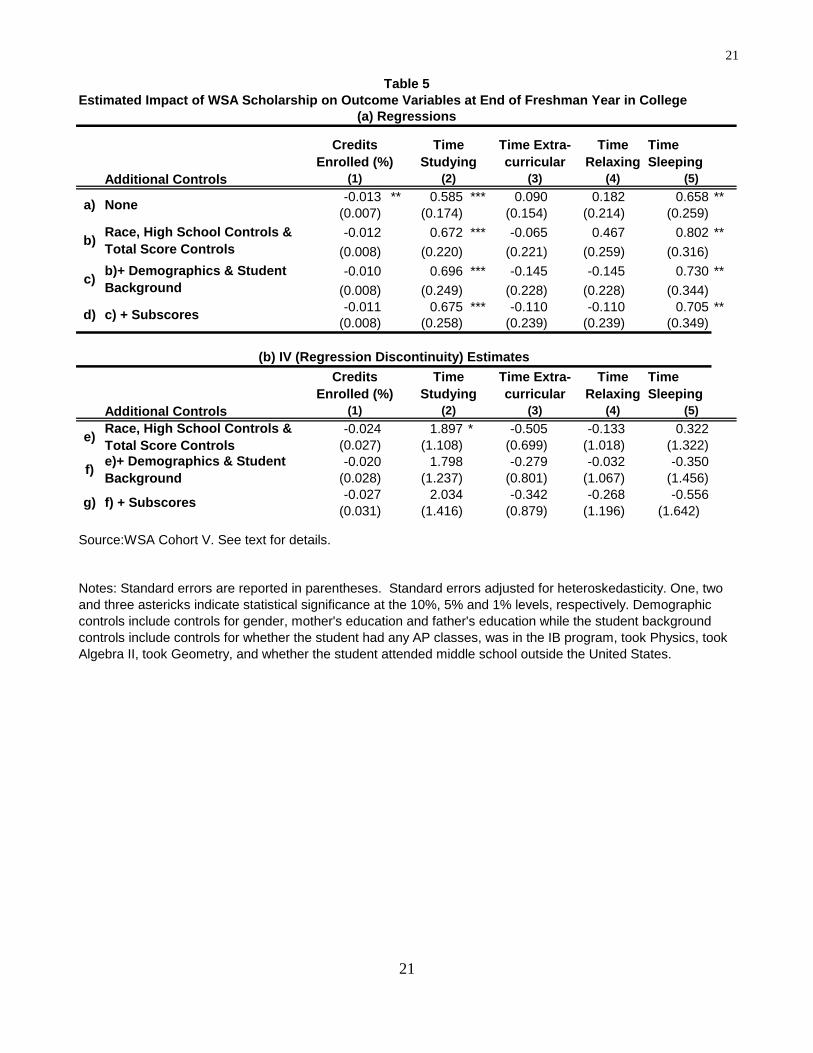
nearly all applicants (1036 out of 1052) to the WSA program. Figure 1 presents kernel density
estimates by whether the student received a WSA scholarship or not. Whereas the distributions of total
non-cognitive scores are bell-shaped for both recipients and non-recipients, the mean total non-
cognitive score is approximately 5.5 points higher for the former relative to the latter group.
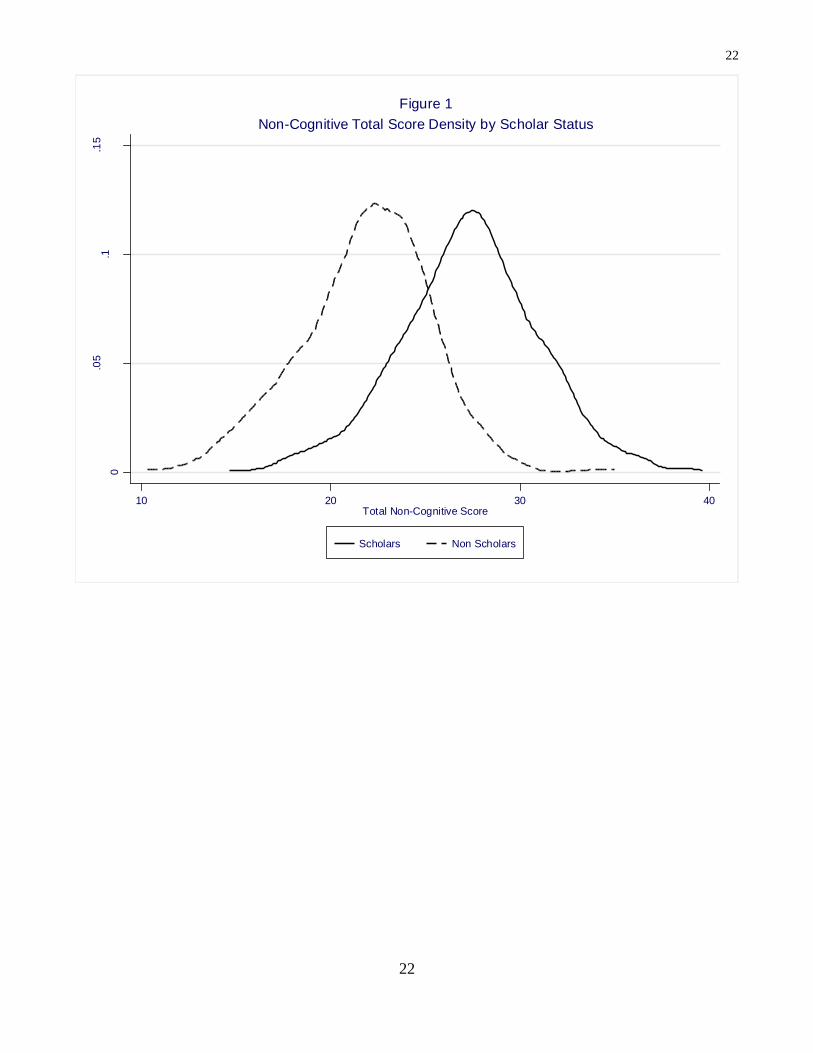
Figure 2 presents local polynomial regression estimates of the probability of receiving a
scholarship by total non-cognitive test score. The predicted probability of receiving a WSA scholarship
increases rapidly in the total non-cognitive score range of 20 to 30. At a score of 20 the estimated
probability of scholarship receipt is only .18, but increases to .52 at a total non-cognitive score of 25
3 DesJardins and McCall (2006a; 2006b; 2008) applied regression discontinuity techniques to analyze the impact of the
Gates Millennium Scholars program.
4 In a “sharp” design no individuals below the cut-point receive the scholarship while all individuals above the cut point
receive the scholarship.
8
8
and jumps to .94 at the non-cognitive score of 30. This sharp rise in the probability in the 20 to 30
score range allows us to make use of regression discontinuity methods to estimate the causal effects of
the WSA program on education outcomes.
The total non-cognitive score is comprised of eight sub-scores. The means for each of these sub-
scores are presented in Table 1 for the full group of applicants (in column 1), scholar recipients only (in
column 2), and non-recipients (see column 3). Across all applicants average scores vary from a low of
2.99 for the “Understand and Navigate Social Systems” sub-score to 3.29 for the “Positive Self-
Concept” sub-score. There are statistically significant differences between scholars and non-scholars
on all sub-scores, with scholars having uniformly higher means than non-scholars. Thus, scholars tend
to score higher on all non-cognitive components.
Because we are primarily interested in differences between scholars and non-scholars around
the 20 to 30 total score range (the “cut point”), columns (5) and (6) present the mean sub-scores for
students just above and below this point.5 It is clear that students at or just above the cut point have
statistically significantly higher means for all sub-scores than students who are one to two points below
the cut point. Thus, the differences we observed in being just above or below the cut in terms of total
non-cognitive score are not being driven by just one or two of the sub-scores.
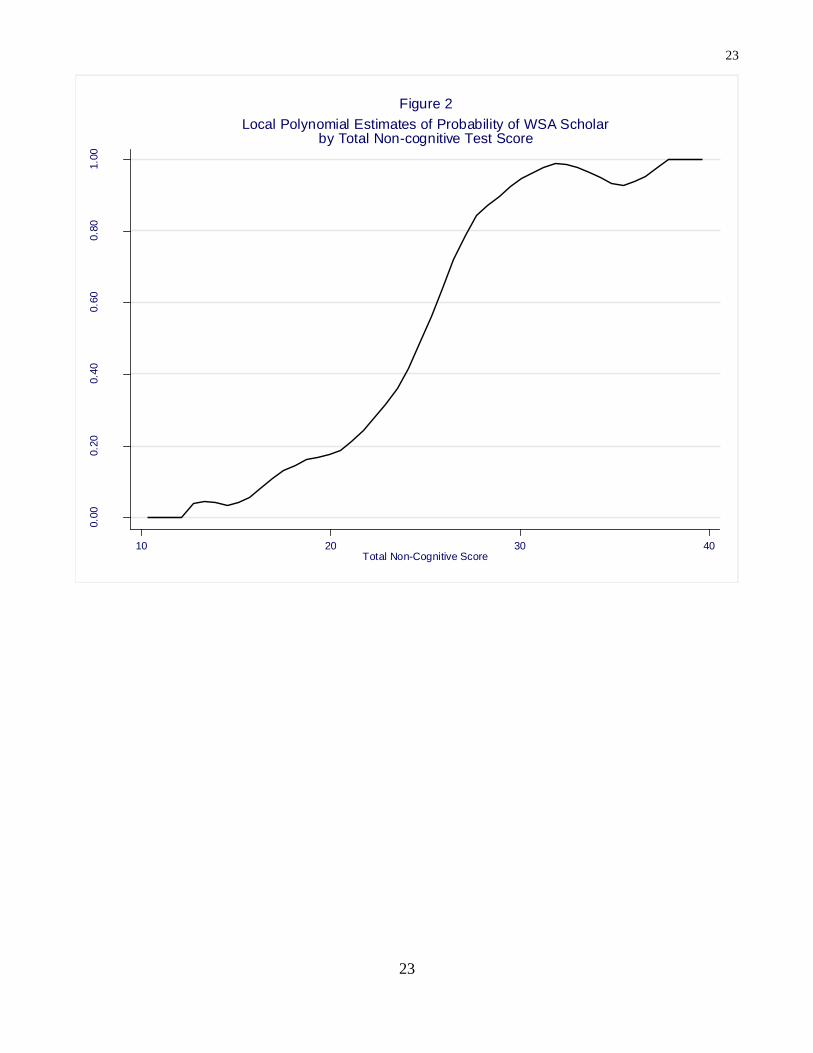
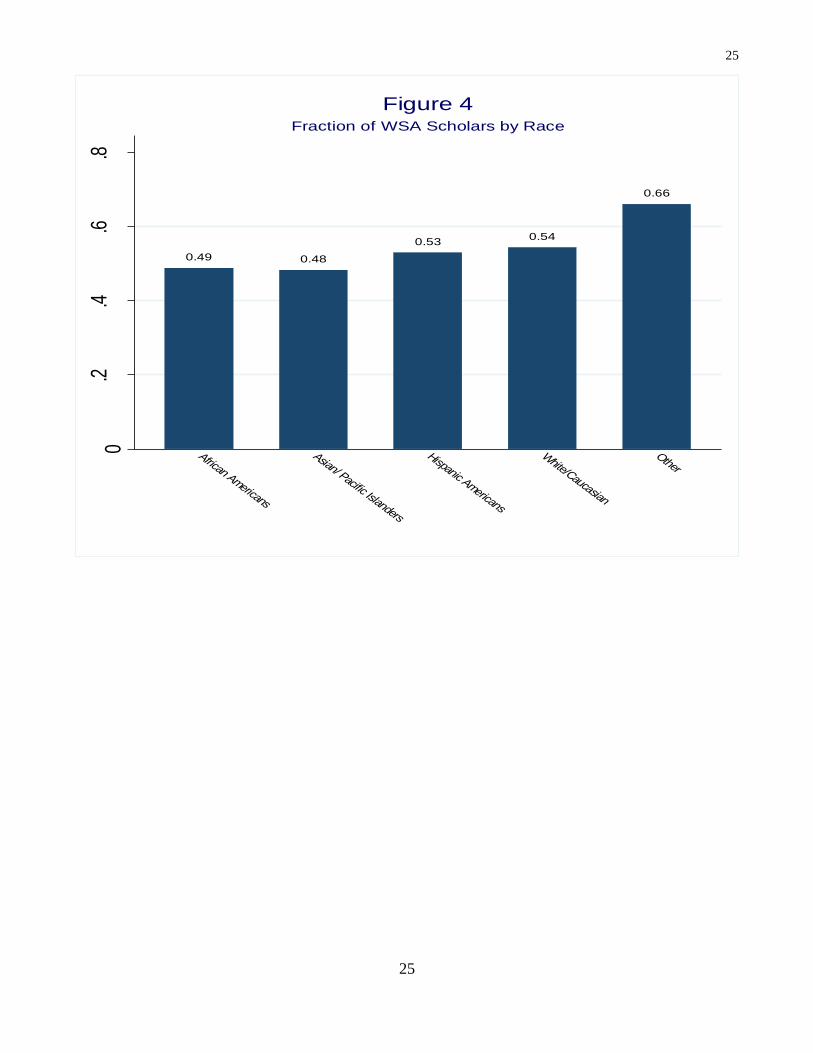
Figures 3 and 4 present the fraction of applicants by high school and race.6 Most high schools
give between 55 and 65 percent of applicants a WSA scholarship, and a test of whether the award
fractions are equal across high schools cannot be rejected (p-value = .974).7 The fraction of WSA
recipients by race varies from a low of 0.48 for Asian/Pacific Islanders to a high of 0.66 for the Other
category. These differences are statistically significant (p-value = 0.034).
5 Recall that cut scores vary by racial group and high school.
6 High school information is available only for the NORC sample of applicants. In this case fractions are based on
population weights.
7 Given the small number of applicants for some high schools, the p-value is based on an exact test.
9
9
Table 2 presents summary statistics for the various demographic and student background
variables. Column 1 presents means for the entire sample whereas columns (2) and (3) present means
by the student’s scholarship status. There are statistically significant differences between scholars and
non-scholars for the fraction of students having had any International Baccalaureate (IB) courses (0.25
versus 0.08, p-value < 0.001), any Advanced Placement (AP) courses (.30 versus .13, p-value < 0.001),
having taken Algebra II (0.80 versus 0.72, p-value = 0.004), and having taken a high school physics
course (0.33 versus 0.28, p-value = .048).
One assumption of the regression discontinuity method is that the distribution of errors be equal
just above and just below the cut point. To check this assumption, in columns (5) and (6) of Table 2 are
the means for the demographic and student background variables just above and just below the cut
point. Statistically significant differences (at the 10% significance level) between those just above and
just below the cut point are observed only for the fraction of those having taken any IB classes (0.32
versus 0.16, p-value=0.079). Thus, it appears that the observable characteristics do not differ
substantially between the group of students just above and just below the cut point.
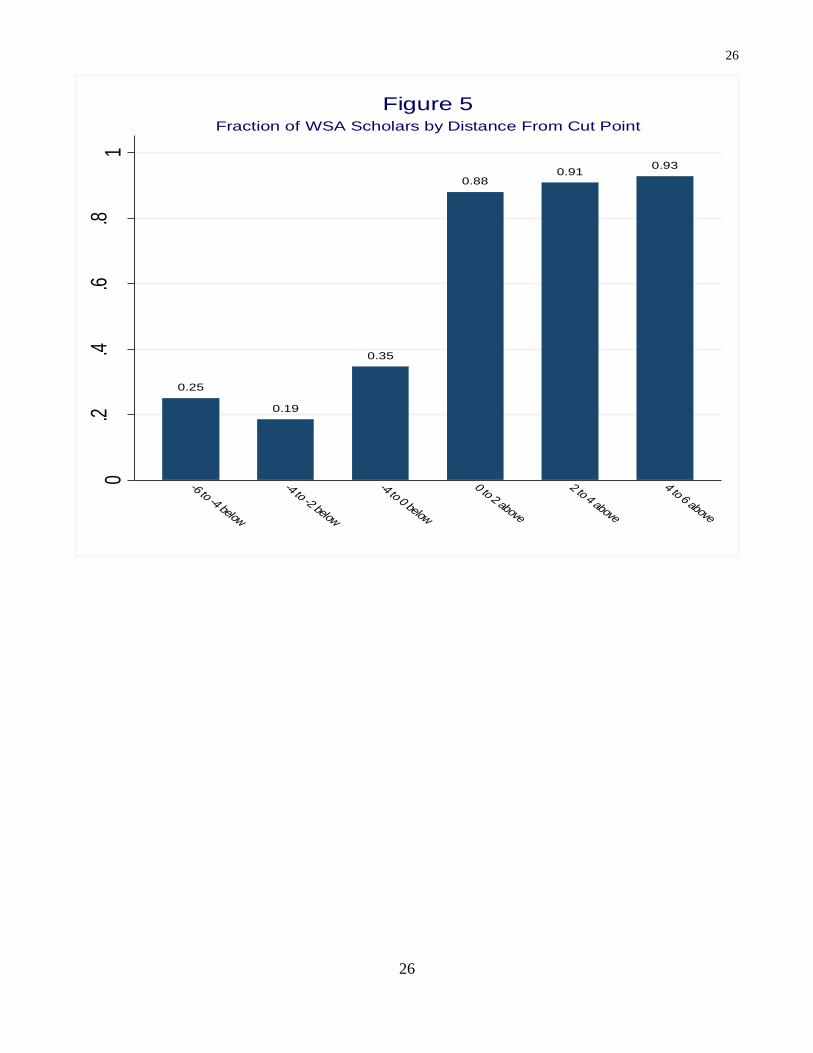
As a further check of the appropriateness of a regression discontinuity approach we examine
whether there are differences in scholarship receipt in two-point bands on both sides of the total non-
cognitive score cut point. The bar chart displayed in Figure 5 indicates small differences in the
fractions of scholars just below the cut point and just above the cut point. There is, however, a large
change in the probability of scholarship receipt at the cut point, where the fraction of WSA scholars
jumps from 0.35 to 0.88.8 This provides additional evidence that the RD approach is appropriate for
this sample.
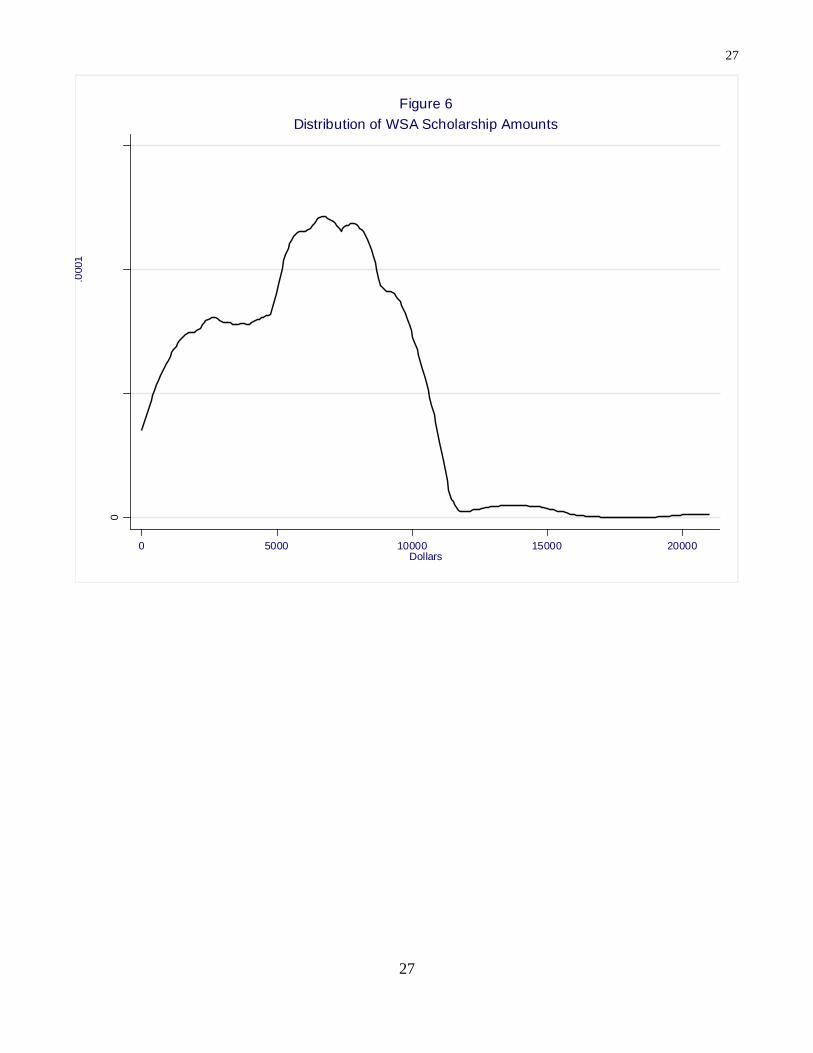
WSA scholarships provide, on average, $5,853 to students in their freshman year of college.
8 The differences in fraction of scholars between consecutive bands are not statistically significant except for those two
bands which surround the cut point.
10
10
The smoothed distribution of WSA scholarship amounts is displayed in Figure 6. The median
scholarship amount is $6,532 indicating a slight skew to the left. In addition to the WSA funding,
students also receive other sources of financial aid. The mean amount for these other sources of
scholarships and grants received by students (WSA scholars and non-scholars combined) is $9,765,
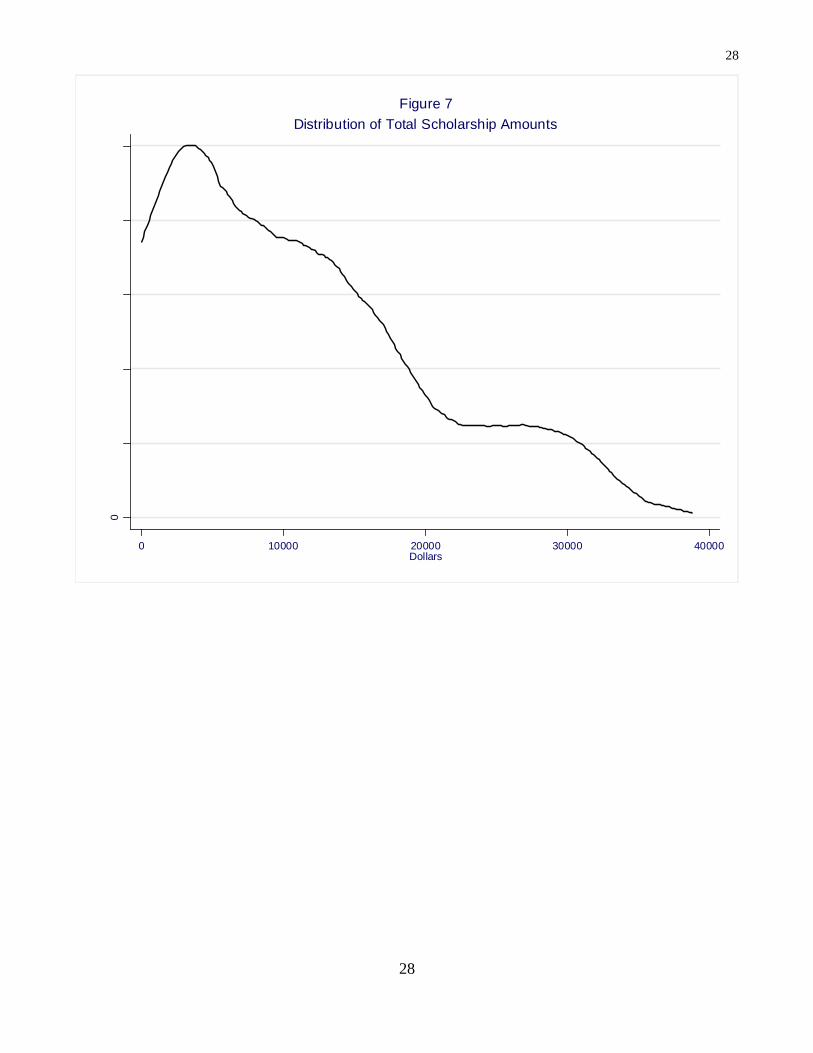
with a median of about $7,000, indicating a skew to the right. (The smoothed distribution of total
scholarship/grant amount is presented in Figure 7).
When we combine the WSA and other sources of aid, the total amount received by WSA
scholars is $11,369, whereas the average for WSA non-scholars is only $2,419. Thus, the average
difference is nearly $9,000 larger than the average WSA scholarship amount. On the other hand, on
average, WSA scholars attend colleges with yearly tuition costs that are approximately $5,800 dollars
higher than non-scholars ($13,398 for WSA scholars versus $7,602 for non-scholars).
V. Results
In this section we present the results of the inferential analyses. Table 3 presents the results for
several education outcomes, including college enrollment, loan debt, hours worked and weekly
earnings while enrolled in college. In column (1) we report results regarding the effect of a WSA
scholarship on the probability of enrolling in a postsecondary institution. Columns (2) through (5) limit
the sample to those who actually enrolled in a postsecondary institution. Column (2) presents estimates
of the effect of a WSA scholarship on the probability of attending a two-year institution, column (3)
presents the estimated effect on the average amount of loans a student receives by the end of the
freshman year, column (4) presents estimates of the effect on the average number of hours worked per
week during the freshman year, and column (5) presents estimates of the effect of the program on a
student's average weekly earnings while a freshman in college.
In row a) of Table 3 estimates are presented for linear and probit regression models with no
controls included. Row b) presents estimates where race, high school factors, and total non-cognitive
11
11
score (and its square) are added as regressors. Row c) adds student background and demographic
characteristics, and row d) adds controls for the non-cognitive sub-scores. Rows e) through g) are
similar to rows b) through d) except that we use whether a student is above the cut score as an
instrumental variable for whether a student received a WSA scholarship. Thus, the estimates in rows e)
through g) are the regression discontinuity estimates for a model with a fuzzy design.
Turning to the results for the probability of enrollment in the top panel of Table 3, we find that
students receiving a WSA scholarship are statistically significantly more likely to enroll in a
postsecondary institution than their non-WSA colleagues, and this effect remains when additional
controls are added. In the model with a full set of controls (see row c), a WSA scholarship is estimated
to increase the probability of enrollment by .32 relative to the non-WSA group. The regression
discontinuity estimates reported in the bottom panel yield similar results. The estimated effect of a
WSA scholarship on the probability of enrollment for the regression discontinuity model with a full set
of controls is 0.42 and is statistically significant at the 5 percent level.
Whereas probit estimates of the probability of attending a two-year college yield statistically
significant negative effects of receiving a WSA scholarship, these results do not persist when
employing the regression discontinuity method. The RD point estimates in the lower panel of Table 3
are negative, but compared to the probit estimates in the upper panel their magnitude is cut by roughly
two-thirds and none of the estimates are statistically significant at conventional levels.
Linear regression estimates of the effect of a WSA scholarship on average student loan amounts
(displayed in the upper panel of Table 3) are negative but not statistically significant. However, the
magnitude of the regression discontinuity estimate on loan amount (in the lower panel) increases
substantially compared to the linear results and is statistically significant at the 5 percent level. The
point estimate for the RD model with the full set of covariates suggests that receipt of a WSA
scholarship lowers the average student loan amounts in the freshman year by about $4,500 compared to
12
12
students who do not receive the scholarship.
Estimates of the effect of a WSA scholarship on hours worked are negative and statistically
significant for all linear model specifications (displayed in the upper panel of Table 3). The estimate for
the model including a full set of controls indicates that receiving a WSA scholarship reduces the
average hours worked by approximately five hours per week. Although the estimates from the RD
models are also negative, and the point estimates are actually larger for the model with the full set of
controls, the standard errors are considerably larger thus the estimated effects are not statistically
significant.
The pattern of findings for the impact of the WSA scholarship on weekly earnings is similar to
those for weekly hours of work in that the linear regression estimates are all statistically significant and
negative, and the RD estimates are not statistically significant even though the point estimates are also
negative and larger in magnitude.
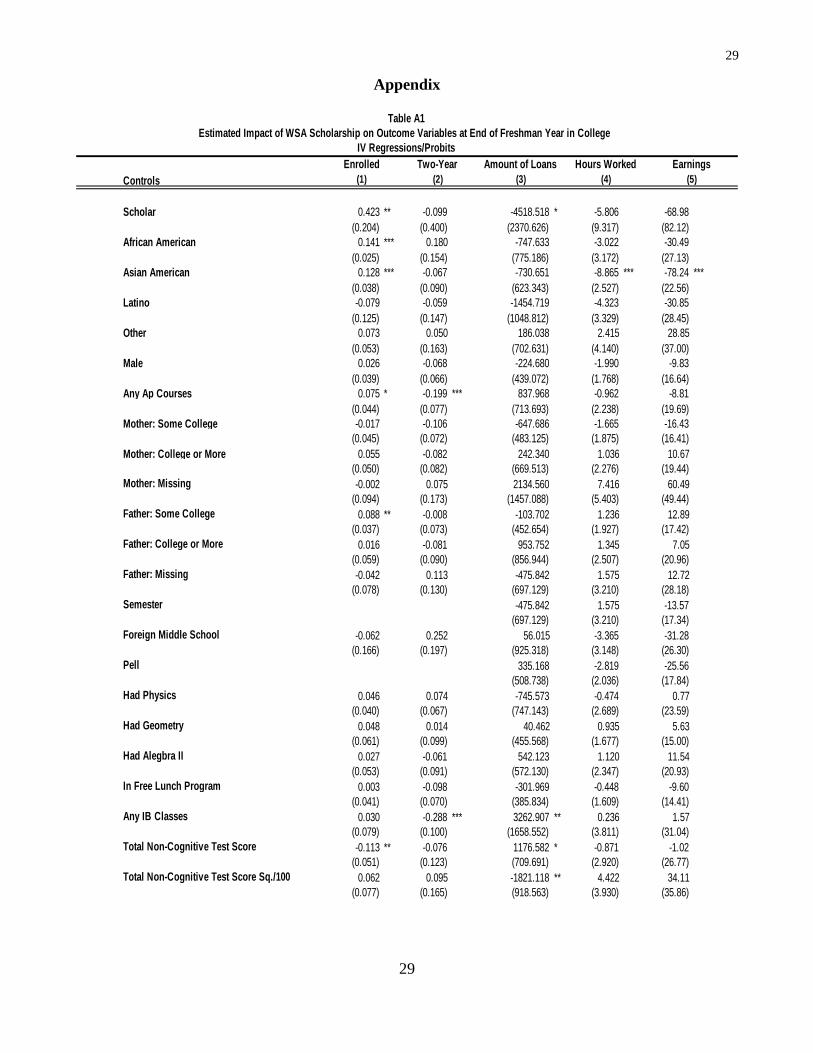
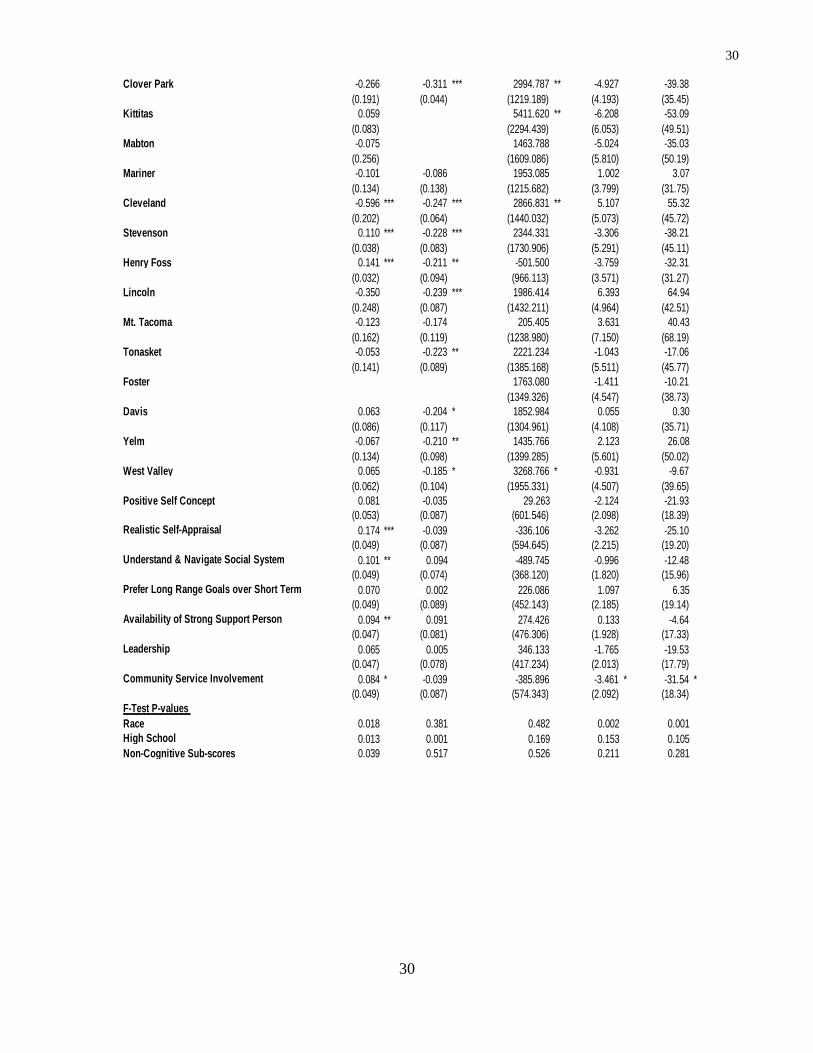
Table 3 focuses on the regressor of interest: the effect of being a WSA scholar on each outcome.
In Table A1 in the Appendix we present the RD results for each dependent variable when a full set of
controls are included as regressors. This is done so that we can examine the effect of other important
variables on each of the outcomes examined.
For enrollment there are significant race effects, with African American students and Asian
American students having higher enrollment rates (14 and 13 percentage points, respectively) than
white students, all else equal. There are also statistically significant race effects for hours worked and
earnings, with Asian American students working less and earning less than white students.
There is weak evidence that students who took an AP course in high school are more likely to
enroll in college than student who did not take any AP courses during high school. However, given
enrollment in college, students who took an AP course in high school are significantly less likely to
attend a two-year college than students who did not take an AP course in high school. Students who
13
13
took an IB course in high school are, all else equal, significantly less likely to enroll in a two-year
college.
In Table 4 we present estimates that disaggregate the total effect of the WSA scholarship on
hours worked into its component parts: the probability of working and the expected hours of work
conditional on working. The RD estimates suggest that the receipt of a WSA scholarship increases the
probability of working while in college, but decreases the average number of hours worked conditional
on working.
Table 5 presents additional detail about the effect of receiving a WSA scholarship on the
average number of credits (measured as a fraction of credits required for graduation) that a student
takes during their freshman year, and the average number of hours a week a student spends studying,
involved in extracurricular activities, relaxing, and sleeping during year one of college. We find
statistically positive effects of receiving a WSA scholarship on the average hours spent studying and
sleeping when using the linear regression (upper panel of Table 5). For the RD estimates the
magnitudes of the effect of receiving a WSA increase but so do the standard errors. Weak statistical
significance is attained only for the model with race, high school and total non-cognitive score controls.
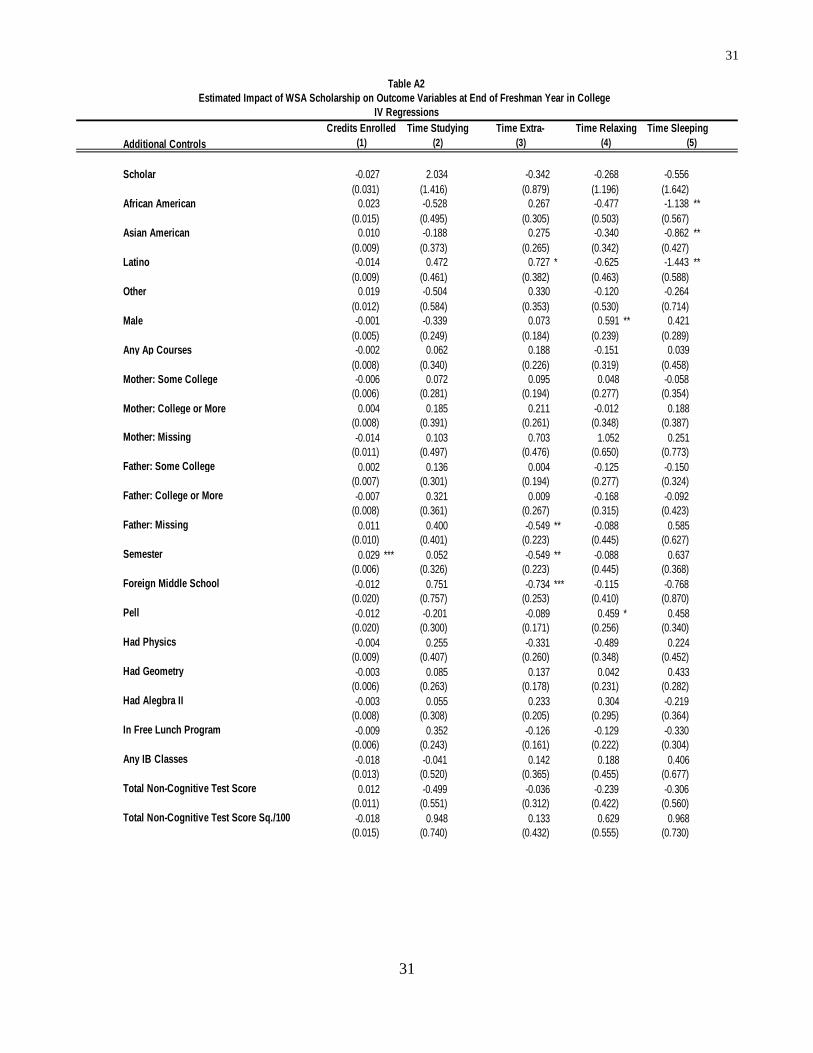
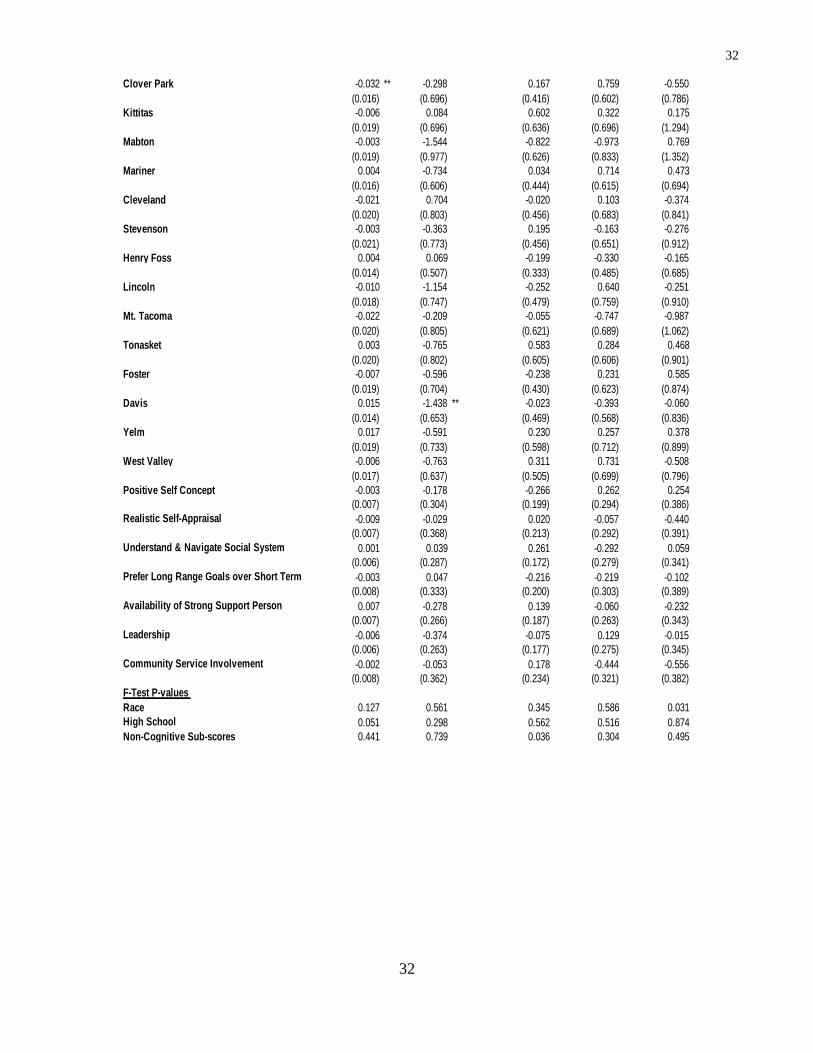
Table 5 focuses on the effect of being a WSA scholar on each outcome. In Table A2 in the
Appendix we present additional information about the dependent variables discussed in Table 5 by
providing the RD results when a full set of controls are included as regressors.
Students who attended a middle school in a foreign country spend (on average) significantly
fewer hours per week engaged in extracurricular activities than students who attended a middle school
located in the United States. There is also some evidence of racial differences in the amount of sleep
students get while in college, with African American, Asian American and Latino students reporting
significantly fewer hours of sleep per week than white students. Finally, all else equal males report
more hours per week relaxing than females and the difference is statistically significant. Not
14
14
surprisingly, students at colleges on the semester system take more credits per term than students at
schools on the quarter system, and the difference is statistically significant.
To test the robustness of our results we estimated models that included interactions of race with
total non-cognitive test score and its square, and interactions of high school attended variables with
total non-cognitive test score. These estimates are similar to those described above, although somewhat
more imprecise. For example, for the probability of enrollment the estimated impact of the WSA
scholar is 0.42 (p-value =0.012).9
We also examined differences in the effects of the program by gender. Whereas the estimated
effects of the WSA scholarship generally differed between males and females, none of these differences
were statistically significant.
Regarding the limitations of the study, only the fifth cohort of WSA applicants could be used
because in the other cohort for which data are available (Cohort III) there was no clear evidence that
the regression discontinuity design could be implemented because there were no clear “jumps” in the
probability of receiving a scholarship for the total non-cognitive test for most high schools. Thus,
because we could not pool Cohorts III and V, the sample size is relatively small leading to more
imprecise estimates than would otherwise be. Moreover, because the design we employ for the fifth
cohort is “fuzzy” our estimates are more imprecise relative to what they would be if selection into the
program was made only on one’s total non-cognitive test score (a “sharp” RD design).
Also, the effect of the scholarship on college enrollment is undoubtedly picking up not only the
financial effect of the scholarship, but is also probably picking up the effect of the other services that
the scholars receive (mentoring while in high school, and for their first two years of college). For
example, nearly 70 percent of scholars stated that the hometown mentor was helpful or very helpful to
the scholar in the college admission/selection process, so we would expect that this assistance is also
9 Full results are available upon request.
15
15
related to the types of college outcomes (e.g., enrollment, credits taken, etc.) we examined.
VI. Conclusions
This study analyzed the effect of receiving a Washington State Achievers scholarship on several
college education-related variables. Regression discontinuity estimates find large and statistically
significant effects of receiving a WSA scholarship on college attendance. Point estimates suggest that
the receipt of a WSA scholarship increases the probability of college attendance by 42 percentage
points compared to non-WSA recipients. Regarding the effects of the scholarship receipt on student
loan debt, our results indicate that the program significantly reduces loan amounts for WSA scholarship
students. Although we found that the WSA scholarship reduces average hours worked while in college,
this result was only statistically significant in the linear regression estimates. Additional analyses we
conducted suggests that there may be two offsetting effects playing out with regard to average hours
worked: receipt of a WSA scholarship may increase the probability of working but lower the expected
number of hours worked per week among those who work while in college.
Hopefully, the manner in which WSA scholarships are distributed to future cohorts of applicants
will also lend itself to a regression discontinuity design. Also, future follow-up surveys of Cohort V
will indicate if theses wide differences in enrollment probabilities between WSA scholars and non-
scholars will persist over time.
16
16
References
College Board, 2008, Trends in College Pricing, College Board: Washington DC.
Imbens, G. and Lemieux, T. (2008). Regression Discontinuity Designs: A Guide to Practice. Journal of
Econometrics, 142: 615-635.
DesJardins, S.L. and McCall, B.P. (2008). Investigating the Causal Impact of the Gates Millennium
Scholars Program on the Correlates of College Completion, Graduation from College, and Future
Educational Aspirations of Low-Income Minority Students. A Report to the Bill and Melinda Gates
Foundation.
DesJardins, S.L. and McCall, B.P. (2006a). The Impact of the Gates Millennium Scholars Program on
the College Enrollment, Borrowing and Work Behavior of Low-Income Minority Students. A Report to
the Bill and Melinda Gates Foundation.
DesJardins, S.L. and McCall, B.P. (2006b). The Impact of the Gates Millennium Scholars Program on
Selected Academic and Non-Cognitive Outcomes: A Regression Discontinuity Analysis. A Report to the
Bill and Melinda Gates Foundation.
Pell Institute, 2008, Moving beyond Access, Pell Institute: Washington DC. Project on Student Debt,
2008, Student Debt and the Class of 2007, Project on Student Debt: Berkeley CA.
Ramsey J. (2008). Creating a High School Culture of College-Going: The Case of Washington State
Achievers. Issue Brief, Institute for Higher Education Policy.
Thistlethwaite, D. L. and Campbell, D. T. (1960). Regression Discontinuity Analysis: An Alternative to
the Ex Post Facto Experiment. Journal of Educational Psychology, 51: 309-317.
Trochim, W. M. K. (1984). Research Design for Program Evaluation: The Regression- Discontinuity
Approach. Beverly Hills, CA: Sage Publications.
17
17
Cut Score or Cut Score - 1 or
p-value Cut Score + 1 Cut Score - 2 p-value
(1) (2) (3) (4) (4) (5) (6)
Positive Self Concept 3.29 3.64 2.89 0.000 3.64 3.26 0.000
Realistic Self Appraisal 3.05 3.44 2.60 0.000 3.36 3.11 0.006
Understand and Navigate Social System 2.99 3.31 2.63 0.000 3.15 2.88 0.005
Prefer long range goals over short term 3.25 3.60 2.85 0.000 3.53 3.26 0.001
Availability of strong support person 3.03 3.28 2.74 0.000 3.21 2.93 0.001
Leadership 3.05 3.38 2.68 0.000 3.20 2.93 0.001
Community Service/Invovlement 3.04 3.33 2.71 0.000 3.23 3.07 0.046
Ability to acquire knowledge in non traditional ways 3.06 3.33 2.75 0.000 3.15 2.96 0.034
Notes: WSA Cohort V. Cut scores were determined by race with each high school.
Table 1
Sample Means and Means Just Above and Below the "Cut Points"
for Demographic and High School Background Variables
All Applicants with Total Non-
Cognitive Scores Equal to the…
Full
Sample
GMS
Scholars
Non-
Scholars
Subscore
18
18
Cut Score or Cut Score - 1 or
p-value Cut Score + 1 Cut Score - 2 p-value
(1) (2) (3) (6) (4) (5) (6)
Any IB classes 0.18 0.25 0.08 0.000 0.32 0.16 0.079
Any AP classes 0.23 0.30 0.13 0.000 0.30 0.26 0.732
Took Geometry 0.72 0.72 0.71 0.220 0.71 0.81 0.205
Took Algebra II 0.77 0.80 0.72 0.004 0.79 0.87 0.188
Took Physics 0.31 0.33 0.28 0.048 0.36 0.25 0.356
Received free lunch in HS 0.62 0.63 0.61 0.257 0.66 0.61 0.279
Attended middle school outside US 0.03 0.04 0.02 0.387 0.07 0.03 0.604
Male 0.35 0.35 0.34 0.542 0.36 0.37 0.863
Father's education
Less Than High school 0.22 0.23 0.21 0.352 0.21 0.24 0.172
High School 0.30 0.29 0.31 0.28 0.26
Some College 0.26 0.26 0.26 0.22 0.23
BA/BS Degree 0.10 0.07 0.12 0.14 0.09
Post BA/BS Degree 0.02 0.01 0.03 0.09 0.12
Don't Know 0.10 0.12 0.08
Mother's education
Less Than High School 0.20 0.18 0.21 0.838 0.22 0.21 0.180
High School 0.30 0.31 0.29 0.25 0.26
Some College 0.31 0.31 0.32 0.26 0.27
BA/BS Degree 0.10 0.10 0.11 0.18 0.17
Post BA/BS Degree 0.03 0.04 0.02 0.08 0.08
Don't know 0.05 0.06 0.05
Sample Size 521 342 179 100 60
GMS
Scholars
Non-
Scholars
Full
Sample
Notes: WSA Cohort V. Cut scores were determined by race with each high school.
Variable Name
Table 2
Sample Means and Means Just Above and Below the "Cut Points"
for Demographic and High School Background Variables
All Applicants with Total Non-
Cognitive Scores Equal to the…
19
19
0.407 *** -0.379 *** -689 -5.37 *** -46.35 ***
(0.040) (0.058) (457) (1.72) (15.22)
0.354 *** -0.383 *** -156 -5.16 ** -48.70 **
(0.055) (0.075) (517) (2.10) (18.74)
0.309 *** -0.332 *** -526 -4.23 ** -41.65 **
(0.058) (0.085) (516) (2.17) (18.99)
0.324 *** -0.349 *** -531 -4.79 ** -44.81 **
(0.060) (0.088) (518) (2.17) (19.02)
0.415 ** -0.038 -2,792 -2.88 -48.56
(0.197) (0.314) (2,090) (7.77) (69.27)
0.402 ** -0.107 -4,480 ** -7.13 -83.70
(0.200) (0.364) (2,103) (8.20) (72.98)
0.423 ** -0.099 -4,519 * -5.81 -68.98
(0.204) (0.400) (2,371) (9.32) (82.12)
e)Race, High School Controls &
Total Score Controls
f)e)+ Demographics & Student
Background
Table 3
(2) (3)
b)Race, High School Controls &
Total Score Controls
Earnings
(1)Additional Controls
Estimated Impact of WSA Scholarship on Outcome Variables at End of Freshman Year in College
Hours
Worked Earnings
Source:WSA Cohort V. See text for details.
(4) (5)
(4) (5)
c)b)+ Demographics & Student
Background
(a) Regressions/Probits
(b) IV (Regression Discontinuity) Estimates
Enrolled
Two-Year
College
Amount of
Loans
Hours
Worked
a) None
d) c) + Subscores
Enrolled
Two-Year
College
Amount of
Loans
Notes: Estimates in columns (1) and (2) are based on probit models. The estimated marginal effects are
reported. Standard errors are reported in parentheses. Standard errors adjusted for heteroskedasticity. One,
two and three astericks indicate statistical significance at the 10%, 5% and 1% levels, respectively.
Demographic controls include controls for gender, mother's education and father's education while the student
background controls include controls for whether the student had any AP classes, was in the IB program, took
Physics, took Algebra II, took Geometry, and whether the student attended middle school outside the United
States.
(1) (2) (3)
g) f) + Subscores
Additional Controls
20
20
-0.094 -5.72 ***
(0.058) (1.61)
-0.108 -4.55 **
(0.074) (2.19)
-0.065 -3.62 *
(0.080) (2.12)
-0.075 -4.09 *
(0.082) (2.23)
(1)
0.394 * -15.58 **
(0.207) (6.428)
0.430 ** -17.58 **
0.210 (8.116)
0.502 *** -19.51 *
(0.187) (9.970)
Source:WSA Cohort V. See text for details.Notes: Standard errors are reported in parentheses. Standard
errors adjusted for heteroskedasticity. One, two and three astericks
indicate statistical significance at the 10%, 5% and 1% levels,
respectively.Demographic controls include controls for gender,
mother's education and father's education while the student
background controls include controls for whether the student had
any AP classes, was in the IB program, took Physics, took Algebra
II, took Geometry, and whether the student attended middle school
outside the United States.
Additional Controls
e)Race, High School Controls &
Total Score Controls
f)a)+ Demographics & Student
Background
c)b)+ Demographics & Student
Background
d) c) + Subscores
g) v) + Subscores
None
Table 4
Estimated Impact of WSA Scholarship on Outcome Variables at
End of Freshman Year in College
(a) Regressions/Probits
b)Race, High School Controls &
Total Score Controls
(2)
(2)
(b) IV (Regression Discontinuity) Estimates
Work
(1)
Hours Worked
Among Those
Working
Work
Hours Worked
Among Those
Working
Additional Controls
a)
21
21
-0.013 ** 0.585 *** 0.090 0.182 0.658 **
(0.007) (0.174) (0.154) (0.214) (0.259)
-0.012 0.672 *** -0.065 0.467 0.802 **
(0.008) (0.220) (0.221) (0.259) (0.316)
-0.010 0.696 *** -0.145 -0.145 0.730 **
(0.008) (0.249) (0.228) (0.228) (0.344)
-0.011 0.675 *** -0.110 -0.110 0.705 **
(0.008) (0.258) (0.239) (0.239) (0.349)
-0.024 1.897 * -0.505 -0.133 0.322
(0.027) (1.108) (0.699) (1.018) (1.322)
-0.020 1.798 -0.279 -0.032 -0.350
(0.028) (1.237) (0.801) (1.067) (1.456)
-0.027 2.034 -0.342 -0.268 -0.556
(0.031) (1.416) (0.879) (1.196) (1.642)
e)
f)
g)
Race, High School Controls &
Total Score Controls
e)+ Demographics & Student
Background
f) + Subscores
Additional Controls
Time
Sleeping
(1) (2) (3)
Source:WSA Cohort V. See text for details.
(1)
a)
b)
c)
d) c) + Subscores
Race, High School Controls &
Total Score Controls
None
(b) IV (Regression Discontinuity) Estimates
Additional Controls
b)+ Demographics & Student
Background
Table 5
Estimated Impact of WSA Scholarship on Outcome Variables at End of Freshman Year in College
(a) Regressions
Notes: Standard errors are reported in parentheses. Standard errors adjusted for heteroskedasticity. One, two
and three astericks indicate statistical significance at the 10%, 5% and 1% levels, respectively. Demographic
controls include controls for gender, mother's education and father's education while the student background
controls include controls for whether the student had any AP classes, was in the IB program, took Physics, took
Algebra II, took Geometry, and whether the student attended middle school outside the United States.
Credits
Enrolled (%)
Time
Studying
Time Extra-
curricular
Time
Relaxing
Time
Sleeping
(5)(4)(3)(2)
(4) (5)
Credits
Enrolled (%)
Time
Studying
Time Extra-
curricular
Time
Relaxing
22
22
0
.05
.1.1
5
de
nsity
10 20 30 40Total Non-Cognitive Score
Scholars Non Scholars
Non-Cognitive Total Score Density by Scholar Status
Figure 1
23
23
0.0
00.2
00.4
00.6
00.8
01.0
0
Pro
bab
ility
of W
SA
10 20 30 40Total Non-Cognitive Score
Local Polynomial Estimates of Probability of WSA Scholarby Total Non-cognitive Test Score
Figure 2
24
24
0.600.57
1.00
0.44
0.75
0.610.58 0.58
0.63 0.620.59
0.65 0.65
0.600.58
0.49
0.2
.4.6
.81
Frac
tion
Kent-Meridian
Clover Park
Truman Center
Kittitas
Mabton
Mariner
Cleveland
Stevenson
Henry Foss
Lincoln
Mt. Tahoma
Tonasket
Foster
DavisYelm
West Valley
Fraction of WSA Scholars by High School
Figure 3
25
25
0.49 0.48
0.530.54
0.66
0.2
.4.6
.8
Frac
tion
African Americans
Asian/ Pacific Islanders
Hispanic Americans
White/Caucasian
Other
Fraction of WSA Scholars by Race
Figure 4
26
26
0.25
0.19
0.35
0.880.91
0.93
0.2
.4.6
.81
Frac
tion
-6 to -4 below
-4 to -2 below
-4 to 0 below
0 to 2 above
2 to 4 above
4 to 6 above
Fraction of WSA Scholars by Distance From Cut Point
Figure 5
27
27
0
.0000
5.0
001
.0001
5
de
nsity
0 5000 10000 15000 20000Dollars
Distribution of WSA Scholarship Amounts
Figure 6
28
28
0
.0000
1.0
000
2.0
000
3.0
000
4.0
000
5
de
nsity
0 10000 20000 30000 40000Dollars
Distribution of Total Scholarship Amounts
Figure 7
29
29
Appendix
Scholar 0.423 ** -0.099 -4518.518 * -5.806 -68.98
(0.204) (0.400) (2370.626) (9.317) (82.12)
African American 0.141 *** 0.180 -747.633 -3.022 -30.49
(0.025) (0.154) (775.186) (3.172) (27.13)
Asian American 0.128 *** -0.067 -730.651 -8.865 *** -78.24 ***
(0.038) (0.090) (623.343) (2.527) (22.56)
Latino -0.079 -0.059 -1454.719 -4.323 -30.85
(0.125) (0.147) (1048.812) (3.329) (28.45)
Other 0.073 0.050 186.038 2.415 28.85
(0.053) (0.163) (702.631) (4.140) (37.00)
Male 0.026 -0.068 -224.680 -1.990 -9.83
(0.039) (0.066) (439.072) (1.768) (16.64)
Any Ap Courses 0.075 * -0.199 *** 837.968 -0.962 -8.81
(0.044) (0.077) (713.693) (2.238) (19.69)
Mother: Some College -0.017 -0.106 -647.686 -1.665 -16.43
(0.045) (0.072) (483.125) (1.875) (16.41)
Mother: College or More 0.055 -0.082 242.340 1.036 10.67
(0.050) (0.082) (669.513) (2.276) (19.44)
Mother: Missing -0.002 0.075 2134.560 7.416 60.49
(0.094) (0.173) (1457.088) (5.403) (49.44)
Father: Some College 0.088 ** -0.008 -103.702 1.236 12.89
(0.037) (0.073) (452.654) (1.927) (17.42)
Father: College or More 0.016 -0.081 953.752 1.345 7.05
(0.059) (0.090) (856.944) (2.507) (20.96)
Father: Missing -0.042 0.113 -475.842 1.575 12.72
(0.078) (0.130) (697.129) (3.210) (28.18)
Semester -475.842 1.575 -13.57
(697.129) (3.210) (17.34)
Foreign Middle School -0.062 0.252 56.015 -3.365 -31.28
(0.166) (0.197) (925.318) (3.148) (26.30)
Pell 335.168 -2.819 -25.56
(508.738) (2.036) (17.84)
Had Physics 0.046 0.074 -745.573 -0.474 0.77
(0.040) (0.067) (747.143) (2.689) (23.59)
Had Geometry 0.048 0.014 40.462 0.935 5.63
(0.061) (0.099) (455.568) (1.677) (15.00)
Had Alegbra II 0.027 -0.061 542.123 1.120 11.54
(0.053) (0.091) (572.130) (2.347) (20.93)
In Free Lunch Program 0.003 -0.098 -301.969 -0.448 -9.60
(0.041) (0.070) (385.834) (1.609) (14.41)
Any IB Classes 0.030 -0.288 *** 3262.907 ** 0.236 1.57
(0.079) (0.100) (1658.552) (3.811) (31.04)
Total Non-Cognitive Test Score -0.113 ** -0.076 1176.582 * -0.871 -1.02
(0.051) (0.123) (709.691) (2.920) (26.77)
Total Non-Cognitive Test Score Sq./100 0.062 0.095 -1821.118 ** 4.422 34.11
(0.077) (0.165) (918.563) (3.930) (35.86)
Table A1
Estimated Impact of WSA Scholarship on Outcome Variables at End of Freshman Year in College
IV Regressions/Probits
Controls
Enrolled Two-Year Amount of Loans Hours Worked Earnings
(1) (2) (3) (4) (5)
30
30
Clover Park -0.266 -0.311 *** 2994.787 ** -4.927 -39.38
(0.191) (0.044) (1219.189) (4.193) (35.45)
Kittitas 0.059 5411.620 ** -6.208 -53.09
(0.083) (2294.439) (6.053) (49.51)
Mabton -0.075 1463.788 -5.024 -35.03
(0.256) (1609.086) (5.810) (50.19)
Mariner -0.101 -0.086 1953.085 1.002 3.07
(0.134) (0.138) (1215.682) (3.799) (31.75)
Cleveland -0.596 *** -0.247 *** 2866.831 ** 5.107 55.32
(0.202) (0.064) (1440.032) (5.073) (45.72)
Stevenson 0.110 *** -0.228 *** 2344.331 -3.306 -38.21
(0.038) (0.083) (1730.906) (5.291) (45.11)
Henry Foss 0.141 *** -0.211 ** -501.500 -3.759 -32.31
(0.032) (0.094) (966.113) (3.571) (31.27)
Lincoln -0.350 -0.239 *** 1986.414 6.393 64.94
(0.248) (0.087) (1432.211) (4.964) (42.51)
Mt. Tacoma -0.123 -0.174 205.405 3.631 40.43
(0.162) (0.119) (1238.980) (7.150) (68.19)
Tonasket -0.053 -0.223 ** 2221.234 -1.043 -17.06
(0.141) (0.089) (1385.168) (5.511) (45.77)
Foster 1763.080 -1.411 -10.21
(1349.326) (4.547) (38.73)
Davis 0.063 -0.204 * 1852.984 0.055 0.30
(0.086) (0.117) (1304.961) (4.108) (35.71)
Yelm -0.067 -0.210 ** 1435.766 2.123 26.08
(0.134) (0.098) (1399.285) (5.601) (50.02)
West Valley 0.065 -0.185 * 3268.766 * -0.931 -9.67
(0.062) (0.104) (1955.331) (4.507) (39.65)
Positive Self Concept 0.081 -0.035 29.263 -2.124 -21.93
(0.053) (0.087) (601.546) (2.098) (18.39)
Realistic Self-Appraisal 0.174 *** -0.039 -336.106 -3.262 -25.10
(0.049) (0.087) (594.645) (2.215) (19.20)
Understand & Navigate Social System 0.101 ** 0.094 -489.745 -0.996 -12.48
(0.049) (0.074) (368.120) (1.820) (15.96)
Prefer Long Range Goals over Short Term 0.070 0.002 226.086 1.097 6.35
(0.049) (0.089) (452.143) (2.185) (19.14)
Availability of Strong Support Person 0.094 ** 0.091 274.426 0.133 -4.64
(0.047) (0.081) (476.306) (1.928) (17.33)
Leadership 0.065 0.005 346.133 -1.765 -19.53
(0.047) (0.078) (417.234) (2.013) (17.79)
Community Service Involvement 0.084 * -0.039 -385.896 -3.461 * -31.54 *
(0.049) (0.087) (574.343) (2.092) (18.34)
F-Test P-values
Race 0.018 0.381 0.482 0.002 0.001
High School 0.013 0.001 0.169 0.153 0.105
Non-Cognitive Sub-scores 0.039 0.517 0.526 0.211 0.281
31
31
Scholar -0.027 2.034 -0.342 -0.268 -0.556
(0.031) (1.416) (0.879) (1.196) (1.642)
African American 0.023 -0.528 0.267 -0.477 -1.138 **
(0.015) (0.495) (0.305) (0.503) (0.567)
Asian American 0.010 -0.188 0.275 -0.340 -0.862 **
(0.009) (0.373) (0.265) (0.342) (0.427)
Latino -0.014 0.472 0.727 * -0.625 -1.443 **
(0.009) (0.461) (0.382) (0.463) (0.588)
Other 0.019 -0.504 0.330 -0.120 -0.264
(0.012) (0.584) (0.353) (0.530) (0.714)
Male -0.001 -0.339 0.073 0.591 ** 0.421
(0.005) (0.249) (0.184) (0.239) (0.289)
Any Ap Courses -0.002 0.062 0.188 -0.151 0.039
(0.008) (0.340) (0.226) (0.319) (0.458)
Mother: Some College -0.006 0.072 0.095 0.048 -0.058
(0.006) (0.281) (0.194) (0.277) (0.354)
Mother: College or More 0.004 0.185 0.211 -0.012 0.188
(0.008) (0.391) (0.261) (0.348) (0.387)
Mother: Missing -0.014 0.103 0.703 1.052 0.251
(0.011) (0.497) (0.476) (0.650) (0.773)
Father: Some College 0.002 0.136 0.004 -0.125 -0.150
(0.007) (0.301) (0.194) (0.277) (0.324)
Father: College or More -0.007 0.321 0.009 -0.168 -0.092
(0.008) (0.361) (0.267) (0.315) (0.423)
Father: Missing 0.011 0.400 -0.549 ** -0.088 0.585
(0.010) (0.401) (0.223) (0.445) (0.627)
Semester 0.029 *** 0.052 -0.549 ** -0.088 0.637
(0.006) (0.326) (0.223) (0.445) (0.368)
Foreign Middle School -0.012 0.751 -0.734 *** -0.115 -0.768
(0.020) (0.757) (0.253) (0.410) (0.870)
Pell -0.012 -0.201 -0.089 0.459 * 0.458
(0.020) (0.300) (0.171) (0.256) (0.340)
Had Physics -0.004 0.255 -0.331 -0.489 0.224
(0.009) (0.407) (0.260) (0.348) (0.452)
Had Geometry -0.003 0.085 0.137 0.042 0.433
(0.006) (0.263) (0.178) (0.231) (0.282)
Had Alegbra II -0.003 0.055 0.233 0.304 -0.219
(0.008) (0.308) (0.205) (0.295) (0.364)
In Free Lunch Program -0.009 0.352 -0.126 -0.129 -0.330
(0.006) (0.243) (0.161) (0.222) (0.304)
Any IB Classes -0.018 -0.041 0.142 0.188 0.406
(0.013) (0.520) (0.365) (0.455) (0.677)
Total Non-Cognitive Test Score 0.012 -0.499 -0.036 -0.239 -0.306
(0.011) (0.551) (0.312) (0.422) (0.560)
Total Non-Cognitive Test Score Sq./100 -0.018 0.948 0.133 0.629 0.968
(0.015) (0.740) (0.432) (0.555) (0.730)
(2) (3) (4) (5)
Table A2
Estimated Impact of WSA Scholarship on Outcome Variables at End of Freshman Year in College
IV Regressions
Additional Controls
Credits Enrolled Time Studying Time Extra- Time Relaxing Time Sleeping
(1)
32
32
Clover Park -0.032 ** -0.298 0.167 0.759 -0.550
(0.016) (0.696) (0.416) (0.602) (0.786)
Kittitas -0.006 0.084 0.602 0.322 0.175
(0.019) (0.696) (0.636) (0.696) (1.294)
Mabton -0.003 -1.544 -0.822 -0.973 0.769
(0.019) (0.977) (0.626) (0.833) (1.352)
Mariner 0.004 -0.734 0.034 0.714 0.473
(0.016) (0.606) (0.444) (0.615) (0.694)
Cleveland -0.021 0.704 -0.020 0.103 -0.374
(0.020) (0.803) (0.456) (0.683) (0.841)
Stevenson -0.003 -0.363 0.195 -0.163 -0.276
(0.021) (0.773) (0.456) (0.651) (0.912)
Henry Foss 0.004 0.069 -0.199 -0.330 -0.165
(0.014) (0.507) (0.333) (0.485) (0.685)
Lincoln -0.010 -1.154 -0.252 0.640 -0.251
(0.018) (0.747) (0.479) (0.759) (0.910)
Mt. Tacoma -0.022 -0.209 -0.055 -0.747 -0.987
(0.020) (0.805) (0.621) (0.689) (1.062)
Tonasket 0.003 -0.765 0.583 0.284 0.468
(0.020) (0.802) (0.605) (0.606) (0.901)
Foster -0.007 -0.596 -0.238 0.231 0.585
(0.019) (0.704) (0.430) (0.623) (0.874)
Davis 0.015 -1.438 ** -0.023 -0.393 -0.060
(0.014) (0.653) (0.469) (0.568) (0.836)
Yelm 0.017 -0.591 0.230 0.257 0.378
(0.019) (0.733) (0.598) (0.712) (0.899)
West Valley -0.006 -0.763 0.311 0.731 -0.508
(0.017) (0.637) (0.505) (0.699) (0.796)
Positive Self Concept -0.003 -0.178 -0.266 0.262 0.254
(0.007) (0.304) (0.199) (0.294) (0.386)
Realistic Self-Appraisal -0.009 -0.029 0.020 -0.057 -0.440
(0.007) (0.368) (0.213) (0.292) (0.391)
Understand & Navigate Social System 0.001 0.039 0.261 -0.292 0.059
(0.006) (0.287) (0.172) (0.279) (0.341)
Prefer Long Range Goals over Short Term -0.003 0.047 -0.216 -0.219 -0.102
(0.008) (0.333) (0.200) (0.303) (0.389)
Availability of Strong Support Person 0.007 -0.278 0.139 -0.060 -0.232
(0.007) (0.266) (0.187) (0.263) (0.343)
Leadership -0.006 -0.374 -0.075 0.129 -0.015
(0.006) (0.263) (0.177) (0.275) (0.345)
Community Service Involvement -0.002 -0.053 0.178 -0.444 -0.556
(0.008) (0.362) (0.234) (0.321) (0.382)
F-Test P-values
Race 0.127 0.561 0.345 0.586 0.031
High School 0.051 0.298 0.562 0.516 0.874
Non-Cognitive Sub-scores 0.441 0.739 0.036 0.304 0.495