Embed Size (px)
Citation preview

WP/16/238
The Impact of Workforce Aging on European Productivity
by Shekhar Aiyar, Christian Ebeke and Xiaobo Shao
IMF Working Papers describe research in progress by the author(s) and are published
to elicit comments and to encourage debate. The views expressed in IMF Working Papers
are those of the author(s) and do not necessarily represent the views of the IMF, its
Executive Board, or IMF management.

© 2016 International Monetary Fund WP/16/238
IMF Working Paper
European Department
The Impact of Workforce Aging on European Productivity1
Prepared by Shekhar Aiyar, Christian Ebeke and Xiaobo Shao
Authorized for distribution by Shekhar Aiyar
December 2016
Abstract
The age-distribution of Europe’s workforce has shifted towards older workers over the past
few decades, a process expected to accelerate in the years ahead.. This paper studies the
effect of the aging of the workforce on labor productivity, identifies the main transmission
channels, and examines what policies might mitigate the effects of aging. We find that
workforce aging reduces growth in labor productivity, mainly through its negative effect on
TFP growth. Projected workforce aging could reduce TFP growth by an average of 0.2
percentage points every year over the next two decades. A variety of policies could
ameliorate this effect.
JEL Classification Numbers: E23, O30, O47.
Keywords: Workforce Aging; Productivity; Policies
Author’s E-Mail Address: [email protected]; [email protected]; [email protected]
1. We are indebted to Mahmood Pradhan, Ken Kang, Serkan Arslanalp, Hua Chai, Dominique Fayad, Rob
Gregory, Robert Kerry, Manasa Patnam, Marcos Poplawski Ribeiro, Jacqueline Rothfels, Reza Yousefi and
Niklas Westelius for useful comments and suggestions. The paper also benefited from the comments of seminar
participants at the European Commission and IMF.
IMF Working Papers describe research in progress by the author(s) and are published to
elicit comments and to encourage debate. The views expressed in IMF Working Papers are
those of the author(s) and do not necessarily represent the views of the IMF, its Executive Board,
or IMF management.

3
Contents
ABSTRACT _________________________________________________________________________ 2
I. WORKFORCE AGING _____________________________________________________________ 4
II. ESTIMATING THE EFFECT OF AGING ON PRODUCTIVITY _________________________ 8 A. Empirical design and baseline estimates _________________________________________________ 8 B. Identification strategy _______________________________________________________________ 10 C. Robustness checks _________________________________________________________________ 13
III. QUANTIFYING THE PAST AND FUTURE EFFECTS OF AGING ON TFP GROWTH ___ 13
IV. LIVING WITH AGING: THE ROLE OF POLICIES __________________________________ 16 A. Empirical design___________________________________________________________________ 16 B. Results __________________________________________________________________________ 18
V. CONCLUSION ___________________________________________________________________ 19
VI. REFERENCES __________________________________________________________________ 20

4
I. WORKFORCE AGING
As is well known, Europe’s population is aging. Declining fertility rates combined with
increased life expectancy have reduced the natural increase in population. Immigration has
helped to offset this trend but only partially. The old age dependency ratio is high in a number of
European countries, and expected to rise considerably (Figure 1).
Figure 1. Demographic Developments and Projections
In addition to population aging, demographic projections point to a rapid aging of the European
workforce. Not only will there be a sharp increase in the old-age dependency ratio, but also a
shift in the composition of the workforce from relatively young to relatively old workers, a
phenomenon that we will refer to as “workforce aging”. In particular, the share of workers aged
55+ in the labor force is expected to increase substantially over the next few decades, especially
in countries such as Spain, Italy, Portugal, Greece and Ireland.
Aging exerts a macroeconomic impact in two conceptually different ways: through a higher
dependency ratio (i.e. a higher proportion of retirees to workers), and through workforce aging.
The first of these, the impact of a higher dependency ratio, has been well studied. Mechanically,
fewer workers in a fixed population produce less output, so per capita GDP should fall with a
higher dependency ratio.2 But there are several other channels. The life cycle theory suggests
2 Several studies document a negative impact of a higher dependency ratio on per capita GDP growth in different
parts of the world, e.g. Persson (2002) for the US; Bloom, Canning and Malaney (2000) for East Asia; Aiyar and
Mody (2013) for India.
0
5
10
15
20
25
30
35
1984
1987
1990
1993
1996
1999
2002
2005
2008
2011
2014
2017
2020
2023
2026
2029
2032
2035
Old Age Dependency Ratio(Percent)
Germany France
Italy Spain
United Kingdom United States
Euro area
Sources: OECD; and IMF staff calculations.
0
5
10
15
20
25
30
1984
1987
1990
1993
1996
1999
2002
2005
2008
2011
2014
2017
2020
2023
2026
2029
2032
2035
Old Worker (55-64) Share(Percent of labor force 15-64)
Germany France
Italy Spain
United Kingdom United States
Euro area
Sources: OECD; European Commission; BLS; and IMF staff calculations.

5
that aggregate savings rates could decline as the elderly dissave after retirement. Public finances
could be put under pressure in graying economies as the level of age-related spending increases.
The erosion of fiscal buffers—coupled with more volatile participation rates for seniors—could
lead to greater aggregate volatility (Jaimovich and Siu, 2009). Recent papers have also
examined the role of aging on the structural transformation of economies, noting that the
consumption pattern shifts towards goods that are more relevant for the elderly, such as energy,
house-keeping, health and leisure services. The supply-side composition of the economy shifts
in tandem, with the service sector growing relative to manufacturing (Siliverstovs et al., 2011).
Projected Workforce Aging in Selected European Countries
(Percent, share of workers aged 55-64 years to the labor force)
2014 2020 2025 2030 2035
Austria 11.3 15.6 16.9 16.3 15.5
Belgium 12.9 16.6 16.4 15.9 15.7
Czech Republic 15.5 15.0 16.3 20.0 23.7
Denmark 16.3 19.2 20.3 20.3 19.2
Estonia 17.8 18.9 19.1 20.8 21.7
Finland 18.2 18.9 18.3 16.7 16.8
France 14.3 15.8 17.4 17.6 16.6
Germany 18.2 22.0 23.7 21.7 20.1
Greece 11.5 18.5 21.3 23.7 25.4
Hungary 14.1 17.1 19.8 23.4 26.5
Ireland 13.4 15.5 16.9 19.2 21.5
Italy 14.8 19.9 23.6 25.8 25.8
Latvia 16.8 18.1 18.5 19.3 19.0
Lithuania 16.3 18.0 19.1 19.8 19.2
Luxembourg 10.3 12.7 13.4 12.9 12.2
Netherlands 16.2 18.5 20.2 19.6 17.8
Norway 16.6 17.2 17.9 17.9 16.8
Poland 14.5 14.2 14.4 16.7 20.4
Portugal 14.9 18.4 20.4 22.5 24.1
Slovakia 13.6 14.9 15.2 17.2 20.6
Slovenia 11.4 17.2 18.9 19.3 20.4
Spain 13.1 19.0 22.2 25.4 27.5
Sweden 18.0 17.9 18.6 18.8 18.2
United Kingdom 14.7 16.8 17.6 17.0 15.9
>20 15-20 <15
Sources: OECD; European Commission; and IMF staff calculations.

6
Workforce aging has direct implications for labor productivity. If different age cohorts differ in
their productivity, then changes in the age distribution of the workforce will affect average
output per worker. The literature stresses that a worker’s productivity systematically varies over
his or her working life, for reasons such as the accumulation of experience over time,
depreciation of knowledge, and age-related trends in physical and mental capabilities. A more
mature labor force will have higher average levels of work experience, with potentially positive
effects on productivity (Disney, 1996). On the other hand, workforce skills also depend on the
stock of knowledge acquired before entering the labor market, or in the early stages of
individuals’ careers. This stock of skills is likely to become increasingly dated as the average
age of participants in the workforce rises, with negative effects on innovation and productivity
(Dixon, 2003). Moreover, if job requirements change over time, older workers may find it more
difficult to adapt (OECD, 1998). For example, some have argued that the increased penetration
of information technologies might place older workers at a disadvantage (Dixon, 2003).
The combination of these factors typically leads to profiles exhibiting a strong increase in
productivity until workers are in their 40s and a decline toward the end of their working life.
Several scholars emphasize a drop-off in the productivity of senior workers related to lower
levels of innovation, technology adoption and dissemination. For example, Feyrer (2008) shows
that US innovators’ median age is stable around 48 over the 1975–95 sample period whereas the
median age of managers who adopt new ideas is lower at around 40. Aksoy et al (2015) show
that demographic structure affects innovation, with older workers (in particular the 50-59 age
group) having a strong negative impact on total number of patent applications. Jones (2010)
finds that innovation is positively affected by young and middle-aged cohorts and negatively
affected by older cohorts. Some recent papers, based on sector or firm-specific data have
however found more mixed evidence. For example, Börsch-Supan and Weiss (2016) find that
the productivity of workers in a large car manufacturer in Germany declines around age 60.
These results might suggest that aggregate effects could be larger than sector or firm-level
effects when externalities linked to workforce aging are taken into account (Feyrer, 2007).
The impact of aging on productivity may also differ across different occupations, in which case
its aggregate impact would be sensitive to the industrial structure of the economy. Venn (2008)
provides a taxonomy of economic sectors distinguished by their exposure to workforce aging
risks: occupations and professions in which productivity increases (on average) with age,
occupations that are age neutral, and occupations in which productivity declines with age. He
argues that workers with basic jobs, especially jobs that require physical exertion such as factory
7
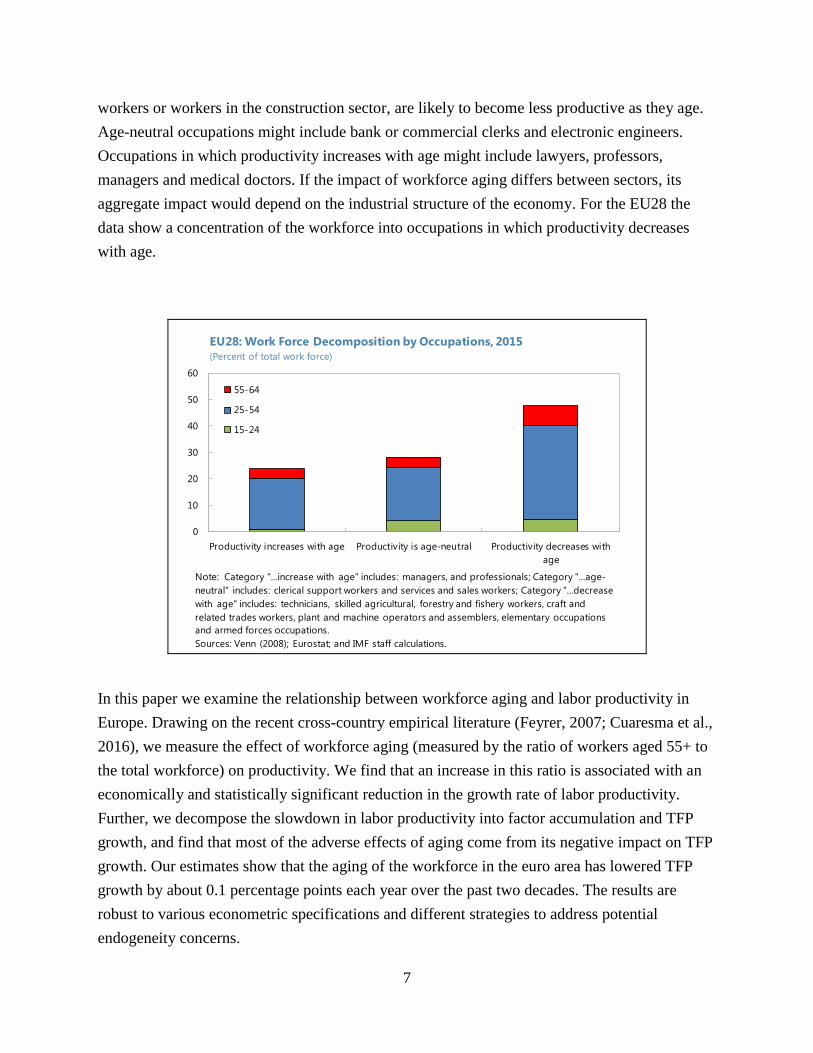
workers or workers in the construction sector, are likely to become less productive as they age.
Age-neutral occupations might include bank or commercial clerks and electronic engineers.
Occupations in which productivity increases with age might include lawyers, professors,
managers and medical doctors. If the impact of workforce aging differs between sectors, its
aggregate impact would depend on the industrial structure of the economy. For the EU28 the
data show a concentration of the workforce into occupations in which productivity decreases
with age.
In this paper we examine the relationship between workforce aging and labor productivity in
Europe. Drawing on the recent cross-country empirical literature (Feyrer, 2007; Cuaresma et al.,
2016), we measure the effect of workforce aging (measured by the ratio of workers aged 55+ to
the total workforce) on productivity. We find that an increase in this ratio is associated with an
economically and statistically significant reduction in the growth rate of labor productivity.
Further, we decompose the slowdown in labor productivity into factor accumulation and TFP
growth, and find that most of the adverse effects of aging come from its negative impact on TFP
growth. Our estimates show that the aging of the workforce in the euro area has lowered TFP
growth by about 0.1 percentage points each year over the past two decades. The results are
robust to various econometric specifications and different strategies to address potential
endogeneity concerns.
0
10
20
30
40
50
60
Productivity increases with age Productivity is age-neutral Productivity decreases with
age
EU28: Work Force Decomposition by Occupations, 2015
(Percent of total work force)
55-64
25-54
15-24
Note: Category "...increase with age" includes: managers, and professionals; Category "...age-
neutral" includes: clerical support workers and services and sales workers; Category "...decrease
with age" includes: technicians, skilled agricultural, forestry and fishery workers, craft and
related trades workers, plant and machine operators and assemblers, elementary occupations
and armed forces occupations.
Sources: Venn (2008); Eurostat; and IMF staff calculations.

8
Our estimates suggest that workforce aging could significantly retard TFP growth over the
medium to long term. On the basis of demographic projections from the OECD, the aging of the
workforce in the euro area could lower TFP growth by about 0.2 percentage points each year
between 2014 and 2035. This effect is very substantial given EC forecasts that most countries
are expected to post average TFP growth rates of less than 1 percent every year over that
horizon. To put it another way, absent the adverse impact of aging, TFP growth could be higher
by about a quarter over the next two decades.
Finally, we examine if policy can mitigate the adverse effects of aging. Our analysis underscores
the key role that can be played by specific policies to improve health outcomes, boost the
productivity of workers through active labor market policy (ALMP) reforms, reduce the tax
wedge to increase labor mobility and spur innovation through R&D spending.
The rest of the paper is organized as follows. Section II lays out the framework for estimating
the effect of workforce aging on productivity and proposes an identification strategy to assess
causal effects. Section III undertakes backcasting and forecasting exercises for productivity
growth building on the point estimates of the effects of workforce aging and time series of
demographic variables. Section IV identifies policies and reforms which dampen the adverse
effects of workforce aging on productivity. Section V concludes.
II. ESTIMATING THE EFFECT OF AGING ON PRODUCTIVITY
A. Empirical design and baseline estimates
We use standard panel techniques to estimate the effect of aging and its channels. Our baseline
specifications build on work by Feyrer (2007) but expand his methodology to better account for
heterogeneity across countries and endogeneity issues.3 The EC’s 2015 Aging Report provides
projections on participation rate and TFP growth for our simulation, so the sample comprises
major EU28 countries over 1950 to 2014. The workforce and population data come from the
OECD while the output per worker data are from the Penn World Table 9.0.
3 Feyrer’s (2007) analyses relate to up to 87 developed as well as to developing countries, and his data set spans the
period from 1960 to 1990. His major finding is an inversely U-shaped relationship between changes in the age
structure of the labor force and the growth rate of TFP which peaks for workers aged 40–49.

9
Our baseline model fits the growth in real output per worker on the share of workers aged 55+
years, the youth and the old dependency ratios, year and country fixed effects. Specifically, the
model takes the following form:
Δ𝑙𝑜𝑔𝑌𝑊𝑖𝑡 = 𝜃1w55𝑖𝑡 + 𝜃2YADR𝑖𝑡 + 𝜃3OADR𝑖𝑡 + 𝑢𝑖 + 𝜂𝑡 + 𝜖𝑖𝑡 [1]
where YW denotes real output per worker, w55 is the share of the total workforce aged 55-64
years, and 𝑌𝐴𝐷𝑅 and 𝑂𝐴𝐷𝑅 are the youth and old dependency ratios, respectively. We expect
the coefficient 𝜃1 to be negative and significant, implying that an increase in the share of old
workers is negatively associated with the growth rate of output per worker, even after
controlling for the dependency ratios. The country fixed effects should absorb country specific
time-invariant factors affecting labor productivity, while the decadal time-specific effects are
intended to account for common shocks affecting growth.4 Our benchmark regression does not
identify the relative contributions of the various channels through which an aging workforce
affects output per worker growth; only the sign and magnitude of the total effect, as in
Jaimovich and Siu (2009).
We then attempt to identify the channels through which workforce aging affects real output per
worker growth in line with the empirical literature on growth accounting (Wong, 2007; Feyrer,
2007). Assuming that the production technology follows a Cobb-Douglas function, output per
worker is given by:
𝑦𝑖𝑡 = 𝑘𝑖𝑡𝛼 (ℎ𝑖𝑡𝐴𝑖𝑡)1−𝛼, which can be re-written as 𝑦𝑖𝑡 = (
𝐾
𝑌)
𝑖𝑡
𝛼
1−𝛼𝐴𝑖𝑡ℎ𝑖𝑡,
where y is the real output per worker, k is the real capital stock per worker, h is human capital
per worker, and A is the TFP.5 Taking logs of both sides gives:
4 We control for time effects by decade to avoid the proliferation of parameters with annual time effects, given the
long time dimension of the panel. We obtain broadly similar econometric results under several variants of this basic
specification, such as including a lagged dependent variable, controlling for the entire age distribution of the
workforce; and excluding the dependency ratios or the year effects.
5 This decomposition assumes an augmented Cobb-Douglas production function with human capital, which has
become standard in the literature (see for example Hall and Jones, 1999; and Aiyar and Feyrer, 2002). Alpha is the
capital share, assumed to be around 0.3 (see Aiyar and Dalgaard, 2009 for a justification). The capital stock series,
(continued…)
10
𝑙𝑜𝑔(𝑦𝑖𝑡) =𝛼
1−𝛼𝑙𝑜𝑔 (
𝐾
𝑌)
𝑖𝑡+ 𝑙𝑜𝑔(ℎ𝑖𝑡) + 𝑙𝑜𝑔(𝐴𝑖𝑡) [2]
Following Wong (2007), we use this decomposition to estimate separately the effect of the
variable of interest—here the workforce aging variable—on each of the right hand side variables
in equation (2), i.e. factor accumulation (capital and human capital) and TFP growth rates.
Wong (2007) shows that the coefficient on the workforce aging variable derived from each of
these regressions will sum up to the effect of workforce aging on labor productivity growth
estimated in equation (1).
Using ordinary least squares, we obtain two main econometric results. First, there is a significant
negative impact of an increase in the share of the workers aged 55–64 on the real growth of
output per worker. This is shown in the first column of Table 1. Second, the main channel
through which an aging workforce reduces the growth rate of output per worker is lower TFP
growth. Columns 2-5 decompose the impact into factors of production and TFP. Column 2
suggests that physical capital—one of the two sources of factor accumulation—does play a
statistically significant role. But its economic significance is small compared to the role of TFP
(shown in columns 4 and 5).6 This may suggest specialization patterns into capital-intensive
technologies to complement the older and gradually less productive workers.
B. Identification strategy
The specification in equation (1) is potentially subject to endogeneity problems because the
share of any particular age group in the labor force depends not only on the number of people in
that age category, but also on the participation rate of that cohort. This may be influenced
directly by the growth of output per worker; or both the participation rate and output per worker
may be influenced by common (country-specific) shocks.
output, and human capital data are from Penn World Table 9.0. Human capital is an index defined in terms of
average years of schooling, with the returns to primary, secondary and tertiary education based on Mincer equation
estimates from around the world taken from Psacharopoulos (1994). TFP is computed as a residual from the log of
real output per worker minus the capital intensity weighted by the factor share expression, and minus the log of
human capital per worker.
6 Two different variants of TFP are used for this exercise. In column 4 we use TFP backed-out as a residual from
equation [2] above. In column 5 we use the Penn World Tables’ own estimates of TFP.

11
The direction of the endogeneity bias crucially depends on the extent to which the labor force
participation rates of various age groups are sensitive to cyclical shocks. In particular, if the
relative participation rate of the age group 55-64 increases in response to a positive productivity
shock—that is, if the participation rate of the w55 group is more elastic with respect to
productivity shocks than other age cohorts—this would tend to increase the share of the 55-64
age cohort in the total workforce. In turn, this implies that the coefficient 𝜃1 will be biased
upward. In other words, a naïve estimate of this coefficient is contaminated by the positive
effect of productivity shocks on the relative participation rate of the group 55-64.
A possible test of this conjecture is to regress participation rates of different age groups on
(lagged) aggregate productivity shocks. Following recent findings in the literature, we expect
the participation rate of older and younger cohorts to exhibit substantial volatility. Jaimovich
and Siu (2009) highlight the existence of a distinct U-shaped pattern in the volatility of hours by
age groups. These age-specific differences in the business cycle responsiveness of labor market
variables are found in our data as well. Table A1 and Table A2 in Appendix A show the results
of the econometric regressions of within-country changes in labor force participation rates on
lagged productivity growth. In Table A1, we show that changes in the labor force participation
rate of older workers (55-64) is much more responsive to productivity shocks than any other
group. When an alternative measure of productivity growth is used (output per hour worked) in
Table A2, the results are qualitatively similar but with the additional finding that the
participation of younger cohorts (15-19 and 20-29) is also responsive to business cycle
developments. These results confirm our prior that ignoring the existence of a reverse and
positive causality running from productivity growth to the relative participation rate of 55-64
group substantially bias the estimate of 𝜃1 upward.
To address potential endogeneity bias, we first instrument each country’s share of the workforce
aged 55 to 64 by the population share of those aged 45–54 ten years previously. To address the
possibility that dependency ratios (included in the models as control variables) can also be
endogenous (for example if an immigration shock simultaneously shifts the population
distribution and affects the growth rate of output), we instrument the youth and old dependency
ratios with the share of population under the age of 4 and the population share of those aged 55
to 59 years ten years ago. The results from the first-stage regressions (Table A3 in the
Appendix) show that the instruments are strongly correlated with the endogenous demographic
variables. The first-stage F-statistics comfortably exceed the Staiger and Stock (1997) rule of
thumb of 10, indicating that weak instrument pathologies are unlikely to be a concern in these
specifications.

12
However, even the lagged population proportions used as instruments may be endogenous if the
shocks that affected the lagged population proportions ten years ago continue to influence
current output per worker or TFP growth today. To address this critique, we instrument the
workforce aging variable and the dependency ratio with lagged birth rates 40, 30, 20, and 10
years ago, similar to Jaimovich and Siu (2009). Excluding migration and mortality, an age
group’s share of the 15–64-year-old population is determined by the distribution of births 15 to
64 years prior. To the extent that fertility decisions taken at least fifteen years ago are exogenous
to current productivity growth, using lagged birth as instruments allows us to obtain unbiased
estimates of the causal impact of the labor force composition of old workers. The drawback of
this approach is a significant reduction in the number of observations, as we instrument the age
composition of the workforce using very long lags.7 However, this identification strategy is
likely to provide cleaner estimates of a causal impact. Again, the F-statistic of the
instrumentation equations show a robust and strong correlation between the birth rate
instruments and the endogenous demographic variables (Table A4).
As expected from the discussion of the direction of the endogeneity bias, the effect is larger
(more negative) and more precisely estimated using instrumental variables (Table 2). 8 An
increase in the share of workers aged 55–64 by 1 percentage point leads to a decline in the
growth of output per worker of between 0.25 and 0.7 percentage points. 9 In terms of
transmission channels, it is robustly estimated that the bulk of the negative effect of workforce
aging on labor productivity comes from its negative impact on TFP growth. This result is
7 In this specification, given the reduced number of observations, we combine the youth and old dependency ratios
into the overall age dependency ratio to limit the number of variables that require instrumentation.
8 Because the use of long lags of birth rates (40 years ago, for example) reduces the sample considerably and leads
in particular to dropping older observations, our second instrumentation strategy could lead to different point
estimates in part due to the changing sample. In order to check that the effect of aging in this set up is not driven by
the change in sample, we also re-ran the previous instrumentation strategy using 10-year lagged population
proportions as instruments on the reduced sample. The estimates are unaffected, supporting the view that the second
instrumentation strategy gives stronger results because it deals with endogeneity better, not because the sample is
altered.
9 The first-stage regressions are consistent with our priors regarding the signs and the strength of the instruments.
Diagnostic statistics suggest that the instruments are strong (the F-statistic and Shea R2 comfortably exceed
conventional statistical thresholds).

13
broadly similar to Feyrer (2007) and Werding (2008), who also found a dominant role for the
TFP channel in a broad sample of advanced and developing economies in the pre-2000 period.
C. Robustness checks
The empirical specification employed in the previous section is robust to several modifications.
Controlling for the numbers of hours worked does not modify the results. In the previous
specification, labor input is measured in terms of the number of workers and does not account
for differences in the number of hours worked, which could be affected both by cross-country
heterogeneity and by aging. We therefore follow Feyrer (2007) in normalizing both real output
and TFP by hours worked, using OECD data. The regression results robustly point to a negative
and statistically significant effect of the share of workers aged 55+ on both output per hour and
modified TFP growth (defined as the difference between the log of TFP and the log of hours
worked). These are denoted, respectively, as D.lnYH and D.lnAH (Table 3).
Controlling for the entire age distribution does not modify the results. We extend the analysis to
include a more detailed look at the effect of the workforce age composition. We alter our
empirical specification so that the regressor, w55, is replaced by a vector of labor force shares:
the shares of the 30–39, 40–49, 50–54, and 55–64, age groups. We exclude the 15–29 age group
because all age shares together sum to one. This means that the coefficient on any particular age
group represents the impact from a shift of the workforce share out of the 15–29 group, into that
age group. As shown in Table 4, the impact of the age group 55–64 remains negative and
statistically significant.10
III. QUANTIFYING THE PAST AND FUTURE EFFECTS OF AGING ON TFP GROWTH
Using the point estimates obtained in Table 2 column 4 (bottom regression), and drawing on
evolution of the share of workers aged 55–64 in the total workforce, we can decompose the
contribution of the aging workforce to TFP growth in each euro area country from 1984 to
10 Using instrumental variables as in Table 2 is challenging in these specifications because instrumenting for
multiple age cohorts entails the loss of too many degrees of freedom.
(continued…)

14
2007.11 Figure 2 shows that on average workforce aging has reduced TFP by about 0.1
percentage points per annum to date. However, this is not uniformly the case. In some countries,
such as Latvia, Lithuania, Finland, Netherlands and Germany, the loss was greater, with about
0.2 percentage points of TFP growth per annum shaved-off during this period, due to increases
in the share of workers aged 55–64.
Figure 2. Demographic Impact
11 The results obtained using the lagged births as instrumental variables are our preferred specifications given the
stronger orthogonality of these instruments vis-à-vis the dependent variables. It is very unlikely that the birth rate
40 years ago could affect productivity performance today through any channel other than the aging variables.
-1.0
0.0
1.0
2.0
3.0
4.0
5.0
6.0
Latv
ia
Lith
uania
Est
onia
Slo
vak
ia
Po
lan
d
Irela
nd
Slo
ven
ia
Cze
ch R
epu
blic
Fin
lan
d
Hu
ngary
Luxe
mb
ou
rg
Un
ited
Kin
gd
om
Sw
ed
en
No
rway
Neth
erl
and
s
Po
rtu
gal
US
Den
mark
Sw
itze
rlan
d
Aust
ria
Fra
nce
Belg
ium
Germ
an
y
EA
Gre
ece
Italy
Sp
ain
Demographic Impact on Annual TFP Growth, 1984-2007
(Percent)
Average TFP growth loss due to aging
Observed average TFP growth
Sources: OECD; European Commission; and IMF staff calculations.Notes: United Kingdom starts from 1985; Switzerland starts from 1992; Austria and Ireland start from 1995; Estonia and Slovakia start from 1996; Latvia, Lithuania, and Slovenia start from 2001. EAcomprises Belgium, Finland, France, Germany, Greece, Italy, Luxembourg, Netherlands, Portugal, and Spain.
-0.5
0.0
0.5
1.0
1.5
2.0
2.5
Slo
vak
ia
Po
lan
d
Lith
uania
Hu
ngary
Latv
ia
Cze
ch R
epu
blic
Est
onia
Slo
ven
ia
Sp
ain
Po
rtu
gal
Irela
nd
Den
mark
No
rway
EA
Germ
an
y
Gre
ece
Aust
ria
Italy
Sw
ed
en
US
Fra
nce
Belg
ium
Fin
lan
d
Un
ited
Kin
gd
om
Neth
erl
and
s
Luxe
mb
ou
rg
Demographic Impact on Annual TFP Growth, 2014-2035
(Percent)
Average TFP growth loss due to aging
Forecasted average TFP growth
-18
-16
-14
-12
-10
-8
-6
-4
-2
0
2
4
Sp
ain
Irela
nd
Gre
ece
Slo
ven
ia
Italy
Hu
ngary
Po
rtu
gal
Cze
ch R
epu
blic
Lith
uania
slo
vakia
Euro
Are
a
Latv
ia
Po
lan
d
Cyp
rus
Est
onia
Fra
nce
Aust
ria
Belg
ium
Germ
an
y
Un
ited
Kin
gd
om
Luxe
mb
ou
rg
Neth
erl
and
s
Malt
a
Den
mark
Sw
ed
en
No
rway
Fin
lan
d
Change in Prime Age Workers (25-54) Share, 2013-2035(Percentage points)
Sources: EC and IMF Staff calculations.
0
10
20
30
40
50
60
70
15-24 25-54 55-64
2014 2035
Europe: Share of Working Age Population by Age Group
(Percent )
Sources: OECD and IMF staff calculations.
Countries include major EU countries, Denmark and Switzerland.

15
The future effects of workforce aging on TFP growth will be more severe. Using the OECD
forecast of working age population by age groups and the EC’s 2015 Aging Report for
projections of labor force participation rates, we construct projections of the share of the
workforce aged between 55 and 64 years old in each country from 2014 until 2035. We then use
our econometric estimates of the effect of workforce aging to derive projections of the
contribution of aging to TFP growth in the long-run. Our calculations point to a more severe
effect of demographic pressures on TFP growth in the years to come, consistent with the rapid
worsening of the age profile of the workforce expected in Europe.12 On average workforce aging
will shave off about 0.2 percentage points of TFP growth every year until 2035. and the scale of
this effect is substantial if one takes into account that the projected average annual TFP growth
in European is only about 1 percentage point per annum. In other words, in the absence of
workforce aging, the TFP growth through 2035 could be about one quarter higher than the
current forecast. The countries expected to be worst affected by workforce aging are Greece,
Spain, Portugal, Italy, Hungary, Slovenia, Slovakia and Ireland, where the average increase in
the share of old workers in total workforce is about 10 percentage points between 2020 and
2035, and the average loss ratio, the ratio of projected TFP growth loss due to workforce aging
over the projected TFP growth, is about 0.6. Many of these countries are also currently facing a
high debt burden (Figure 3).
12 As shown in the Figure 2, demographic projections from the European Commission show a significant increase
in the share of the workforce aged 55-64 between 2014 and 2035, the only cohort to record a positive increase of
this magnitude.

16
IV. LIVING WITH AGING: THE ROLE OF POLICIES
In this section we attempt to identify policies that would reduce the marginal negative effect of
workforce aging on TFP growth. These could potentially include several reforms aimed at
increasing labor productivity generally—such as innovations in health or training to improve
human capital, the encouragement of greater innovation and technology adoption, and the
facilitation of productive labor reallocations—provided that the reforms disproportionately
enhance the productivity of the 55 plus cohort of workers.
A. Empirical design
Our baseline specification is altered to allow for an interaction of workforce aging with a
selected conditioning variable:
Δ𝑙𝑜𝑔𝐴𝑖𝑡 = (𝜃4 + 𝜃5𝑃𝑖𝑡−1) ∙ w55it + β𝑃𝑖𝑡−1 + 𝜃6YADR𝑖𝑡 + 𝜃7OADR𝑖𝑡 + 𝑢𝑖 + 𝜂𝑡 + 𝜈𝑖𝑡 [2]
where the variable P denotes the conditional factor mediating the relationship between TFP
growth and the share of old workers (w55). The policy variables enter the model with a lag to
reduce endogeneity risks. The policy variable P will have an ameliorating impact if 𝜃4 < 0 and
𝜃5 > 0. This implies that the marginal (and negative) effect of aging on TFP growth is reduced
for higher values of the conditional factor P. We test for various conditional factors:
- Health conditions and human capital accumulation: Aging is associated with a rise in
the incidence of ill health and disability within the workforce (Dixon, 2003). The
negative impact of an aging workforce on growth could be mitigated by better health
Figure 3. Demographic Impact and Debt Burden
Notes: The loss ratio is the ratio of projected TFP growth loss due to workforce aging over projected TFP growth.
Sources: OECD; European Commission; WEO and IMF staff calculations.
0.0
0.2
0.4
0.6
0.8
1.0
1.2
Gre
ece
Italy
Sp
ain
Hun
gary
Po
rtu
gal
Ire
land
Slo
ven
ia EA
Czech R
ep
ub
lic
Au
stri
a
Belg
ium
Po
lan
d
Slo
vakia
Fra
nce
Luxem
bo
urg
De
nm
ark
Est
on
ia
Neth
erl
and
s
Ge
rman
y
Lit
hu
an
ia
Un
ited
Kin
gd
om
Latv
ia
Sw
ed
en
No
rway
TFP Growth Loss Ratio, 2014-35
GRC
ITAESP
HUN
PRTIRL
SVN
EACZE
AUTBEL
POLSVK
FRALUX
DNK
EST
NLD
DEU
LTU GBRLVA
SWENORUSA
FIN
-0.2
0.0
0.2
0.4
0.6
0.8
1.0
1.2
0 50 100 150 200
Loss
rati
o, 2
014
-35
Public debt, 2015 (percent of GDP)
Public Debt and TFP losses
Sources: OECD; WEO and IMF staff calculations.

17
conditions and upgraded human capital. Our health care indicator is the availability of
doctors measured by the physician density in total population.13 While doctor availability
is an important and widely used “input” indicator for a society’s health levels at all age
categories, it is likely to be of particular relevance for older people, who are
disproportionately likely to be at health risk. We also test for the effect of active labor
market policies (ALMPs) focusing on the training or re-training of the workforce
(reform dummy taking the value of one when the change in public spending per
unemployed on ALMP on training is greater than one standard deviation of the sample
deviation).14 As with health, while ALMPs could in principle benefit all age cohorts, they
are likely to be disproportionately beneficial to senior workers with more dated skills.
- Labor market flexibility: Workforce aging is expected to be associated with reduced
voluntary mobility between jobs, as younger workers tend to change jobs and employers
relatively frequently, while older workers tend to have more stable relationships with
their employers. A decline in voluntary job mobility could have negative consequences
as the labor market as a whole might become less flexible (Dixon, 2003). In turn, this is
likely to reduce productivity, since adjusting to changes in technology and changes in
product markets could require the movement of workers across firms and geographical
regions. We use reforms to the employment protection framework to proxy for labor
market flexibility, creating a dummy variable taking the value 1 when the OECD
indicator of employment protection of regular contracts declines by at least 1 standard
deviation of the sample.15
- Tax wedge. High rates of tax on marginal employment, coupled with out-of-work
benefits can create disincentives to working for any age group. However, the effect may
13 It should be noted that this measure suffers from some limitations. Even if physician density is high, the quality
of the health insurance system could still limit access to health care for some income groups. The problem is likely
to increase with population aging that threatens the sustainability of public health care systems, as well pension
systems viability affecting elder households’ income and their capacity to privately finance medical care.
14 Data on ALMP spending are from Eurostat.
15 Defining structural reform occurrences by dummies variables indicating significant changes in underlying
structural indices follows the empirical literature on the macroeconomic effects of structural reforms (Bordon et al.,
2016).
(continued…)
18
be disproportionately important for seniors because they have larger savings to fall back
on than other age cohorts in case of unemployment, and may also have a greater
preference for leisure based on their stage of life. The incentive to delay retirement could
be eroded by high labor taxation. We define a dummy for the reform of the tax wedge
taking the value of 1 when the OECD indicator of the tax wedge declines by at least 1
standard deviation.16
- Innovation. Technological innovation and adoption is an important source of
productivity improvements for the labor force as a whole. To the extent that it
differentially benefits senior workers, it could also mitigate the negative impact of aging.
In principle, one could think of innovations that favor younger workers (e.g. new
computer software that enhances the efficiency of those who are capable of easily
“switching”) and innovations that favor older workers (e.g. mechanical devices that
reduce the physical labor associated with certain manufacturing processes). In practice,
whether technological innovations on balance favor older workers more than younger
workers is an empirical matter. We test whether the effect of aging on TFP growth is
dampened by higher spending on R&D, differentiating between public and private
spending on R&D as a percentage of GDP.
B. Results
We find that policy reforms to improve human capital, labor participation, and innovation do
tend to mitigate the adverse impact of aging on TFP growth. The estimates in Table 5 show a
robust dampening effect of policy variables. Columns 1 and 2 suggest that providing greater
access to health services and active labor market policies focusing on the training of the labor
force dampen the TFP growth-reducing effects of an aging workforce. While the results indicate
that fiscal reforms lowering the tax wedge could be an important counterbalance to demographic
pressures (column 3), the effect of labor market reforms granting more flexibility (less
protection of regular workers) has the expected sign but is not statistically significant (column
4). Column 5 shows that the government contribution to R&D spending is robustly associated
with a reduced effect of aging on TFP growth, whereas the effect of private sector R&D in the
euro area remains statistically unclear (column 6). This may be due to the still very low levels of
private sector R&D in several sample countries.
16 Examining the effect of reforms of the tax wedge is useful in its own right given the interest in this variable in the
ongoing benchmarking exercise by the Eurogroup.

19
A summary of these results is represented graphically in the chart below. The bars show the
point estimate of the effect of workforce aging (a percentage point increase in the share of
workers aged 55-64) on TFP growth conditional on the value of some policies. The results
highlight the crucial role played by labor market reforms such as increases in active labor
market policies on training or increase in the availability of medical inputs.
V. CONCLUSION
Workforce aging is likely to be a significant drag on European productivity growth over the next
few decades. We estimate that a 1 percentage point increase in the 55–64 age cohort of the labor
force is associated with a reduction in total factor productivity of about 4 5 ⁄ of a percentage
point. Extrapolating this result forward, projected aging could reduce TFP growth by an average
of 0.2 percentage points per annum over the next twenty years. The largest negative impact will
occur in those countries—such as Spain, Italy, Portugal, Greece and Ireland—where rapid
workforce aging is expected, and which also face high debt burdens.
Our analysis also suggests that good policies can ameliorate the negative productivity impact of
an aging workforce. A variety of policies can help, such as broadening access to health services,
improving workforce training, increasing labor market flexibility by lowering the tax wedge,
and promoting innovation via higher R&D to adapt to a changing global environment. Of course
many of these policies are desirable in their own right, and may increase productivity growth
through multiple channels, but our analysis shows that they are likely to have a
disproportionately large impact in rapidly aging societies such as Europe.
-0.8
-0.6
-0.4
-0.2
0
Baseline Public sector R&D
(median)
Reform of tax
wedge
Reform of ALMP
on training
Health policies
(median)
Mitigating the Impact of Workforce Aging on TFP Growth(Response of TFP growth to a 1pp increase in workforce aging conditional on policies)
Effects derived from panel regressions fitting each dependent variable on workforce aging ratio, old-age dependency ratio, youth
dependency ratio, country and time-fixed effects. The decomposition of labor productivity growth follows Wong (2007) and Feyrer
(2007). The sample includes all European OECD member countries. Period covers 1950 through 2014.
Source: IMF staff estimates.

20
VI. REFERENCES
Aiyar, Shekhar and Dalgaard, Carl-Johan, 2009. Accounting for productivity: Is it OK to assume
that the world is Cobb-Douglas?, Journal of Macroeconomics, Elsevier, vol. 31(2), pages 290
303, June.
Aiyar, Shekhar and Mody, Ashoka, 2013. The Demographic Dividend: Evidence from the
Indian States, India Policy Forum, National Council of Applied Economic Research, vol. 9(1),
pages 105-148.
Aiyar, Shekhar, and Feyrer, James, 2002. A Contribution to the Empirics of Total Factor
Productivity, Dartmouth College working paper.
Aksoy, Yunus, Basso, & Henrique, Grasl, Tobias, and Smith, Ron. 2015. Demographic
Structure and Macroeconomic Trends, Birkbeck Working Papers in Economics and Finance
1501, Birkbeck, Department of Economics, Mathematics & Statistics.
Bloom, D., Canning, D., and P. Malaney, P., 2000. Population dynamics and economic growth
in Asia. Population and Development Review, 26 (Supplement), pages 257– 90.
Bordon, Anna Rose, Ebeke, Christian, and Shirono, Kazuko, 2016. When Do Structural
Reforms Work? On the Role of the Business Cycle and Macroeconomic Policies, IMF Working
Papers 16/62, International Monetary Fund.
Börsch-Supan, Axel, and Weiss, Matthias, 2016. Productivity and age: Evidence from work
teams at the assembly line, The Journal of the Economics of Ageing, vol.7, pages 30–42.
Clements, Benedict, Dybczak, Kamil, Gaspar, Vitor, Gupta, Sanjeev, and Soto, Mauricio, 2015.
The Fiscal Consequences of Shrinking Populations, IMF Staff Discussion Notes 15/21,
International Monetary Fund.
Cuaresma, Crespo, Loichinger, Elke, and Gallina, Vincelette, 2016. Aging and income
convergence in Europe: A survey of the literature and insights from a demographic projection
exercise, Economic Systems, Elsevier, vol. 40(1), pages 4-17.
Disney, Richard, 1996. Can we afford to grow older? A Perspective on the economics of aging,
MIT Press, Cambridge: Mass.

21
Dixon, Silvia, 2003. Implications of population ageing for the labour market. Labour Market
Trends, February.
Feyrer, James, 2007. Demographics and Productivity, The Review of Economics and Statistics,
MIT Press, vol. 89(1), pages 100-109.
Feyrer, James, 2008. Aggregate evidence on the link between age structure and productivity,
Population and Development Review, pages 78-99.
Göbel, Christian and Zwick, Thomas, 2012. Age and Productivity: Sector Differences, De
Economist, Springer, vol. 160(1), pages 35-57, March.
Hall, Robert, and Jones, Charles I., 1991. Why Do Some Countries Produce So Much More
Output per Worker Than Others? Quarterly Journal of Economics 114:1, pages 83–116.
Jaimovich, Nir, and Siu, Henry, 2009. The Young, the Old, and the Restless: Demographics and
Business Cycle Volatility, American Economic Review, American Economic Association, vol.
99(3), pages 804-26, June.
Jones, Benjamin, 2010. Age and Great Invention, The Review of Economics and Statistics, MIT
Press, vol. 92(1), pages 1-14, February.
Persson, Joakim, 2002. Demographics, Human Capital, and Economic Growth: A Study of US
States 1930-2000, FIEF working paper, February.
Psacharopoulos, George, 1994. Returns to investment in education: A global update, World
Development, Elsevier, vol. 22(9), pages 1325-1343, September.
Siliverstovs, Boriss, Kholodilin, Konstantin, Thiessen, Ulrich, 2011. Does aging influence
structural change? Evidence from panel data, Economic Systems, Elsevier, vol. 35(2), pages
244-260, June.
Staiger, Douglas, and James H. Stock, 1997. Instrumental Variables Regression with Weak
Instruments, Econometrica, 65, 557–586.
Veen, S., 2008. Demographischer Wandel, alternde Belegschaften und Betriebsproduktivität.
Munich: Rainer Hampp Verlag.
Werding, Martin, 2008. Ageing and Productivity Growth: Are there Macro-level Cohort Effects
of Human Capital?, CESifo Working Paper Series 2207, CESifo Group Munich.

22
Wong, Wei-Kang, 2007. Economic Growth: A Channel Decomposition Exercise, The B.E.
Journal of Macroeconomics: vol. 7: Iss. 1 (Topics), Article 4.

23
Table 1. OLS estimates of the effects of aging on output per worker and TFP growth Dependent (1) (2) (3) (4) (5)
variables D.lnYW D.lnKY D.lnHC D.lnA D.lnAPWT
Workforce share aged 55-64 -0.165** 0.0562** 0.00480 -0.228** -0.149***
(-2.409) (2.237) (0.829) (-2.491) (-3.023)
Old age dependency ratio 0.0287 -0.0546 -0.0602*** 0.161 0.0313
(0.203) (-1.066) (-5.095) (0.854) (0.310)
Youth dependency ratio -0.0245 0.0159 0.00854 -0.0405 0.00442
(-0.250) (0.461) (1.071) (-0.311) (0.0649)
Intercept 0.0293 0.00209 0.0132*** 0.00985 0.0148
(0.842) (0.169) (4.632) (0.213) (0.606)
County fixed effects Yes Yes Yes Yes Yes
Year fixed effects Yes Yes Yes Yes Yes
Observations 679 700 700 679 700
Number of countries 22 22 22 22 22
lnKY is adjusted with α/(1-α)
t-statistics in parentheses
*** p<0.01, ** p<0.05, * p<0.1

24
Table 2. Controlling for endogeneity bias instrumental variables estimates Dependent (1) (2) (3) (4) (5)
variables D.lnYW D.lnKY D.lnHC D.lnA D.lnAPWT
Workforce share aged 55-64 -0.250** 0.0989*** 0.00816 -0.363** -0.235***
(-2.502) (2.785) (0.401) (-2.535) (-2.923)
Old age dependency ratio -0.207 0.138 -0.0150 -0.306 -0.300
(-0.725) (1.455) (-0.458) (-0.802) (-1.283)
Youth dependency ratio -0.0112 0.0461 0.0509* -0.0932 -0.0764
(-0.0616) (0.654) (1.887) (-0.362) (-0.511)
External instruments 10-year lagged
population
proportions
10-year lagged
population
proportions
10-year lagged
population
proportions
10-year lagged
population
proportions
10-year lagged
population
proportions
Country fixed effects Yes Yes Yes Yes Yes
Year fixed effects Yes Yes Yes Yes Yes
Observations 679 700 700 679 700
Number of countries 22 22 22 22 22
Workforce share aged 55-64 -0.700*** 0.217*** -0.0947*** -0.823*** -0.453***
(-4.625) (3.691) (-5.212) (-4.003) (-4.353)
Dependency ratio (combined) -0.0163 -0.0824 0.0849*** -0.0187 0.326*
(-0.0662) (-0.864) (2.876) (-0.0561) (1.931)
External instruments Births 10, 20, 30,
and 40 years ago
Births 10, 20, 30,
and 40 years ago
Births 10, 20, 30,
and 40 years ago
Births 10, 20, 30,
and 40 years ago
Births 10, 20, 30,
and 40 years ago
Country fixed effects Yes Yes Yes Yes Yes
Year fixed effects Yes Yes Yes Yes Yes
Observations 391 391 391 391 391
Number of countries 21 21 21 21 21
lnKY is adjusted with α/(1-α)
t-statistics in parentheses
*** p<0.01, ** p<0.05, * p<0.1

25
Table 3. Purging the effect of hours worked Dependent (1) (2)
variables D.lnYH D.lnAH
Workforce aged 55-64 -0.280*** -0.260**
(-3.636) (-2.425)
Old age dependency ratio -0.386 -0.661
(-1.281) (-1.583)
Youth dependency ratio -0.0282 -0.204
(-0.149) (-0.772)
External instruments 10-year lagged population
proportions
10-year lagged population
proportions
County fixed effects Yes Yes
Year fixed effects Yes Yes
Observations 608 598
Number of countries 22 22
Workforce aged 55-64 -0.597*** -0.755***
(-4.488) (-4.119)
Dependency ratio (combined) -0.784*** -0.426
(-2.921) (-1.150)
External instruments Births 10, 20, 30,
and 40 years ago
Births 10, 20, 30,
and 40 years ago
County fixed effects Yes Yes
Year fixed effects Yes Yes
Observations 373 373
Number of countries 21 21
t-statistics in parentheses
*** p<0.01, ** p<0.05, * p<0.1

26
Table 4. Controlling for the entire age distribution Dependent (1) (2) (3) (4) (5)
variables D.lnYW D.lnKY D.lnHC D.lnA D.lnAH
Workforce aged 30-39 share -0.0805 0.0190 0.00868 -0.115 -0.0618 (-0.989) (0.594) (0.586) (-0.959) (-0.870) Workforce aged 40-49 share -0.00537 0.0130 0.0145 -0.0437 -0.324** (-0.0490) (0.325) (0.710) (-0.293) (-2.143) Workforce aged 50-54 share -0.0123 -0.0543 0.00513 0.0308 0.406** (-0.0524) (-0.644) (0.221) (0.0968) (2.544) Workforce aged 55-64 share -0.237** 0.0887*** 0.00717 -0.346** -0.562*** (-2.373) (3.079) (0.331) (-2.691) (-4.152) Old age dependency ratio 0.0365 -0.0609 -0.0655** 0.186 0.242 (0.222) (-1.098) (-2.108) (0.786) (0.810) Youth dependency ratio -0.0343 0.0191 0.0153 -0.0550 0.112 (-0.309) (0.451) (0.849) (-0.333) (0.729) Intercept 0.0621 -0.00366 0.00603 0.0604 0.0693 (0.995) (-0.156) (0.666) (0.681) (1.021)
Country fixed-effects Yes Yes Yes Yes Yes
Year fixed-effects Yes Yes Yes Yes Yes Observations 642 661 661 642 573
Number of countries 22 22 22 22 22
lnKY is adjusted with α/(1-α)
t-statistics in parentheses
*** p<0.01, ** p<0.05, * p<0.1

27
t-statistics in parentheses
*** p<0.01, ** p<0.05, * p<0.1
Table 5. Effects of Policies Dependent (1) (2) (3) (4) (5) (6)
variables D.lnA D.lnA D.lnA D.lnA D.lnA D.lnA
Workforce aged 55-64 (W55-64) share -1.338** -0.590*** -0.608*** -0.198** -0.656** -0.340*
(-2.308) (-3.610) (-4.676) (-2.783) (-2.810) (-1.933)
W5564*Lagged physician density to population 0.342*
(1.890)
Lagged physician density to population -0.0774**
(-2.610)
W5564*Lagged public sector spending on R&D (in GDP) 1.566**
(2.113)
Lagged public sector spending on R&D (in GDP) -0.133*
(-1.868)
W5564*Lagged private sector spending on R&D (in GDP) 0.0683
(0.481)
Lagged private sector spending on R&D (in GDP) -0.00744
(-0.297)
W5564*Labor market reform dummy (Reduction in EPLR) 0.159
(0.994)
Labor market reform dummy -0.0106
(-0.606)
W5564*ALMP reform dummy (Increase in ALMP on training) 0.351**
(2.328)
ALMP reform dummy -0.0242
(-1.411)
W5564*Tax wedge reform (Reduction in tax wedge) 0.403**
(2.301)
Tax wedge reform -0.0389*
(-2.063)
Intercept 0.326*** -0.260 0.0893** -0.0382 0.0596 0.0325
(3.656) (-1.565) (2.136) (-0.458) (1.108) (0.532)
Country fixed effects Yes Yes Yes Yes Yes Yes
Year fixed effects Yes Yes Yes Yes Yes Yes
Observations 354 262 301 479 522 485
Number of countries 18 20 18 22 22 21

28
Appendix
t-statistics in parentheses
*** p<0.01, ** p<0.05, * p<0.1
t-statistics in parentheses
*** p<0.01, ** p<0.05, * p<0.1
Table A1: Sensitivity of labor force participation rate by age group to productivity (per worker) growth Dependent (1) (2) (3) (4) (5) (6)
variables D.LFPR1519 D.LFPR2029 D.LFPR3039 D.LFPR4049 D.LFPR5054 D.LFPR5564
Labor productivity growth t-1 0.0372 0.0360 0.0317 0.0292 -0.00907 0.119***
(output per worker) (1.106) (0.642) (0.853) (1.221) (-0.290) (4.360)
Intercept 0.00454 -0.0176 -0.00578 -0.000853 -0.0101 -0.00318
(0.295) (-0.685) (-0.344) (-0.0563) (-0.510) (-0.255)
Country fixed effects Yes Yes Yes Yes Yes Yes
Year fixed effects Yes Yes Yes Yes Yes Yes
Observations 691 691 669 644 644 681
Number of countries 24 24 24 24 24 24
Table A2: Sensitivity of labor force participation rate by age group to productivity (per hour) growth Dependent (1) (2) (3) (4) (5) (6)
variables D.LFPR1519 D.LFPR2029 D.LFPR3039 D.LFPR4049 D.LFPR5054 D.LFPR5564
Labor productivity growth
t-1
0.0933** 0.0704*** 0.0102 0.0237 0.00993 0.111***
(output per hour) (2.257) (2.645) (0.235) (1.008) (0.291) (4.215)
Intercept -0.0251 0.00838 -0.0101 -0.00229 0.00593 -0.0132
(-1.599) (0.828) (-0.613) (-0.185) (0.329) (-1.316)
Country fixed effects Yes Yes Yes Yes Yes Yes
Year fixed effects Yes Yes Yes Yes Yes Yes
Observations 609 609 609 583 583 609
Number of countries 24 24 24 24 24 24

29
Table A3. Instrumentation equations using lagged population proportions (1) (2) (3)
W5564_ratio OADR YADR
Population share 45-54 t-10 1.345*** -0.114 0.075
(11.60) (1.31) (0.95)
Population share 55-59 t-10 0.237* 0.997*** -0.292*
(1.81) (9.95) (1.81)
Population share 00-04 t-10 0.273 -0.720*** 1.653***
1.345*** -0.114 0.075
Observations 679 679 679
No of countries 22 22 22
F-stat first stage 45.51 47.23 174.96
t-statistics in parentheses
*** p<0.01, ** p<0.05, * p<0.1
Table A4. Instrumentation equations using lagged birth variables (1) (2)
W5564_ratio Dependency ratio
Birth number t-40 -0.043*** -0.005
(4.76) (1.15)
Birth number t-30 -0.064*** -0.039***
(8.87) (11.98)
Birth number t-20 -0.040*** -0.020***
(5.37) (5.92)
Birth number t-10 -0.062*** 0.025***
(8.32) (7.35)
Observations 391 391
No of countries 21 21
F-stat first stage 39.68 73.56
t-statistics in parentheses
*** p<0.01, ** p<0.05, * p<0.1


![[Global HR Forum 2014] Aging Workforce and Productivity](https://img.pdfslide.net/doc/110x75/558cd9c5d8b42a885e8b46ad/global-hr-forum-2014-aging-workforce-and-productivity.jpg)