Embed Size (px)
Citation preview

Seediscussions,stats,andauthorprofilesforthispublicationat:http://www.researchgate.net/publication/279737271
Theimprintofplantsonecosystemfunctioning:Adata-drivenapproach
ARTICLEinINTERNATIONALJOURNALOFAPPLIEDEARTHOBSERVATIONANDGEOINFORMATION·JULY2015
ImpactFactor:3.47·DOI:10.1016/j.jag.2015.05.009
READS
279
11AUTHORS,INCLUDING:
MiguelDMahecha
MaxPlanckInstituteforBiogeochemistryJ…
57PUBLICATIONS1,083CITATIONS
SEEPROFILE
MircoMigliavacca
MaxPlanckInstituteforBiogeochemistryJ…
90PUBLICATIONS1,616CITATIONS
SEEPROFILE
MarjanvandeWeg
AbertayUniversity
13PUBLICATIONS306CITATIONS
SEEPROFILE
MichaelBahn
UniversityofInnsbruck
106PUBLICATIONS2,174CITATIONS
SEEPROFILE
Availablefrom:PeterVanBodegom
Retrievedon:24September2015
J
Ta
TMPa
b
c
d
e
f
g
h
a
ARAA
KBBSEPR
1
fwsctIos
h0
ARTICLE IN PRESSG ModelAG-1106; No. of Pages 13
International Journal of Applied Earth Observation and Geoinformation xxx (2015) xxx–xxx
Contents lists available at ScienceDirect
International Journal of Applied Earth Observation andGeoinformation
journa l homepage: www.e lsev ier .com/ locate / jag
he imprint of plants on ecosystem functioning: A data-drivenpproach
alie Musavi a,∗, Miguel D. Mahecha a,b, Mirco Migliavacca a, Markus Reichstein a,b,artine Janet van de Weg c, Peter M. van Bodegom d, Michael Bahn e, Christian Wirth b,f,
eter B. Reich g,h, Franziska Schrodt a,b, Jens Kattge a,b
Max Planck Institute for Biogeochemistry, 07745 Jena, GermanyGerman Centre for Integrative Biodiversity Research (iDiv) Halle-Jena-Leipzig, 04103 Leipzig, GermanySIMBIOS, Abertay University of Dundee, Dundee DD1 1HG, Scotland, UKInstitute of Environmental Sciences (CML), University Leiden, 2333CC Leiden, The NetherlandsInstitute of Ecology, University of Innsbruck, 6020 Innsbruck, AustriaSystematic Botany and Functional Biodiversity Research, Institute of Biology, University of Leipzig, 04103 Leipzig, GermanyDepartment of Forest Resources, University of Minnesota, St Paul, Minnesota 55108, USAHawkesbury Institute for the Environment, University of Western Sydney, Penrith, 2751 New South Wales, Australia
r t i c l e i n f o
rticle history:eceived 31 October 2014ccepted 12 May 2015vailable online xxx
eywords:iosphere–atmosphere interactionsiogeochemical fluxescalingcosystem functional propertieslant traitsemote sensing
a b s t r a c t
Terrestrial ecosystems strongly determine the exchange of carbon, water and energy between thebiosphere and atmosphere. These exchanges are influenced by environmental conditions (e.g., localmeteorology, soils), but generally mediated by organisms. Often, mathematical descriptions of theseprocesses are implemented in terrestrial biosphere models. Model implementations of this kind shouldbe evaluated by empirical analyses of relationships between observed patterns of ecosystem function-ing, vegetation structure, plant traits, and environmental conditions. However, the question of how todescribe the imprint of plants on ecosystem functioning based on observations has not yet been systemat-ically investigated. One approach might be to identify and quantify functional attributes or responsivenessof ecosystems (often very short-term in nature) that contribute to the long-term (i.e., annual but alsoseasonal or daily) metrics commonly in use. Here we define these patterns as “ecosystem functional prop-erties”, or EFPs. Such as the ecosystem capacity of carbon assimilation or the maximum light use efficiencyof an ecosystem. While EFPs should be directly derivable from flux measurements at the ecosystem level,
we posit that these inherently include the influence of specific plant traits and their local heterogeneity.We present different options of upscaling in situ measured plant traits to the ecosystem level (ecosystemvegetation properties – EVPs) and provide examples of empirical analyses on plants’ imprint on ecosys-tem functioning by combining in situ measured plant traits and ecosystem flux measurements. Finally,we discuss how recent advances in remote sensing contribute to this framework.. Introduction
The structure and functioning of terrestrial ecosystems areormed by environmental (e.g., climatic and edaphic) constraints, as
ell as the legacy of ecosystem development. Historical processesuch as evolution, migration, and disturbances are encoded in theommunity structure of biota (i.e., plant or soil organism communi-ies, their horizontal and vertical structure and temporal dynamics).
Please cite this article in press as: Musavi, T., et al., The imprint of planEarth Observ. Geoinf. (2015), http://dx.doi.org/10.1016/j.jag.2015.05.0
n turn, the biotic structure shapes the biogeochemical functioningf ecosystems, i.e., nutrient turnover, water cycling, and carbontorage potential amongst others (Field et al., 1992; Friend and
∗ Corresponding author. Tel.: +49 3641576296.
ttp://dx.doi.org/10.1016/j.jag.2015.05.009303-2434/© 2015 Elsevier B.V. All rights reserved.
© 2015 Elsevier B.V. All rights reserved.
Cox 1995; Schlesinger 1997; Chapin et al., 1998). To put it in otherwords: responses of biogeochemical processes to environmentalconditions are modulated by the local properties of organismiccommunities (Field et al., 1992). The interacting effects of organ-ismic responses and biophysics at the ecosystem level ultimatelyshape ecosystem feedbacks to the climate system as manifestedin the exchange of energy and greenhouse gases and cycling ofchemical compounds (Bonan, 2008).
Commonly used terrestrial biosphere models implementbiogeochemical and biophysical processes according to our
ts on ecosystem functioning: A data-driven approach. Int. J. Appl.09
understanding derived, in large part, from plant organ level obser-vations, and use parameters that are often based on observableplant traits. Plant traits are measurable features at the individualorgan or organism level such as morphological, anatomical, phys-
ARTICLE ING ModelJAG-1106; No. of Pages 13
2 T. Musavi et al. / International Journal of Applied Earth Ob
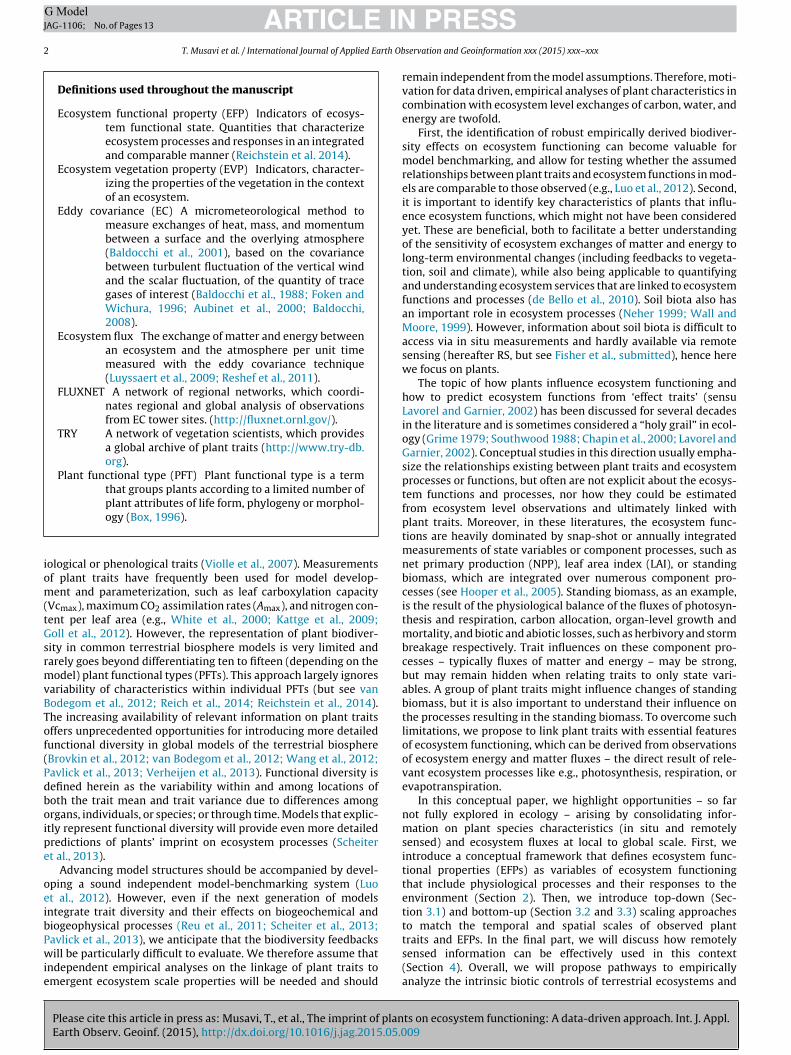
Definitions used throughout the manuscript
Ecosystem functional property (EFP) Indicators of ecosys-tem functional state. Quantities that characterizeecosystem processes and responses in an integratedand comparable manner (Reichstein et al. 2014).
Ecosystem vegetation property (EVP) Indicators, character-izing the properties of the vegetation in the contextof an ecosystem.
Eddy covariance (EC) A micrometeorological method tomeasure exchanges of heat, mass, and momentumbetween a surface and the overlying atmosphere(Baldocchi et al., 2001), based on the covariancebetween turbulent fluctuation of the vertical windand the scalar fluctuation, of the quantity of tracegases of interest (Baldocchi et al., 1988; Foken andWichura, 1996; Aubinet et al., 2000; Baldocchi,2008).
Ecosystem flux The exchange of matter and energy betweenan ecosystem and the atmosphere per unit timemeasured with the eddy covariance technique(Luyssaert et al., 2009; Reshef et al., 2011).
FLUXNET A network of regional networks, which coordi-nates regional and global analysis of observationsfrom EC tower sites. (http://fluxnet.ornl.gov/).
TRY A network of vegetation scientists, which providesa global archive of plant traits (http://www.try-db.org).
Plant functional type (PFT) Plant functional type is a termthat groups plants according to a limited number ofplant attributes of life form, phylogeny or morphol-
iom(tGsrmvBTof(Pdboipe
oeibPwie
ogy (Box, 1996).
ological or phenological traits (Violle et al., 2007). Measurementsf plant traits have frequently been used for model develop-ent and parameterization, such as leaf carboxylation capacity
Vcmax), maximum CO2 assimilation rates (Amax), and nitrogen con-ent per leaf area (e.g., White et al., 2000; Kattge et al., 2009;oll et al., 2012). However, the representation of plant biodiver-
ity in common terrestrial biosphere models is very limited andarely goes beyond differentiating ten to fifteen (depending on the
odel) plant functional types (PFTs). This approach largely ignoresariability of characteristics within individual PFTs (but see vanodegom et al., 2012; Reich et al., 2014; Reichstein et al., 2014).he increasing availability of relevant information on plant traitsffers unprecedented opportunities for introducing more detailedunctional diversity in global models of the terrestrial biosphereBrovkin et al., 2012; van Bodegom et al., 2012; Wang et al., 2012;avlick et al., 2013; Verheijen et al., 2013). Functional diversity isefined herein as the variability within and among locations ofoth the trait mean and trait variance due to differences amongrgans, individuals, or species; or through time. Models that explic-
tly represent functional diversity will provide even more detailedredictions of plants’ imprint on ecosystem processes (Scheitert al., 2013).
Advancing model structures should be accompanied by devel-ping a sound independent model-benchmarking system (Luot al., 2012). However, even if the next generation of modelsntegrate trait diversity and their effects on biogeochemical andiogeophysical processes (Reu et al., 2011; Scheiter et al., 2013;
Please cite this article in press as: Musavi, T., et al., The imprint of planEarth Observ. Geoinf. (2015), http://dx.doi.org/10.1016/j.jag.2015.05.0
avlick et al., 2013), we anticipate that the biodiversity feedbacksill be particularly difficult to evaluate. We therefore assume that
ndependent empirical analyses on the linkage of plant traits tomergent ecosystem scale properties will be needed and should
PRESSservation and Geoinformation xxx (2015) xxx–xxx
remain independent from the model assumptions. Therefore, moti-vation for data driven, empirical analyses of plant characteristics incombination with ecosystem level exchanges of carbon, water, andenergy are twofold.
First, the identification of robust empirically derived biodiver-sity effects on ecosystem functioning can become valuable formodel benchmarking, and allow for testing whether the assumedrelationships between plant traits and ecosystem functions in mod-els are comparable to those observed (e.g., Luo et al., 2012). Second,it is important to identify key characteristics of plants that influ-ence ecosystem functions, which might not have been consideredyet. These are beneficial, both to facilitate a better understandingof the sensitivity of ecosystem exchanges of matter and energy tolong-term environmental changes (including feedbacks to vegeta-tion, soil and climate), while also being applicable to quantifyingand understanding ecosystem services that are linked to ecosystemfunctions and processes (de Bello et al., 2010). Soil biota also hasan important role in ecosystem processes (Neher 1999; Wall andMoore, 1999). However, information about soil biota is difficult toaccess via in situ measurements and hardly available via remotesensing (hereafter RS, but see Fisher et al., submitted), hence herewe focus on plants.
The topic of how plants influence ecosystem functioning andhow to predict ecosystem functions from ‘effect traits’ (sensuLavorel and Garnier, 2002) has been discussed for several decadesin the literature and is sometimes considered a “holy grail” in ecol-ogy (Grime 1979; Southwood 1988; Chapin et al., 2000; Lavorel andGarnier, 2002). Conceptual studies in this direction usually empha-size the relationships existing between plant traits and ecosystemprocesses or functions, but often are not explicit about the ecosys-tem functions and processes, nor how they could be estimatedfrom ecosystem level observations and ultimately linked withplant traits. Moreover, in these literatures, the ecosystem func-tions are heavily dominated by snap-shot or annually integratedmeasurements of state variables or component processes, such asnet primary production (NPP), leaf area index (LAI), or standingbiomass, which are integrated over numerous component pro-cesses (see Hooper et al., 2005). Standing biomass, as an example,is the result of the physiological balance of the fluxes of photosyn-thesis and respiration, carbon allocation, organ-level growth andmortality, and biotic and abiotic losses, such as herbivory and stormbreakage respectively. Trait influences on these component pro-cesses – typically fluxes of matter and energy – may be strong,but may remain hidden when relating traits to only state vari-ables. A group of plant traits might influence changes of standingbiomass, but it is also important to understand their influence onthe processes resulting in the standing biomass. To overcome suchlimitations, we propose to link plant traits with essential featuresof ecosystem functioning, which can be derived from observationsof ecosystem energy and matter fluxes – the direct result of rele-vant ecosystem processes like e.g., photosynthesis, respiration, orevapotranspiration.
In this conceptual paper, we highlight opportunities – so farnot fully explored in ecology – arising by consolidating infor-mation on plant species characteristics (in situ and remotelysensed) and ecosystem fluxes at local to global scale. First, weintroduce a conceptual framework that defines ecosystem func-tional properties (EFPs) as variables of ecosystem functioningthat include physiological processes and their responses to theenvironment (Section 2). Then, we introduce top-down (Sec-tion 3.1) and bottom-up (Section 3.2 and 3.3) scaling approachesto match the temporal and spatial scales of observed plant
ts on ecosystem functioning: A data-driven approach. Int. J. Appl.09
traits and EFPs. In the final part, we will discuss how remotelysensed information can be effectively used in this context(Section 4). Overall, we will propose pathways to empiricallyanalyze the intrinsic biotic controls of terrestrial ecosystems and
ARTICLE IN PRESSG ModelJAG-1106; No. of Pages 13
T. Musavi et al. / International Journal of Applied Earth Observation and Geoinformation xxx (2015) xxx–xxx 3
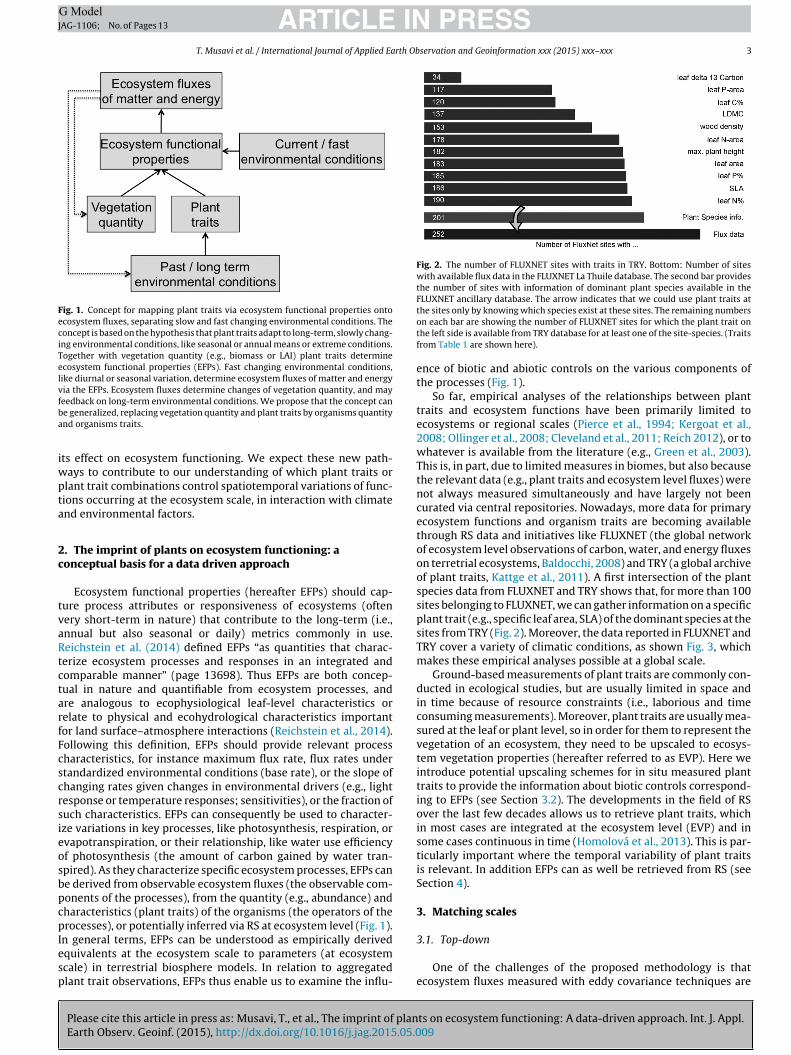
Fig. 1. Concept for mapping plant traits via ecosystem functional properties ontoecosystem fluxes, separating slow and fast changing environmental conditions. Theconcept is based on the hypothesis that plant traits adapt to long-term, slowly chang-ing environmental conditions, like seasonal or annual means or extreme conditions.Together with vegetation quantity (e.g., biomass or LAI) plant traits determineecosystem functional properties (EFPs). Fast changing environmental conditions,like diurnal or seasonal variation, determine ecosystem fluxes of matter and energyvia the EFPs. Ecosystem fluxes determine changes of vegetation quantity, and mayfba
iwpta
2c
tvaRtctarfFcscrsieosbpcpIesp
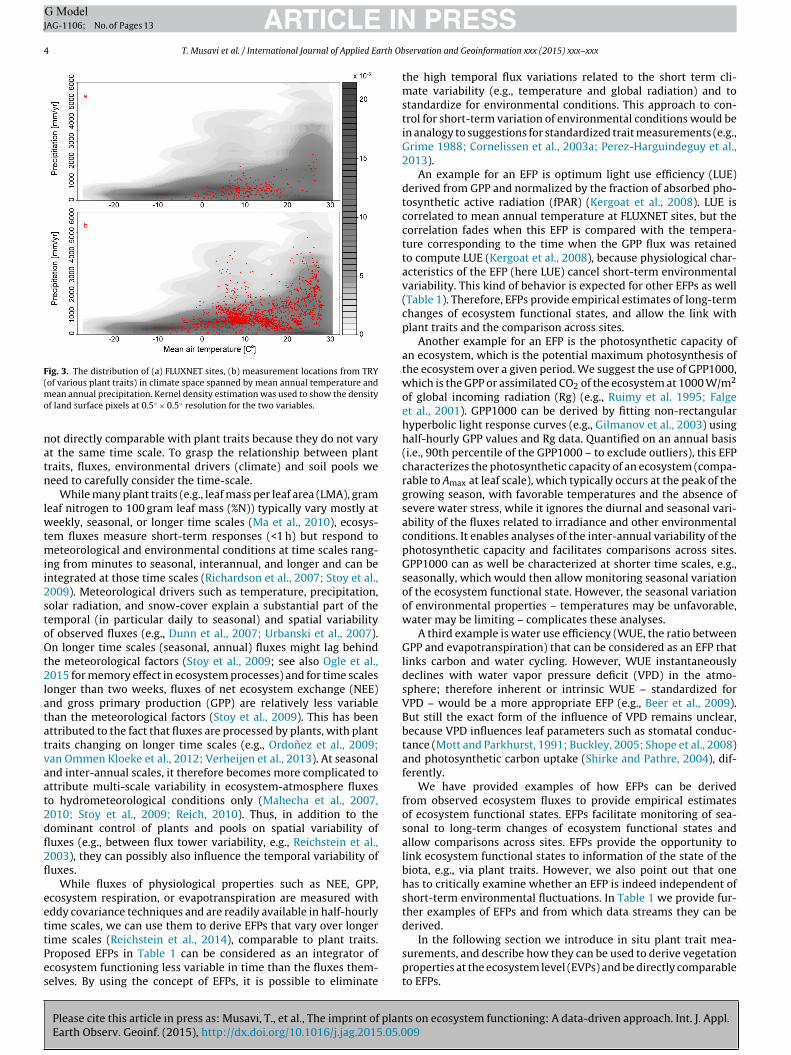
Fig. 2. The number of FLUXNET sites with traits in TRY. Bottom: Number of siteswith available flux data in the FLUXNET La Thuile database. The second bar providesthe number of sites with information of dominant plant species available in theFLUXNET ancillary database. The arrow indicates that we could use plant traits at
3.1. Top-down
eedback on long-term environmental conditions. We propose that the concept cane generalized, replacing vegetation quantity and plant traits by organisms quantitynd organisms traits.
ts effect on ecosystem functioning. We expect these new path-ays to contribute to our understanding of which plant traits or
lant trait combinations control spatiotemporal variations of func-ions occurring at the ecosystem scale, in interaction with climatend environmental factors.
. The imprint of plants on ecosystem functioning: aonceptual basis for a data driven approach
Ecosystem functional properties (hereafter EFPs) should cap-ure process attributes or responsiveness of ecosystems (oftenery short-term in nature) that contribute to the long-term (i.e.,nnual but also seasonal or daily) metrics commonly in use.eichstein et al. (2014) defined EFPs “as quantities that charac-erize ecosystem processes and responses in an integrated andomparable manner” (page 13698). Thus EFPs are both concep-ual in nature and quantifiable from ecosystem processes, andre analogous to ecophysiological leaf-level characteristics orelate to physical and ecohydrological characteristics importantor land surface–atmosphere interactions (Reichstein et al., 2014).ollowing this definition, EFPs should provide relevant processharacteristics, for instance maximum flux rate, flux rates undertandardized environmental conditions (base rate), or the slope ofhanging rates given changes in environmental drivers (e.g., lightesponse or temperature responses; sensitivities), or the fraction ofuch characteristics. EFPs can consequently be used to character-ze variations in key processes, like photosynthesis, respiration, orvapotranspiration, or their relationship, like water use efficiencyf photosynthesis (the amount of carbon gained by water tran-pired). As they characterize specific ecosystem processes, EFPs cane derived from observable ecosystem fluxes (the observable com-onents of the processes), from the quantity (e.g., abundance) andharacteristics (plant traits) of the organisms (the operators of therocesses), or potentially inferred via RS at ecosystem level (Fig. 1).
n general terms, EFPs can be understood as empirically derived
Please cite this article in press as: Musavi, T., et al., The imprint of planEarth Observ. Geoinf. (2015), http://dx.doi.org/10.1016/j.jag.2015.05.0
quivalents at the ecosystem scale to parameters (at ecosystemcale) in terrestrial biosphere models. In relation to aggregatedlant trait observations, EFPs thus enable us to examine the influ-
the sites only by knowing which species exist at these sites. The remaining numberson each bar are showing the number of FLUXNET sites for which the plant trait onthe left side is available from TRY database for at least one of the site-species. (Traitsfrom Table 1 are shown here).
ence of biotic and abiotic controls on the various components ofthe processes (Fig. 1).
So far, empirical analyses of the relationships between planttraits and ecosystem functions have been primarily limited toecosystems or regional scales (Pierce et al., 1994; Kergoat et al.,2008; Ollinger et al., 2008; Cleveland et al., 2011; Reich 2012), or towhatever is available from the literature (e.g., Green et al., 2003).This is, in part, due to limited measures in biomes, but also becausethe relevant data (e.g., plant traits and ecosystem level fluxes) werenot always measured simultaneously and have largely not beencurated via central repositories. Nowadays, more data for primaryecosystem functions and organism traits are becoming availablethrough RS data and initiatives like FLUXNET (the global networkof ecosystem level observations of carbon, water, and energy fluxeson terretrial ecosystems, Baldocchi, 2008) and TRY (a global archiveof plant traits, Kattge et al., 2011). A first intersection of the plantspecies data from FLUXNET and TRY shows that, for more than 100sites belonging to FLUXNET, we can gather information on a specificplant trait (e.g., specific leaf area, SLA) of the dominant species at thesites from TRY (Fig. 2). Moreover, the data reported in FLUXNET andTRY cover a variety of climatic conditions, as shown Fig. 3, whichmakes these empirical analyses possible at a global scale.
Ground-based measurements of plant traits are commonly con-ducted in ecological studies, but are usually limited in space andin time because of resource constraints (i.e., laborious and timeconsuming measurements). Moreover, plant traits are usually mea-sured at the leaf or plant level, so in order for them to represent thevegetation of an ecosystem, they need to be upscaled to ecosys-tem vegetation properties (hereafter referred to as EVP). Here weintroduce potential upscaling schemes for in situ measured planttraits to provide the information about biotic controls correspond-ing to EFPs (see Section 3.2). The developments in the field of RSover the last few decades allows us to retrieve plant traits, whichin most cases are integrated at the ecosystem level (EVP) and insome cases continuous in time (Homolová et al., 2013). This is par-ticularly important where the temporal variability of plant traitsis relevant. In addition EFPs can as well be retrieved from RS (seeSection 4).
3. Matching scales
ts on ecosystem functioning: A data-driven approach. Int. J. Appl.09
One of the challenges of the proposed methodology is thatecosystem fluxes measured with eddy covariance techniques are
ARTICLE ING ModelJAG-1106; No. of Pages 13
4 T. Musavi et al. / International Journal of Applied Earth Ob
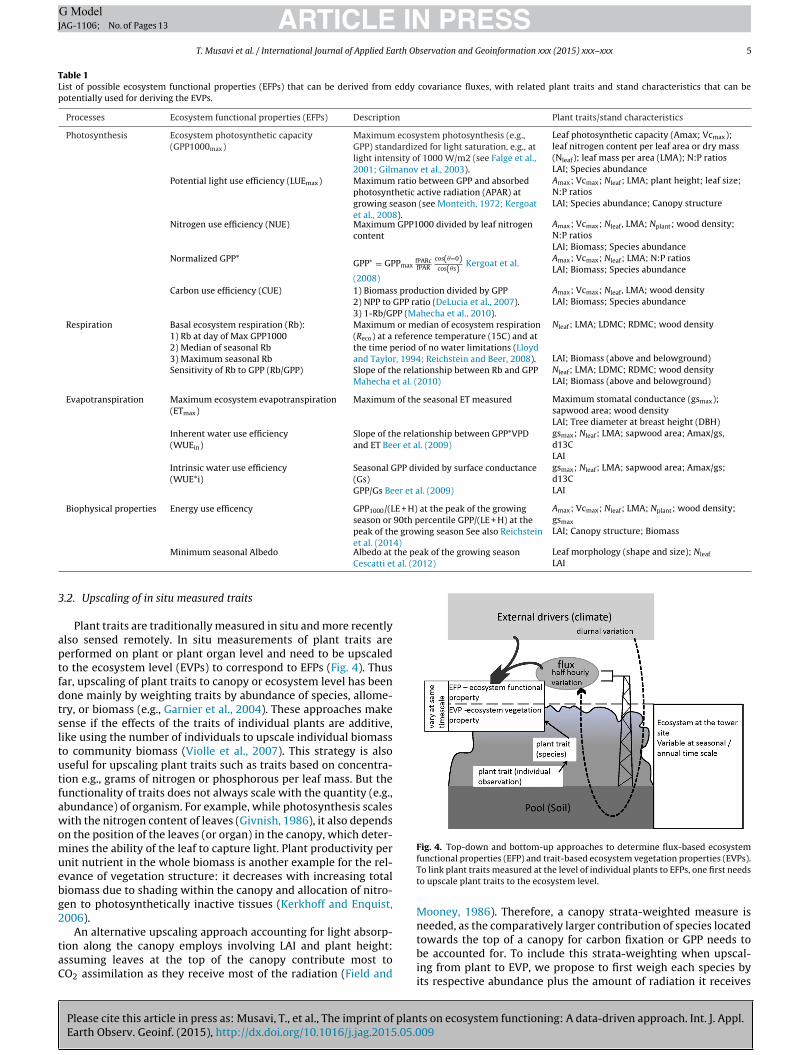
Fig. 3. The distribution of (a) FLUXNET sites, (b) measurement locations from TRY(mo
natn
lwtmii2stoOt2latatvaat2dfl2fl
eettPes
of various plant traits) in climate space spanned by mean annual temperature andean annual precipitation. Kernel density estimation was used to show the density
f land surface pixels at 0.5◦ × 0.5◦ resolution for the two variables.
ot directly comparable with plant traits because they do not varyt the same time scale. To grasp the relationship between plantraits, fluxes, environmental drivers (climate) and soil pools weeed to carefully consider the time-scale.
While many plant traits (e.g., leaf mass per leaf area (LMA), grameaf nitrogen to 100 gram leaf mass (%N)) typically vary mostly at
eekly, seasonal, or longer time scales (Ma et al., 2010), ecosys-em fluxes measure short-term responses (<1 h) but respond to
eteorological and environmental conditions at time scales rang-ng from minutes to seasonal, interannual, and longer and can bentegrated at those time scales (Richardson et al., 2007; Stoy et al.,009). Meteorological drivers such as temperature, precipitation,olar radiation, and snow-cover explain a substantial part of theemporal (in particular daily to seasonal) and spatial variabilityf observed fluxes (e.g., Dunn et al., 2007; Urbanski et al., 2007).n longer time scales (seasonal, annual) fluxes might lag behind
he meteorological factors (Stoy et al., 2009; see also Ogle et al.,015 for memory effect in ecosystem processes) and for time scales
onger than two weeks, fluxes of net ecosystem exchange (NEE)nd gross primary production (GPP) are relatively less variablehan the meteorological factors (Stoy et al., 2009). This has beenttributed to the fact that fluxes are processed by plants, with plantraits changing on longer time scales (e.g., Ordonez et al., 2009;an Ommen Kloeke et al., 2012; Verheijen et al., 2013). At seasonalnd inter-annual scales, it therefore becomes more complicated tottribute multi-scale variability in ecosystem-atmosphere fluxeso hydrometeorological conditions only (Mahecha et al., 2007,010; Stoy et al., 2009; Reich, 2010). Thus, in addition to theominant control of plants and pools on spatial variability ofuxes (e.g., between flux tower variability, e.g., Reichstein et al.,003), they can possibly also influence the temporal variability ofuxes.
While fluxes of physiological properties such as NEE, GPP,cosystem respiration, or evapotranspiration are measured withddy covariance techniques and are readily available in half-hourlyime scales, we can use them to derive EFPs that vary over longer
Please cite this article in press as: Musavi, T., et al., The imprint of planEarth Observ. Geoinf. (2015), http://dx.doi.org/10.1016/j.jag.2015.05.0
ime scales (Reichstein et al., 2014), comparable to plant traits.roposed EFPs in Table 1 can be considered as an integrator ofcosystem functioning less variable in time than the fluxes them-elves. By using the concept of EFPs, it is possible to eliminate
PRESSservation and Geoinformation xxx (2015) xxx–xxx
the high temporal flux variations related to the short term cli-mate variability (e.g., temperature and global radiation) and tostandardize for environmental conditions. This approach to con-trol for short-term variation of environmental conditions would bein analogy to suggestions for standardized trait measurements (e.g.,Grime 1988; Cornelissen et al., 2003a; Perez-Harguindeguy et al.,2013).
An example for an EFP is optimum light use efficiency (LUE)derived from GPP and normalized by the fraction of absorbed pho-tosynthetic active radiation (fPAR) (Kergoat et al., 2008). LUE iscorrelated to mean annual temperature at FLUXNET sites, but thecorrelation fades when this EFP is compared with the tempera-ture corresponding to the time when the GPP flux was retainedto compute LUE (Kergoat et al., 2008), because physiological char-acteristics of the EFP (here LUE) cancel short-term environmentalvariability. This kind of behavior is expected for other EFPs as well(Table 1). Therefore, EFPs provide empirical estimates of long-termchanges of ecosystem functional states, and allow the link withplant traits and the comparison across sites.
Another example for an EFP is the photosynthetic capacity ofan ecosystem, which is the potential maximum photosynthesis ofthe ecosystem over a given period. We suggest the use of GPP1000,which is the GPP or assimilated CO2 of the ecosystem at 1000 W/m2
of global incoming radiation (Rg) (e.g., Ruimy et al. 1995; Falgeet al., 2001). GPP1000 can be derived by fitting non-rectangularhyperbolic light response curves (e.g., Gilmanov et al., 2003) usinghalf-hourly GPP values and Rg data. Quantified on an annual basis(i.e., 90th percentile of the GPP1000 – to exclude outliers), this EFPcharacterizes the photosynthetic capacity of an ecosystem (compa-rable to Amax at leaf scale), which typically occurs at the peak of thegrowing season, with favorable temperatures and the absence ofsevere water stress, while it ignores the diurnal and seasonal vari-ability of the fluxes related to irradiance and other environmentalconditions. It enables analyses of the inter-annual variability of thephotosynthetic capacity and facilitates comparisons across sites.GPP1000 can as well be characterized at shorter time scales, e.g.,seasonally, which would then allow monitoring seasonal variationof the ecosystem functional state. However, the seasonal variationof environmental properties – temperatures may be unfavorable,water may be limiting – complicates these analyses.
A third example is water use efficiency (WUE, the ratio betweenGPP and evapotranspiration) that can be considered as an EFP thatlinks carbon and water cycling. However, WUE instantaneouslydeclines with water vapor pressure deficit (VPD) in the atmo-sphere; therefore inherent or intrinsic WUE – standardized forVPD – would be a more appropriate EFP (e.g., Beer et al., 2009).But still the exact form of the influence of VPD remains unclear,because VPD influences leaf parameters such as stomatal conduc-tance (Mott and Parkhurst, 1991; Buckley, 2005; Shope et al., 2008)and photosynthetic carbon uptake (Shirke and Pathre, 2004), dif-ferently.
We have provided examples of how EFPs can be derivedfrom observed ecosystem fluxes to provide empirical estimatesof ecosystem functional states. EFPs facilitate monitoring of sea-sonal to long-term changes of ecosystem functional states andallow comparisons across sites. EFPs provide the opportunity tolink ecosystem functional states to information of the state of thebiota, e.g., via plant traits. However, we also point out that onehas to critically examine whether an EFP is indeed independent ofshort-term environmental fluctuations. In Table 1 we provide fur-ther examples of EFPs and from which data streams they can bederived.
ts on ecosystem functioning: A data-driven approach. Int. J. Appl.09
In the following section we introduce in situ plant trait mea-surements, and describe how they can be used to derive vegetationproperties at the ecosystem level (EVPs) and be directly comparableto EFPs.
ARTICLE IN PRESSG ModelJAG-1106; No. of Pages 13
T. Musavi et al. / International Journal of Applied Earth Observation and Geoinformation xxx (2015) xxx–xxx 5
Table 1List of possible ecosystem functional properties (EFPs) that can be derived from eddy covariance fluxes, with related plant traits and stand characteristics that can bepotentially used for deriving the EVPs.
Processes Ecosystem functional properties (EFPs) Description Plant traits/stand characteristics
Photosynthesis Ecosystem photosynthetic capacity(GPP1000max)
Maximum ecosystem photosynthesis (e.g.,GPP) standardized for light saturation, e.g., atlight intensity of 1000 W/m2 (see Falge et al.,2001; Gilmanov et al., 2003).
Leaf photosynthetic capacity (Amax; Vcmax);leaf nitrogen content per leaf area or dry mass(Nleaf); leaf mass per area (LMA); N:P ratiosLAI; Species abundance
Potential light use efficiency (LUEmax) Maximum ratio between GPP and absorbedphotosynthetic active radiation (APAR) atgrowing season (see Monteith, 1972; Kergoatet al., 2008).
Amax; Vcmax; Nleaf; LMA; plant height; leaf size;N:P ratiosLAI; Species abundance; Canopy structure
Nitrogen use efficiency (NUE) Maximum GPP1000 divided by leaf nitrogencontent
Amax; Vcmax; Nleaf, LMA; Nplant; wood density;N:P ratiosLAI; Biomass; Species abundance
Normalized GPP* GPP∗ = GPPmaxfPARcfPAR
cos(�=0)cos(�s)
Kergoat et al.
(2008)
Amax; Vcmax; Nleaf; LMA; N:P ratiosLAI; Biomass; Species abundance
Carbon use efficiency (CUE) 1) Biomass production divided by GPP2) NPP to GPP ratio (DeLucia et al., 2007).3) 1-Rb/GPP (Mahecha et al., 2010).
Amax; Vcmax; Nleaf, LMA; wood densityLAI; Biomass; Species abundance
Respiration Basal ecosystem respiration (Rb):1) Rb at day of Max GPP10002) Median of seasonal Rb3) Maximum seasonal Rb
Maximum or median of ecosystem respiration(Reco) at a reference temperature (15C) and atthe time period of no water limitations (Lloydand Taylor, 1994; Reichstein and Beer, 2008).
Nleaf; LMA; LDMC; RDMC; wood density
LAI; Biomass (above and belowground)Sensitivity of Rb to GPP (Rb/GPP) Slope of the relationship between Rb and GPP
Mahecha et al. (2010)Nleaf; LMA; LDMC; RDMC; wood densityLAI; Biomass (above and belowground)
Evapotranspiration Maximum ecosystem evapotranspiration(ETmax)
Maximum of the seasonal ET measured Maximum stomatal conductance (gsmax);sapwood area; wood densityLAI; Tree diameter at breast height (DBH)
Inherent water use efficiency(WUEin)
Slope of the relationship between GPP*VPDand ET Beer et al. (2009)
gsmax; Nleaf; LMA; sapwood area; Amax/gs,d13CLAI
Intrinsic water use efficiency(WUE*i)
Seasonal GPP divided by surface conductance(Gs)GPP/Gs Beer et al. (2009)
gsmax; Nleaf; LMA; sapwood area; Amax/gs;d13CLAI
Biophysical properties Energy use efficency GPP1000/(LE + H) at the peak of the growingseason or 90th percentile GPP/(LE + H) at thepeak of the growing season See also Reichstein
4)
Amax; Vcmax; Nleaf; LMA; Nplant; wood density;gsmax
LAI; Canopy structure; Biomass
the peak of the growing season al. (2012)
Leaf morphology (shape and size); Nleaf
LAI
3
aptfdtsltutfawomuebg2
taC
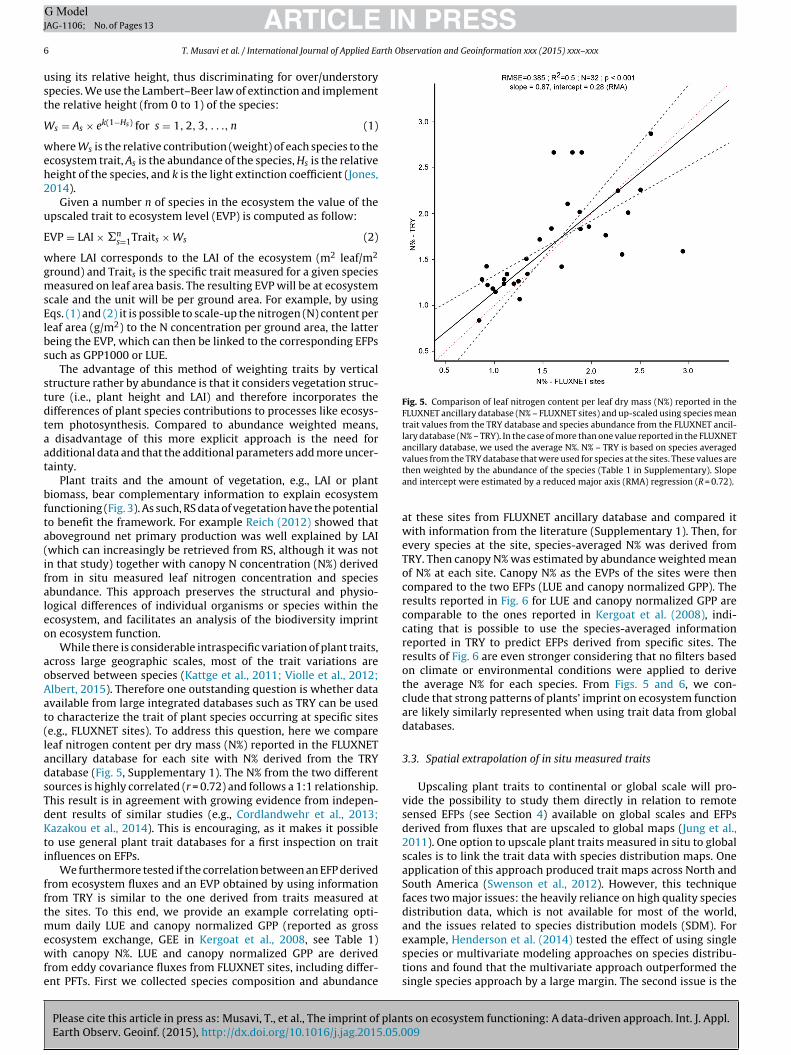
Fig. 4. Top-down and bottom-up approaches to determine flux-based ecosystem
et al. (201Minimum seasonal Albedo Albedo at
Cescatti et
.2. Upscaling of in situ measured traits
Plant traits are traditionally measured in situ and more recentlylso sensed remotely. In situ measurements of plant traits areerformed on plant or plant organ level and need to be upscaledo the ecosystem level (EVPs) to correspond to EFPs (Fig. 4). Thusar, upscaling of plant traits to canopy or ecosystem level has beenone mainly by weighting traits by abundance of species, allome-ry, or biomass (e.g., Garnier et al., 2004). These approaches makeense if the effects of the traits of individual plants are additive,ike using the number of individuals to upscale individual biomasso community biomass (Violle et al., 2007). This strategy is alsoseful for upscaling plant traits such as traits based on concentra-ion e.g., grams of nitrogen or phosphorous per leaf mass. But theunctionality of traits does not always scale with the quantity (e.g.,bundance) of organism. For example, while photosynthesis scalesith the nitrogen content of leaves (Givnish, 1986), it also depends
n the position of the leaves (or organ) in the canopy, which deter-ines the ability of the leaf to capture light. Plant productivity per
nit nutrient in the whole biomass is another example for the rel-vance of vegetation structure: it decreases with increasing totaliomass due to shading within the canopy and allocation of nitro-en to photosynthetically inactive tissues (Kerkhoff and Enquist,006).
Please cite this article in press as: Musavi, T., et al., The imprint of planEarth Observ. Geoinf. (2015), http://dx.doi.org/10.1016/j.jag.2015.05.0
An alternative upscaling approach accounting for light absorp-ion along the canopy employs involving LAI and plant height:ssuming leaves at the top of the canopy contribute most toO2 assimilation as they receive most of the radiation (Field and
functional properties (EFP) and trait-based ecosystem vegetation properties (EVPs).To link plant traits measured at the level of individual plants to EFPs, one first needsto upscale plant traits to the ecosystem level.
Mooney, 1986). Therefore, a canopy strata-weighted measure isneeded, as the comparatively larger contribution of species located
ts on ecosystem functioning: A data-driven approach. Int. J. Appl.09
towards the top of a canopy for carbon fixation or GPP needs tobe accounted for. To include this strata-weighting when upscal-ing from plant to EVP, we propose to first weigh each species byits respective abundance plus the amount of radiation it receives
IN PRESSG ModelJ
6 rth Observation and Geoinformation xxx (2015) xxx–xxx
ust
W
weh2
u
E
wgmsElbs
stdtaat
bfta(ifaleo
aoAat(ladsTdKti
fftmewfe
Fig. 5. Comparison of leaf nitrogen content per leaf dry mass (N%) reported in theFLUXNET ancillary database (N% – FLUXNET sites) and up-scaled using species meantrait values from the TRY database and species abundance from the FLUXNET ancil-lary database (N% – TRY). In the case of more than one value reported in the FLUXNETancillary database, we used the average N%. N% – TRY is based on species averaged
ARTICLEAG-1106; No. of Pages 13
T. Musavi et al. / International Journal of Applied Ea
sing its relative height, thus discriminating for over/understorypecies. We use the Lambert–Beer law of extinction and implementhe relative height (from 0 to 1) of the species:
s = As × ek(1−Hs) for s = 1, 2, 3, . . ., n (1)
here Ws is the relative contribution (weight) of each species to thecosystem trait, As is the abundance of the species, Hs is the relativeeight of the species, and k is the light extinction coefficient (Jones,014).
Given a number n of species in the ecosystem the value of thepscaled trait to ecosystem level (EVP) is computed as follow:
VP = LAI × �ns=1Traits × Ws (2)
here LAI corresponds to the LAI of the ecosystem (m2 leaf/m2
round) and Traits is the specific trait measured for a given specieseasured on leaf area basis. The resulting EVP will be at ecosystem
cale and the unit will be per ground area. For example, by usingqs. (1) and (2) it is possible to scale-up the nitrogen (N) content per
eaf area (g/m2) to the N concentration per ground area, the lattereing the EVP, which can then be linked to the corresponding EFPsuch as GPP1000 or LUE.
The advantage of this method of weighting traits by verticaltructure rather by abundance is that it considers vegetation struc-ure (i.e., plant height and LAI) and therefore incorporates theifferences of plant species contributions to processes like ecosys-em photosynthesis. Compared to abundance weighted means,
disadvantage of this more explicit approach is the need fordditional data and that the additional parameters add more uncer-ainty.
Plant traits and the amount of vegetation, e.g., LAI or plantiomass, bear complementary information to explain ecosystemunctioning (Fig. 3). As such, RS data of vegetation have the potentialo benefit the framework. For example Reich (2012) showed thatboveground net primary production was well explained by LAIwhich can increasingly be retrieved from RS, although it was notn that study) together with canopy N concentration (N%) derivedrom in situ measured leaf nitrogen concentration and speciesbundance. This approach preserves the structural and physio-ogical differences of individual organisms or species within thecosystem, and facilitates an analysis of the biodiversity imprintn ecosystem function.
While there is considerable intraspecific variation of plant traits,cross large geographic scales, most of the trait variations arebserved between species (Kattge et al., 2011; Violle et al., 2012;lbert, 2015). Therefore one outstanding question is whether datavailable from large integrated databases such as TRY can be usedo characterize the trait of plant species occurring at specific sitese.g., FLUXNET sites). To address this question, here we compareeaf nitrogen content per dry mass (N%) reported in the FLUXNETncillary database for each site with N% derived from the TRYatabase (Fig. 5, Supplementary 1). The N% from the two differentources is highly correlated (r = 0.72) and follows a 1:1 relationship.his result is in agreement with growing evidence from indepen-ent results of similar studies (e.g., Cordlandwehr et al., 2013;azakou et al., 2014). This is encouraging, as it makes it possible
o use general plant trait databases for a first inspection on traitnfluences on EFPs.
We furthermore tested if the correlation between an EFP derivedrom ecosystem fluxes and an EVP obtained by using informationrom TRY is similar to the one derived from traits measured athe sites. To this end, we provide an example correlating opti-
um daily LUE and canopy normalized GPP (reported as gross
Please cite this article in press as: Musavi, T., et al., The imprint of planEarth Observ. Geoinf. (2015), http://dx.doi.org/10.1016/j.jag.2015.05.0
cosystem exchange, GEE in Kergoat et al., 2008, see Table 1)ith canopy N%. LUE and canopy normalized GPP are derived
rom eddy covariance fluxes from FLUXNET sites, including differ-nt PFTs. First we collected species composition and abundance
values from the TRY database that were used for species at the sites. These values arethen weighted by the abundance of the species (Table 1 in Supplementary). Slopeand intercept were estimated by a reduced major axis (RMA) regression (R = 0.72).
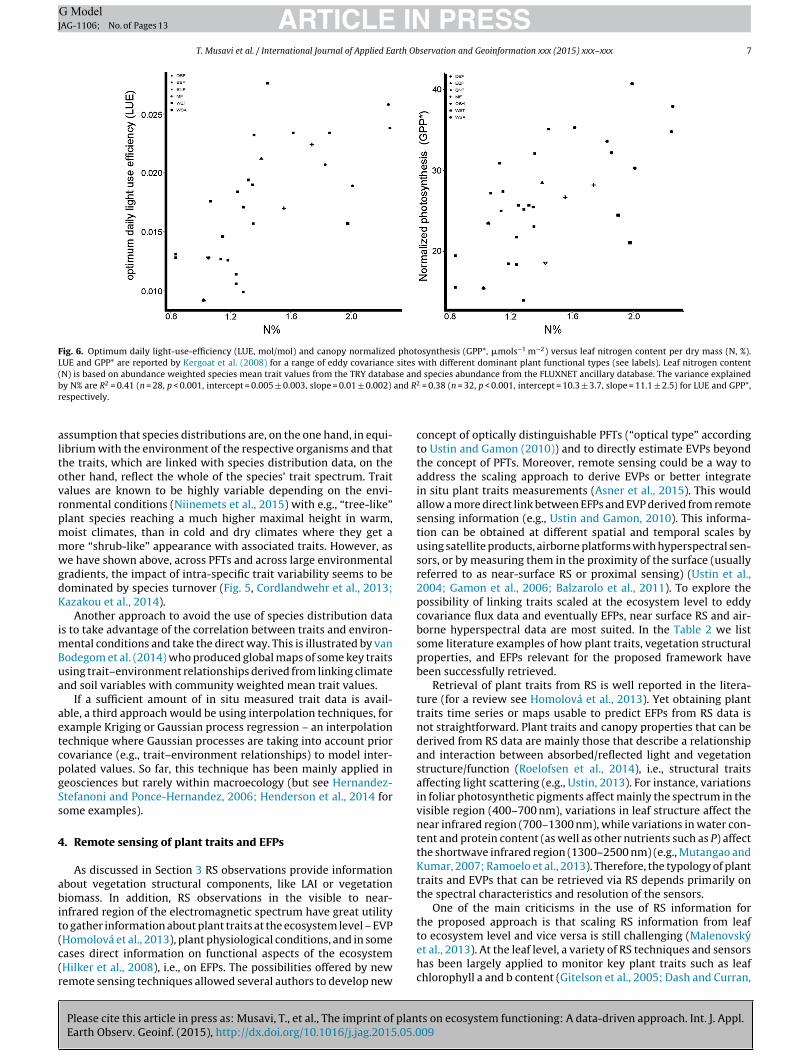
at these sites from FLUXNET ancillary database and compared itwith information from the literature (Supplementary 1). Then, forevery species at the site, species-averaged N% was derived fromTRY. Then canopy N% was estimated by abundance weighted meanof N% at each site. Canopy N% as the EVPs of the sites were thencompared to the two EFPs (LUE and canopy normalized GPP). Theresults reported in Fig. 6 for LUE and canopy normalized GPP arecomparable to the ones reported in Kergoat et al. (2008), indi-cating that is possible to use the species-averaged informationreported in TRY to predict EFPs derived from specific sites. Theresults of Fig. 6 are even stronger considering that no filters basedon climate or environmental conditions were applied to derivethe average N% for each species. From Figs. 5 and 6, we con-clude that strong patterns of plants’ imprint on ecosystem functionare likely similarly represented when using trait data from globaldatabases.
3.3. Spatial extrapolation of in situ measured traits
Upscaling plant traits to continental or global scale will pro-vide the possibility to study them directly in relation to remotesensed EFPs (see Section 4) available on global scales and EFPsderived from fluxes that are upscaled to global maps (Jung et al.,2011). One option to upscale plant traits measured in situ to globalscales is to link the trait data with species distribution maps. Oneapplication of this approach produced trait maps across North andSouth America (Swenson et al., 2012). However, this techniquefaces two major issues: the heavily reliance on high quality speciesdistribution data, which is not available for most of the world,and the issues related to species distribution models (SDM). For
ts on ecosystem functioning: A data-driven approach. Int. J. Appl.09
example, Henderson et al. (2014) tested the effect of using singlespecies or multivariate modeling approaches on species distribu-tions and found that the multivariate approach outperformed thesingle species approach by a large margin. The second issue is the
ARTICLE IN PRESSG ModelJAG-1106; No. of Pages 13
T. Musavi et al. / International Journal of Applied Earth Observation and Geoinformation xxx (2015) xxx–xxx 7
Fig. 6. Optimum daily light-use-efficiency (LUE, mol/mol) and canopy normalized photosynthesis (GPP*, �mols−1 m−2) versus leaf nitrogen content per dry mass (N, %).LUE and GPP* are reported by Kergoat et al. (2008) for a range of eddy covariance sites with different dominant plant functional types (see labels). Leaf nitrogen content(N) is based on abundance weighted species mean trait values from the TRY database and species abundance from the FLUXNET ancillary database. The variance explainedb and Rr
altovrpmmwgdK
imBua
aetcpgSs
4
abit(c(r
y N% are R2 = 0.41 (n = 28, p < 0.001, intercept = 0.005 ± 0.003, slope = 0.01 ± 0.002)
espectively.
ssumption that species distributions are, on the one hand, in equi-ibrium with the environment of the respective organisms and thathe traits, which are linked with species distribution data, on thether hand, reflect the whole of the species’ trait spectrum. Traitalues are known to be highly variable depending on the envi-onmental conditions (Niinemets et al., 2015) with e.g., “tree-like”lant species reaching a much higher maximal height in warm,oist climates, than in cold and dry climates where they get aore “shrub-like” appearance with associated traits. However, ase have shown above, across PFTs and across large environmental
radients, the impact of intra-specific trait variability seems to beominated by species turnover (Fig. 5, Cordlandwehr et al., 2013;azakou et al., 2014).
Another approach to avoid the use of species distribution datas to take advantage of the correlation between traits and environ-
ental conditions and take the direct way. This is illustrated by vanodegom et al. (2014) who produced global maps of some key traitssing trait–environment relationships derived from linking climatend soil variables with community weighted mean trait values.
If a sufficient amount of in situ measured trait data is avail-ble, a third approach would be using interpolation techniques, forxample Kriging or Gaussian process regression – an interpolationechnique where Gaussian processes are taking into account priorovariance (e.g., trait–environment relationships) to model inter-olated values. So far, this technique has been mainly applied ineosciences but rarely within macroecology (but see Hernandez-tefanoni and Ponce-Hernandez, 2006; Henderson et al., 2014 forome examples).
. Remote sensing of plant traits and EFPs
As discussed in Section 3 RS observations provide informationbout vegetation structural components, like LAI or vegetationiomass. In addition, RS observations in the visible to near-
nfrared region of the electromagnetic spectrum have great utilityo gather information about plant traits at the ecosystem level – EVP
Please cite this article in press as: Musavi, T., et al., The imprint of planEarth Observ. Geoinf. (2015), http://dx.doi.org/10.1016/j.jag.2015.05.0
Homolová et al., 2013), plant physiological conditions, and in someases direct information on functional aspects of the ecosystemHilker et al., 2008), i.e., on EFPs. The possibilities offered by newemote sensing techniques allowed several authors to develop new
2 = 0.38 (n = 32, p < 0.001, intercept = 10.3 ± 3.7, slope = 11.1 ± 2.5) for LUE and GPP*,
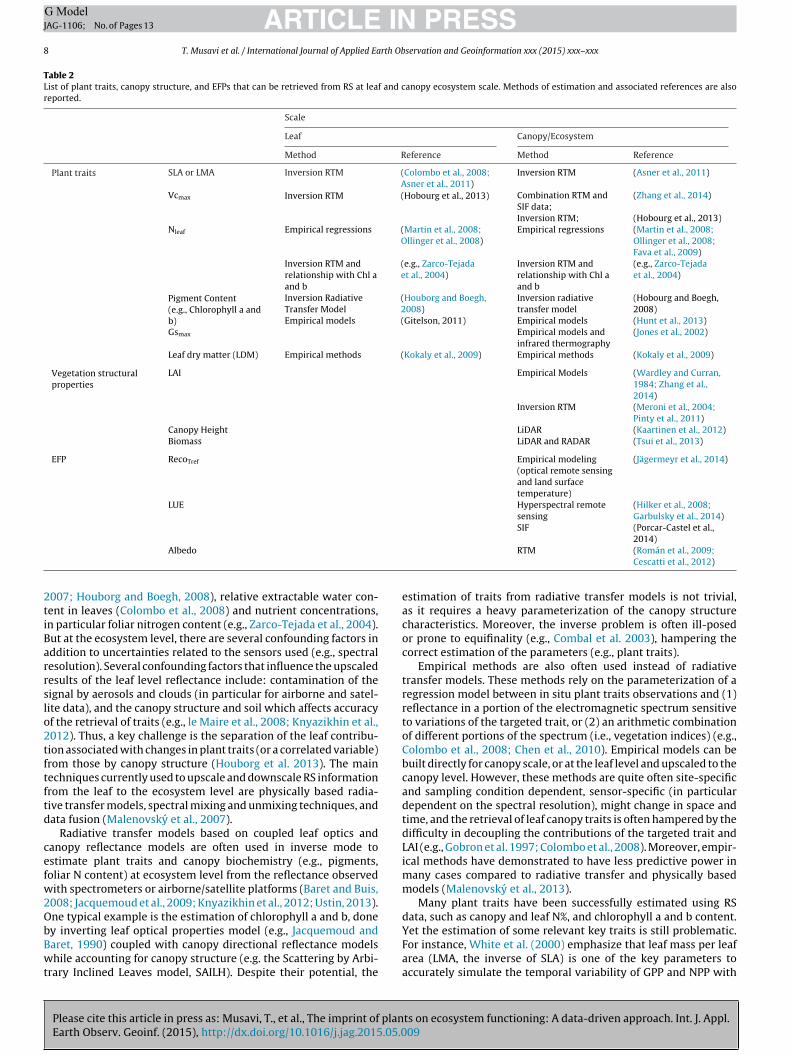
concept of optically distinguishable PFTs (“optical type” accordingto Ustin and Gamon (2010)) and to directly estimate EVPs beyondthe concept of PFTs. Moreover, remote sensing could be a way toaddress the scaling approach to derive EVPs or better integratein situ plant traits measurements (Asner et al., 2015). This wouldallow a more direct link between EFPs and EVP derived from remotesensing information (e.g., Ustin and Gamon, 2010). This informa-tion can be obtained at different spatial and temporal scales byusing satellite products, airborne platforms with hyperspectral sen-sors, or by measuring them in the proximity of the surface (usuallyreferred to as near-surface RS or proximal sensing) (Ustin et al.,2004; Gamon et al., 2006; Balzarolo et al., 2011). To explore thepossibility of linking traits scaled at the ecosystem level to eddycovariance flux data and eventually EFPs, near surface RS and air-borne hyperspectral data are most suited. In the Table 2 we listsome literature examples of how plant traits, vegetation structuralproperties, and EFPs relevant for the proposed framework havebeen successfully retrieved.
Retrieval of plant traits from RS is well reported in the litera-ture (for a review see Homolová et al., 2013). Yet obtaining planttraits time series or maps usable to predict EFPs from RS data isnot straightforward. Plant traits and canopy properties that can bederived from RS data are mainly those that describe a relationshipand interaction between absorbed/reflected light and vegetationstructure/function (Roelofsen et al., 2014), i.e., structural traitsaffecting light scattering (e.g., Ustin, 2013). For instance, variationsin foliar photosynthetic pigments affect mainly the spectrum in thevisible region (400–700 nm), variations in leaf structure affect thenear infrared region (700–1300 nm), while variations in water con-tent and protein content (as well as other nutrients such as P) affectthe shortwave infrared region (1300–2500 nm) (e.g., Mutangao andKumar, 2007; Ramoelo et al., 2013). Therefore, the typology of planttraits and EVPs that can be retrieved via RS depends primarily onthe spectral characteristics and resolution of the sensors.
One of the main criticisms in the use of RS information forthe proposed approach is that scaling RS information from leaf
ts on ecosystem functioning: A data-driven approach. Int. J. Appl.09
to ecosystem level and vice versa is still challenging (Malenovskyet al., 2013). At the leaf level, a variety of RS techniques and sensorshas been largely applied to monitor key plant traits such as leafchlorophyll a and b content (Gitelson et al., 2005; Dash and Curran,
ARTICLE IN PRESSG ModelJAG-1106; No. of Pages 13
8 T. Musavi et al. / International Journal of Applied Earth Observation and Geoinformation xxx (2015) xxx–xxx
Table 2List of plant traits, canopy structure, and EFPs that can be retrieved from RS at leaf and canopy ecosystem scale. Methods of estimation and associated references are alsoreported.
Scale
Leaf Canopy/Ecosystem
Method Reference Method Reference
Plant traits SLA or LMA Inversion RTM (Colombo et al., 2008;Asner et al., 2011)
Inversion RTM (Asner et al., 2011)
Vcmax Inversion RTM (Hobourg et al., 2013) Combination RTM andSIF data;
(Zhang et al., 2014)
Inversion RTM; (Hobourg et al., 2013)Nleaf Empirical regressions (Martin et al., 2008;
Ollinger et al., 2008)Empirical regressions (Martin et al., 2008;
Ollinger et al., 2008;Fava et al., 2009)
Inversion RTM andrelationship with Chl aand b
(e.g., Zarco-Tejadaet al., 2004)
Inversion RTM andrelationship with Chl aand b
(e.g., Zarco-Tejadaet al., 2004)
Pigment Content(e.g., Chlorophyll a andb)
Inversion RadiativeTransfer Model
(Houborg and Boegh,2008)
Inversion radiativetransfer model
(Hobourg and Boegh,2008)
Empirical models (Gitelson, 2011) Empirical models (Hunt et al., 2013)Gsmax Empirical models and
infrared thermography(Jones et al., 2002)
Leaf dry matter (LDM) Empirical methods (Kokaly et al., 2009) Empirical methods (Kokaly et al., 2009)
Vegetation structuralproperties
LAI Empirical Models (Wardley and Curran,1984; Zhang et al.,2014)
Inversion RTM (Meroni et al., 2004;Pinty et al., 2011)
Canopy Height LiDAR (Kaartinen et al., 2012)Biomass LiDAR and RADAR (Tsui et al., 2013)
EFP RecoTref Empirical modeling(optical remote sensingand land surfacetemperature)
(Jägermeyr et al., 2014)
LUE Hyperspectral remotesensing
(Hilker et al., 2008;Garbulsky et al., 2014)
SIF (Porcar-Castel et al.,
2tiBarrslo2tftftd
cefw2ObBwt
Albedo
007; Houborg and Boegh, 2008), relative extractable water con-ent in leaves (Colombo et al., 2008) and nutrient concentrations,n particular foliar nitrogen content (e.g., Zarco-Tejada et al., 2004).ut at the ecosystem level, there are several confounding factors inddition to uncertainties related to the sensors used (e.g., spectralesolution). Several confounding factors that influence the upscaledesults of the leaf level reflectance include: contamination of theignal by aerosols and clouds (in particular for airborne and satel-ite data), and the canopy structure and soil which affects accuracyf the retrieval of traits (e.g., le Maire et al., 2008; Knyazikhin et al.,012). Thus, a key challenge is the separation of the leaf contribu-ion associated with changes in plant traits (or a correlated variable)rom those by canopy structure (Houborg et al. 2013). The mainechniques currently used to upscale and downscale RS informationrom the leaf to the ecosystem level are physically based radia-ive transfer models, spectral mixing and unmixing techniques, andata fusion (Malenovsky et al., 2007).
Radiative transfer models based on coupled leaf optics andanopy reflectance models are often used in inverse mode tostimate plant traits and canopy biochemistry (e.g., pigments,oliar N content) at ecosystem level from the reflectance observed
ith spectrometers or airborne/satellite platforms (Baret and Buis,008; Jacquemoud et al., 2009; Knyazikhin et al., 2012; Ustin, 2013).ne typical example is the estimation of chlorophyll a and b, done
Please cite this article in press as: Musavi, T., et al., The imprint of planEarth Observ. Geoinf. (2015), http://dx.doi.org/10.1016/j.jag.2015.05.0
y inverting leaf optical properties model (e.g., Jacquemoud andaret, 1990) coupled with canopy directional reflectance modelshile accounting for canopy structure (e.g. the Scattering by Arbi-
rary Inclined Leaves model, SAILH). Despite their potential, the
2014)RTM (Román et al., 2009;
Cescatti et al., 2012)
estimation of traits from radiative transfer models is not trivial,as it requires a heavy parameterization of the canopy structurecharacteristics. Moreover, the inverse problem is often ill-posedor prone to equifinality (e.g., Combal et al. 2003), hampering thecorrect estimation of the parameters (e.g., plant traits).
Empirical methods are also often used instead of radiativetransfer models. These methods rely on the parameterization of aregression model between in situ plant traits observations and (1)reflectance in a portion of the electromagnetic spectrum sensitiveto variations of the targeted trait, or (2) an arithmetic combinationof different portions of the spectrum (i.e., vegetation indices) (e.g.,Colombo et al., 2008; Chen et al., 2010). Empirical models can bebuilt directly for canopy scale, or at the leaf level and upscaled to thecanopy level. However, these methods are quite often site-specificand sampling condition dependent, sensor-specific (in particulardependent on the spectral resolution), might change in space andtime, and the retrieval of leaf canopy traits is often hampered by thedifficulty in decoupling the contributions of the targeted trait andLAI (e.g., Gobron et al. 1997; Colombo et al., 2008). Moreover, empir-ical methods have demonstrated to have less predictive power inmany cases compared to radiative transfer and physically basedmodels (Malenovsky et al., 2013).
Many plant traits have been successfully estimated using RSdata, such as canopy and leaf N%, and chlorophyll a and b content.
ts on ecosystem functioning: A data-driven approach. Int. J. Appl.09
Yet the estimation of some relevant key traits is still problematic.For instance, White et al. (2000) emphasize that leaf mass per leafarea (LMA, the inverse of SLA) is one of the key parameters toaccurately simulate the temporal variability of GPP and NPP with
ING ModelJ
rth Ob
tRttOvwe
eiofosEb(iaftsLrbC(etcS(i(i
5
ctoobswecRHlfcouapta
A
S
ARTICLEAG-1106; No. of Pages 13
T. Musavi et al. / International Journal of Applied Ea
errestrial biosphere models. However, the estimation of LMA fromS is far from precise. Homolová et al. (2013) reviewed the litera-ure and reported an average relative RMSE of 45.0% (1sd 30.0%) forhe LMA retrieval, regardless of the method used for the estimation.ne of the main problems is that LMA estimations are sensitive toariations in the portion of the spectrum that is also affected byater absorption which can act as a confounding factor (e.g., Asner
t al., 2011).RS applications to estimate EFPs directly have not yet been fully
xplored. Albedo is one of the key EFPs (Table 1), and its variabil-ty in time and space can be globally retrieved through the usef near-surface and RS products. Nevertheless, current approachesor measuring in situ albedo are not adequate to describe mixedr highly heterogeneous landscapes such as mixed forests, openhrublands, savannas, and croplands (Cescatti et al., 2012). AlsoFPs related to photosynthesis (e.g., LUE, Table 1) might be inferredy RS measurements such as sun-induced chlorophyll fluorescenceSIF, Porcar-Castell et al., 2014) and photochemical reflectancendex (PRI) (Gamon et al., 1992), which have proven to be valu-ble methods for the direct assessment of plant photosynthesis,rom the ecosystem scale (Meroni et al., 2009; Damm et al., 2010)o regional and global scale (e.g., Guanter et al., 2014). These mea-urements can in principle be used to directly estimate ecosystemUE (Garbulsky et al., 2014), ecosystem maximum carboxylationate (Vcmax) via empirical relationships (Houborg et al., 2013), ory inverting radiative transfer models simulating SIF, such as Soilanopy Observation Photosynthesis Energy balance model – SCOPEe.g., van der Tol et al. 2009; Zhang et al., 2014). Nevertheless, thestimation of these EFPs from time series of SIF or PRI is not a trivialask given the series of confounding factors that affect the signal atanopy and ecosystem scale, in particular the algorithm retrieval forIF (e.g., Meroni et al., 2009), variation of LAI and directional effectse.g., Garbulsky et al., 2014), and also the mechanistic understand-ng of the link between SIF and photosynthesis at the seasonal scalePorcar-Castell et al., 2014). Still, it seems promising to infer directnformation on parameters related to EFPs using RS.
. Conclusions
We propose a pathway to empirically analyze the intrinsic bioticontrols of terrestrial ecosystem functioning based on the concep-ualization of ecosystem functional properties (EFPs) as indicatorsf ecosystem functional state. Since the variability of EFPs cannly partly be explained by environmental drivers, we expect thatiotic controls, represented by plant abundance and traits, mea-ured in situ or via RS (ecosystem vegetation properties, EVPs)ill explain an additional important component of the variation in
cosystem functioning. We provide examples how EFPs and bioticorrespondents (here EVPs) can be derived from ecosystem fluxes,S, and plant traits considering information on canopy structure.owever, further work is necessary to test how to best derive EFPs,
ink these to EVPs, and assess the uncertainties associated to the dif-erent methods. We anticipate our framework will encourage theombination of ecosystem flux studies with EFPs, RS, and in situbserved plant traits (as EVPs), with the final goal to increase ournderstanding of how environmental drivers shape ecosystemsnd vice versa. The outcome of such empirical studies will com-lement complex predictive terrestrial biosphere models and helpo better predict long term trajectories of ecosystem functioningnd ecosystem services under climate change.
Please cite this article in press as: Musavi, T., et al., The imprint of planEarth Observ. Geoinf. (2015), http://dx.doi.org/10.1016/j.jag.2015.05.0
cknowledgments
T.M. acknowledges the International Max Planck Researchchool for global biogeochemical cycles. The study has been
PRESSservation and Geoinformation xxx (2015) xxx–xxx 9
supported by the TRY initiative on plant traits (http://www.try-db.org), hosted at the Max Planck Institute for Biogeochem-istry and currently supported by DIVERSITAS/Future Earth andthe German Centre for Integrative Biodiversity Research (iDiv)Halle–Jena–Leipzig. We wish to thank all the people who made thedata on N% available in TRY (Cornelissen, 1996; Cornelissen et al.,1996; Bahn et al., 1999; Medlyn et al., 1999; Meziane and Shipley,1999; Niinemets, 2001; Cornelissen et al., 2003b; Loveys et al.,2003; Quested et al., 2003; Ogaya and Penuelas, 2003; Cornelissenet al., 2004; Díaz et al., 2004; Wright et al., 2004; Bakker et al., 2005;Craine et al., 2005; Han et al., 2005; Louault et al., 2005; Bakkeret al., 2006; Kazakou et al., 2006; Kerkhoff et al., 2006; Prestonet al., 2006; Campbell et al., 2007; Garnier et al., 2007; Cornwellet al., 2008; Reich et al., 2008; Craine et al., 2009; Kattge et al.,2009; Reich et al., 2009; Freschet et al., 2010; Laughlin et al., 2010;Ordonez et al., 2010; Willis et al., 2010). We thank Lee Miller for hiskind language check.
Appendix A. Supplementary data
Supplementary data associated with this article can be found, inthe online version, at http://dx.doi.org/10.1016/j.jag.2015.05.009
References
Albert, C.H., 2015. Intraspecific trait variability matters. J. Veg. Sci. 26 (1), 7–8.Asner, G.P., Martin, R.E., Anderson, C.B., Knapp, D.E., 2015. Quantifying forest
canopy traits: imaging spectroscopy versus field survey. Remote Sens. Environ.158, 15–27.
Asner, G.P., Martin, R.E., Tupayachi, R., Emerson, R., Martinez, P., Sinca, F., Powell,G.V.N., Wright, S.J., Lugo, A.E., 2011. Taxonomy and remote sensing of leaf massper area (LMA) in humid tropical forests. Ecol. Appl. 21 (1), 85–98.
Aubinet, M., Grelle, A., Ibrom, A., Rannik, U., Moncrieff, J., Foken, T., Kowalski, A.S.,Martin, P.H., Berbigier, P., Bernhofer, C., Clement, R., Elbers, J., Granier, A.,Grunwald, T., Morgenstern, K., Pilegaard, K., Rebmann, C., Snijders, W.,Valentini, R., Vesala, T., 2000. Estimates of the annual net carbon and waterexchange of forests: the EUROFLUX methodology. Adv. Ecol. Res. 30 (30),113–175.
Bahn, M., Wohlfahrt, G., Haubner, E., Horak, I., Michaeler, W., Rottmar, K.,Tappeiner, U., Cernusca, A., 1999. Leaf photosynthesis, nitrogen contents andspecific leaf area of 30 grassland species in differently managed mountainecosystems in the Eastern Alps. In: Cernusca, A., Tappeiner, U., Bayfield, N.(Eds.), Land-Use Changes in European Mountain Ecosystems. Ecomont –Concept and Results. Blackwell Wissenschaft, Berlin, pp. 247–255.
Bakker, C., Rodenburg, J., van Bodegom, P.M., 2005. Effects of Ca- and Fe-richseepage on P availability and plant performance in calcareous dune soils. PlantSoil 275 (1–2), 111–122.
Bakker, C., Van Bodegom, P.M., Nelissen, H.J.M., Ernst, W.H.O., Aerts, R., 2006. Plantresponses to rising water tables and nutrient management in calcareous duneslacks. Plant Ecol. 185 (1), 19–28.
Baldocchi, D., 2008. Breathing of the terrestrial biosphere: lessons learned from aglobal network of carbon dioxide flux measurement systems. Aust. J. Bot. 56(1), 1–26.
Baldocchi, D., Falge, E., Gu, L.H., Olson, R., Hollinger, D., Running, S., Anthoni, P.,Bernhofer, C., Davis, K., Evans, R., Fuentes, J., Goldstein, A., Katul, G., Law, B.,Lee, X.H., Malhi, Y., Meyers, T., Munger, W., Oechel, W., Pilegaard, K.T.P.U.K.,Schmid, H.P., Valentini, R., Verma, S., Vesala, T., Wilson Wofsy, K.S., 2001.FLUXNET: a new tool to study the temporal and spatial variability ofecosystem-scale carbon dioxide, water vapor, and energy flux densities. Bull.Am. Meteorol. Soc. 82 (11), 2415–2434.
Baldocchi, D.D., Hicks, B.B., Meyers, T.P., 1988. measuring biosphere-atmosphereexchanges of biologically related gases with micrometeorological methods.Ecology 69 (5), 1331–1340.
Balzarolo, M., Anderson, K., Nichol, C., Rossini, M., Vescovo, L., Arriga, N., Wohlfahrt,G., Calvet, J.C., Carrara, A., Cerasoli, S., Cogliati, S., Daumard, F., Eklundh, L.,Elbers, J.A., Evrendilek, F., Handcock, R.N., Kaduk, J., Klumpp, K., Longdoz, B.,Matteucci, G., Meroni, M., Montagnani, L., Ourcival, J.M., Sanchez-Canete, E.P.,Pontailler, J.Y., Juszczak, R., Scholes, B., M, 2011. Ground-based opticalmeasurements at european flux sites: a review of methods, instruments andcurrent controversies. Sensors 11 (8), 7954–7981.
Baret, F., Buis, S., 2008. Estimating canopy characteristics from remote sensingobservations: review of methods and associated problems. Adv. Land RemoteSens., 173–201, Chapter 7.
ts on ecosystem functioning: A data-driven approach. Int. J. Appl.09
Beer, C., Ciais, P., Reichstein, M., Baldocchi, D., Law, B.E., Papale, D., Soussana, J.F.,Ammann, C., Buchmann, N., Frank, D., Gianelle, D., Janssens, I.A., Knohl, A.,Kostner, B., Moors, E., Roupsard, O., Verbeeck, H., Vesala, T., Williams, C.A.,Wohlfahrt, G., 2009. Temporal and among-site variability of inherent wateruse efficiency at the ecosystem level. Global Biogeochem. Cycles, 23.
ING ModelJ
1 rth Ob
B
B
B
B
C
C
C
C
C
C
C
C
C
C
C
C
C
C
C
C
C
D
ARTICLEAG-1106; No. of Pages 13
0 T. Musavi et al. / International Journal of Applied Ea
onan, G.B., 2008. Forests and climate change: forcings, feedbacks, and the climatebenefits of forests. Science 320 (5882), 1444–1449.
ox, E.O., 1996. Plant functional types and climate at the global scale. J. Veg. Sci. 7(3), 309–320.
rovkin, V., van Bodegom, P.M., Kleinen, T., Wirth, C., Cornwell, W.K., Cornelissen,J.H.C., Kattge, J., 2012. Plant-driven variation in decomposition rates improvesprojections of global litter stock distribution. Biogeosciences 9 (1), 565–576.
uckley, T.N., 2005. The control of stomata by water balance. New Phytol. 168 (2),275–291.
ampbell, C., Atkinson, L., Zaragoza-Castells, J., Lundmark, M., Atkin, O., Hurry, V.,2007. Acclimation of photosynthesis and respiration is asynchronous inresponse to changes in temperature regardless of plant functional group. NewPhytol. 176 (2), 375–389.
escatti, A., Marcolla, B., Vannan, S.K.S., Pan, J.Y., Roman, M.O., Yang, X.Y., Ciais, P.,Cook, R.B., Law, B.E., Matteucci, G., Migliavacca, M., Moors, E., Richardson, A.D.,Seufert, G., Schaaf, C.B., 2012. Intercomparison of MODIS albedo retrievals andin situ measurements across the global FLUXNET network. Remote Sens.Environ. 121, 323–334.
hapin, F.S., Zavaleta, E.S., Eviner, V.T., Naylor, R.L., Vitousek, P.M., Reynolds, H.L.,Hooper, D.U., Lavorel, S., Sala, O.E., Hobbie, S.E., Mack, M.C., Diaz, S., 2000.Consequences of changing biodiversity. Nature 405 (6783), 234–242.
hapin, F.S., Sala, O.E., Burke, I.C., Grime, J.P., Hooper, D.U., Lauenroth, W.K.,Lombard, A., Mooney, H.A., Mosier, A.R., Naeem, S., Pacala, S.W., Roy, J., Steffen,W.L., Tilman, D., 1998. Ecosystem consequences of changing biodiversity –experimental evidence and a research agenda for the future. Bioscience 48 (1),45–52.
hen, P.F., Haboudane, D., Tremblay, N., Wang, J.H., Vigneault, P., Li, B.G., 2010.New spectral indicator assessing the efficiency of crop nitrogen treatment incorn and wheat. Remote Sens. Environ. 114 (9), 1987–1997.
leveland, C.C., Townsend, A.R., Taylor, P., Alvarez-Clare, S., Bustamante, M.M.C.,Chuyong, G., Dobrowski, S.Z., Grierson, P., Harms, K.E., Houlton, B.Z., Marklein,A., Parton, W., Porder, S., Reed, S.C., Sierra, C.A., Silver, W.L., Tanner, E.V.J.,Wieder, W.R., 2011. Relationships among net primary productivity, nutrientsand climate in tropical rain forest: a pan-tropical analysis. Ecol. Lett. 14 (9),939–947.
olombo, R., Merom, M., Marchesi, A., Busetto, L., Rossini, M., Giardino, C.,Panigada, C., 2008. Estimation of leaf and canopy water content in poplarplantations by means of hyperspectral indices and inverse modeling. RemoteSens. Environ. 112 (4), 1820–1834.
ombal, B., Baret, F., Weiss, M., Trubuil, A., Mace, D., Pragnere, A., Myneni, R.,Knyazikhin, Y., Wang, L., 2003. Retrieval of canopy biophysical variables frombidirectional reflectance – using prior information to solve the ill-posedinverse problem. Remote Sens. Environ. 84 (1), 1–15.
ordlandwehr, V., Meredith, R.L., Ozinga, W.A., Bekker, R.M., van Groenendael, J.M.,Bakker, J.P., 2013. Do plant traits retrieved from a database accurately predicton-site measurements? J. Ecol. 101 (3), 662–670.
ornelissen, J.H.C., Quested, H.M., Gwynn-Jones, D., Van Logtestijn, R.S.P., De Beus,M.A.H., Kondratchuk, A., Callaghan, T.V., Aerts, R., 2004. Leaf digestibility andlitter decomposability are related in a wide range of subarctic plant speciesand types. Funct. Ecol. 18 (6), 779–786.
ornelissen, J.H.C., Lavorel, S., Garnier, E., Diaz, S., Buchmann, N., Gurvich, D.E.,Reich, P.B., ter Steege, H., Morgan, H.D., van der Heijden, M.G.A., Pausas, J.G.,Poorter, H., 2003a. A handbook of protocols for standardised and easymeasurement of plant functional traits worldwide. Aust. J. Bot. 51 (4), 335–380.
ornelissen, J.H.C., Cerabolini, B., Castro-Diez, P., Villar-Salvador, P.,Montserrat-Marti, G., Puyravaud, J.P., Maestro, M., Werger, M.J.A., Aerts, R.,2003b. Functional traits of woody plants: correspondence of species rankingsbetween field adults and laboratory-grown seedlings? J. Veg. Sci. 14 (3),311–322.
ornelissen, J.H.C., 1996. An experimental comparison of leaf decomposition ratesin a wide range of temperate plant species and types. J. Ecol. 84, 573–582.
ornelissen, J.H.C., Diez, P.C., Hunt, R., 1996. Seedling growth, allocation and leafattributes in a wide range of woody plant species and types. J. Ecol. 84 (5),755–765.
ornwell, W.K., Cornelissen, J.H.C., Amatangelo, K., Dorrepaal, E., Eviner, V.T.,Godoy, O., Hobbie, S.E., Hoorens, B., Kurokawa, H., Perez-Harguindeguy, N.,Quested, H.M., Santiago, L.S., Wardle, D.A., Wright, I.J., Aerts, R., Allison, S.D.,van Bodegom, P., Brovkin, V., Chatain, A., Callaghan, T.V., Diaz, S., Garnier, E.,Gurvich, D.E., Kazakou, E., Klein, J.A., Read, J., Reich, P.B., Soudzilovskaia, N.A.,Vaieretti, M.V., Westoby, M., 2008. Plant species traits are the predominantcontrol on litter decomposition rates within biomes worldwide. Ecol. Lett. 11(10), 1065–1071.
raine, J.M., Elmore, A.J., Aidar, M.P.M., Bustamante, M., Dawson, T.E., Hobbie, E.A.,Kahmen, A., Mack, M.C., McLauchlan, K.K., Michelsen, A., Nardoto, G.B., Pardo,L.H., Penuelas, J., Reich, P.B., Schuur, E.A.G., Stock, W.D., Templer, P.H., Virginia,R.A., Welker, J.M., Wright, I.J., 2009. Global patterns of foliar nitrogen isotopesand their relationships with climate, mycorrhizal fungi, foliar nutrientconcentrations, and nitrogen availability. New Phytol. 183 (4), 980–992.
raine, J.M., Lee, W.G., Bond, W.J., Williams, R.J., Johnson, L.C., 2005. Environmentalconstraints on a global relationship among leaf and root traits of grasses.Ecology 86 (1), 12–19.
Please cite this article in press as: Musavi, T., et al., The imprint of planEarth Observ. Geoinf. (2015), http://dx.doi.org/10.1016/j.jag.2015.05.0
amm, A., Elbers, J., Erler, A., Gioli, B., Hamdi, K., Hutjes, R., Kosvancova, M.,Meroni, M., Miglietta, F., Moersch, A., Moreno, J., Schickling, A., Sonnenschein,R., Udelhoven, T., van der Linden, S., Hostert, P., Rascher, U., 2010. Remotesensing of sun-induced fluorescence to improve modeling of diurnal courses ofgross primary production (GPP). Global Change Biol. 16 (1), 171–186.
PRESSservation and Geoinformation xxx (2015) xxx–xxx
Dash, J., Curran, P.J., 2007. Evaluation of the MERIS terrestrial chlorophyll index(MTCI). Adv. Space Res. 39 (1), 100–104.
de Bello, F., Lavorel, S., Diaz, S., Harrington, R., Cornelissen, J.H.C., Bardgett, R.D.,Berg, M.P., Cipriotti, P., Feld, C.K., Hering, D., da Silva, P.M., Potts, S.G., Sandin, L.,Sousa, J.P., Storkey, J., Wardle, D.A., Harrison, P.A., 2010. Towards anassessment of multiple ecosystem processes and services via functional traits.Biodivers. Conserv. 19 (10), 2873–2893.
DeLucia, E.H., Drake, J.E., Thomas, R.B., Gonzalez-Meler, M., 2007. Forest carbon useefficiency: is respiration a constant fraction of gross primary production?Global Change Biol. 13 (6), 1157–1167.
Díaz, S., Hodgson, J.G., Thompson, K., Cabido, M., Cornelissen, J.H.C., Jalili, A.,Montserrat-Marti, G., Grime, J.P., Zarrinkamar, F., Asri, Y., Band, S.R.,Basconcelo, S., Castro-Diez, P., Funes, G., Hamzehee, B., Khoshnevi, M.,Perez-Harguindeguy, N., Perez-Rontome, M.C., Shirvany, F.A., Vendramini, F.,Yazdani, S., Abbas-Azimi, R., Bogaard, A., Boustani, S., Charles, M., Dehghan, M.,de Torres-Espuny, L., Falczuk, V., Guerrero-Campo, J., Hynd, A., Jones, G.,Kowsary, E., Kazemi-Saeed, F., Maestro-Martinez, M., Romo-Diez, A., Shaw, S.,Siavash, B., Villar-Salvador, P., Zak, M.R., 2004. The plant traits that driveecosystems: evidence from three continents. J. Veg. Sci. 15 (3),295–304.
Dunn, A.L., Barford, C.C., Wofsy, S.C., Goulden, M.L., Daube, B.C., 2007. A long-termrecord of carbon exchange in a boreal black spruce forest: means, responses tointerannual variability, and decadal trends. Global Change Biol. 13 (3),577–590.
Falge, E., Baldocchi, D., Olson, R., Anthoni, P., Aubinet, M., Bernhofer, C., Burba, G.,Ceulemans, R., Clement, R., Dolman, H., Granier, A., Gross, P., Grunwald, T.,Hollinger, D., Jensen, N.O., Katul, G., Keronen, P., Kowalski, A., Lai, C.T., Law, B.E.,Meyers, T., Moncrieff, H., Moors, E., Munger, J.W., Pilegaard, K., Rannik, U.,Rebmann, C., Suyker, A., Tenhunen, J., Tu, K., Verma, S., Vesala, T., Wilson, K.,Wofsy, S., 2001. Gap filling strategies for defensible annual sums of netecosystem exchange. Agric. For. Meteorol. 107 (1), 43–69.
Fava, F., Colombo, R., Bocchi, S., Meroni, M., Sitzia, M., Fois, N., Zucca, C., 2009.Identification of hyperspectral vegetation indices for Mediterranean pasturecharacterization. Int. J. Appl. Earth Observ. Geoinf. 11 (4), 233–243.
Field, C.B., Chapin, F.S., Matson, P.A., Mooney, H.A., 1992. Responses of terrestrialecosystems to the changing atmosphere – a resource-based approach. Ann.Rev. Ecol. Syst. 23, 201–235.
Field, C., Mooney, H.A., 1986. The photosynthesis – nitrogen relationship in wildplants. In: Givnish, T.J. (Ed.), On the Economy of Plant Form and Function.Cambridge University Press, Cambridge, pp. 22–55.
Fisher, J.B., S. Sweeney, E.R. Brzostek, T.P. Evans, N.A. Bourg, R.P. Phillips (inreview). Remote sensing of mycorrhizal associations from canopy spectralproperties. Submitted to: Nature Plants.
Foken, T., Wichura, B., 1996. Tools for quality assessment of surface-based fluxmeasurements. Agric. For. Meteorol. 78 (1–2), 83–105.
Freschet, G.T., Cornelissen, J.H.C., van Logtestijn, R.S.P., Aerts, R., 2010. Evidence ofthe ‘plant economics spectrum’ in a subarctic flora. J. Ecol. 98 (2),362–373.
Friend, A.D., Cox, P.M., 1995. Modeling the effects of atmospheric CO2 onvegetation atmosphere interactions. Agric. For. Meteorol. 73 (3–4), 285–295.
Gamon, J.A., Rahman, A.F., Dungan, J.L., Schildhauer, M., Huemmrich, K.F., 2006.Spectral network (SpecNet) – what is it and why do we need it? Remote Sens.Environ. 103 (3), 227–235.
Gamon, J.A., Penuelas, J., Field, C.B., 1992. A narrow-waveband spectral index thattracks diurnal changes in photosynthetic efficiency. Remote Sens. Environ. 41(1), 35–44.
Garbulsky, M.F., Filella, I., Verger, A., Penuelas, J., 2014. Photosynthetic light useefficiency from satellite sensors: from global to Mediterranean vegetation.Environ. Exp. Bot. 103, 3–11.
Garnier, E., Lavorel, S., Ansquer, P., Castro, H., Cruz, P., Dolezal, J., Eriksson, O.,Fortunel, C., Freitas, H., Golodets, C., Grigulis, K., Jouany, C., Kazakou, E., Kigel, J.,Kleyer, M., Lehsten, V., Leps, J., Meier, T., Pakeman, R., Papadimitriou, M.,Papanastasis, V.P., Quested, H., Quetier, F., Robson, M., Roumet, C., Rusch, G.,Skarpe, C., Sternberg, M., Theau, J.P., Thebault, A., Vile, D., Zarovali, M.P., 2007.Assessing the effects of land-use change on plant traits, communities andecosystem functioning in grasslands: a standardized methodology and lessonsfrom an application to 11 European sites. Ann. Bot. 99 (5), 967–985.
Garnier, E., Cortez, J., Billes, G., Navas, M.L., Roumet, C., Debussche, M., Laurent, G.,Blanchard, A., Aubry, D., Bellmann, A., Neill, C., Tossaint, J.P., 2004. Plantfunctional markers capture ecosystem properties during secondary succession.Ecology 85 (9), 2630–2637.
Gilmanov, T.G., Verma, S.B., Sims, P.L., Meyers, T.P., Bradford, J.A., Burba, G.G.,Suyker, A.E., 2003. Gross primary production and light response parameters offour Southern Plains ecosystems estimated using long-term CO2-flux towermeasurements. Global Biogeochem. Cycles 17 (2).
Gitelson, A.A., Vina, A., Ciganda, V., Rundquist, D.C., Arkebauer, T.J., 2005. Remoteestimation of canopy chlorophyll content in crops. Geophys. Res. Lett. 32 (8).
Givnish, T.J., 1986. On the Economy of Plant Form and Function. University ofCambridge.
Gobron, N., Pinty, B., Verstraete, M.M., 1997. Theoretical limits to the estimation ofthe leaf area index on the basis of visible and near-infrared remote sensing
ts on ecosystem functioning: A data-driven approach. Int. J. Appl.09
data. Ieee Trans. Geosci. Remote Sens. 35 (6), 1438–1445.Goll, D.S., Brovkin, V., Parida, B.R., Reick, C.H., Kattge, J., Reich, P.B., van Bodegom,
P.M., Niinemets, U., 2012. Nutrient limitation reduces land carbon uptake insimulations with a model of combined carbon, nitrogen and phosphoruscycling. Biogeosciences 9 (9), 3547–3569.
ING ModelJ
rth Ob
G
G
G
G
H
H
H
H
H
H
H
H
H
J
J
J
J
J
J
K
K
ARTICLEAG-1106; No. of Pages 13
T. Musavi et al. / International Journal of Applied Ea
reen, D.S., Erickson, J.E., Kruger, E.L., 2003. Foliar morphology and canopynitrogen as predictors of light-use efficiency in terrestrial vegetation. Agric.For. Meteorol. 115 (3–4), 163–171.
rime, J.P., 1988. Comparative Plant Ecology: A Functional Approach to CommonBritish Species. Unwin Hyman, London.
rime, J.P., 1979. Plant Strategies, Vegetation Processes, and Ecosystem Properties.Wiley.
uanter, L., Zhang, Y.G., Jung, M., Joiner, J., Voigt, M., Berry, J.A., Frankenberg, C.,Huete, A.R., Zarco-Tejada, P., Lee, J.E., Moran, M.S., Ponce-Campos, G., Beer, C.,Camps-Valls, G., Buchmann, N., Gianelle, D., Klumpp, K., Cescatti, A., Baker, J.M.,Griffis, T.J., 2014. Global and time-resolved monitoring of crop photosynthesiswith chlorophyll fluorescence. Proc. Nat. Acad. Sci. U. S. A. 111 (14),E1327–E1333.
an, W.X., Fang, J.Y., Guo, D.L., Zhang, Y., 2005. Leaf nitrogen and phosphorusstoichiometry across 753 terrestrial plant species in China. New Phytol. 168(2), 377–385.
enderson, E.B., Ohmann, J.L., Gregory, M.J., Roberts, H.M., Zald, H., 2014. Speciesdistribution modelling for plant communities: stacked single species ormultivariate modelling approaches? Appl. Veg. Sci. 17 (3), 516–527.
ernandez-Stefanoni, J.L., Ponce-Hernandez, R., 2006. Mapping the spatialvariability of plant diversity in a tropical forest: comparison of spatialinterpolation methods. Environ. Monit. Assess. 117 (1–3), 307–334.
ilker, T., Coops, N.C., Wulder, M.A., Black, T.A., Guy, R.D., 2008. The use of remotesensing in light use efficiency based models of gross primary production: areview of current status and future requirements. Sci. Total Environ. 404 (2–3),411–423.
omolová, L., Maenovsky, Z., Clevers, J.G.P.W., Garcia-Santos, G., Schaeprnan, M.E.,2013. Review of optical-based remote sensing for plant trait mapping. Ecol.Complexity 15, 1–16.
ooper, D.U., Chapin, F.S., Ewel, J.J., Hector, A., Inchausti, P., Lavorel, S., Lawton, J.H.,Lodge, D.M., Loreau, M., Naeem, S., Schmid, B., Setala, H., Symstad, A.J.,Vandermeer, J., Wardle, D.A., 2005. Effects of biodiversity on ecosystemfunctioning: a consensus of current knowledge. Ecol. Monogr. 75 (1), 3–35.
ouborg, R., Boegh, E., 2008. Mapping leaf chlorophyll and leaf area index usinginverse and forward canopy reflectance modeling and SPOT reflectance data.Remote Sens. Environ. 112 (1), 186–202.
ouborg, R., Cescatti, A., Migliavacca, M., Kustas, W.P., 2013. Satellite retrievals ofleaf chlorophyll and photosynthetic capacity for improved modeling of GPP.Agric. For. Meteorol. 177, 10–23.
unt, E.R., Doraiswamy, P.C., McMurtrey, J.E., Daughtry, C.S.T., Perry, E.M.,Akhmedov, B., 2013. A visible band index for remote sensing leaf chlorophyllcontent at the canopy scale. Int. J. Appl. Earth Obs. Geoinf. 21, 103–112.
acquemoud, S., Baret, F., 1990. Prospect – a model of leaf optical-propertiesspectra. Remote Sens. Environ. 34 (2), 75–91.
acquemoud, S., Verhoef, W., Baret, F., Bacour, C., Zarco-Tejada, P.J., Asner, G.P.,Francois, C., Ustin, S.L., 2009. PROSPECT plus SAIL models: a review of use forvegetation characterization. Remote Sens. Environ. 11 (3), S56–S66.
ägermeyr, J., Gerten, D., Lucht, W., Hostert, P., Migliavacca, M., Nemani, R., 2014. Ahigh-resolution approach to estimating ecosystem respiration at continentalscales using operational satellite data. Global Change Biol. 20 (4), 1191–1210.
ones, H. G., (2014). Plants and Microclimate A Quantitative Approach toEnvironmental Plant Physiology Third Edition PREFACE. Plants andMicroclimate: A Quantitative Approach to Environmental Plant Physiology, 3rdEdition.
ones, H.G., Stoll, M., Santos, T., de Sousa, C., Chaves, M.M., Grant, O.M., 2002. Use ofinfrared thermography for monitoring stomatal closure in the field:application to grapevine. J. Exp. Bot. 53 (378), 2249–2260.
ung, M., Reichstein, M., Margolis, H.A., Cescatti, A., Richardson, A.D., Arain, M.A.,Arneth, A., Bernhofer, C., Bonal, D., Chen, J.Q., Gianelle, D., Gobron, N., Kiely, G.,Kutsch, W., Lasslop, G., Law, B.E., Lindroth, A., Merbold, L., Montagnani, L.,Moors, E.J., Papale, D., Sottocornola, M., Vaccari, F., Williams, C., 2011. Globalpatterns of land-atmosphere fluxes of carbon dioxide, latent heat, and sensibleheat derived from eddy covariance, satellite, and meteorological observations.J. Geophys. Res. Biogeosci. 116.
aartinen, H., Hyyppa, J., Yu, X.W., Vastaranta, M., Hyyppa, H., Kukko, A.,Holopainen, M., Heipke, C., Hirschmugl, M., Morsdorf, F., Naesset, E., Pitkanen,J., Popescu, S., Solberg, S., Wolf, B.M., Wu, J.C., 2012. An internationalcomparison of individual tree detection and extraction using airborne laserscanning. Remote Sens. 4 (4), 950–974.
attge, J.S., Diaz, S., Lavorel, C., Prentice, P., Leadley, G., Bonisch, E., Garnier, M.,Westoby, P.B., Reich, I.J., Wright, J.H.C., Cornelissen, C., Violle, S.P., Harrison,P.M., van Bodegom, M., Reichstein, B.J., Enquist, N.A., Soudzilovskaia, D.D.,Ackerly, M., Anand, O., Atkin, M., Bahn, T.R., Baker, D., Baldocchi, R., Bekker,C.C., Blanco, B., Blonder, W.J., Bond, R., Bradstock, D.E., Bunker, F., Casanoves, J.,Cavender-Bares, J.Q., Chambers, F.S., Chapin, J., Chave, D., Coomes, W.K.,Cornwell, J.M., Craine, B.H., Dobrin, L., Duarte, W., Durka, J., Elser, G., Esser, M.,Estiarte, W.F., Fagan, J., Fang, F., Fernandez-Mendez, A., Fidelis, B., Finegan, O.,Flores, H., Ford, D., Frank, G.T., Freschet, N.M., Fyllas, R.V., Gallagher, W.A.,Green, A.G., Gutierrez, T., Hickler, S.I., Higgins, J.G., Hodgson, A., Jalili, S., Jansen,C.A., Joly, A.J., Kerkhoff, D., Kirkup, K., Kitajima, M., Kleyer, S., Klotz, J.M.H.,Knops, K., Kramer, I., Kuhn, H., Kurokawa, D., Laughlin, T.D., Lee, M., Leishman,
Please cite this article in press as: Musavi, T., et al., The imprint of planEarth Observ. Geoinf. (2015), http://dx.doi.org/10.1016/j.jag.2015.05.0
F., Lens, T., Lenz, S.L., Lewis, J., Lloyd, J., Llusia, F., Louault, S., Ma, M.D., Mahecha,P., Manning, T., Massad, B.E., Medlyn, J., Messier, A.T., Moles, S.C., Muller, K.,Nadrowski, S., Naeem, U., Niinemets, S., Nollert, A., Nuske, R., Ogaya, J.,Oleksyn, V.G., Onipchenko, Y., Onoda, J., Ordonez, G., Overbeck, W.A., Ozinga,
PRESSservation and Geoinformation xxx (2015) xxx–xxx 11
S., et al., 2011. TRY – a global database of plant traits. Global Change Biol. 17(9), 2905–2935.
Kattge, J., Knorr, W., Raddatz, T., Wirth, C., 2009. Quantifying photosyntheticcapacity and its relationship to leaf nitrogen content for global-scale terrestrialbiosphere models. Global Change Biol. 15 (4), 976–991.
Kazakou, E., Vile, D., Shipley, B., Gallet, C., Garnier, E., 2006. Co-variations in litterdecomposition, leaf traits and plant growth in species from a Mediterraneanold-field succession. Funct. Ecol. 20 (1), 21–30.
Kazakou, E., Violle, C., Roumet, C., Navas, M.-L., Vile, D., Kattge, J., Garnier, E., 2014.Are trait-based species rankings consistent across data sets and spatial scales?J. Veg. Sci. 25 (1), 235–247.
Kergoat, L., Lafont, S., Arneth, A., Le Dantec, V., Saugier, B., 2008. Nitrogen controlsplant canopy light-use efficiency in temperate and boreal ecosystems. J.Geophys. Res. Biogeosci. 113 (G4).
Kerkhoff, A.J., Enquist, B.J., 2006. Ecosystem allometry: the scaling of nutrientstocks and primary productivity across plant communities. Ecol. Lett. 9 (4),419–427.
Kerkhoff, A.J., Fagan, W.F., Elser, J.J., Enquist, B.J., 2006. Phylogenetic and growthform variation in the scaling of nitrogen and phosphorus in the seed plants.Am. Nat. 168 (4), E103–E122.
Knyazikhin, Y., Schull, M.A., Stenberg, P., Mottus, M., Rautiainen, M., Yang, Y.,Marshak, A., Carmona, P.L., Kaufmann, R.K., Lewis, P., Disney, M.I., Vanderbilt,V., Davis, A.B., Baret, F., Jacquemoud, S., Lyapustin, A., Myneni, R.B., 2012.Hyperspectral remote sensing of foliar nitrogen content. Proc. Nat. Acad. Sci. U.S. A. 110 (3), E185–E192.
Kokaly, R.F., Asner, G.P., Ollinger, S.V., Martin, M.E., Wessman, C.A., 2009.Characterizing canopy biochemistry from imaging spectroscopy and itsapplication to ecosystem studies. Remote Sens. Environ. 113, S78–S91.
Laughlin, D.C., Leppert, J.J., Moore, M., Sieg, C.H., 2010. A multi-trait test of theleaf-height-seed plant strategy scheme with 133 species from a pine forestflora. Funct. Ecol. 24 (3), 493–501.
Lavorel, S., Garnier, E., 2002. Predicting changes in community composition andecosystem functioning from plant traits: revisiting the Holy Grail. Funct. Ecol.16 (5), 545–556.
le Maire, G., Francois, C., Soudani, K., Berveiller, D., Pontailler, J.Y., Breda, N., Genet,H., Davi, H., Dufrene, E., 2008. Calibration and validation of hyperspectralindices for the estimation of broadleaved forest leaf chlorophyll content, leafmass per area, leaf area index and leaf canopy biomass. Remote Sens. Environ.112 (10), 3846–3864.
Lloyd, J., Taylor, J.A., 1994. On the temperature-dependence of soil respiration.Funct. Ecol. 8 (3), 315–323.
Louault, F., Pillar, V.D., Aufrere, J., Garnier, E., Soussana, J.F., 2005. Plant traits andfunctional types in response to reduced disturbance in a semi-naturalgrassland. J. Veg. Sci. 16 (2), 151–160.
Loveys, B.R., Atkinson, L.J., Sherlock, D.J., Roberts, R.L., Fitter, A.H., Atkin, O.K., 2003.Thermal acclimation of leaf and root respiration: an investigation comparinginherently fast- and slow-growing plant species. Global Change Biol. 9 (6),895–910.
Luo, Y.W., Doney, S.C., Anderson, L.A., Benavides, M., Berman-Frank, I., Bode, A.,Bonnet, S., Boström, K.H., Böttjer, D., Capone, D.G., Carpenter, E.J., Chen, Y.L.,Church, M.J., Dore, J.E., Falcón, L.I., Fernández, A., Foster, R.A., Furuya, K., Gómez,F., Gundersen, K., Hynes, A.M., Karl, D.M., Kitajima, S., Langlois, R.J., LaRoche, J.,Letelier, R.M., Maranón, E., McGillicuddy Jr, D.J., Moisander, P.H., Moore, C.M.,Mourino-Carballido, B., Mulholland, M.R., Needoba, J.A., Orcutt, K.M., Poulton,A.J., Rahav, E., Raimbault, P., Rees, A.P., Riemann, L., Shiozaki, T., Subramaniam,A., Tyrrell, T., Turk-Kubo, K.A., Varela, M., Villareal, T.A., Webb, E.A., White, A.E.,Wu, J., Zehr, J.P., 2012. Database of diazotrophs in global ocean: abundance,biomass and nitrogen fixation rates. Earth Syst. Sci. Data 4 (1), 47–73.
Luyssaert, S., Reichstein, M., Schulze, E.D., Janssens, I.A., Law, B.E., Papale, D.,Dragoni, D., Goulden, M.L., Granier, A., Kutsch, W.L., Linder, S., Matteucci, G.,Moors, E., Munger, J.W., Pilegaard, K., Saunders, M., Falge, E.M., 2009. Toward aconsistency cross-check of eddy covariance flux-based and biometricestimates of ecosystem carbon balance. Global Biogeochem. Cycles, 23.
Ma, S.Y., Baldocchi, D.D., Mambelli, S., Dawson, T.E., 2010. Are temporal variationsof leaf traits responsible for seasonal and inter-annual variability in ecosystemCO2 exchange? Funct. Ecol. 25 (1), 258–270.
Mahecha, M.D., Reichstein, M., Carvalhais, N., Lasslop, G., Lange, H., Seneviratne, S.I.,Vargas, R., Ammann, C., Arain, M.A., Cescatti, A., Janssens, I.A., Migliavacca, M.,Montagnani, L., Richardson, A.D., 2010. Global convergence in the temperaturesensitivity of respiration at ecosystem level. Science 329 (5993), 838–840.
Mahecha, M.D., Reichstein, M., Lange, H., Carvalhais, N., Bernhofer, C., Grunwald, T.,Papale, D., Seufert, G., 2007. Characterizing ecosystem-atmosphere interactionsfrom short to interannual time scales. Biogeosciences 4 (5), 743–758.
Malenovsky, Z., Homolova, L., Zurita-Milla, R., Lukes, P., Kaplan, V., Hanus, J.,Gastellu-Etchegorry, J.P., Schaepman, M.E., 2013. Retrieval of spruce leafchlorophyll content from airborne image data using continuum removal andradiative transfer. Remote Sens. Environ. 131, 85–102.
Malenovsky, Z., Bartholomeus, H.M., Acerbi-Junior, F.W., Schopfer, J.T., Painter,T.H., Epema, G.F., Bregt, A.K., 2007. Scaling dimensions in spectroscopy of soiland vegetation. Int. J. Appl. Earth Obs. Geoinf. 9 (2), 137–164.
Martin, M.E., Plourde, L.C., Ollinger, S.V., Smith, M.L., McNeil, B.E., 2008. A
ts on ecosystem functioning: A data-driven approach. Int. J. Appl.09
generalizable method for remote sensing of canopy nitrogen across a widerange of forest ecosystems. Remote Sens. Environ. 112 (9), 3511–3519.
Medlyn, B.E., Badeck, F.W., De Pury, D.G.G., Barton, C.V.M., Broadmeadow, M.,Ceulemans, R., De Angelis, P., Forstreuter, M., Jach, M.E., Kellomaki, S., Laitat, E.,Marek, M., Philippot, S., Rey, A., Strassemeyer, J., Laitinen, K., Liozon, R., Portier,
ING ModelJ
1 rth Ob
M
M
M
M
M
M
N
N
N
O
O
O
O
O
P
P
P
P
P
P
Q
R
R
R
R
ARTICLEAG-1106; No. of Pages 13
2 T. Musavi et al. / International Journal of Applied Ea
B., Roberntz, P., Wang, K., Jarvis, P.G., 1999. Effects of elevated [CO2] onphotosynthesis in European forest species: a meta-analysis of modelparameters. Plant Cell Environ. 22 (12), 1475–1495.
eroni, M., Colombo, R., Panigada, C., 2004. Inversion of a radiative transfer modelwith hyperspectral observations for LAI mapping in poplar plantations.Remote Sens. Environ. 92 (2), 195–206.
eroni, M., Rossini, M., Guanter, L., Alonso, L., Rascher, U., Colombo, R., Moreno, J.,2009. Remote sensing of solar-induced chlorophyll fluorescence: review ofmethods and applications. Remote Sens. Environ. 113 (10), 2037–2051.
eziane, D., Shipley, B., 1999. Interacting determinants of specific leaf area in 22herbaceous species: effects of irradiance and nutrient availability. Plant CellEnviron. 22 (5), 447–459.
onteith, J.L., 1972. Solar-radiation and productivity in tropical ecosystems. J.Appl. Ecol. 9 (3), 747–766.
ott, K.A., Parkhurst, D.F., 1991. Stomatal responses to humidity in air and helox.Plant Cell Environ. 14 (5), 509–515.
utangao, O., Kumar, L., 2007. Estimating and mapping grass phosphorusconcentration in an African savanna using hyperspectral image data. Int. J.Remote Sens. 28 (21), 4897–4911.
eher, D.A., 1999. Soil community composition and ecosystem processes –comparing agricultural ecosystems with natural ecosystems. Agrofor. Syst. 45(1–3), 159–185.
iinemets, U., 2001. Global-scale climatic controls of leaf dry mass per area,density, and thickness in trees and shrubs. Ecology 82 (2), 453–469.
iinemets, U., Keenan, T.F., Hallik, L., 2015. A worldwide analysis of within-canopyvariations in leaf structural, chemical and physiological traits across plantfunctional types. New Phytol. 205 (3), 973–993.
gaya, R., Penuelas, J., 2003. Comparative field study of Quercus ilex and Phillyrealatifolia: photosynthetic response to experimental drought conditions.Environ. Exp. Bot. 50 (2), 137–148.
gle, K., Barber, J.J., Barron-Gafford, G.A., Bentley, L.P., Young, J.M., Huxman, T.E.,Loik, M.E., Tissue, D.T., 2015. Quantifying ecological memory in plant andecosystem processes. Ecol. Lett. 18 (3), 221–235.
llinger, S.V., Richardson, A.D., Martin, M.E., Hollinger, D.Y., Frolking, S.E., Reich,P.B., Plourde, L.C., Katul, G.G., Munger, J.W., Oren, R., Smithb, M.L., Bolstad,K.T.P.U.P.V., Cook, B.D., Day Martin, M.C.T.A., Monson, R.K., Schmid, H.P., 2008.Canopy nitrogen, carbon assimilation, and albedo in temperate and borealforests: functional relations and potential climate feedbacks. Proc. Nat. Acad.Sci. U. S. A. 105 (49), 19336–19341.
rdonez, J.C., van Bodegom, P.M., Witte, J.P.M., Bartholomeus, R.P., van Hal, J.R.,Aerts, R., 2010. Plant strategies in relation to resource supply in mesic to wetenvironments: does theory mirror nature? Am. Natur. 175, 225–239.
rdonez, J.C., van Bodegom, P.M., Witte, J.P.M., Wright, I.J., Reich, P.B., Aerts, R.,2009. A global study of relationships between leaf traits, climate and soilmeasures of nutrient fertility. Glob. Ecol. Biogeogr. 18 (2), 137–149.
avlick, R., Drewry, D.T., Bohn, K., Reu, B., Kleidon, A., 2013. The jenadiversity-dynamic global vegetation model (JeDi-DGVM): a diverse approachto representing terrestrial biogeography and biogeochemistry based on plantfunctional trade-offs. Biogeosciences 10 (6), 4137–4177.
erez-Harguindeguy, N., Diaz, S., Garnier, E., Lavorel, S., Poorter, H., Jaureguiberry,P., Bret-Harte, M.S., Cornwell, W.K., Craine, J.M., Gurvich, D.E., Urcelay, C.,Veneklaas, E.J., Reich, P.B., Poorter, L., Wright, I.J., Ray. Enrico, P.L., Pausas, J.G.,de Vos, A.C., Buchmann, N., Funes, G., Quetier, F., Hodgson, J.G., Thompson, K.,Morgan, H.D., ter Steege, H., van der Heijden, M.G.A., Sack, L., Blonder, B.,Poschlod, P., Vaieretti, M.V., Conti, G., Staver, A.C., Aquino, S., Cornelissen, J.H.C.,2013. New handbook for standardised measurement of plant functional traitsworldwide. Aust. J. Bot. 61 (3), 167–234.
ierce, L.L., Running, S.W., Walker, J., 1994. Regional-scale relationships ofleaf-area index to specific leaf-area and leaf nitrogen-content. Ecol. Appl. 4 (2),313–321.
inty, B., Andredakis, I., Clerici, M., Kaminski, T., Taberner, M., Verstraete, M.M.,Gobron, N., Plummer, S., Widlowski, J.L., 2011. Exploiting the MODIS albedoswith the Two-stream Inversion Package (JRC-TIP): 1. Effective leaf area index,vegetation, and soil properties. J. Geophys. Res. Atmos., 116.
orcar-Castell, A., Tyystjarvi, E., Atherton, J., van der Tol, C., Flexas, J., Pfundel, E.E.,Moreno, J., Frankenberg, C., Berry, J.A., 2014. Linking chlorophyll a fluorescenceto photosynthesis for remote sensing applications: mechanisms andchallenges. J. Exp. Bot. 65 (15), 4065–4095.
reston, K.A., Cornwell, W.K., DeNoyer, J.L., 2006. Wood density and vessel traits asdistinct correlates of ecological strategy in 51 California coast rangeangiosperms. New Phytol. 170 (4), 807–818.
uested, H.M., Cornelissen, J.H.C., Press, M.C., Callaghan, T.V., Aerts, R., Trosien, F.,Riemann, P., Gwynn-Jones, D., Kondratchuk, A., Jonasson, S.E., 2003.Decomposition of sub-arctic plants with differing nitrogen economies: afunctional role for hemiparasites. Ecology 84 (12), 3209–3221.
amoelo, A., Skidmore, A.K., Cho, M.A., Mathieu, R., Heitkonig, I.M.A.,Dudeni-Tlhone, N., Schlerf, M., Prins, H.H.T., 2013. Non-linear partial leastsquare regression increases the estimation accuracy of grass nitrogen andphosphorus using in situ hyperspectral and environmental data. Isprs J.Photogram. Remote Sens. 82, 27–40.
eich, P.B., Rich, R.L., Lu, X.J., Wang, Y.P., Oleksyn, J., 2014. Biogeographic variation
Please cite this article in press as: Musavi, T., et al., The imprint of planEarth Observ. Geoinf. (2015), http://dx.doi.org/10.1016/j.jag.2015.05.0
in evergreen conifer needle longevity and impacts on boreal forest carboncycle projections. Proc. Nat. Acad. Sci. U. S. A. 111 (38), 13703–13708.
eich, P.B., 2012. Key canopy traits drive forest productivity. Proc. Royal Soc.B-Biol. Sci. 279 (1736), 2128–2134.
eich, P.B., 2010. The Carbon Dioxide Exchange. Science 329 (5993), 774–775.
PRESSservation and Geoinformation xxx (2015) xxx–xxx
Reich, P.B., Oleksyn, J., Wright, I.J., 2009. Leaf phosphorus influences thephotosynthesis–nitrogen relation: a cross-biome analysis of 314 species.Oecologia 160 (2), 207–212.
Reich, P.B., Tjoelker, M.G., Pregitzer, K.S., Wright, I.J., Oleksyn, J., Machado, J.L.,2008. Scaling of respiration to nitrogen in leaves, stems and roots of higherland plants. Ecol. Lett. 11 (8), 793–801.
Reichstein, M., Bahn, M., Mahecha, M.D., Kattge, J., Baldocchi, D.D., 2014. Linkingplant and ecosystem functional biogeography. Proc. Nat. Acad. Sci. U. S. A. 111(38), 13697–13702.
Reichstein, M., Beer, C., 2008. Soil respiration across scales: the importance of amodel-data integration framework for data interpretation. J. Plant Nutr. SoilSci. 171 (3), 344–354.
Reichstein, M., Rey, A., Freibauer, A., Tenhunen, J., Valentini, R., Banza, J., Casals, P.,Cheng, Y.F., Grunzweig, J.M., Irvine, J., Joffre, R., Law, B.E., Loustau, D., Miglietta,F., Oechel, W., Ourcival, J.M., Pereira, J.S., Peressotti, A., Ponti, F., Qi, Y., Rambal,S., Rayment, M., Romanya, J., Rossi, F., Tedeschi, V., Tirone, G., Xu, M., Yakir, D.,2003. Modeling temporal and large-scale spatial variability of soil respirationfrom soil water availability, temperature and vegetation productivity indices.Global Biogeochem. Cycles 17 (4).
Reshef, D.N., Reshef, Y.A., Finucane, H.K., Grossman, S.R., McVean, G., Turnbaugh,P.J., Lander, E.S., Mitzenmacher, M., Sabeti, P.C., 2011. Detecting novelassociations in large data sets. Science 334 (6062), 1518–1524.
Reu, B., Zaehle, S., Proulx, R., Bohn, K., Kleidon, A., Pavlick, R., Schmidtlein, S., 2011.The role of plant functional trade-offs for biodiversity changes and biomeshifts under scenarios of global climatic change. Biogeosciences 8 (5),1255–1266.
Richardson, A.D., Hollinger, D.Y., Aber, J.D., Ollinger, S.V., Braswell, B.H., 2007.Environmental variation is directly responsible for short- but not long-termvariation in forest-atmosphere carbon exchange. Global Change Biol 13 (4),788–803.
Roelofsen, H.D., van Bodegom, P.M., Kooistra, L., Witte, J.P.M., 2014. Predicting leaftraits of herbaceous species from their spectral characteristics. Ecol. Evol. 4 (6),706–719.
Román, M.O., Schaaf, C.B., Woodcock, C.E., Strahler, A.H., Yang, X.Y., Braswell, R.H.,Curtis, P.S., Davis, K.J., Dragoni, D., Goulden, M.L., Gu, L.H., Hollinger, D.Y., Kolb,T.E., Meyers, T.P., Munger, J.W., Privette, J.L., Richardson, A.D., Wilson, T.B.,Wofsy, S.C., 2009. The MODIS (Collection V005) BRDF/albedo product:assessment of spatial representativeness over forested landscapes. RemoteSens. Environ. 113 (11), 2476–2498.
Ruimy, A., Jarvis, P.G., Baldocchi, D.D., Saugier, B., 1995. CO2 fluxes over plantcanopy and solar radiation: a review. Adv. Ecol. Res. 26.
Scheiter, S., Langan, L., Higgings, S.I., 2013. Next-generation dynamic globalvegetation models: learning from community ecology. New Phytol. 198 (3),957–969.
Schlesinger, W.H., 1997. Biogeochemistry. Geotimes 42 (2), 44.Shirke, P.A., Pathre, U.V., 2004. Influence of leaf-to-air vapour pressure deficit
(VPD) on the biochemistry and physiology of photosynthesis in Prosopisjuliflora. J. Exp. Bot. 55 (405), 2111–2120.
Shope, J.C., Peak, D., Mott, K.A., 2008. Stomatal responses to humidity in isolatedepidermes. Plant Cell Environ. 31 (9), 1290–1298.
Southwood, T.R.E., 1988. Tactics, strategies and templets. Oikos 52 (1), 3–18.Stoy, P.C., Richardson, A.D., Baldocchi, D.D., Katul, G.G., Stanovick, J., Mahecha,
M.D., Reichstein, M., Detto, M., Law, B.E., Wohlfahrt, G., Arriga, N., Campos, J.,McCaughey, J.H., Montagnani, L., Sevanto, K.T.P.U.S., Williams, M., 2009.Biosphere-atmosphere exchange of CO2 in relation to climate: a cross-biomeanalysis across multiple time scales. Biogeosciences 6 (10), 2297–2312.
Swenson, N.G., Enquist, B.J., Pither, J., Kerkhoff, A.J., Boyle, B., Weiser, M.D., Elser,J.J., Fagan, W.F., Forero-Montana, J., Fyllas, N., Kraft, N.J.B., Lake, J.K., Moles, A.T.,Patino, S., Phillips, O.L., Price, C.A., Reich, P.B., Quesada, C.A., Stegen, J.C.,Valencia, R., Wright, I.J., Wright, S.J., Andelman, S., Jorgensen, P.M., Lacher, T.E.,Monteagudo, A., Nunez-Vargas, M.P., Vasquez-Martinez, R., Nolting, K.M.,2012. The biogeography and filtering of woody plant functional diversity inNorth and South America. Global Ecol. Biogeogr. 21 (8),798–808.
Tsui, O.W., Coops, N.C., Wulder, M.A., Marshall, P.L., 2013. Integrating airborneLiDAR and space-borne radar via multivariate kriging to estimateabove-ground biomass. Remote Sens. Environ. 139, 340–352.
Urbanski, S., Barford, C., Wofsy, S., Kucharik, C., Pyle, E., Budney, J., McKain, K.,Fitzjarrald, D., Czikowsky, M., Munger, J.W., 2007. Factors controlling CO2exchange on timescales from hourly to decadal at Harvard Forest. J. Geophys.Res. Biogeosci. 112 (G2).
Ustin, S.L., 2013. Remote sensing of canopy chemistry. Proc. Nat. Acad. Sci. U. S. A.110 (3), 804–805.
Ustin, S.L., Gamon, J.A., 2010. Remote sensing of plant functional types. NewPhytol. 186 (4), 795–816.
Ustin, S.L., Roberts, D.A., Gamon, J.A., Asner, G.P., Green, R.O., 2004. Using imagingspectroscopy to study ecosystem processes and properties. Bioscience 54 (6),523–534.
van Bodegom, P.M., Douma, J.C., Verheijen, L.M., 2014. A fully traits-basedapproach to modeling global vegetation distribution. Proc. Nat. Acad. Sci. U. S.A. 111 (38), 13733–13738.
ts on ecosystem functioning: A data-driven approach. Int. J. Appl.09
van Bodegom, P.M., Douma, J.C., Witte, J.P.M., Ordonez, J.C., Bartholomeus, R.P.,Aerts, R., 2012. Going beyond limitations of plant functional types whenpredicting global ecosystem-atmosphere fluxes: exploring the merits oftraits-based approaches. Global Ecol. Biogeogr. 21 (6),625–636.
ING ModelJ
rth Ob
v
v
V
V
V
W
W
W
Sens. Environ. 89 (2), 189–199.Zhang, Y.G., Guanter, L., Berry, J.A., Joiner, J., van der Tol, C., Huete, A., Gitelson, A.,
Voigt, M., Kohler, P., 2014. Estimation of vegetation photosynthetic capacityfrom space-based measurements of chlorophyll fluorescence for terrestrial
ARTICLEAG-1106; No. of Pages 13
T. Musavi et al. / International Journal of Applied Ea
an der Tol, C., Verhoef, W., Timmermans, J., Verhoef, A., Su, Z., 2009. An integratedmodel of soil-canopy spectral radiances, photosynthesis, fluorescence,temperature and energy balance. Biogeosciences 6 (12), 3109–3129.
an Ommen Kloeke, A.E.E., Douma, J.C., Ordonez, J.C., Reich, P.B., van Bodegom,P.M., 2012. Global quantification of contrasting leaf life span strategies fordeciduous and evergreen species in response to environmental conditions.Global Ecol. Biogeogr. 21 (2), 224–235.
erheijen, L.M., Brovkin, V., Aerts, R., Bonisch, G., Cornelissen, J.H.C., Kattge, J.,Reich, P.B., Wright, I.J., van Bodegom, P.M., 2013. Impacts of trait variationthrough observed trait-climate relationships on performance of an Earth ATmodel: a conceptual analysis. Biogeosciences 10 (8),5497–5515.
iolle, C., Enquist, B.J., McGill, B.J., Jiang, L., Albert, C.H., Hulshof, C., Jung, V.,Messier, J., 2012. The return of the variance: intraspecific variability incommunity ecology. Trends Ecol. Evol. 27 (4), 244–252.
iolle, C., Navas, M.L., Vile, D., Kazakou, E., Fortunel, C., Hummel, I., Garnier, E.,2007. Let the concept of trait be functional! Oikos 116 (5), 882–892.
all, D.H., Moore, J.C., 1999. Interactions underground – soil biodiversity,mutualism, and ecosystem processes. Bioscience 49 (2), 109–117.
ang, Y.P., Lu, X.J., Wright, I.J., Dai, Y.J., Rayner, P.J., Reich, P.B., 2012. Correlations
Please cite this article in press as: Musavi, T., et al., The imprint of planEarth Observ. Geoinf. (2015), http://dx.doi.org/10.1016/j.jag.2015.05.0
among leaf traits provide a significant constraint on the estimate of globalgross primary production. Geophys. Res. Lett., 39.
ardley, N.W., Curran, P.J., 1984. The estimation of green-leaf-area index fromremotely sensed airborne multispectral scanner data. Int. J. Remote Sens. 5 (4),671–679.
PRESSservation and Geoinformation xxx (2015) xxx–xxx 13
White, A., Cannell, M.G.R., Friend, A.D., 2000. The high-latitude terrestrial carbonsink: a model analysis. Global Change Biol. 6 (2), 227–245.
Willis, C.G., Halina, M., Lehman, C., Reich, P.B., Keen, A., McCarthy, S.,Cavender-Bares, J., 2010. Phylogenetic community structure in Minnesota oaksavanna is influenced by spatial extent and AT variation. Ecography 33 (3),565–577.
Wright, I.J., Reich, P.B., Westoby, M., Ackerly, D.D., Baruch, Z., Bongers, F.,Cavender-Bares, J., Chapin, T., Cornelissen, J.H.C., Diemer, M., Flexas, J., Garnier,E., Groom, P.K., Gulias, J., Hikosaka, K., Lamont, B.B., Lee, T., Lee, W., Lusk, C.,Midgley, J.J., Navas, M.L., Niinemets, U., Oleksyn, J., Osada, N., Poorter, H., Poot,P., Prior, L., Pyankov, V.I., Roumet, C., Thomas, S.C., Tjoelker, M.G., Veneklaas,E.J., Villar, R., 2004. The worldwide leaf economics spectrum. Nature 428(6985), 821–827.
Zarco-Tejada, P.J., Miller, J.R., Harron, J., Hu, B.X., Noland, T.L., Goel, N., Mohammed,G.H., Sampson, P., 2004. Needle chlorophyll content estimation through modelinversion using hyperspectral data from boreal conifer forest canopies. Remote
ts on ecosystem functioning: A data-driven approach. Int. J. Appl.09
biosphere models. Global Change Biol. 20 (12), 3727–3742.