Embed Size (px)
Citation preview
Atmos. Meas. Tech., 14, 2285–2298, 2021https://doi.org/10.5194/amt-14-2285-2021© Author(s) 2021. This work is distributed underthe Creative Commons Attribution 4.0 License.
The improved comparative reactivity method (ICRM):measurements of OH reactivity under high-NOx
conditions in ambient airWenjie Wang1,3,�, Jipeng Qi1,2,�, Jun Zhou1,2, Bin Yuan1,2, Yuwen Peng1,2, Sihang Wang1,2, Suxia Yang1,2,Jonathan Williams4, Vinayak Sinha5, and Min Shao1,2
1Institute for Environmental and Climate Research, Jinan University, Guangzhou 511443, China2Guangdong–Hong Kong–Macau Joint Laboratory of Collaborative Innovation for EnvironmentalQuality, Guangzhou 511443, China3Multiphase Chemistry Department, Max Planck Institute for Chemistry, 55128 Mainz, Germany4Atmospheric Chemistry Department, Max Planck Institute for Chemistry, 55128 Mainz, Germany5Department of Earth and Environmental Sciences, Indian Institute of Science Education andResearch (IISER), Mohali 140306, India�These authors contributed equally to this work.
Correspondence: Bin Yuan ([email protected])
Received: 1 November 2020 – Discussion started: 6 November 2020Revised: 23 January 2021 – Accepted: 9 February 2021 – Published: 24 March 2021
Abstract. The comparative reactivity method (CRM) wasdeveloped more than a decade to measure OH reactivity(i.e., OH loss frequency) in both laboratory and field stud-ies. However, accurate OH reactivity quantification remainschallenging under real ambient conditions, especially for OHreactivity measurements in high-NOx (e.g., > 10 ppbv) envi-ronments, as ambient NO enhances the regeneration of OHradicals in the CRM reactor. To solve this problem, we designa new and improved CRM reactor (ICRM) and add NO intothe system continuously so that the HO2 radical concentra-tion is suppressed. We confirmed the appropriate level of NOby determining the maximum decrease in the pyrrole levelcaused by regenerated OH radicals from NO+HO2. RO2radicals induced by volatile organic compounds (VOCs) inthe ICRM reactor were also found to react with NO, whichled to the regeneration of OH radicals and thus the under-estimation of OH reactivity. This effect was quantified bythe calibration of representative VOC species at different NOlevels, and the correction coefficients obtained were used tocorrect the measured OH reactivity. All these efforts resultedin reducing the uncertainty of the NO-artifact correction byat least an order of magnitude compared to the original CRMsystem. Additionally, these technological improvements alsoconsiderably reduced the systematic errors from pyrrole pho-
tolysis in the original system. A new operation mode wasproposed for the ICRM, which is able to avoid the interfer-ence resulting from OH radicals produced by photolysis ofresidual humidity and save time for ambient measurement.The ICRM system was employed in a field campaign to mea-sure OH reactivity and performed well with ambient NO lev-els ranging from 0 to 50 ppbv, which are typically observedin the urban and suburban atmosphere.
1 Introduction
The hydroxyl radical (OH) is the most important oxidant inthe daytime troposphere. It initiates the chemically removalof primary gaseous pollutants and in turn produces a host ofsecondary pollutants (Hofzumahaus, 1991; Atkinson, 2000;Atkinson and Arey, 2003). OH reactivity is defined as thesum of all OH reactive trace gas concentrations multiplied bytheir respective reaction rate coefficients with OH, as shownin Eq. (1). OH reactivity is a fundamental property of the at-mosphere in that it defines the overall loss frequency of OHradicals and hence the lifetime of OH. As such, it is a use-ful atmospheric parameter for evaluating the level of reactive
Published by Copernicus Publications on behalf of the European Geosciences Union.

2286 W. Wang et al.: The improved comparative reactivity method (ICRM)
pollutants, and it is closely related to atmospheric oxidationcapacity and the formation of secondary pollutants, includ-ing ozone and secondary aerosols (Sinha et al., 2012; Yanget al., 2016; Pfannerstill et al., 2019).
ROH = kCO [CO]+ kNO [NO]+ kNO2 [NO2]
+ kSO2 [SO2]+ kO3 [O3]+n∑i
kVOCi [VOCi] (1)
Equation (1) defines OH reactivity, where ROH is the to-tal OH reactivity, and kCO, kNO, kNO2 , kSO2 , kO3 , and kVOCirepresent the reaction rate coefficients between OH radicalsand CO, NO, NO2, SO2, O3, and volatile organic compound(VOC) species i, respectively. [CO], [NO], [NO2], [SO2],[O3], and [VOCi] are the concentrations of CO, NO, NO2,SO2, O3, and VOC species i, respectively.
Currently, two general methods are used to measureOH reactivity: (1) direct measurements of OH decay ratesby using a laser-induced fluorescence (LIF) technique and(2) measuring the relative change in a reference substancewith and without ambient air present by using the compar-ative reactivity method (CRM). LIF-based technology hasbeen used to measure OH reactivity in a variety of differ-ent environments and has provided many new insights intothe budget of OH reactivity (Kovacs and Brune, 2001, 2003;Sadanaga et al., 2004, 2005; Ingham et al., 2009; Lou et al.,2010). However, the cost, complexity, and large size of LIFsystems are deterrents to widespread deployment for fieldmeasurements (Sinha et al., 2008). Such detector systemsneed to be built and cannot be bought directly from a sup-plier. The CRM measures the OH decay rate indirectly byusing the relative reaction rate of a reference substance (pyr-role) with self-generated OH radicals in the presence and ab-sence of ambient air. The reference substance can be mea-sured by an online instrument, such as a proton transfer reac-tion mass spectrometer (PTR-MS) (Sinha et al., 2008, 2009;Kumar and Sinha, 2014) or a gas chromatograph (Nolscheret al., 2012a; Praplan et al., 2017a, 2019). The CRM tech-nique has proven to be a useful supplementary techniqueto measure the total OH reactivity in ambient air, with amore economical and portable setup than LIF-based systems.Based on an intercomparison between various OH reactiv-ity techniques in the SAPHIR chamber, LIF-type instrumentsare generally more sensitive and less noisy than CRM instru-ments (Fuchs et al., 2017).
The CRM has been applied to numerous field campaignsin recent years to measure OH reactivity (Dolgorouky et al.,2012; Nölscher et al., 2014; Michoud et al., 2015; Kim et al.,2016; Zannoni et al., 2016, 2017; Praplan et al., 2017b, 2019;Yang et al., 2017; Kumar et al., 2018; Pfannerstill et al.,2018, 2019). However, this method is not suitable for envi-ronments with high levels of NOx due to the pen-ray mer-cury lamp used to generate OH radicals in the CRM system.It also generates approximately equivalent amounts of HO2radicals that may react with sampled NO to produce addi-
tional OH radicals (Sinha et al., 2008; Yang et al., 2017),which cause an enhanced consumption of pyrrole in theCRM system and result in an underestimation of OH reac-tivity in sampled ambient air when NO exceeds certain lev-els (Sinha et al., 2008). This NO interference prevents theCRM from providing high-quality data in emission exhaustand urban areas with high NO levels. As a result, applica-tions of the CRM have been generally restricted to high-reactivity, low-NOx environments, including forests (Sinhaet al., 2010; Kim et al., 2011; Nolscher et al., 2012b; Pra-plan et al., 2019; Pfannerstill et al., 2020), moderately pol-luted cities (NO< 10 ppb) (Sinha et al., 2008; Praplan et al.,2017b), pristine marine environments (Sinha et al., 2012;Zannoni et al., 2015), emission sources (e.g., gasoline evap-oration) (Wu et al., 2015), branch cuvette studies (Nölscheret al., 2013), and chamber studies (Nölscher et al., 2014) withlittle or no NOx present. One solution to this issue is to de-liberately remove NO before the sampled air is introducedinto the reactor. However, the present technology is not ableto remove NO selectively without affecting other reactivespecies (i.e., VOCs). The effect of NO on measured OH re-activity can be quantified by NO-correction experiments, andthe resulting correction curve can be applied to adjust am-bient measurements according to simultaneously measuredNO levels (Hansen et al., 2015; Yang et al., 2017). However,the uncertainty of measured OH reactivity due to NO cor-rection increases with the NO concentration (Hansen et al.,2015; Michoud et al., 2015). Hansen et al. (2015) reportedthat the total uncertainty increases by up to a factor of 3 atNOx mixing ratios higher than 40 ppbv. Therefore, this callsfor an improvement of the traditional CRM reactor for accu-rately quantifying OH reactivity in high-NOx conditions. Inaddition to the NO effect, photolysis of pyrrole and VOCs aswell as the humidity difference between zero air and ambientair also influence measured OH reactivity (Sinha et al., 2008;Hansen et al., 2015; Zannoni et al., 2015).
The main purpose of this study is to improve the origi-nal CRM system to make it suitable for use in high-NOxconditions. We modified the structure of the original CRMglass reactor and added a certain amount of NO into the sys-tem to remove the generated but unwanted HO2 radicals. Wefurther characterized the improved CRM (ICRM) system byquantitatively evaluating the effect of the reaction of sam-ple VOC-induced RO2 with NO on measured OH reactivity.Additionally, the interference of pyrrole photolysis was alsosystematically evaluated. Finally, the ICRM system was de-ployed to measure OH reactivity under high-NOx conditions(0–50 ppbv) during a field campaign in the Pearl River Deltaregion of China.
Atmos. Meas. Tech., 14, 2285–2298, 2021 https://doi.org/10.5194/amt-14-2285-2021
W. Wang et al.: The improved comparative reactivity method (ICRM) 2287
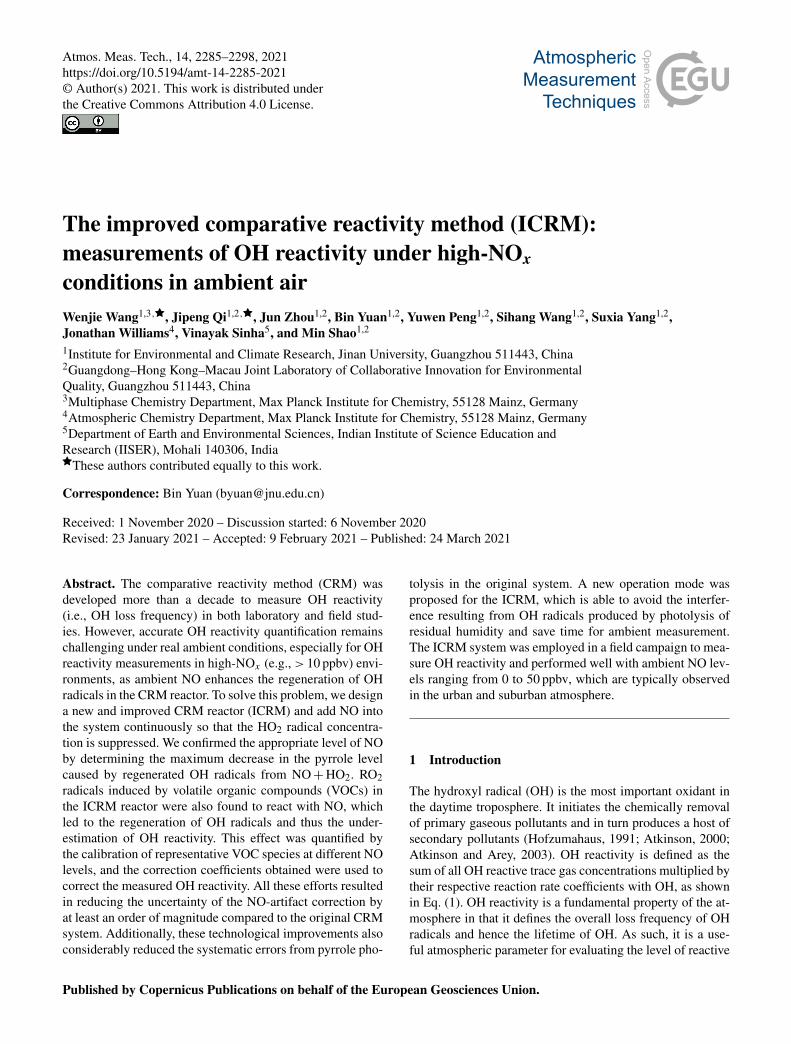
Figure 1. Schematic and work mode of the original CRM (Sinha et al., 2008, a, b) and the ICRM (this study, c, d).
2 Experimental methodology
2.1 The original CRM reactor
The schematic of the original CRM reactor is shown inFig. 1a. Gas-phase pyrrole mixed with zero air or ambient airis introduced through arm C at a constant flow. Arm A con-sists of a pen-ray spectral mercury lamp (Analytik Jean; 90-0012-01), over which nitrogen (humidified or dry) is passedthrough arm B at a constant flow rate. When humidified ni-trogen is flowing and the mercury lamp is turned on, H2O isphotolyzed into OH and H radicals by the mercury lamp at254 nm. The total airflow in the reactor exits through arm F,and the concentration of pyrrole is monitored with a PTR-MS. A detailed description of the original CRM has beenreported by Sinha et al. (2008).
Figure 1b shows the four work modes of the original CRM(Sinha et al., 2009). In C0 mode, the mercury lamp is turnedoff and high-purity dry nitrogen is introduced into the reac-tor through arm B. Pyrrole is introduced into the reactor withdry zero air through arm C. In C1 mode, the mercury lampis turned on while everything else remains the same as C0.The pyrrole concentration decreases during C1 mode due toits photolysis reaction. In C2 mode, nitrogen flow in C1 ischanged to humidified nitrogen to generate OH radicals, andthe pyrrole concentration decreases to C2. In the final step,ambient air is introduced to the reactor through arm C in C3mode. Based on pseudo-first-order assumptions (i.e., [pyr-role]≥ [OH]), total OH reactivity (ROH) is calculated as in
Eq. (2):
ROH = C1 · kpyr+OH ·C3−C2C1−C3
, (2)
where kpyr+OH is the rate coefficient for the reaction of pyr-role with OH radicals (1.28× 10⁻¹⁰ cm3 molec.−1 s−1; Dil-lon et al., 2012), and C1, C2, and C3 represent pyrrole con-centrations at the corresponding steps described above, re-spectively.
In C2 and C3 mode, OH radicals are produced by the pho-tolysis of water vapor at atmospheric pressure as shown inReaction (R1). The generated H radicals from Reaction (R1)react with O2 of zero air or ambient air to generate HO2 rad-icals, as shown in Reaction (R2). When NO is present in thesampled ambient air, it can recycle OH by reacting with HO2(Reaction R3).
H2O254 nm−−−−→ OH+H (R1)
H+O2+M→ HO2 (R2)NO+HO2→ OH+NO2 (R3)
An underlying assumption of the CRM is that the influenceof the species in ambient air on the production of OH radicalsin the reactor is ignorable. The theoretical OH mixing ratioin the original CRM reactor is about 5–20 ppbv, which de-pends on the introduced pyrrole concentration to ensure thepyrrole/OH ratio is 2 : 1–3 : 1. However, the additional OHradicals produced via Reaction (R3) can react with pyrrole to
https://doi.org/10.5194/amt-14-2285-2021 Atmos. Meas. Tech., 14, 2285–2298, 2021
2288 W. Wang et al.: The improved comparative reactivity method (ICRM)
cause an additional decrease in pyrrole relative to C2 mode,thus leading to the underestimation of OH reactivity.
2.2 The improved CRM reactor
In order to remove the interference from the reaction of HO2radicals with NO as discussed above, we modified the pipestructure of the original CRM reactor (Fig. 1c). We kept thelength and volume of the glass reactor of the ICRM sys-tem similar to the original CRM system but added a branchinlet G (1/4 in. o.d. glass; length 3 cm) in arm A to intro-duce a stream of NO standard (Air Liquide; stated uncer-tainty 3 %; 10.8 ppmv) mixed with zero air at a constant flowof 120 mLmin−1. The typical flow rate inside the ICRM re-actor is approximately 660 mLmin−1. The flow rate of ni-trogen (Air Liquide; 99.9995 % purity) through arm B is250 mLmin−1. The input pyrrole (Linde Spectra Environ-ment Gases; stated uncertainty 5 %; 5.37 ppm) flow rate is2.5 mLmin−1. The total flow rate of pyrrole and zero air (AirLiquide; 99.9995 % purity) through arm C is 290 mLmin−1.With this modified structure of arm A, the HO2 radicals,which are produced by the reaction of the generated H rad-icals near the mercury lamp and O2 in introduced zero air,were converted to OH radicals by reacting with NO down-stream of arm G. The interference induced by Reaction (R3)can then be eliminated.
Arm A consists of one 1/2 in. o.d. (i.d.: 0.62 cm, length:7 cm) glass tube and one 1/4 in. o.d. (i.d.: 0.32 cm, length:5 cm) glass tube. The longer arm A is beneficial for a longerreaction time of HO2 with NO but with lower OH concentra-tions passing into the reactor due to wall loss. We chose anappropriate length of arm A (12 cm) to ensure an appropri-ate OH concentration (4 ppbv) and reaction time of HO2 withNO (∼ 0.1 s). The purpose of the two-section structure is toensure that the UV light is mostly confined within a 1/2 in.o.d. glass tube of arm A as the diameter of arm A goes fromwide to slender. The new structure of arm A leads to lowerOH concentrations (decreased by approximately 50 %) pass-ing into reactor compared with the original CRM system dueto wall loss, but OH radicals produced from the reaction ofHO2 radicals with NO can partially compensate for this loss.
2.3 The detection of pyrrole by PTR-MS
The accuracy of pyrrole measurement is critical in deter-mining OH reactivity for the CRM. Here we used PTR-MS to detect the pyrrole concentration. With a proton affin-ity greater than water (pyrrole: 209.2 kcalmol−1; water:165.2 kcalmol−1) (Sinha et al., 2008), pyrrole is chemicallyionized by proton transfer with H3O+ ions, and the productions are detected using a quadrupole mass spectrometer. Ashighlighted by Sinha et al. (2009), the sensitivity of PTR-MS instruments to pyrrole is dependent on humidity, and thepyrrole signal must be carefully calibrated for relative hu-midity changes within the CRM reactor. The approach de-
scribed by de Gouw and Warneke (2007) was employed inthis study to account for the effect of the ion source andhumidity on the sensitivity of the PTR-MS to pyrrole (deGouw and Warneke, 2007). This approach involves normal-ization of the pyrrole signal to a sum of reagent ion signals(H3O++XR ·H3O+(H2O)) that leads to a normalized sig-nal for pyrrole that is independent of humidity. XR, a scal-ing factor for the H3O+(H2O) signal, is determined exper-imentally by measuring the pyrrole signal from a standardmixture under different humidity conditions. In this study,a relatively higher electric field parameter of the drift tube(i.e., E/N ) value of 153 Td was used to measure pyrrole,which can minimize the humidity effect from water clustersin the PTR-MS instrument. As shown in the Supplement, thebest estimate for theXR parameter was determined to be zero(Fig. S1 in the Supplement), indicating the negligible role ofH3O+ ·H2O in pyrrole detection by a PTR-MS in this study.
2.4 Other instruments of the ambient measurementcampaign
In order to test and validate the ICRM system for OH re-activity measurements under high-NO conditions, we con-ducted field measurements of OH reactivity at a receptorsite in the Pearl River Delta (PRD) region of China (Yanget al., 2017; Tan et al., 2019). Meanwhile, non-methane hy-drocarbons (NMHCs) and oxygenated volatile organic com-pounds (OVOCs) were also measured by an online gas chro-matograph mass spectrometer couple with a flame ioniza-tion detector (GC-MS/FID) (Wang et al., 2014a) and a pro-ton transfer reaction time-of-flight mass spectrometer (PTR-TOF-MS) (Yuan et al., 2017), respectively (Table S1 in theSupplement). Inorganic trace gases, including CO, NO2, NO,SO2, and O3, were measured by a Thermo Fisher 48i COanalyzer, a 2B Technologies model 405nm NOx analyzer, aThermo Fisher 42i NOx analyzer, a Thermo Fisher 43i SO2analyzer, and a Thermo Fisher 49i O3 analyzer, respectively.Detailed descriptions of these instruments can be found inprevious studies (Wang et al., 2014b; Birks et al., 2018).
2.5 Zero-dimensional box model
To test our understanding of the chemical processes occur-ring inside the ICRM reactor, results from laboratory ex-periments were compared with simulations from a zero-dimensional (0-D) box model. The MCM v3.3.1 (Wolfeet al., 2016) was used as a chemical mechanism in the boxmodel. The use of a detailed mechanism aims at better rep-resenting the chemistry of peroxy radicals. In the box model,the initial concentrations of OH, HO2, pyrrole, VOCs, CO,and NO were supplied, and the time-dependent variations ofdifferent compounds in the reactor were simulated. The ini-tial concentrations of OH (4 ppbv), HO2 (4 ppbv), and pyr-role (21 ppbv) were determined based on results from our ex-periments. The residence time in the reactor was about 11 s
Atmos. Meas. Tech., 14, 2285–2298, 2021 https://doi.org/10.5194/amt-14-2285-2021
W. Wang et al.: The improved comparative reactivity method (ICRM) 2289
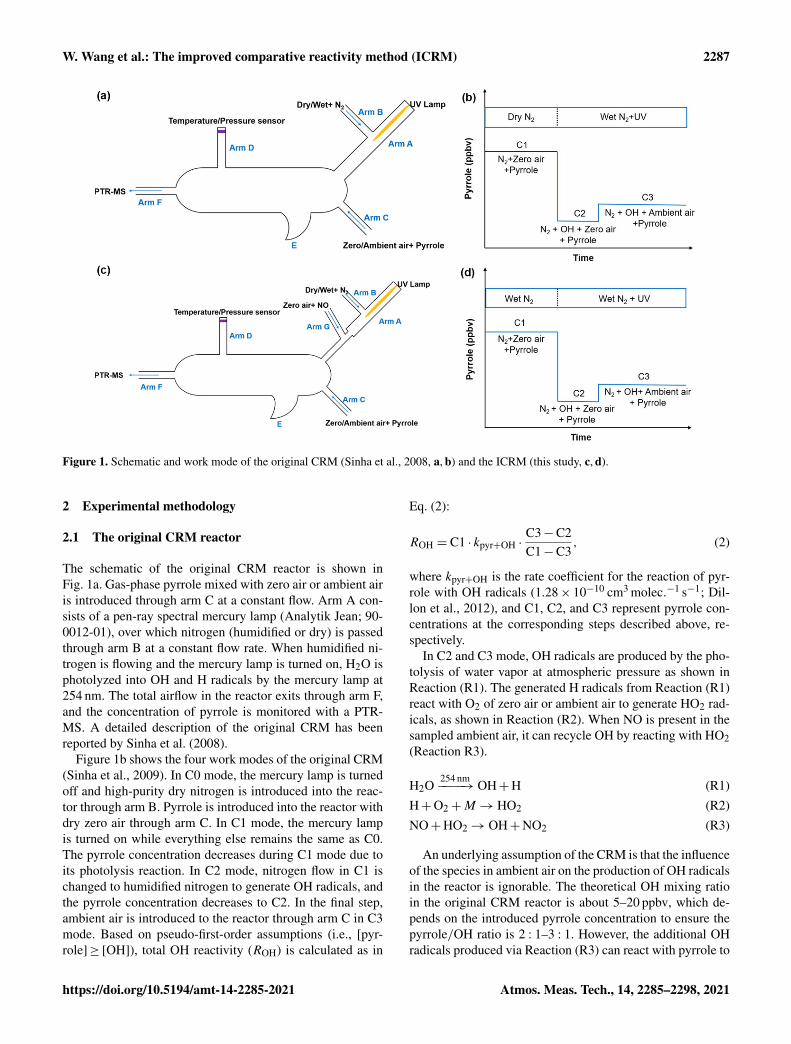
Figure 2. The response of the pyrrole concentration to different NOconcentrations introduced through arm G into the reactor. For theICRM system, the C2 mode corresponds to a pyrrole concentrationof 12.31 ppbv at NO= 50 ppbv, at which the HO2 radicals wereconstantly removed.
according to the volume of the reactor (120 cm3) and the flowof introduced gases (660 mLmin−1). An MCM subset wasextracted for inorganic reactions and reactions for propane,propene, and toluene. C3H5O2 was used as a surrogate forthe peroxy radicals from pyrrole, as the degradation of pyr-role is not included in the MCM.
3 Results and discussion
3.1 Determination of the amount of NO addition
In addition to HO2 produced from the reaction of H radicalswith O2, RO2 produced from the reaction of pyrrole with OHalso reacts with NO to recycle HO2 and OH (Reactions R4–R6) and consume pyrrole. In order to eliminate the effect ofHO2 and RO2 radicals, an NO supply with an appropriateconcentration through arm G is needed. We optimized theNO concentration by testing the dependence of the changein the pyrrole concentrations on the concentration of NO in-troduced through arm G (as described below and in Fig. 2).Figure 1d shows three work modes of the ICRM. During theexperiment, the pyrrole concentration in the C1 mode (forwhich N2 and zero air were humidified and the mercury lampwas turned off) was 22 ppbv, which decreased to 18 ppbvwhen the mercury lamp was turned on at 0 ppbv of NO, im-plying that the generated OH radicals depleted ∼ 4 ppbv ofpyrrole. We varied the NO concentrations mixed with thezero air entering arm G, which resulted in NO concentra-tions in the reactor ranging from 0 to 150 ppbv, and foundthe appropriate NO level to consume all HO2 and RO2 pro-duced in the glass reactor. NO was mixed with zero air ratherthan nitrogen, as oxygen in zero air can transform H radi-cals in arm A into HO2 radicals. The pyrrole concentration
decreases with the increase in NO concentrations, reachinga minimum when the NO concentration is ca. 40–50 ppbv,and is increased again when the NO concentration exceeds50 ppbv.
RH+OH+O2→ RO2+H2O (R4)RO2+NO+O2→ HO2+NO2+ carbonyls (R5)NO+HO2→ OH+NO2 (R6)RO2+HO2→ peroxide (R7)NO+OH→ HONO (R8)
Here, RH represents pyrrole in the reactor or ambient VOCsintroduced into the reactor.
The NO addition experiments are simulated in the boxmodel. The simulated pyrrole concentrations as a function ofthe NO concentration are consistent with laboratory exper-iments, with pyrrole concentrations decreasing at first andthen increasing (Fig. S2). When NO is not present in thereactor, the self-reactions of peroxy radicals (HO2+HO2,HO2+RO2) dominate the sink of HO2 and RO2 (Fig. S3).As NO is introduced into the reactor, the reaction of NOwith HO2 or RO2 competes with the self-reactions of per-oxy radicals. With more NO introduced, the produced OHradicals from the reaction of HO2 with NO increase, leadingto a decrease in the pyrrole concentration (Fig. S3). As theNO concentration exceeds 50 ppbv, pyrrole concentrationsincrease again due to large amounts of excess NO competingwith pyrrole for reaction with OH radicals. The remainingNO concentration outflowing from the reactor increases withthe introduced NO concentrations (Fig. S2), indicating thatexcessive NO is needed to compete with the self-reactionsof peroxy radicals. Based on laboratory measurements, theremaining NO concentration outflowing from the reactor is∼ 18 ppbv when the introduced NO concentration is 50 ppbv.The laboratory measurements and simulated results both sug-gest that 40∼ 50 ppbv is the lowest NO concentration neededto transform HO2 and RO2 into OH to the largest extent. Thehigher introduced NO concentration had a negligible effecton the increase in OH production from HO2 and RO2. Thus,we introduced a 50 ppbv NO concentration into the ICRMreactor in the experiments in this study. Under this optimizedcondition, the pyrrole concentration decreased to 12.3 ppbv,indicating that the total OH radical concentration includingproduction from the UV lamp and from the reaction of HO2with NO is about 10 ppbv in the ICRM system. The concen-tration of pyrrole in this scenario is regarded as the C2 modefor the ICRM system. It worth noting that the determinedNO concentration can vary slightly as OH generation perfor-mance changes (e.g., humidity change in the region of thepen-ray mercury lamp).
Under the determined optimal NO level through arm G,it is necessary to ensure that the OH production from HO2and pyrrole-induced RO2 will not manifest itself when ambi-ent NO is introduced through arm C. For this purpose, wecompared the measured and true OH reactivity of NO by
https://doi.org/10.5194/amt-14-2285-2021 Atmos. Meas. Tech., 14, 2285–2298, 2021
2290 W. Wang et al.: The improved comparative reactivity method (ICRM)
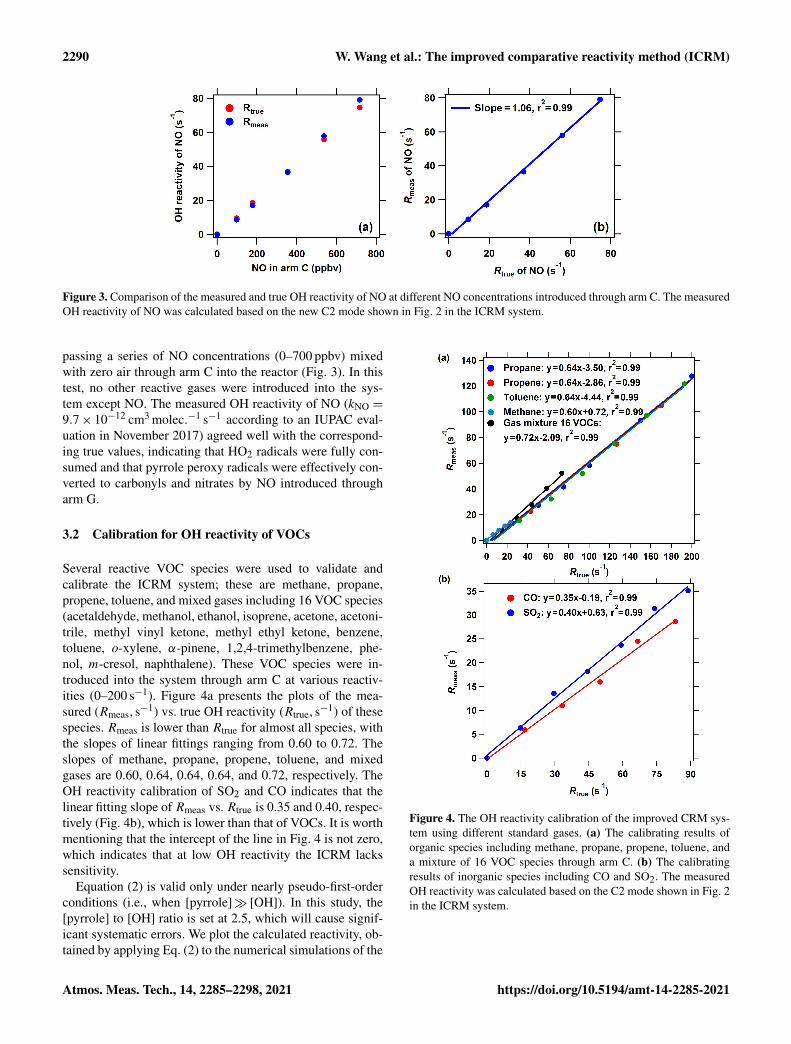
Figure 3. Comparison of the measured and true OH reactivity of NO at different NO concentrations introduced through arm C. The measuredOH reactivity of NO was calculated based on the new C2 mode shown in Fig. 2 in the ICRM system.
passing a series of NO concentrations (0–700 ppbv) mixedwith zero air through arm C into the reactor (Fig. 3). In thistest, no other reactive gases were introduced into the sys-tem except NO. The measured OH reactivity of NO (kNO =
9.7× 10⁻¹² cm3 molec.−1 s−1 according to an IUPAC eval-uation in November 2017) agreed well with the correspond-ing true values, indicating that HO2 radicals were fully con-sumed and that pyrrole peroxy radicals were effectively con-verted to carbonyls and nitrates by NO introduced througharm G.
3.2 Calibration for OH reactivity of VOCs
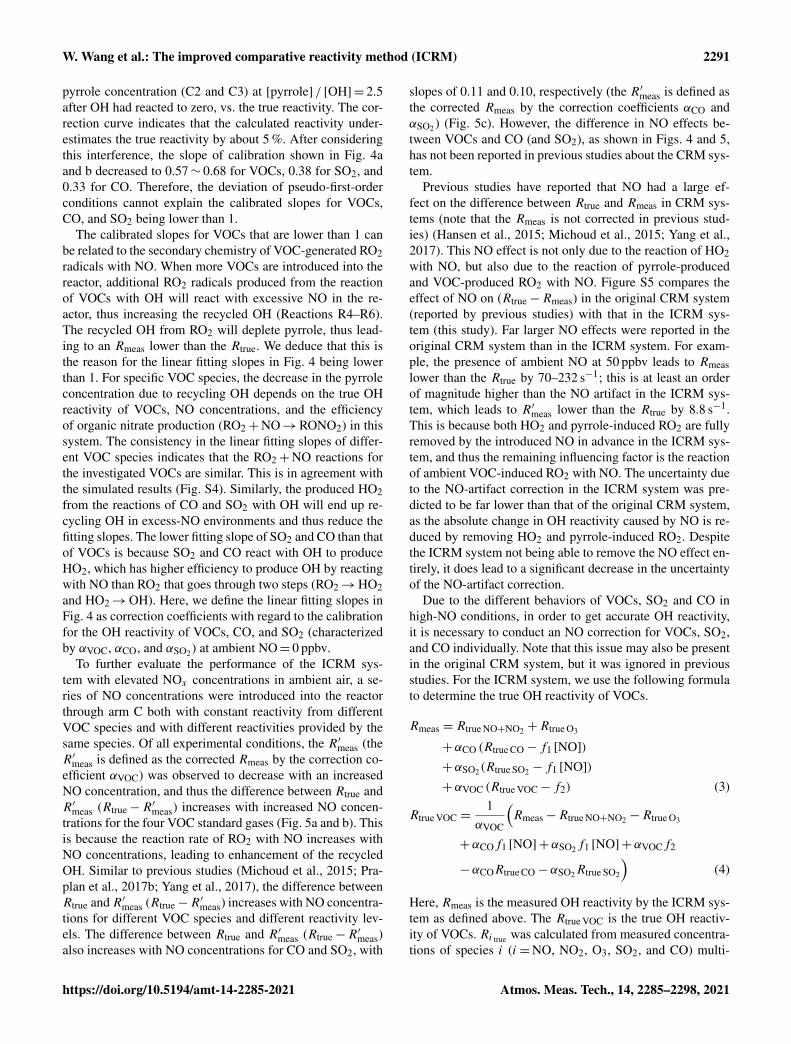
Several reactive VOC species were used to validate andcalibrate the ICRM system; these are methane, propane,propene, toluene, and mixed gases including 16 VOC species(acetaldehyde, methanol, ethanol, isoprene, acetone, acetoni-trile, methyl vinyl ketone, methyl ethyl ketone, benzene,toluene, o-xylene, α-pinene, 1,2,4-trimethylbenzene, phe-nol, m-cresol, naphthalene). These VOC species were in-troduced into the system through arm C at various reactiv-ities (0–200 s−1). Figure 4a presents the plots of the mea-sured (Rmeas, s−1) vs. true OH reactivity (Rtrue, s−1) of thesespecies. Rmeas is lower than Rtrue for almost all species, withthe slopes of linear fittings ranging from 0.60 to 0.72. Theslopes of methane, propane, propene, toluene, and mixedgases are 0.60, 0.64, 0.64, 0.64, and 0.72, respectively. TheOH reactivity calibration of SO2 and CO indicates that thelinear fitting slope of Rmeas vs. Rtrue is 0.35 and 0.40, respec-tively (Fig. 4b), which is lower than that of VOCs. It is worthmentioning that the intercept of the line in Fig. 4 is not zero,which indicates that at low OH reactivity the ICRM lackssensitivity.
Equation (2) is valid only under nearly pseudo-first-orderconditions (i.e., when [pyrrole]� [OH]). In this study, the[pyrrole] to [OH] ratio is set at 2.5, which will cause signif-icant systematic errors. We plot the calculated reactivity, ob-tained by applying Eq. (2) to the numerical simulations of the
Figure 4. The OH reactivity calibration of the improved CRM sys-tem using different standard gases. (a) The calibrating results oforganic species including methane, propane, propene, toluene, anda mixture of 16 VOC species through arm C. (b) The calibratingresults of inorganic species including CO and SO2. The measuredOH reactivity was calculated based on the C2 mode shown in Fig. 2in the ICRM system.
Atmos. Meas. Tech., 14, 2285–2298, 2021 https://doi.org/10.5194/amt-14-2285-2021
W. Wang et al.: The improved comparative reactivity method (ICRM) 2291
pyrrole concentration (C2 and C3) at [pyrrole] / [OH]= 2.5after OH had reacted to zero, vs. the true reactivity. The cor-rection curve indicates that the calculated reactivity under-estimates the true reactivity by about 5 %. After consideringthis interference, the slope of calibration shown in Fig. 4aand b decreased to 0.57∼ 0.68 for VOCs, 0.38 for SO2, and0.33 for CO. Therefore, the deviation of pseudo-first-orderconditions cannot explain the calibrated slopes for VOCs,CO, and SO2 being lower than 1.
The calibrated slopes for VOCs that are lower than 1 canbe related to the secondary chemistry of VOC-generated RO2radicals with NO. When more VOCs are introduced into thereactor, additional RO2 radicals produced from the reactionof VOCs with OH will react with excessive NO in the re-actor, thus increasing the recycled OH (Reactions R4–R6).The recycled OH from RO2 will deplete pyrrole, thus lead-ing to an Rmeas lower than the Rtrue. We deduce that this isthe reason for the linear fitting slopes in Fig. 4 being lowerthan 1. For specific VOC species, the decrease in the pyrroleconcentration due to recycling OH depends on the true OHreactivity of VOCs, NO concentrations, and the efficiencyof organic nitrate production (RO2+NO→RONO2) in thissystem. The consistency in the linear fitting slopes of differ-ent VOC species indicates that the RO2+NO reactions forthe investigated VOCs are similar. This is in agreement withthe simulated results (Fig. S4). Similarly, the produced HO2from the reactions of CO and SO2 with OH will end up re-cycling OH in excess-NO environments and thus reduce thefitting slopes. The lower fitting slope of SO2 and CO than thatof VOCs is because SO2 and CO react with OH to produceHO2, which has higher efficiency to produce OH by reactingwith NO than RO2 that goes through two steps (RO2→HO2and HO2→OH). Here, we define the linear fitting slopes inFig. 4 as correction coefficients with regard to the calibrationfor the OH reactivity of VOCs, CO, and SO2 (characterizedby αVOC, αCO, and αSO2 ) at ambient NO= 0 ppbv.
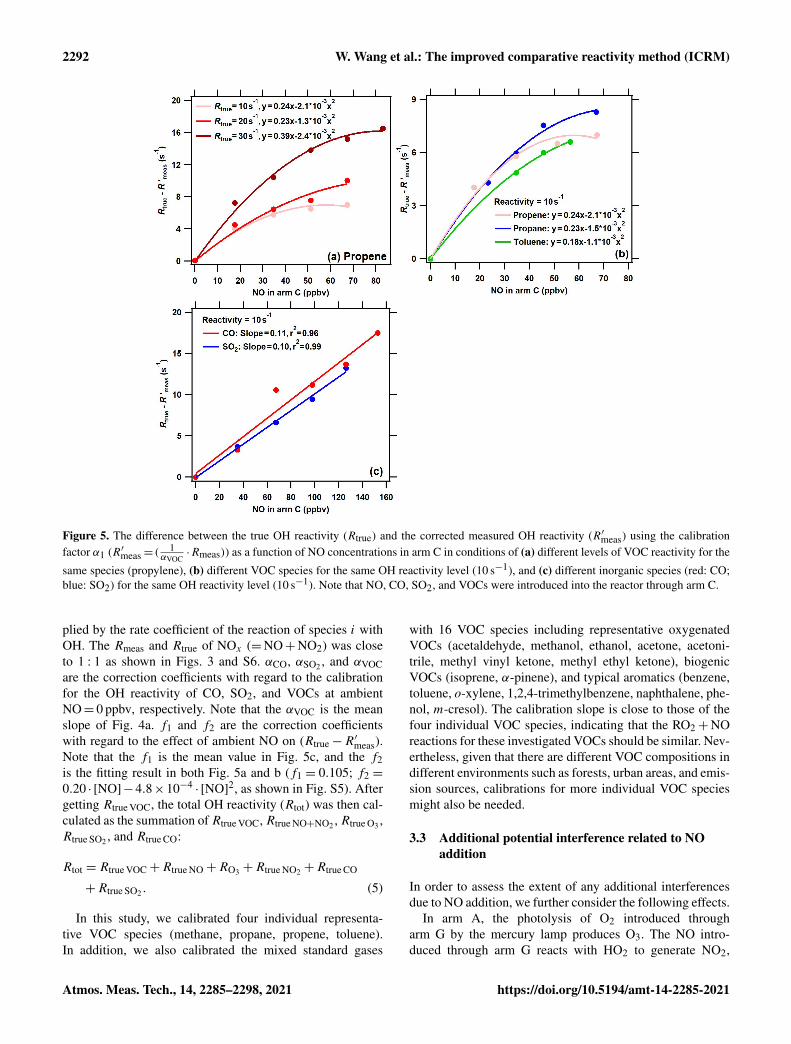
To further evaluate the performance of the ICRM sys-tem with elevated NOx concentrations in ambient air, a se-ries of NO concentrations were introduced into the reactorthrough arm C both with constant reactivity from differentVOC species and with different reactivities provided by thesame species. Of all experimental conditions, the R′meas (theR′meas is defined as the corrected Rmeas by the correction co-efficient αVOC) was observed to decrease with an increasedNO concentration, and thus the difference between Rtrue andR′meas (Rtrue−R
′meas) increases with increased NO concen-
trations for the four VOC standard gases (Fig. 5a and b). Thisis because the reaction rate of RO2 with NO increases withNO concentrations, leading to enhancement of the recycledOH. Similar to previous studies (Michoud et al., 2015; Pra-plan et al., 2017b; Yang et al., 2017), the difference betweenRtrue andR′meas (Rtrue−R
′meas) increases with NO concentra-
tions for different VOC species and different reactivity lev-els. The difference between Rtrue and R′meas (Rtrue−R
′meas)
also increases with NO concentrations for CO and SO2, with
slopes of 0.11 and 0.10, respectively (the R′meas is defined asthe corrected Rmeas by the correction coefficients αCO andαSO2 ) (Fig. 5c). However, the difference in NO effects be-tween VOCs and CO (and SO2), as shown in Figs. 4 and 5,has not been reported in previous studies about the CRM sys-tem.
Previous studies have reported that NO had a large ef-fect on the difference between Rtrue and Rmeas in CRM sys-tems (note that the Rmeas is not corrected in previous stud-ies) (Hansen et al., 2015; Michoud et al., 2015; Yang et al.,2017). This NO effect is not only due to the reaction of HO2with NO, but also due to the reaction of pyrrole-producedand VOC-produced RO2 with NO. Figure S5 compares theeffect of NO on (Rtrue−Rmeas) in the original CRM system(reported by previous studies) with that in the ICRM sys-tem (this study). Far larger NO effects were reported in theoriginal CRM system than in the ICRM system. For exam-ple, the presence of ambient NO at 50 ppbv leads to Rmeaslower than the Rtrue by 70–232 s−1; this is at least an orderof magnitude higher than the NO artifact in the ICRM sys-tem, which leads to R′meas lower than the Rtrue by 8.8 s−1.This is because both HO2 and pyrrole-induced RO2 are fullyremoved by the introduced NO in advance in the ICRM sys-tem, and thus the remaining influencing factor is the reactionof ambient VOC-induced RO2 with NO. The uncertainty dueto the NO-artifact correction in the ICRM system was pre-dicted to be far lower than that of the original CRM system,as the absolute change in OH reactivity caused by NO is re-duced by removing HO2 and pyrrole-induced RO2. Despitethe ICRM system not being able to remove the NO effect en-tirely, it does lead to a significant decrease in the uncertaintyof the NO-artifact correction.
Due to the different behaviors of VOCs, SO2 and CO inhigh-NO conditions, in order to get accurate OH reactivity,it is necessary to conduct an NO correction for VOCs, SO2,and CO individually. Note that this issue may also be presentin the original CRM system, but it was ignored in previousstudies. For the ICRM system, we use the following formulato determine the true OH reactivity of VOCs.
Rmeas = Rtrue NO+NO2 +Rtrue O3
+αCO (Rtrue CO− f1 [NO])+αSO2(Rtrue SO2 − f1 [NO])+αVOC (Rtrue VOC− f2) (3)
Rtrue VOC =1
αVOC
(Rmeas−Rtrue NO+NO2 −Rtrue O3
+αCOf1 [NO]+αSO2f1 [NO]+αVOCf2
−αCORtrue CO−αSO2Rtrue SO2
)(4)
Here, Rmeas is the measured OH reactivity by the ICRM sys-tem as defined above. The Rtrue VOC is the true OH reactiv-ity of VOCs. Ri true was calculated from measured concentra-tions of species i (i=NO, NO2, O3, SO2, and CO) multi-
https://doi.org/10.5194/amt-14-2285-2021 Atmos. Meas. Tech., 14, 2285–2298, 2021
2292 W. Wang et al.: The improved comparative reactivity method (ICRM)
Figure 5. The difference between the true OH reactivity (Rtrue) and the corrected measured OH reactivity (R′meas) using the calibrationfactor α1 (R′meas= ( 1
αVOC·Rmeas)) as a function of NO concentrations in arm C in conditions of (a) different levels of VOC reactivity for the
same species (propylene), (b) different VOC species for the same OH reactivity level (10 s−1), and (c) different inorganic species (red: CO;blue: SO2) for the same OH reactivity level (10 s−1). Note that NO, CO, SO2, and VOCs were introduced into the reactor through arm C.
plied by the rate coefficient of the reaction of species i withOH. The Rmeas and Rtrue of NOx (=NO+NO2) was closeto 1 : 1 as shown in Figs. 3 and S6. αCO, αSO2 , and αVOCare the correction coefficients with regard to the calibrationfor the OH reactivity of CO, SO2, and VOCs at ambientNO= 0 ppbv, respectively. Note that the αVOC is the meanslope of Fig. 4a. f1 and f2 are the correction coefficientswith regard to the effect of ambient NO on (Rtrue−R
′meas).
Note that the f1 is the mean value in Fig. 5c, and the f2is the fitting result in both Fig. 5a and b (f1 = 0.105; f2 =
0.20 · [NO]−4.8×10⁻⁴· [NO]2, as shown in Fig. S5). After
getting Rtrue VOC, the total OH reactivity (Rtot) was then cal-culated as the summation ofRtrue VOC,Rtrue NO+NO2 ,Rtrue O3 ,Rtrue SO2 , and Rtrue CO:
Rtot = Rtrue VOC+Rtrue NO+RO3 +Rtrue NO2 +Rtrue CO
+Rtrue SO2 . (5)
In this study, we calibrated four individual representa-tive VOC species (methane, propane, propene, toluene).In addition, we also calibrated the mixed standard gases
with 16 VOC species including representative oxygenatedVOCs (acetaldehyde, methanol, ethanol, acetone, acetoni-trile, methyl vinyl ketone, methyl ethyl ketone), biogenicVOCs (isoprene, α-pinene), and typical aromatics (benzene,toluene, o-xylene, 1,2,4-trimethylbenzene, naphthalene, phe-nol, m-cresol). The calibration slope is close to those of thefour individual VOC species, indicating that the RO2+NOreactions for these investigated VOCs should be similar. Nev-ertheless, given that there are different VOC compositions indifferent environments such as forests, urban areas, and emis-sion sources, calibrations for more individual VOC speciesmight also be needed.
3.3 Additional potential interference related to NOaddition
In order to assess the extent of any additional interferencesdue to NO addition, we further consider the following effects.
In arm A, the photolysis of O2 introduced througharm G by the mercury lamp produces O3. The NO intro-duced through arm G reacts with HO2 to generate NO2,
Atmos. Meas. Tech., 14, 2285–2298, 2021 https://doi.org/10.5194/amt-14-2285-2021
W. Wang et al.: The improved comparative reactivity method (ICRM) 2293
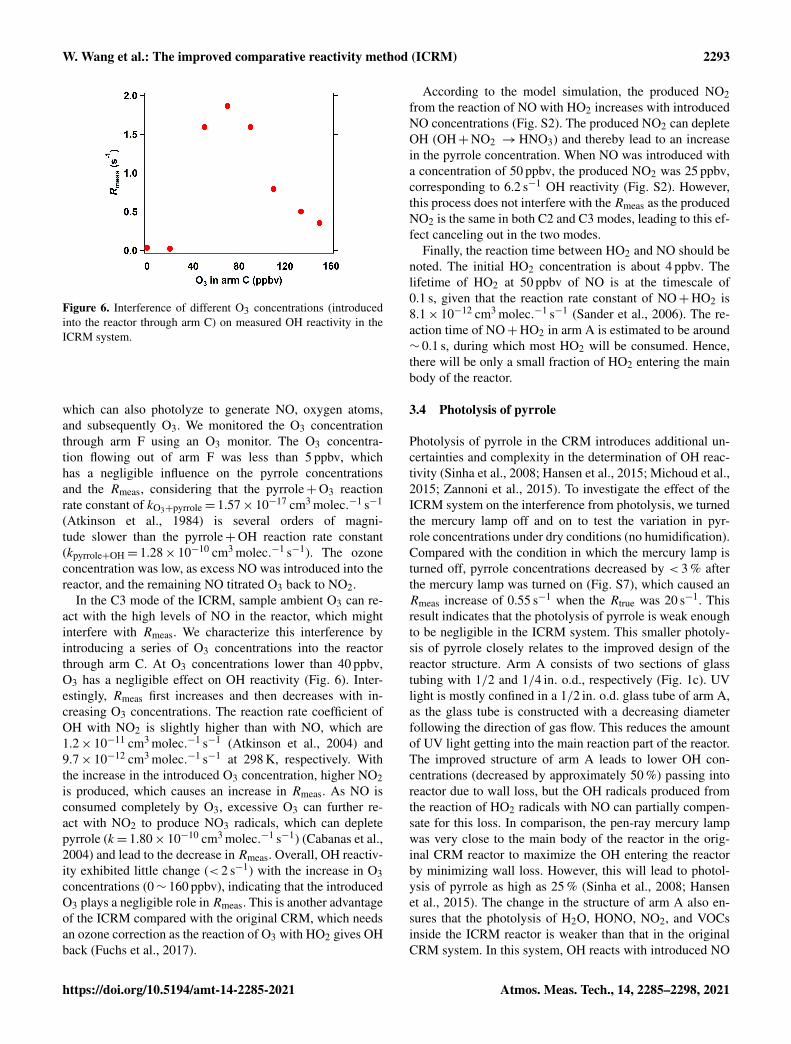
Figure 6. Interference of different O3 concentrations (introducedinto the reactor through arm C) on measured OH reactivity in theICRM system.
which can also photolyze to generate NO, oxygen atoms,and subsequently O3. We monitored the O3 concentrationthrough arm F using an O3 monitor. The O3 concentra-tion flowing out of arm F was less than 5 ppbv, whichhas a negligible influence on the pyrrole concentrationsand the Rmeas, considering that the pyrrole+O3 reactionrate constant of kO3+pyrrole= 1.57× 10⁻¹⁷ cm3 molec.−1 s−1
(Atkinson et al., 1984) is several orders of magni-tude slower than the pyrrole+OH reaction rate constant(kpyrrole+OH= 1.28× 10⁻¹⁰ cm3 molec.−1 s−1). The ozoneconcentration was low, as excess NO was introduced into thereactor, and the remaining NO titrated O3 back to NO2.
In the C3 mode of the ICRM, sample ambient O3 can re-act with the high levels of NO in the reactor, which mightinterfere with Rmeas. We characterize this interference byintroducing a series of O3 concentrations into the reactorthrough arm C. At O3 concentrations lower than 40 ppbv,O3 has a negligible effect on OH reactivity (Fig. 6). Inter-estingly, Rmeas first increases and then decreases with in-creasing O3 concentrations. The reaction rate coefficient ofOH with NO2 is slightly higher than with NO, which are1.2× 10−11 cm3 molec.−1 s−1 (Atkinson et al., 2004) and9.7× 10−12 cm3 molec.−1 s−1 at 298 K, respectively. Withthe increase in the introduced O3 concentration, higher NO2is produced, which causes an increase in Rmeas. As NO isconsumed completely by O3, excessive O3 can further re-act with NO2 to produce NO3 radicals, which can depletepyrrole (k= 1.80× 10⁻¹⁰ cm3 molec.−1 s−1) (Cabanas et al.,2004) and lead to the decrease in Rmeas. Overall, OH reactiv-ity exhibited little change (< 2 s−1) with the increase in O3concentrations (0∼ 160 ppbv), indicating that the introducedO3 plays a negligible role in Rmeas. This is another advantageof the ICRM compared with the original CRM, which needsan ozone correction as the reaction of O3 with HO2 gives OHback (Fuchs et al., 2017).
According to the model simulation, the produced NO2from the reaction of NO with HO2 increases with introducedNO concentrations (Fig. S2). The produced NO2 can depleteOH (OH+NO2 →HNO3) and thereby lead to an increasein the pyrrole concentration. When NO was introduced witha concentration of 50 ppbv, the produced NO2 was 25 ppbv,corresponding to 6.2 s−1 OH reactivity (Fig. S2). However,this process does not interfere with the Rmeas as the producedNO2 is the same in both C2 and C3 modes, leading to this ef-fect canceling out in the two modes.
Finally, the reaction time between HO2 and NO should benoted. The initial HO2 concentration is about 4 ppbv. Thelifetime of HO2 at 50 ppbv of NO is at the timescale of0.1 s, given that the reaction rate constant of NO+HO2 is8.1× 10−12 cm3 molec.−1 s−1 (Sander et al., 2006). The re-action time of NO+HO2 in arm A is estimated to be around∼ 0.1 s, during which most HO2 will be consumed. Hence,there will be only a small fraction of HO2 entering the mainbody of the reactor.
3.4 Photolysis of pyrrole
Photolysis of pyrrole in the CRM introduces additional un-certainties and complexity in the determination of OH reac-tivity (Sinha et al., 2008; Hansen et al., 2015; Michoud et al.,2015; Zannoni et al., 2015). To investigate the effect of theICRM system on the interference from photolysis, we turnedthe mercury lamp off and on to test the variation in pyr-role concentrations under dry conditions (no humidification).Compared with the condition in which the mercury lamp isturned off, pyrrole concentrations decreased by < 3 % afterthe mercury lamp was turned on (Fig. S7), which caused anRmeas increase of 0.55 s−1 when the Rtrue was 20 s−1. Thisresult indicates that the photolysis of pyrrole is weak enoughto be negligible in the ICRM system. This smaller photoly-sis of pyrrole closely relates to the improved design of thereactor structure. Arm A consists of two sections of glasstubing with 1/2 and 1/4 in. o.d., respectively (Fig. 1c). UVlight is mostly confined in a 1/2 in. o.d. glass tube of arm A,as the glass tube is constructed with a decreasing diameterfollowing the direction of gas flow. This reduces the amountof UV light getting into the main reaction part of the reactor.The improved structure of arm A leads to lower OH con-centrations (decreased by approximately 50 %) passing intoreactor due to wall loss, but the OH radicals produced fromthe reaction of HO2 radicals with NO can partially compen-sate for this loss. In comparison, the pen-ray mercury lampwas very close to the main body of the reactor in the orig-inal CRM reactor to maximize the OH entering the reactorby minimizing wall loss. However, this will lead to photol-ysis of pyrrole as high as 25 % (Sinha et al., 2008; Hansenet al., 2015). The change in the structure of arm A also en-sures that the photolysis of H2O, HONO, NO2, and VOCsinside the ICRM reactor is weaker than that in the originalCRM system. In this system, OH reacts with introduced NO
https://doi.org/10.5194/amt-14-2285-2021 Atmos. Meas. Tech., 14, 2285–2298, 2021
2294 W. Wang et al.: The improved comparative reactivity method (ICRM)
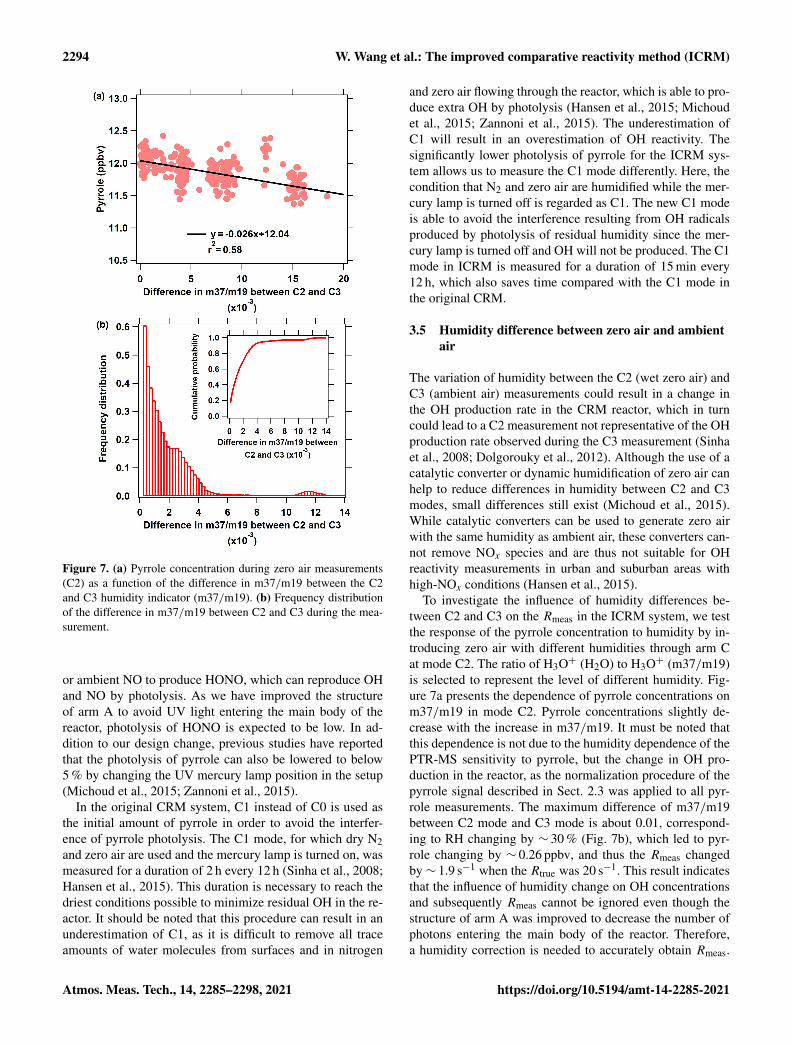
Figure 7. (a) Pyrrole concentration during zero air measurements(C2) as a function of the difference in m37/m19 between the C2and C3 humidity indicator (m37/m19). (b) Frequency distributionof the difference in m37/m19 between C2 and C3 during the mea-surement.
or ambient NO to produce HONO, which can reproduce OHand NO by photolysis. As we have improved the structureof arm A to avoid UV light entering the main body of thereactor, photolysis of HONO is expected to be low. In ad-dition to our design change, previous studies have reportedthat the photolysis of pyrrole can also be lowered to below5 % by changing the UV mercury lamp position in the setup(Michoud et al., 2015; Zannoni et al., 2015).
In the original CRM system, C1 instead of C0 is used asthe initial amount of pyrrole in order to avoid the interfer-ence of pyrrole photolysis. The C1 mode, for which dry N2and zero air are used and the mercury lamp is turned on, wasmeasured for a duration of 2 h every 12 h (Sinha et al., 2008;Hansen et al., 2015). This duration is necessary to reach thedriest conditions possible to minimize residual OH in the re-actor. It should be noted that this procedure can result in anunderestimation of C1, as it is difficult to remove all traceamounts of water molecules from surfaces and in nitrogen
and zero air flowing through the reactor, which is able to pro-duce extra OH by photolysis (Hansen et al., 2015; Michoudet al., 2015; Zannoni et al., 2015). The underestimation ofC1 will result in an overestimation of OH reactivity. Thesignificantly lower photolysis of pyrrole for the ICRM sys-tem allows us to measure the C1 mode differently. Here, thecondition that N2 and zero air are humidified while the mer-cury lamp is turned off is regarded as C1. The new C1 modeis able to avoid the interference resulting from OH radicalsproduced by photolysis of residual humidity since the mer-cury lamp is turned off and OH will not be produced. The C1mode in ICRM is measured for a duration of 15 min every12 h, which also saves time compared with the C1 mode inthe original CRM.
3.5 Humidity difference between zero air and ambientair
The variation of humidity between the C2 (wet zero air) andC3 (ambient air) measurements could result in a change inthe OH production rate in the CRM reactor, which in turncould lead to a C2 measurement not representative of the OHproduction rate observed during the C3 measurement (Sinhaet al., 2008; Dolgorouky et al., 2012). Although the use of acatalytic converter or dynamic humidification of zero air canhelp to reduce differences in humidity between C2 and C3modes, small differences still exist (Michoud et al., 2015).While catalytic converters can be used to generate zero airwith the same humidity as ambient air, these converters can-not remove NOx species and are thus not suitable for OHreactivity measurements in urban and suburban areas withhigh-NOx conditions (Hansen et al., 2015).
To investigate the influence of humidity differences be-tween C2 and C3 on the Rmeas in the ICRM system, we testthe response of the pyrrole concentration to humidity by in-troducing zero air with different humidities through arm Cat mode C2. The ratio of H3O+ (H2O) to H3O+ (m37/m19)is selected to represent the level of different humidity. Fig-ure 7a presents the dependence of pyrrole concentrations onm37/m19 in mode C2. Pyrrole concentrations slightly de-crease with the increase in m37/m19. It must be noted thatthis dependence is not due to the humidity dependence of thePTR-MS sensitivity to pyrrole, but the change in OH pro-duction in the reactor, as the normalization procedure of thepyrrole signal described in Sect. 2.3 was applied to all pyr-role measurements. The maximum difference of m37/m19between C2 mode and C3 mode is about 0.01, correspond-ing to RH changing by ∼ 30 % (Fig. 7b), which led to pyr-role changing by ∼ 0.26 ppbv, and thus the Rmeas changedby ∼ 1.9 s−1 when the Rtrue was 20 s−1. This result indicatesthat the influence of humidity change on OH concentrationsand subsequently Rmeas cannot be ignored even though thestructure of arm A was improved to decrease the number ofphotons entering the main body of the reactor. Therefore,a humidity correction is needed to accurately obtain Rmeas.
Atmos. Meas. Tech., 14, 2285–2298, 2021 https://doi.org/10.5194/amt-14-2285-2021
W. Wang et al.: The improved comparative reactivity method (ICRM) 2295
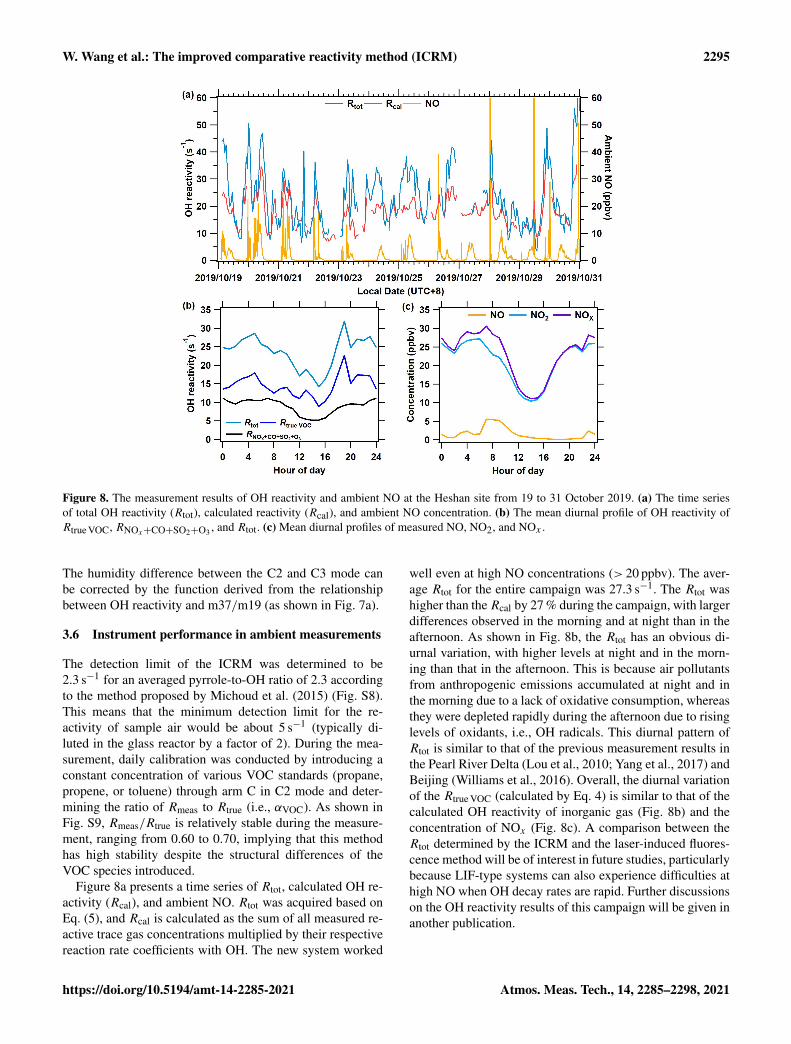
Figure 8. The measurement results of OH reactivity and ambient NO at the Heshan site from 19 to 31 October 2019. (a) The time seriesof total OH reactivity (Rtot), calculated reactivity (Rcal), and ambient NO concentration. (b) The mean diurnal profile of OH reactivity ofRtrue VOC, RNOx+CO+SO2+O3 , and Rtot. (c) Mean diurnal profiles of measured NO, NO2, and NOx .
The humidity difference between the C2 and C3 mode canbe corrected by the function derived from the relationshipbetween OH reactivity and m37/m19 (as shown in Fig. 7a).
3.6 Instrument performance in ambient measurements
The detection limit of the ICRM was determined to be2.3 s−1 for an averaged pyrrole-to-OH ratio of 2.3 accordingto the method proposed by Michoud et al. (2015) (Fig. S8).This means that the minimum detection limit for the re-activity of sample air would be about 5 s−1 (typically di-luted in the glass reactor by a factor of 2). During the mea-surement, daily calibration was conducted by introducing aconstant concentration of various VOC standards (propane,propene, or toluene) through arm C in C2 mode and deter-mining the ratio of Rmeas to Rtrue (i.e., αVOC). As shown inFig. S9, Rmeas/Rtrue is relatively stable during the measure-ment, ranging from 0.60 to 0.70, implying that this methodhas high stability despite the structural differences of theVOC species introduced.
Figure 8a presents a time series of Rtot, calculated OH re-activity (Rcal), and ambient NO. Rtot was acquired based onEq. (5), and Rcal is calculated as the sum of all measured re-active trace gas concentrations multiplied by their respectivereaction rate coefficients with OH. The new system worked
well even at high NO concentrations (> 20 ppbv). The aver-age Rtot for the entire campaign was 27.3 s−1. The Rtot washigher than theRcal by 27 % during the campaign, with largerdifferences observed in the morning and at night than in theafternoon. As shown in Fig. 8b, the Rtot has an obvious di-urnal variation, with higher levels at night and in the morn-ing than that in the afternoon. This is because air pollutantsfrom anthropogenic emissions accumulated at night and inthe morning due to a lack of oxidative consumption, whereasthey were depleted rapidly during the afternoon due to risinglevels of oxidants, i.e., OH radicals. This diurnal pattern ofRtot is similar to that of the previous measurement results inthe Pearl River Delta (Lou et al., 2010; Yang et al., 2017) andBeijing (Williams et al., 2016). Overall, the diurnal variationof the Rtrue VOC (calculated by Eq. 4) is similar to that of thecalculated OH reactivity of inorganic gas (Fig. 8b) and theconcentration of NOx (Fig. 8c). A comparison between theRtot determined by the ICRM and the laser-induced fluores-cence method will be of interest in future studies, particularlybecause LIF-type systems can also experience difficulties athigh NO when OH decay rates are rapid. Further discussionson the OH reactivity results of this campaign will be given inanother publication.
https://doi.org/10.5194/amt-14-2285-2021 Atmos. Meas. Tech., 14, 2285–2298, 2021
2296 W. Wang et al.: The improved comparative reactivity method (ICRM)
4 Conclusions
In this study, we presented an improved comparative reactiv-ity method (ICRM) that is suitable for measuring OH reac-tivity under high-NOx conditions. The major improvementsof the ICRM compared to the original CRM system are asfollows.
1. The HO2 and RO2 radicals produced from H radicalsreacting with O2 and OH oxidation of pyrrole, respec-tively, were continuously removed to the largest extentpossible. In this study, 50 ppbv of NO was injected intothe ICRM reactor through an additional arm G betweenarm A and the reactor. Under this NO level, the interfer-ence due to the reaction of HO2 and RO2 from pyrrolewith NO was minimized.
2. OH recycling always happens to some extent when sam-pled VOCs are introduced into the reactor in the pres-ence of NO, causing the measured OH reactivity (Rmeas)to deviate from the true OH reactivity (Rtrue). We quan-tified this effect by calibrating several representativeVOC species, CO, and SO2 to obtain the slope of Rmeasvs. Rtrue. Different VOC species produce similar slopes,which are significantly higher than the slopes of CO andSO2. Using the average value of the derived slopes ofthe different species as a correction factor, we obtaineda more accurate Rmeas. Additionally, the effect of ambi-ent NO on the difference between Rtrue and R′meas wasquantified.
3. The structure of the glass reactor was transformed toreduce the amount of ultraviolet light generated by themercury lamp reaching the main body of the glass reac-tor. This effort resulted in eliminating the interferenceof pyrrole photolysis that existed in the original sys-tem. Under this condition, the new C1 mode was able toavoid the interference resulting from OH radicals pro-duced by photolysis of residual humidity and save lotsof time compared with the original C1 mode. The ICRMsystem was employed in a field campaign to measureOH reactivity and performed well even when ambientNO concentrations were high.
Data availability. More detailed data can be provided by contact-ing the corresponding author.
Supplement. The supplement related to this article is available on-line at: https://doi.org/10.5194/amt-14-2285-2021-supplement.
Author contributions. WJW and BY came up with the idea for theimproved CRM. JPQ built the ICRM system and performed dataanalysis. WJW, JPQ, and BY wrote the paper, with contributionsfrom all other authors. YWP and SHW provided the PTR-TOF-MS
and PAMS data. SXY helped with the box model run. JW and VSrevised the paper. MS provided financial support.
Competing interests. The authors declare that they have no conflictof interest.
Financial support. This research has been supported by theKey-Area Research and Development Program of GuangdongProvince (grant no. 2019B110206001), the National Natural Sci-ence Foundation of China (grant no. 41877302), GuangdongNatural Science Funds for Distinguished Young Scholars (grantno. 2018B030306037), the National Key R&D Plan of China (grantnos. 2019YFE0106300, 2018YFC0213904, 2016YFC0202206),the Guangdong Soft Science Research Program (grant no.2019B101001005), the and Guangdong Innovative and En-trepreneurial Research Team Program (grant no. 2016ZT06N263).This work was also supported by the Special Fund Project for Sci-ence and Technology Innovation Strategy of Guangdong Province(grant no. 2019B121205004).
Review statement. This paper was edited by Anna Novelli and re-viewed by two anonymous referees.
References
Atkinson, R.: Atmospheric chemistry of VOCs and NOx , Atmos.Environ., 36, 2063–2101, 2000.
Atkinson, R. and Arey, J.: Atmospheric Degradation of Volatile Or-ganic Compounds, Chem. Rev., 103, 4605–4638, 2003.
Atkinson, R., Aschmann, S. M., Winer, A. M., and Carter, W. P.L.: Rate constants for the gas phase reactions of OH radicals andO3, with pyrrole at 295± 1 K and atmospheric pressure, Atmos.Environ., 18, 2105–2107, 1984.
Atkinson, R., Baulch, D. L., Cox, R. A., Crowley, J. N., Hamp-son, R. F., Hynes, R. G., Jenkin, M. E., Rossi, M. J., andTroe, J.: Evaluated kinetic and photochemical data for atmo-spheric chemistry: Volume I – gas phase reactions of Ox, HOx,NOx and SOx species, Atmos. Chem. Phys., 4, 1461–1738,https://doi.org/10.5194/acp-4-1461-2004, 2004.
Birks, J. W., Andersen, P. C., Williford, C. J., Turnipseed, A. A.,Strunk, S. E., Ennis, C. A., and Mattson, E.: Folded tubularphotometer for atmospheric measurements of NO2 and NO, At-mos. Meas. Tech., 11, 2821–2835, https://doi.org/10.5194/amt-11-2821-2018, 2018.
Cabanas, B., Baeza, M. T., Salgado, S., Martin, P., Taccone, R., andMartinez, E.: Oxidation of heterocycles in the atmosphere: Ki-netic study of their reactions with NO3 radical, J. Phys. Chem.A, 108, 10818–10823, https://doi.org/10.1021/jp046524t, 2004.
de Gouw, J. and Warneke, C.: Measurements of volatile organiccompounds in the earth’s atmosphere using proton-transfer-reaction mass spectrometry, Mass. Spectrom. Rev., 26, 223–257,https://doi.org/10.1002/mas.20119, 2007.
Dillon, T. J., Tucceri, M. E., Dulitz, K., Horowitz, A.,Vereecken, L., and Crowley, J. N.: Reaction of hydroxyl rad-icals with C4H5N (pyrrole): temperature and pressure depen-
Atmos. Meas. Tech., 14, 2285–2298, 2021 https://doi.org/10.5194/amt-14-2285-2021
W. Wang et al.: The improved comparative reactivity method (ICRM) 2297
dent rate coefficients, J. Phys. Chem. A, 116, 6051–6058,https://doi.org/10.1021/jp211241x, 2012.
Dolgorouky, C., Gros, V., Sarda-Esteve, R., Sinha, V., Williams, J.,Marchand, N., Sauvage, S., Poulain, L., Sciare, J., and Bonsang,B.: Total OH reactivity measurements in Paris during the 2010MEGAPOLI winter campaign, Atmos. Chem. Phys., 12, 9593–9612, https://doi.org/10.5194/acp-12-9593-2012, 2012.
Fuchs, H., Novelli, A., Rolletter, M., Hofzumahaus, A., Pfannerstill,E. Y., Kessel, S., Edtbauer, A., Williams, J., Michoud, V., Du-santer, S., Locoge, N., Zannoni, N., Gros, V., Truong, F., Sarda-Esteve, R., Cryer, D. R., Brumby, C. A., Whalley, L. K., Stone,D., Seakins, P. W., Heard, D. E., Schoemaecker, C., Blocquet,M., Coudert, S., Batut, S., Fittschen, C., Thames, A. B., Brune,W. H., Ernest, C., Harder, H., Muller, J. B. A., Elste, T., Ku-bistin, D., Andres, S., Bohn, B., Hohaus, T., Holland, F., Li, X.,Rohrer, F., Kiendler-Scharr, A., Tillmann, R., Wegener, R., Yu,Z., Zou, Q., and Wahner, A.: Comparison of OH reactivity mea-surements in the atmospheric simulation chamber SAPHIR, At-mos. Meas. Tech., 10, 4023–4053, https://doi.org/10.5194/amt-10-4023-2017, 2017.
Hansen, R. F., Blocquet, M., Schoemaecker, C., Léonardis, T.,Locoge, N., Fittschen, C., Hanoune, B., Stevens, P. S., Sinha, V.,and Dusanter, S.: Intercomparison of the comparative reactivitymethod (CRM) and pump–probe technique for measuring totalOH reactivity in an urban environment, Atmos. Meas. Tech., 8,4243–4264, https://doi.org/10.5194/amt-8-4243-2015, 2015.
Hofzumahaus, A., Dorn, H. P., Callies, J., Platt, U., and Ehhalt,D. H.: Tropospheric OH concentration measurements by laserlong-path absorption spectroscopy, Atmos. Environ., 25A, 2017–2022, 1991.
Ingham, T., Goddard, A., Whalley, L. K., Furneaux, K. L., Edwards,P. M., Seal, C. P., Self, D. E., Johnson, G. P., Read, K. A., Lee,J. D., and Heard, D. E.: A flow-tube based laser-induced fluo-rescence instrument to measure OH reactivity in the troposphere,Atmos. Meas. Tech., 2, 465–477, https://doi.org/10.5194/amt-2-465-2009, 2009.
Kim, S., Guenther, A., Karl, T., and Greenberg, J.: Contributions ofprimary and secondary biogenic VOC tototal OH reactivity dur-ing the CABINEX (Community Atmosphere-Biosphere INterac-tions Experiments)-09 field campaign, Atmos. Chem. Phys., 11,8613–8623, https://doi.org/10.5194/acp-11-8613-2011, 2011.
Kim, S., Sanchez, D., Wang, M., Seco, R., Jeong, D., Hughes,S., Barletta, B., Blake, D. R., Jung, J., Kim, D., Lee, G., Lee,M., Ahn, J., Lee, S. D., Cho, G., Sung, M. Y., Lee, Y. H.,Kim, D. B., Kim, Y., Woo, J. H., Jo, D., Park, R., Park, J.H., Hong, Y. D., and Hong, J. H.: OH reactivity in urbanand suburban regions in Seoul, South Korea – an East Asianmegacity in a rapid transition, Faraday Discuss., 189, 231–251,https://doi.org/10.1039/c5fd00230c, 2016.
Kovacs, T. A. and Brune, W. H.: Total OH LossRate Measurement, J. Atmos. Chem., 39, 105–122,https://doi.org/10.1023/A:1010614113786, 2001.
Kovacs, T. A., Brune, W. H., Harder, H., Martinez, M., Simpas, J.B., Frost, G. J., Williams, E., Jobson, T., Stroud, C., Young, V.,Fried, A., and Wert, B.: Direct measurements of urban OH reac-tivity during Nashville SOS in summer 1999, J. Environ. Moni-tor., 5, 68–74, https://doi.org/10.1039/b204339d, 2003.
Kumar, V. and Sinha, V.: VOC–OHM: A new technique forrapid measurements of ambient total OH reactivity and volatile
organic compounds using a single proton transfer reactionmass spectrometer, Int. J. Mass Spectrom., 374, 55–63,https://doi.org/10.1016/j.ijms.2014.10.012, 2014.
Kumar, V., Chandra, B. P., and Sinha, V.: Large unex-plained suite of chemically reactive compounds present inambient air due to biomass fires, Sci. Rep.-UK, 8, 626,https://doi.org/10.1038/s41598-017-19139-3, 2018.
Lou, S., Holland, F., Rohrer, F., Lu, K., Bohn, B., Brauers, T.,Chang, C. C., Fuchs, H., Häseler, R., Kita, K., Kondo, Y.,Li, X., Shao, M., Zeng, L., Wahner, A., Zhang, Y., Wang,W., and Hofzumahaus, A.: Atmospheric OH reactivities inthe Pearl River Delta – China in summer 2006: measurementand model results, Atmos. Chem. Phys., 10, 11243–11260,https://doi.org/10.5194/acp-10-11243-2010, 2010.
Michoud, V., Hansen, R. F., Locoge, N., Stevens, P. S., and Du-santer, S.: Detailed characterizations of the new Mines Douaicomparative reactivity method instrument via laboratory ex-periments and modeling, Atmos. Meas. Tech., 8, 3537–3553,https://doi.org/10.5194/amt-8-3537-2015, 2015.
Nölscher, A. C., Sinha, V., Bockisch, S., Klüpfel, T., and Williams,J.: Total OH reactivity measurements using a new fast Gas Chro-matographic Photo-Ionization Detector (GC-PID), Atmos. Meas.Tech., 5, 2981–2992, https://doi.org/10.5194/amt-5-2981-2012,2012a.
Nölscher, A. C., Williams, J., Sinha, V., Custer, T., Song, W., John-son, A. M., Axinte, R., Bozem, H., Fischer, H., Pouvesle, N.,Phillips, G., Crowley, J. N., Rantala, P., Rinne, J., Kulmala, M.,Gonzales, D., Valverde-Canossa, J., Vogel, A., Hoffmann, T.,Ouwersloot, H. G., Vilà-Guerau de Arellano, J., and Lelieveld,J.: Summertime total OH reactivity measurements from borealforest during HUMPPA-COPEC 2010, Atmos. Chem. Phys., 12,8257–8270, https://doi.org/10.5194/acp-12-8257-2012, 2012b.
Nölscher, A. C., Bourtsoukidis, E., Bonn, B., Kesselmeier, J.,Lelieveld, J., and Williams, J.: Seasonal measurements of to-tal OH reactivity emission rates from Norway spruce in 2011,Biogeosciences, 10, 4241–4257, https://doi.org/10.5194/bg-10-4241-2013, 2013.
Nölscher, A. C., Butler, T., Auld, J., Veres, P., Muñoz, A.,Taraborrelli, D., Vereecken, L., Lelieveld, J., and Williams, J.:Using total OH reactivity to assess isoprene photooxidationvia measurement and model, Atmos. Environ., 89, 453–463,https://doi.org/10.1016/j.atmosenv.2014.02.024, 2014.
Pfannerstill, E. Y., Nölscher, A. C., Yáñez-Serrano, A. M., Bourt-soukidis, E., Keßel, S., Janssen, R. H. H., Tsokankunku, A.,Wolff, S., Sörgel, M., Sá, M. O., Araújo, A., Walter, D., Lavric,J., Dias-Júnior, C. Q., Kesselmeier, J., and Williams, J.: To-tal OH Reactivity Changes Over the Amazon Rainforest Dur-ing an El Niño Event, Front. For. Glob. Change, 1, 1–17,https://doi.org/10.3389/ffgc.2018.00012, 2018.
Pfannerstill, E. Y., Wang, N., Edtbauer, A., Bourtsoukidis, E., Crow-ley, J. N., Dienhart, D., Eger, P. G., Ernle, L., Fischer, H.,Hottmann, B., Paris, J.-D., Stönner, C., Tadic, I., Walter, D.,Lelieveld, J., and Williams, J.: Shipborne measurements of to-tal OH reactivity around the Arabian Peninsula and its rolein ozone chemistry, Atmos. Chem. Phys., 19, 11501–11523,https://doi.org/10.5194/acp-19-11501-2019, 2019.
Pfannerstill, E. Y., Reijrink, N. G., Edtbauer, A., Ringsdorf, A.,Zannoni, N., Araújo, A., Ditas, F., Holanda, B. A., Sá, M. O.,Tsokanku, A., Walter, D., Wolff, S., Lavric, J. V., Pöhlker, C.,
https://doi.org/10.5194/amt-14-2285-2021 Atmos. Meas. Tech., 14, 2285–2298, 2021
2298 W. Wang et al.: The improved comparative reactivity method (ICRM)
Sörgel, M., and Williams, J.: Total OH reactivity over the Ama-zon rainforest: variability with temperature, wind, rain, altitude,time of day, season, and an overall budget closure, Atmos. Chem.Phys. Discuss. [preprint], https://doi.org/10.5194/acp-2020-752,in review, 2020.
Praplan, A. P., Pfannerstill, E. Y., Williams, J., and Hellen,H.: OH reactivity of the urban air in Helsinki, Fin-land, during winter, Atmos. Environ., 169, 150–161,https://doi.org/10.1016/j.atmosenv.2017.09.013, 2017a.
Praplan, A. P., Pfannerstill, E. Y., Williams, J., and Hel-lén, H.: OH reactivity of the urban air in Helsinki,Finland, during winter, Atmos. Environ., 169, 150–161,https://doi.org/10.1016/j.atmosenv.2017.09.013, 2017b.
Praplan, A. P., Tykkä, T., Chen, D., Boy, M., Taipale, D., Vakkari,V., Zhou, P., Petäjä, T., and Hellén, H.: Long-term total OH re-activity measurements in a boreal forest, Atmos. Chem. Phys.,19, 14431–14453, https://doi.org/10.5194/acp-19-14431-2019,2019.
Sadanaga, Y., Yoshino, A., Watanabe, K., Yoshioka, A., Wakazono,Y., Kanaya, Y., and Kajii, Y.: Development of a measurementsystem of OH reactivity in the atmosphere by using a laser-induced pump and probe technique, Rev. Sci. Instrum., 75, 2648–2655, https://doi.org/10.1063/1.1775311, 2004.
Sadanaga, Y., Yoshino, A., Kato, S., and Kajii, Y.: Measure-ments of OH Reactivity and Photochemical Ozone Production inthe Urban Atmosphere, Environ. Sci. Technol., 39, 8847–8852,https://doi.org/10.1021/es049457p 2005.
Sander, S. P., Finlayson-Pitts, B. J., Friedl, R. R., Golden, D. M.,Huie, R. E., Keller-Rudek, H., Kolb, C. E., Kurylo, M. J., Molina,M. J., Moortgat, G. K., Orkin, V. L., Ravishankara, A. R., andWine, P. H.: Chemical Kinetics and Photochemical Data for Usein Atmospheric Studies Evaluation Number 15, JPL Publication06-2, Jet Propulsion Laboratory, Pasadena, 2006.
Sinha, V., Williams, J., Crowley, J. N., and Lelieveld, J.: The Com-parative Reactivity Method – a new tool to measure total OHReactivity in ambient air, Atmos. Chem. Phys., 8, 2213–2227,https://doi.org/10.5194/acp-8-2213-2008, 2008.
Sinha, V., Custer, T. G., Kluepfel, T., and Williams, J.: The effect ofrelative humidity on the detection of pyrrole by PTR-MS for OHreactivity measurements, Int. J. Mass Spectrom., 282, 108–111,https://doi.org/10.1016/j.ijms.2009.02.019, 2009.
Sinha, V., Williams, J., Lelieveld, J., Ruuskanen, T. M., Kajos,M. K., Patokoski, J., Hellen, H., Hakola, H., Mogensen, D.,Boy, M., Rinne, J., and Kulmala, M.: OH Reactivity Mea-surements within a Boreal Forest: Evidence for UnknownReactive Emissions, Environ. Sci. Technol., 44, 6614–6620,https://doi.org/10.1021/es101780b, 2010.
Sinha, V., Williams, J., Diesch, J. M., Drewnick, F., Martinez, M.,Harder, H., Regelin, E., Kubistin, D., Bozem, H., Hosaynali-Beygi, Z., Fischer, H., Andrés-Hernández, M. D., Kartal, D.,Adame, J. A., and Lelieveld, J.: Constraints on instanta-neous ozone production rates and regimes during DOMINOderived using in-situ OH reactivity measurements, Atmos.Chem. Phys., 12, 7269–7283, https://doi.org/10.5194/acp-12-7269-2012, 2012.
Tan, Z., Lu, K., Hofzumahaus, A., Fuchs, H., Bohn, B., Hol-land, F., Liu, Y., Rohrer, F., Shao, M., Sun, K., Wu, Y., Zeng,L., Zhang, Y., Zou, Q., Kiendler-Scharr, A., Wahner, A., andZhang, Y.: Experimental budgets of OH, HO2, and RO2 rad-
icals and implications for ozone formation in the Pearl RiverDelta in China 2014, Atmos. Chem. Phys., 19, 7129–7150,https://doi.org/10.5194/acp-19-7129-2019, 2019.
Wang, M., Zeng, L., Lu, S., Shao, M., Liu, X., Yu, X., Chen,W., Yuan, B., Zhang, Q., Hu, M., and Zhang, Z.: Develop-ment and validation of a cryogen-free automatic gas chro-matograph system (GC-MS/FID) for online measurements ofvolatile organic compounds, Anal. Methods-UK, 6, 9424–9434,https://doi.org/10.1039/c4ay01855a, 2014a.
Wang, Y., Ying, Q., Hu, J., and Zhang, H.: Spatial and temporalvariations of six criteria air pollutants in 31 provincial capitalcities in China during 2013–2014, Environ. Int., 73, 413–422,https://doi.org/10.1016/j.envint.2014.08.016, 2014b.
Williams, J., Keßel, S. U., Nölscher, A. C., Yang, Y., Lee, Y.,Yáñez-Serrano, A. M., Wolff, S., Kesselmeier, J., Klüpfel,T., Lelieveld, J., and Shao, M.: Opposite OH reactivityand ozone cycles in the Amazon rainforest and megac-ity Beijing: Subversion of biospheric oxidant control byanthropogenic emissions, Atmos. Environ., 125, 112–118,https://doi.org/10.1016/j.atmosenv.2015.11.007, 2016.
Wolfe, G. M., Marvin, M. R., Roberts, S. J., Travis, K. R., and Liao,J.: The Framework for 0-D Atmospheric Modeling (F0AM) v3.1,Geosci. Model Dev., 9, 3309–3319, https://doi.org/10.5194/gmd-9-3309-2016, 2016.
Wu, Y., Yang, Y. D., Shao, M., and Lu, S. H.: Missing in total OHreactivity of VOCs from gasoline evaporation, Chinese Chem.Lett., 26, 1246–1248, 2015.
Yang, Y., Shao, M., Wang, X., Nölscher, A. C., Kessel, S., Guen-ther, A., and Williams, J.: Towards a quantitative understandingof total OH reactivity: A review, Atmos. Environ., 134, 147–161,https://doi.org/10.1016/j.atmosenv.2016.03.010, 2016.
Yang, Y., Shao, M., Keßel, S., Li, Y., Lu, K., Lu, S., Williams,J., Zhang, Y., Zeng, L., Nölscher, A. C., Wu, Y., Wang, X.,and Zheng, J.: How the OH reactivity affects the ozone produc-tion efficiency: case studies in Beijing and Heshan, China, At-mos. Chem. Phys., 17, 7127–7142, https://doi.org/10.5194/acp-17-7127-2017, 2017.
Yuan, B., Koss, A. R., Warneke, C., Coggon, M., Sekimoto, K., andde Gouw, J. A.: Proton-Transfer-Reaction Mass Spectrometry:Applications in Atmospheric Sciences, Chem. Rev., 117, 13187–13229, https://doi.org/10.1021/acs.chemrev.7b00325, 2017.
Zannoni, N., Dusanter, S., Gros, V., Sarda Esteve, R., Michoud, V.,Sinha, V., Locoge, N., and Bonsang, B.: Intercomparison of twocomparative reactivity method instruments inf the Mediterraneanbasin during summer 2013, Atmos. Meas. Tech., 8, 3851–3865,https://doi.org/10.5194/amt-8-3851-2015, 2015.
Zannoni, N., Gros, V., Lanza, M., Sarda, R., Bonsang, B., Kalo-gridis, C., Preunkert, S., Legrand, M., Jambert, C., Boissard,C., and Lathiere, J.: OH reactivity and concentrations of bio-genic volatile organic compounds in a Mediterranean forestof downy oak trees, Atmos. Chem. Phys., 16, 1619–1636,https://doi.org/10.5194/acp-16-1619-2016, 2016.
Zannoni, N., Gros, V., Sarda Esteve, R., Kalogridis, C., Michoud,V., Dusanter, S., Sauvage, S., Locoge, N., Colomb, A., and Bon-sang, B.: Summertime OH reactivity from a receptor coastal sitein the Mediterranean Basin, Atmos. Chem. Phys., 17, 12645–12658, https://doi.org/10.5194/acp-17-12645-2017, 2017.
Atmos. Meas. Tech., 14, 2285–2298, 2021 https://doi.org/10.5194/amt-14-2285-2021


![ICRM Care Staff Train 24-28 July 2011 [Compatibility Mode]](https://img.pdfslide.net/doc/110x75/577d26f61a28ab4e1ea2a8db/icrm-care-staff-train-24-28-july-2011-compatibility-mode.jpg)