Embed Size (px)
Citation preview
The L ight ing Guide 2021 GROWERTALKS 1
GROWERTALKS
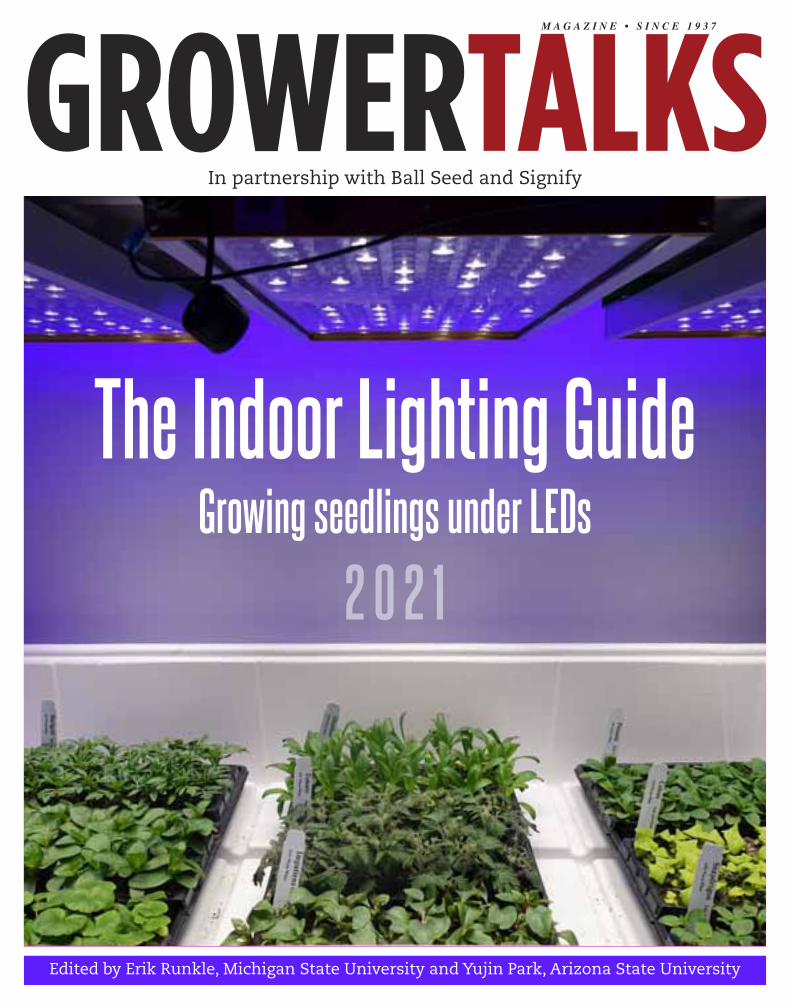
The Indoor Lighting Guide Growing seedlings under LEDs
In partnership with Ball Seed and Signify
2 0 2 1
Edited by Erik Runkle, Michigan State University and Yujin Park, Arizona State University
M A G A Z I N E • S I N C E 1 9 3 7
2 GROWERTALKS The L ight ing Guide 2021
EDITORIAL
EDITOR Chris Beytes [email protected]
MANAGING EDITOR Jennifer Zurko RETAIL EDITOR Jennifer Polanz
SENIOR EDITOR-AT-LARGE Ellen C. Wells SENIOR EDITOR/DIGITAL EDITOR Bill Calkins
COLUMNISTS
Stephanie Berkhout, Austin Bryant, Dr. Brian Corr, Albert Grimm, Roger McGaughey,
Amy Morris, Art Parkerson, Paul Pilon, Bill Swanekamp, Abe VanWingerden
CONTRIBUTING WRITERS
Anne-Marie Hardie, Society of American Florists, AmericanHort
PRODUCTION MANAGER Kathy Wootton
CREATIVE DIRECTOR Chris Truesdale PHOTOGRAPHER Mark Widhalm
COPY EDITOR Sue Olsen
SALES 866.888.4237
PUBLISHER, SALES MANAGER Paul Black [email protected]
ACCOUNT MANAGER Kim Brown [email protected]
SALES ASSISTANT Adriana Heikkila [email protected]
PUBLISHING ASSISTANT Denielle Noe [email protected]
CLASSIFIED ADVERTISING [email protected]
GrowerTalks (ISSN 0276-9433) is published monthly by Ball Publishing, PO Box 1660, West Chicago, Illinois 60186, United
States. Subscriptions are free to qualified readers in the US. Subscription price for non-qualified readers is $35 per year US and
Canada. All other foreign subscriptions must pay $99/year to receive/continue to receive GrowerTalks and Green Profit.
GrowerTalks is a registered trademark of Ball Horticultural Company in the U.S. Periodicals postage paid at West Chicago, IL and at additional mailing offices. Postmaster: send address changes to
GrowerTalks Magazine, PO Box 1660, West Chicago, Illinois 60186, United States. ©2021 Ball Horticultural Company. All rights
reserved. Posted under Canada publications mail agreement #40732015. Canada returns to be sent to International Delivery Solutions, PO Box 456, Niagara Falls, ON L2E 6V2, Canada.
Printed in the U.S.A.
GreenProfit Supplement Enclosed
A Friend Remembered G. Victor Ball, Editor from 1949-1997
GrowerTalks general offices are located at: PO BOX 1660, West Chicago, Illinois 60186 U.S.A.
PH: 630.231.3675 FAX: 630.231.5254 TOLL-FREE: 1-888-888-0013
www.growertalks.com
ello friends, From the very first planting, to emergence, transplant and on
through finishing, light remains a vital constant in successful greenhouse production. Research, and numerous successful commercial installations, shows that growers can achieve better uniformity, quicker turns, healthier plants and scheduling predictability—alleviating a lot of headaches when it’s time to fill customer orders.
Together, Signify and Ball Seed have studied the advantages offered by Philips LED Lighting through several research studies. LED lighting continues to demonstrate significant benefits for growing a variety of crops—annuals, perennials, tomatoes, cucumbers, berries, leafy greens and herbs.
In these pages, we proudly collaborate to provide growers with the latest research on LED lighting. As a certified Philips Lighting partner, Ball Seed stands ready to help you color the world as you make the transition to this technology and experience the power of horticulture LED lighting.
About the Authors Erik Runkle ([email protected]) is a Professor and Floriculture Extension Specialist at Michigan State University (MSU). Yujin Park earned a Ph.D. degree at MSU and is currently an Assistant Professor at Arizona State University. Mengzi Zhang received an M.S. degree at MSU and is currently a Biological Scientist at the Mid-Florida Research & Education Center for the University of Florida (UF). Paul Fisher is a Professor and Extension Specialist ([email protected]), Celina Gómez is an Assistant Professor, and Megh Poudel is a PhD student at UF. Annika Kohler is a Research Technician at MSU.
Ricardo Campos Manager LED Solutions, Ball Seed
Udo van Slooten Business Leader Horticulture LED Solutions, Signify (formerly Philips Lighting)
H

Erik Runkle
Professor of Horticulture Michigan State University
he science and engineering of plant lighting has advanced tremendously in the past decade. Light
from LEDs has enabled new approaches to how we grow plants, changed our production practices and oftentimes improved crop quality. Almost 10 years ago, we started looking at the indoor production of ornamental transplants to shorten crop production time, induce or prevent early flowering, and most importantly, produce consistent crops week after week.
This guide provides research-based information about producing young plants indoors (without sunlight) under LEDs. We’ve learned about how different colors (or wavebands) of light influence plant growth and flowering—and much of that information is summarized here. Paul Fisher and colleagues at the University of Florida have also provided information on the economics of indoor growing of transplants. Most of these articles were originally published in GrowerTalks in 2019, but they’ve all been updated and compiled into this guide.
On behalf of co-editor Yujin Park, who obtained her Ph.D. with me at Michigan State University (MSU) and is now an assistant professor at Arizona State University, we thank the co-authors of these articles for their valuable contrib-utions towards advancing the science and application of indoor lighting.
We thank the American Floral Endowment, MSU’s Project GREEEN, and the USDA Floriculture and Nursery Research Initiative for financially supporting this research. We thank Osram and Osram Opto Semiconductors for development of the lighting systems used in most of the studies, and Raker-Roberta’s, PanAmerican Seed, and Syngenta Flowers for donation of plant materials. We also thank companies that support floriculture research at MSU, as well as partners of the Floriculture Research Alliance. Finally, we thank Signify and Ball Seed for their sponsorship of this guide.
The L ight ing Guide 2021 GROWERTALKS 3
T 2 Letter from Ball Seed & Signify
3 Introduction by Erik Runkle
4 Lighting Young Plants Indoors Can the costs of LEDs be offset by the production of more consistent and uniform transplants, reduced shrinkage, reduced usage of inputs, and decreased young plant and finish crop times? by Erik Runkle, Yujin Park, Mengzi Zhang & Paul Fisher
8 Far-Red & Light Intensity Interaction The effects of adding far-red light in indoor LED lighting on ornamental seedling growth and subsequent flowering under low and high light conditions. by Yujin Park & Erik Runkle
12 The Interaction of Blue & Far-Red Light How far-red light interacts with blue light to regulate extension growth, leaf chlorophyll concentration and subsequent flowering of ornamental seedlings. by Yujin Park & Erik Runkle
15 The Economics of Lighting Young Plants Indoors Indoor growing of transplants can enable a high level of growth and quality control, but the key question for commercial-ization is: “Does it pay?” by Paul Fisher, Celina Gómez, Megh Poudel & Erik Runkle
20 A Little Far-Red Light Goes a Long Way How much far-red light is needed, at two different levels of blue light, to elicit desired plant responses in a range of floriculture crop seedlings? by Mengzi Zhang, Yujin Park & Erik Runkle
22 End-of-Production Lighting Indoors By producing plants indoors under sole-source lighting, not only can we control plant traits by manipulating the light quality and/or quantity, but we can potentially produce more resilient plants that better tolerate stress. by Annika Kohler & Erik Runkle

4 GROWERTALKS The L ight ing Guide 2021
Transplant production is a significant segment of the floriculture industry in the U.S. According to the USDA, the wholesale value of young plants sold in 2019 was $315 million for the 17 states surveyed. In addition to excluding 33 states, this value doesn’t include plugs and liners propagated and transplanted by the same company, so the actual value of the young plant production in-dustry is much higher.
The growing environment, especially temperature and light, greatly in-fluences plant quality and consistency. Because most young plants are grown during the late winter and early spring, significant production costs for many greenhouse growers in northern lati-tudes result from heating to maintain a suitably warm growing temperature and supplemental lighting to increase plant quality. In addition, daily and seasonal changes in weather conditions chal-lenge growers to maintain the consis-tency of greenhouse growing conditions. Variability in growing conditions during the transplant stage usually leads to variability in flowering time and quality of finished plants.
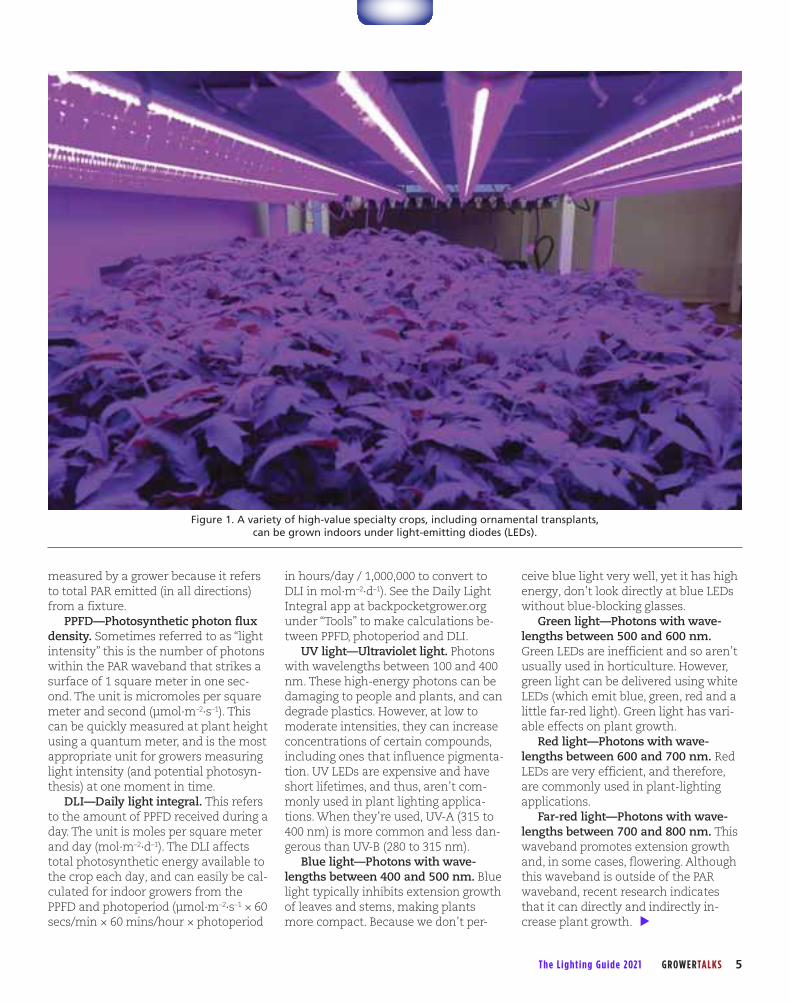
To overcome these production chal-lenges, growers are increasingly inter-ested in producing young plants indoors with energy-efficient and long-lasting light-emitting diodes (LEDs; Figure 1). The possibility of controlling the light spectrum with LEDs offers a way to use light to regulate plant growth and devel-opment processes, and thus, produce consistent crops more rapidly with more desirable characteristics. The con-trolled-environment conditions can also increase the success rate of propaga-tion, which decreases shrinkage and requires less labor (or automation) to patch empty cells in plug or liner trays.
However, indoor production is expen-sive. Many indoor farmers report that
their three greatest production costs are labor, electricity (for lighting and air conditioning), and depreciation of cap-ital costs. Can these high costs be offset by the production of more consistent and uniform transplants, reduced shrinkage, reduced usage of pesticides and growth retardants, and decreased young plant and finish crop times? Growers are finding that for some crops—especially expensive transplants for which shrinkage rate is high—the answer is yes.
Edibles vs. ornamentals Indoor (vertical) farming is rapidly ex-panding in many parts of the world, par-ticularly in North America, northern Europe, the Middle East and much of Asia. Indoor farming usually refers to the production of high-value vegetable crops, such as leafy greens (i.e., lettuce and kale). These crops have year-round demand, a short growth habit and a short production cycle.
While there are some similarities with producing young ornamentals in-doors, there are also differences. The de-mand for most ornamental transplants is seasonable, so year-round indoor op-eration usually necessitates producing different crops during the year. The characteristics desired for leafy greens (large leaves with consideration of taste, texture, leaf color and nutritional content) differ from those for ornamen-tals (compact growth, well rooted, and early or late flowering). The light spec-trum influences many of these quality parameters and indoor lighting for leafy greens may not be optimal for ornamentals.
In 2011, we started researching in-door LED lighting on seedling plugs using custom-designed LED growing modules (Figure 2). We’ve learned a lot about how different colors (wavebands)
of light influence growth and sub-sequent flowering of floriculture crops. Research expanded in 2017 with the de-velopment of the Controlled Environ-ment Lighting Laboratory at Michigan State University (Figure 3).
One of our focal points has been far-red light, which the human eye cannot see, but plants perceive and respond to. Far-red light promotes extension growth of leaves and stems, and for some plants can influence flower initiation and development. We’ve also learned that far-red light interacts with other light wavebands, especially blue light, to regulate growth attributes. Specific research-based information about the light spectrum is presented in the next several articles of this guide. We also discuss the economics of growing young plants indoors, led by colleagues at the University of Florida.
Light wavebands and terms There are five wavebands of light that regulate plant growth and development. The human eye can see some wave-bands (blue, green and red light), but not the others (UV and far-red light). Below are common terms used for plant lighting, followed by brief descriptions of the five light wavebands:
PAR—Photosynthetically active radiation. This refers to the waveband of light from 400 to 700 nanometer (nm). These photons have the energy that powers photosynthesis. When measuring light for photosynthesis, use a sensor that measures in the PAR range.
PPF—Photosynthetic photon flux. This refers to the number of photons within the PAR waveband that’s emitted from a light source. It’s expressed in mi-cromoles per second (μmol·s–1). This unit is usually reported by horticultural light manufacturers and isn’t easily
By Erik Runkle, Yujin Park, Mengzi Zhang & Paul Fisher
Lighting Young Plants Indoors
The L ight ing Guide 2021 GROWERTALKS 5
measured by a grower because it refers to total PAR emitted (in all directions) from a fixture.
PPFD—Photosynthetic photon flux density. Sometimes referred to as “light intensity” this is the number of photons within the PAR waveband that strikes a surface of 1 square meter in one sec-ond. The unit is micromoles per square meter and second (μmol·m–2·s–1). This can be quickly measured at plant height using a quantum meter, and is the most appropriate unit for growers measuring light intensity (and potential photosyn-thesis) at one moment in time.
DLI—Daily light integral. This refers to the amount of PPFD received during a day. The unit is moles per square meter and day (mol·m–2·d–1). The DLI affects total photosynthetic energy available to the crop each day, and can easily be cal-culated for indoor growers from the PPFD and photoperiod (μmol·m–2·s–1 × 60 secs/min × 60 mins/hour × photoperiod
in hours/day / 1,000,000 to convert to DLI in mol·m–2·d–1). See the Daily Light Integral app at backpocketgrower.org under “Tools” to make calculations be-tween PPFD, photoperiod and DLI.
UV light—Ultraviolet light. Photons with wavelengths between 100 and 400 nm. These high-energy photons can be damaging to people and plants, and can degrade plastics. However, at low to moderate intensities, they can increase concentrations of certain compounds, including ones that influence pigmenta-tion. UV LEDs are expensive and have short lifetimes, and thus, aren’t com-monly used in plant lighting applica-tions. When they’re used, UV-A (315 to 400 nm) is more common and less dan-gerous than UV-B (280 to 315 nm).
Blue light—Photons with wave-lengths between 400 and 500 nm. Blue light typically inhibits extension growth of leaves and stems, making plants more compact. Because we don’t per-
ceive blue light very well, yet it has high energy, don’t look directly at blue LEDs without blue-blocking glasses.
Green light—Photons with wave-lengths between 500 and 600 nm. Green LEDs are inefficient and so aren’t usually used in horticulture. However, green light can be delivered using white LEDs (which emit blue, green, red and a little far-red light). Green light has vari-able effects on plant growth.
Red light—Photons with wave-lengths between 600 and 700 nm. Red LEDs are very efficient, and therefore, are commonly used in plant-lighting applications.
Far-red light—Photons with wave-lengths between 700 and 800 nm. This waveband promotes extension growth and, in some cases, flowering. Although this waveband is outside of the PAR waveband, recent research indicates that it can directly and indirectly in-crease plant growth.
Figure 1. A variety of high-value specialty crops, including ornamental transplants, can be grown indoors under light-emitting diodes (LEDs).
u
6 GROWERTALKS The L ight ing Guide 2021
LED lighting considerations There are several important considerations when selecting an indoor lighting system and below are some of the major ones. Many of these factors are also relevant to greenhouse supplemental lighting installations.
Fixture type. LEDs have been developed for a variety of plant applications, including as supplemental lighting, photoperiodic lighting, inter-canopy lighting and indoor (sole-source) lighting. Choose among fix-tures that were designed specifically for in-door lighting. Fixtures designed for supplemental lighting usually emit too much light, while those developed for pho-toperiodic lighting usually emit too little.
Light intensity. A target DLI for many young plants is 8 to 12 mol·m–2·d–1 for both greenhouse and indoor production. This can be achieved by delivering a PPFD of 125 to 175 μmol·m–2·s–1 with a photoperiod of 16 to 20 hours. Higher light intensities usually produce higher-quality transplants in a shorter period of time and subsequent flow-ering time is typically decreased. Lower in-tensities are sometimes more appropriate when transitioning tissue-cultured plants from vessels to propagation trays and for some shade-growing plants, such as ferns or some types of orchids.
Light spectrum. Arguably the greatest challenge when selecting an LED fixture for indoor production is its light spectrum. The articles in this guide provide detailed infor-mation on how different light wavebands regulate seedling growth and quality. Based on this, we can make some general conclusions:
n Far-red light increases stem length and leaf size. It also accelerates flowering of some long-day plants. As little as 20 μmol·m–2·s–1 of far-red light is needed to pro-mote flowering of the most sensitive species. However, the inclusion of far-red light has little to no effect on flowering of day-neutral or short-day plants.
n Blue light inhibits stem length and leaf size, but has little effect on flowering. There-fore, a moderate intensity of blue light, such as 40 to 60 μmol·m–2·s–1, is suggested when compact growth is desired.
n Fixtures that contain only blue and red LEDs are usually more efficient than those that include white LEDs, but their purplish light distorts colors and may create a diffi-cult working environment for staff.
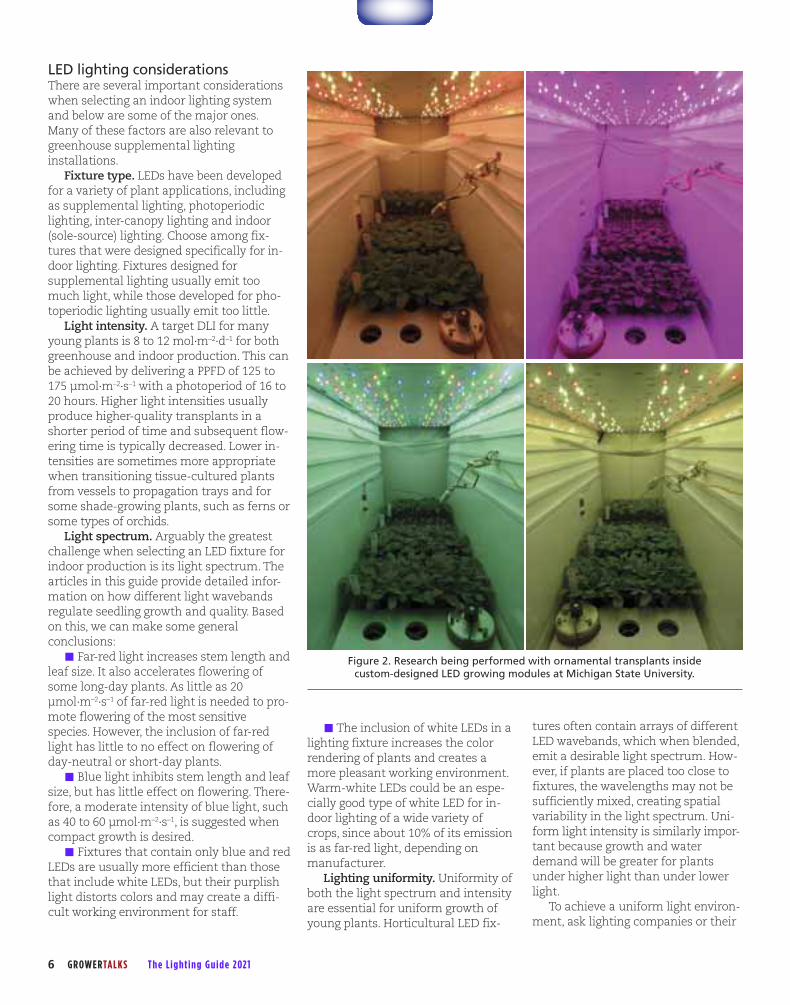
Figure 2. Research being performed with ornamental transplants inside custom-designed LED growing modules at Michigan State University.
n The inclusion of white LEDs in a lighting fixture increases the color rendering of plants and creates a more pleasant working environment. Warm-white LEDs could be an espe-cially good type of white LED for in-door lighting of a wide variety of crops, since about 10% of its emission is as far-red light, depending on manufacturer.
Lighting uniformity. Uniformity of both the light spectrum and intensity are essential for uniform growth of young plants. Horticultural LED fix-
tures often contain arrays of different LED wavebands, which when blended, emit a desirable light spectrum. How-ever, if plants are placed too close to fixtures, the wavelengths may not be sufficiently mixed, creating spatial variability in the light spectrum. Uni-form light intensity is similarly impor-tant because growth and water demand will be greater for plants under higher light than under lower light.
To achieve a uniform light environ-ment, ask lighting companies or their
The L ight ing Guide 2021 GROWERTALKS 7
suppliers to create a lighting plan spe-cific to your operation. The plan should indicate the number and placement of the fixtures, and ex-pected light intensity and uniformity within the growing region. Once in-stalled, make a grid of measurement locations at crop canopy height and measure the PPFD with a high-quality quantum meter. This will allow you to create your own light map and check the light intensity actually being delivered.
Fixture efficacy. The relevant measure for converting electricity to crop growth is photosynthetic photon efficacy, which refers to the efficiency of a fixture at converting electrical energy into photons within the PAR waveband. It’s reported in the unit of μmol·J–1 (micromoles of PAR light per joule of electrical input). As a point of comparison with older fixtures, T8 fluorescents have a photosynthetic photon efficacy of about 0.85 μmol·J–1. Today, LED fixtures for indoor applica-tions have efficacy values of more
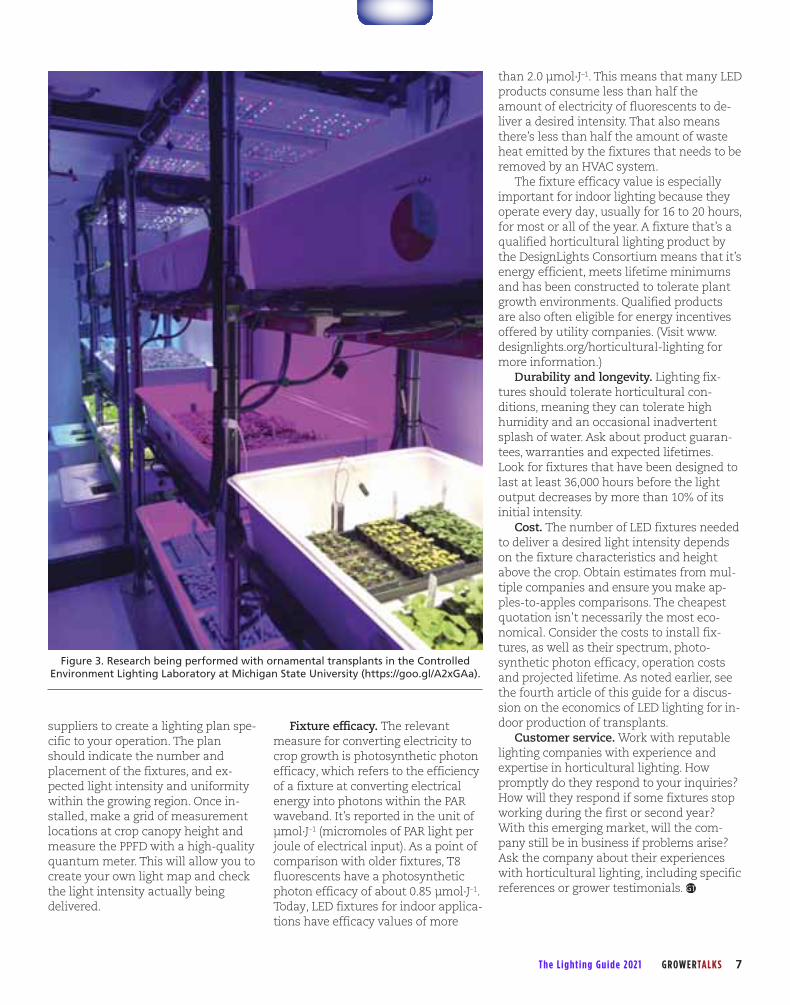
Figure 3. Research being performed with ornamental transplants in the Controlled Environment Lighting Laboratory at Michigan State University (https://goo.gl/A2xGAa).
than 2.0 μmol·J–1. This means that many LED products consume less than half the amount of electricity of fluorescents to de-liver a desired intensity. That also means there’s less than half the amount of waste heat emitted by the fixtures that needs to be removed by an HVAC system.
The fixture efficacy value is especially important for indoor lighting because they operate every day, usually for 16 to 20 hours, for most or all of the year. A fixture that’s a qualified horticultural lighting product by the DesignLights Consortium means that it’s energy efficient, meets lifetime minimums and has been constructed to tolerate plant growth environments. Qualified products are also often eligible for energy incentives offered by utility companies. (Visit www. designlights.org/horticultural-lighting for more information.)
Durability and longevity. Lighting fix-tures should tolerate horticultural con-ditions, meaning they can tolerate high humidity and an occasional inadvertent splash of water. Ask about product guaran-tees, warranties and expected lifetimes. Look for fixtures that have been designed to last at least 36,000 hours before the light output decreases by more than 10% of its initial intensity.
Cost. The number of LED fixtures needed to deliver a desired light intensity depends on the fixture characteristics and height above the crop. Obtain estimates from mul-tiple companies and ensure you make ap-ples-to-apples comparisons. The cheapest quotation isn’t necessarily the most eco-nomical. Consider the costs to install fix-tures, as well as their spectrum, photo- synthetic photon efficacy, operation costs and projected lifetime. As noted earlier, see the fourth article of this guide for a discus-sion on the economics of LED lighting for in-door production of transplants.
Customer service. Work with reputable lighting companies with experience and expertise in horticultural lighting. How promptly do they respond to your inquiries? How will they respond if some fixtures stop working during the first or second year? With this emerging market, will the com-pany still be in business if problems arise? Ask the company about their experiences with horticultural lighting, including specific references or grower testimonials.

Indoor plant production enables growers to precisely control environ-mental conditions—such as light, temperature, humidity and CO2 concen-tration—to consistently produce uniform crops. In addition, using light-emitting diodes (LEDs) indoors makes it possible to manipulate the light spec-trum to elicit desirable plant attributes, such as compact growth and early or late flowering in ornamentals. Plant traits that can be modified by the light spectrum include, but are not limited to, stem extension, compactness, leaf size and color, and flowering time.
Most of the plant research with LED lighting has focused on blue (400 to 500 nm) and red (600 to 700 nm) light. Red light can drive photosynthesis, but some blue light is usually necessary for nor-mal plant growth and development. Increasing the portion of blue light gen-erally promotes plant pigmentation and
suppresses extension growth, resulting in more compact plants. The influence of including additional wavebands, such as far-red (700 to 800 nm) light, has been explored more recently. Including far-red light in indoor lighting can in-crease leaf expansion and growth, and accelerate flowering in some floricul-ture crops.
Plant leaves absorb most light within the photosynthetically active radiation waveband (400 to 700 nm). Far-red light is poorly absorbed, and most is trans-mitted through or reflected by leaves. Thus, shading from plants causes a de-crease in the red to far-red ratio (R:FR). Plants perceive the changes in the R:FR and regulate growth in an attempt to better survive under shade conditions. As the R:FR decreases (or as relative por-tion of far-red light increases), shade-avoidance responses—such as stem elongation, leaf expansion and early flowering—are stimulated. Plant re-sponses can be described by the R:FR or by the far-red fraction (FR/R+FR). The far-red fraction is the intensity of far-red light relative to the intensity of red plus far-red light.
Plant responses regulated by far-red light are also under the control of light intensity (photosynthetic photon flux density or PPFD) and blue light intensity. For example, extension growth can be suppressed with increasing PPFD and blue light intensity. Plant growth (bio-mass accumulation) and subsequent flowering are promoted with increasing PPFD or daily light integral. Thus, far-red light can interact with PPFD and blue light intensity to regulate plant growth and development.
We investigated how PPFD influences the effects of adding far-red light on seedling growth and subsequent flower-ing in three floriculture crops. When plant lighting includes blue light, in-creasing the PPFD of the whole spec-trum increases the blue light intensity. To avoid confounding effects from blue light intensity, we tested the effects of PPFD at a constant blue light intensity by increasing PPFD with red light. (In the article on page 12, we share our findings about how far-red light interacts with blue light intensity to regulate growth attributes of young plants.)
By Yujin Park & Erik Runkle
Far-Red & Light Intensity Interaction
Lighting treatments B32R64 B32R64 B32R64 B32R256
B32R256 B32R256 FR32 FR64 FR128 FR256 View inside each chamber
R:FR ratio 1:0 2:1 1:1 1:0 2:1 1:1 FR fraction 0 0.33 0.50 0 0.33 0.50 PPFD (400-700 nm) 96 288
Table 1. The ratio of red (R, 600 to 700 nm) to far-red (FR, 700 to 800 nm) light, FR frac-tion (FR/R+FR) and photosynthetic photon flux density (PPFD values in µmol·m–2·s–1) of six sole-source lighting treatments. The subscript value after each LED type (B=blue; R=red; FR=far-red) indicates its photon flux density in µmol·m–2·s–1.
8 GROWERTALKS The L ight ing Guide 2021

The L ight ing Guide 2021 GROWERTALKS 9
Experimental protocol Seeds of Geranium Pinto Premium Orange Bicolor, Petunia Wave Blue and Coleus Wizard Golden were sown in 128-cell plug trays by Raker-Roberta’s and received at Michigan State University (MSU) about one week later. When the first true leaves emerged, the seed-lings were thinned to one plant per cell. They were then grown under six LED lighting treatments in a re-frigerated growth chamber at a constant 68F (20C) and an 18-hour photoperiod. Six LED lighting treat-ments were provided by different mixtures of blue, red and/or far-red LEDs to investigate how far-red light influenced growth at two PPFDs, 96 μmol∙m–2∙s–1 (PPFD 96) and 288 μmol∙m–2∙s–1 (PPFD 288;
Table 1). This meant that the seed-lings were grown under daily light integrals of 6.2 and 18.7 mol∙m–2∙d–1, which represent low and high light conditions, respectively. Growth at-tributes of seedlings were eval-uated after approximately three to five weeks under the LEDs, when they were ready for transplant.
In addition, at the end of the plug stage, we transplanted seed-lings into 4-in. pots and sub-sequently grew them in a common greenhouse at 68F with a 16-hour photoperiod to determine whether the lighting treatments had any re-sidual effects after transplant. For geranium and petunia, days to the first open flower from transplant, the number of visible flower buds or inflorescences, and plant height
at flowering were evaluated. For coleus, plant height was evaluated when they were considered of marketable size. The experiment was per-formed twice in time and data were statistically analyzed. No plant growth regulators were applied.
Research results Stem elongation and leaf expansion. At the con-stant blue light intensity, the PPFD had little to no effect on seedling height (Figure 1). At both PPFDs, seedling height of all species increased as far-red light was added. The addition of far-red also in-creased the total leaf area of petunia at both
Figure 1. Influence of adding far-red light on seedling height (values in cm) of petunia, geranium and coleus. The subscript value after each LED type (B=blue; R=red; FR=far-red) indicates its photon flux density in µmol·m–2·s–1. Seedling heights followed by the same letter are statistically similar.
Figure 2. Influence of adding far-red light on shoot dry weight of petunia and coleus grown under a photosynthetic photon flux density (PPFD) of 96 or 288 µmol·m–2·s–1 (see Table 1 for details). The far-red fraction was calculated as the photon flux density of far-red (FR, 700 to 800 nm) divided by the sum of the red (R, 600 to 700 nm) and far-red photon flux density (FR/R+FR). Each data point represents the mean and standard error. Associated correlation coefficients (R2) and the percentage increase are presented when statistically significant. * or ** indicate significant at P<0.05 or 0.01, respectively.
B32R64 B32R64 B32R64 B32R256
B32R256 B32R256 FR32 FR64 FR128 FR256
0.5 c 5.9 ab 7.4 a 0.7 c 3.1 bc 5.7 ab
3.8 b 5.8 ab 6.5 a 3.9 b 5.3 ab 6.1 a
1.6 c 3.3 ab 3.5 a 1.8 bc 3.4 ab 4.2 a
Petunia ‘Wave Blue’
Coleus ‘Wizard Golden’
Geranium ‘Pinto Premium Orange Bicolor’
100
80
60
40
20
0
160
140
120
100
80
60
40
20
0
Sho
ot
Dry
Wei
gh
t (m
g)
Petunia ‘Wave Blue’
Coleus ‘Wizard Golden’
0.0 0.1 0.2 0.3 0.4 0.5 0.6
+50% (R2=0.81**)
+54% (R2=0.72*)
+31% (R2=0.49*)
+33% (R2=0.64**)PPFD 96 PPFD 288
FR Fraction (FR/R+FR)
u

B32R64 B32R64 B32R64 B32R256
B32R256 B32R256 FR32 FR64 FR128 FR256
10 GROWERTALKS The L ight ing Guide 2021
PPFDs, while coleus showed similar trends only under the low PPFD. Generally, stem elon-gation and leaf expansion in-creased linearly as the portion of the added far-red light in-creased. In geranium, lighting treatments had little or no ef-fect on total leaf area.
Dry weight. Shoot dry weight is a good indicator of plant growth. Increasing the portion of far-red light in-creased the shoot dry weight linearly, regardless of PPFD, by up to 50% to 54% (in petunia) and 31% to 33% (in coleus; Fig-ure 2). Independently, increas-ing PPFD from 96 to 288 μmol∙m–2∙s–1 increased the shoot dry weight by 130% to 135% (in petunia) and 142% to 150% (in coleus).
In petunia, shoot dry weight increased linearly with total leaf area at both PPFDs, indi-cating that inclusion of far-red light can increase plant growth, at least partly by increasing leaf size. There was little or no effect of far-red light and PPFD on shoot dry weight of geranium.
Subsequent flowering and plant height at finishing. In the long-day plant petunia, the addition of far-red light during the seedling stage accelerated subsequent flowering by seven to 11 days at both PPFDs (Fig-ure 3). At each PPFD, flowering was promoted similarly when the R:FR was 2:1 or lower. The addition of far-red light under PPFD 96 accelerated flowering by 11 days, whereas it only ac-celerated flowering by seven days at PPFD 288.
In day-neutral geranium, the addition of far-red had no effect on flowering at each PPFD. However, the plants grown under the higher PPFD with far-red light flowered nine or 10 days earlier than plants grown under the lower PPFD without far-red light. The light-
Figure 3. Influence of adding far-red light during the seedling stage on days to subsequent flower of petunia and geranium from transplant. The subscript value after each LED type (B=blue; R=red; FR=far-red) indicates its photon flux density in µmol·m–2·s–1. Days to subsequent flower from transplant followed by the same letter are statistically similar.
Figure 4. Influence of adding far-red light during the seedling stage on plant height (in cm) of coleus at the finishing stage. The subscript value after each LED type (B=blue; R=red; FR=far-red) indicates its photon flux density in µmol·m–2·s–1. Plant heights followed by the same letter are statistically similar.
ing treatments had no effect on stem length at flowering in geranium and petunia. Simi-larly, stem length of coleus at the finishing stage was similar, regardless of lighting treatments during the seedling stage (Figure 4).
Conclusions Light intensity and quality interact to regu-late plant growth and development, and thus, the spectral effects of specific wave-lengths can vary depending on the spectral and intensity combination. Here, we investi-gated the effects of adding far-red light in in-door LED lighting on ornamental seedling growth and subsequent flowering under low and high light conditions.
Our results show the inclusion of far-red light can promote seedling growth, regard-less of light intensity, when blue light inten-sity is kept constant. However, far-red and light intensity interact to regulate the sub-sequent flowering. In long-day petunia, far-red had a greater effect on accelerating subsequent flowering under the lower light intensity than under the higher light inten-sity. In day-neutral geranium, far-red light promoted subsequent flowering only under the higher light intensity.
B32R64 B32R64 B32R64 B32R256
B32R256 B32R256 FR32 FR64 FR128 FR256
27 a 16 c 16 c 19 b 14 cd 12 d
44 a 44 a 41 ab 41 ab 35 a 34 b
Petunia ‘Wave Blue’
Geranium ‘Pinto Premium Orange Bicolor’
12.2 a 13.8 a 13.0 a 12.3 a 14.1 a 13.4 a
Coleus ‘Wizard Golden’


The terms light quality and light quantity are often confused or used interchangeably. Light quantity refers to the intensity or total number of photons. The most common light intensity meas-urement is photosynthetic photon flux density, or PPFD, which is the total number of photons from 400 to 700 nm.
In contrast, light quality refers to the spectral distribution of light. In more simplistic terms, light quality refers to the color of light, while light intensity refers to its brightness.
The effects of light quality on plant growth and development are affected by individual wave-bands of light and their intensity, but also interact with one another. For example, plant responses to far-red (700 to 800 nm) light can depend on blue (400 to 500 nm) light intensity.
In the article on page 8 of this guide, we presented information about how far-red light interacts with PPFD to regulate seedling growth and subsequent flowering in three floriculture crops grown under a fixed blue light intensity. We concluded that the inclusion of far-red light can promote seedling growth, regardless of PPFD, when blue light intensity is kept constant. However, the promotive effects of far-red light on subsequent flowering depend on the PPFD.
By Yujin Park & Erik Runkle
The Interaction of Blue & Far-Red Light
Lighting treatments R160 R160 R160 B80R80
B80R80 B80R80 FR20 FR160 FR10 FR80 View inside each chamber
R:FR ratio 1:0 8:1 1:1 1:0 8:1 1:1 FR fraction 0 0.11 0.50 0 0.11 0.50 B light intensity 0 80
Table 1. The ratio of red (R, 600 to 700 nm) to far-red (FR, 700 to 800 nm) light, the FR fraction (FR/R+FR) and blue (B) photon flux density (values in µmol·m–2·s–1) of six sole-source lighting treatments. The subscript value after each LED type (B=blue; R=red; FR=far-red) indicates its photon flux density in µmol·m–2·s–1.
12 GROWERTALKS The L ight ing Guide 2021
Figure 1. Seedling heights (cm) of petunia, geranium and coleus at the transplant stage. Seedlings were grown at 68F (20C) under six indoor LED lighting treatments. The subscript value after each LED type (B=blue; R=red; FR=far-red) indicates its photon flux density in µmol·m–2·s–1. Seedling heights followed by the same letter are statistically similar.
R160 R160 R160 B80R80
B80R80 B80R80 FR20 FR160 FR10 FR80
Petunia ‘Wave Blue’
0.6 b 1.3 ab 4.5 a 0.5 b 0.6 b 1.1 ab
4.5 c 6.0 b 9.2 a 3.6 c 4.4 c 5.8 b
5.0 c 5.0 b 8.9 a 1.4 c 1.6 c 1.9 c
Coleus ‘Wizard Golden’
Geranium ‘Pinto Premium Orange Bicolor’
25
20
15
10
5
0
50
40
30
20
10
0
60
50
40
30
20
10
0
SPA
D V
alu
e
Petunia
-28% (R2=0.55***)
Geranium
Coleus
-21% (R2=0.50***)
-24% (R2=0.55***)
-41% (R2=0.55***)
R160 B80R80
0.0 0.1 0.2 0.3 0.4 0.5 0.6
FR Fraction (FR/R+FR)
The L ight ing Guide 2021 GROWERTALKS 13
The effects of far-red and blue light on plant growth and development have often been investigated individually. In general, far-red promotes stem elon-gation, leaf expansion and subsequent flowering in some long-day plants, but can also make leaves slightly less green because of reduced chlorophyll concen-tration. In contrast, blue light usually suppresses extension growth and in-creases leaf chlorophyll concentration.
In this study, we investigated how far-red light interacts with blue light to reg-ulate extension growth, leaf chlorophyll concentration and subsequent flowering of ornamental seedlings. In particular,
we wanted to determine whether includ-ing a moderately high intensity of blue light could nullify the effects of far-red on stem elongation without inhibiting flowering.
Experimental protocol Seeds of Geranium Pinto Premium Orange Bicolor, Petunia Wave Blue and Coleus Wizard Golden were sown in 128-cell plug trays by Raker-Roberta’s and received at Michigan State University (MSU) about one week later. When the first true leaves emerged, the seedlings were thinned to one plant per cell. They were then grown under each of six LED lighting treatments in a refrigerated
growth chamber at a constant 68F (20C) and an 18-hour photoperiod.
All six LED lighting treatments were delivered at a PPFD of 160 μmol∙m–2∙s–1 with red (R160, where number indicates the photon flux density in μmol∙m–2∙s–1) or 50% of blue and 50% of red light (B80R80). In each R160 and B80R80 treat-ment, three red (600 to 700 nm) to far-red ratios (R:FR) were tested, including 1:0 (without far-red), 8:1 and 1:1 (Table 1). Growth attributes of seedlings were evaluated after approximately three to five weeks under the LEDs, when they were ready for transplant. No plant growth regulators were applied.
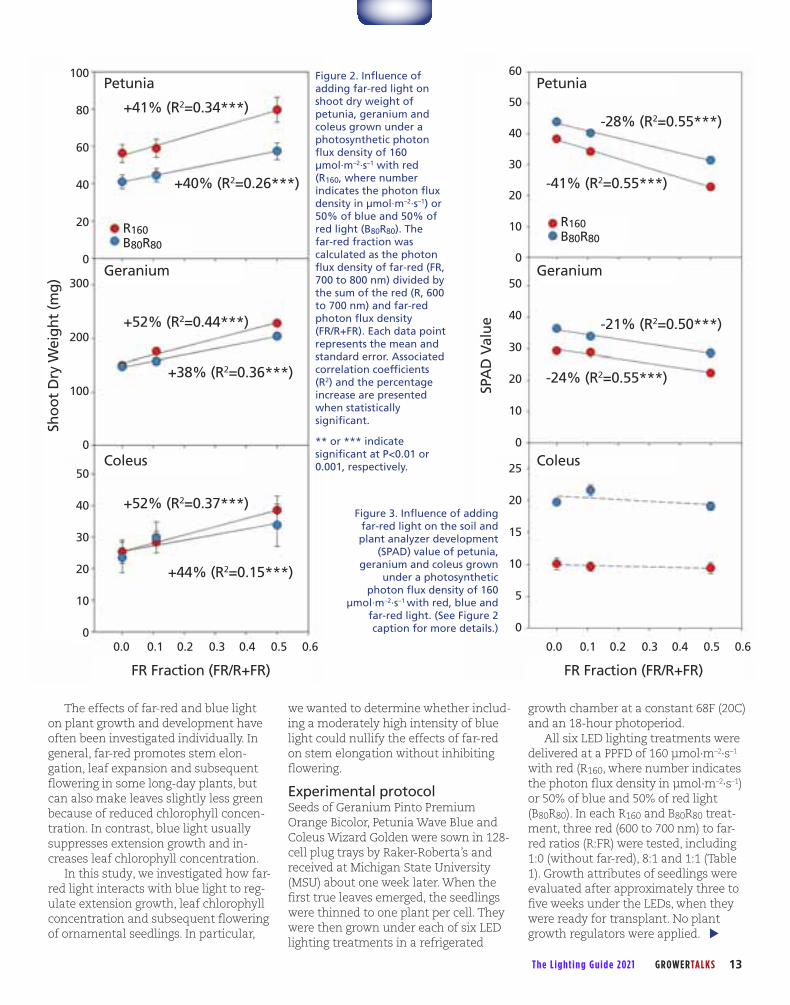
Figure 2. Influence of adding far-red light on shoot dry weight of petunia, geranium and coleus grown under a photosynthetic photon flux density of 160 µmol·m–2·s–1 with red (R160, where number indicates the photon flux density in µmol·m–2·s–1) or 50% of blue and 50% of red light (B80R80). The far-red fraction was calculated as the photon flux density of far-red (FR, 700 to 800 nm) divided by the sum of the red (R, 600 to 700 nm) and far-red photon flux density (FR/R+FR). Each data point represents the mean and standard error. Associated correlation coefficients (R2) and the percentage increase are presented when statistically significant.
** or *** indicate significant at P<0.01 or 0.001, respectively.
Figure 3. Influence of adding far-red light on the soil and plant analyzer development
(SPAD) value of petunia, geranium and coleus grown
under a photosynthetic photon flux density of 160
µmol·m–2·s–1 with red, blue and far-red light. (See Figure 2 caption for more details.)
300
200
100
0
50
40
30
20
10
0
100
80
60
40
20
0
Sho
ot
Dry
Wei
gh
t (m
g)
Petunia
+41% (R2=0.34***)
Geranium
Coleus
+52% (R2=0.44***)
+52% (R2=0.37***)
+38% (R2=0.36***)
+44% (R2=0.15***)
+40% (R2=0.26***)
R160 B80R80
0.0 0.1 0.2 0.3 0.4 0.5 0.6
FR Fraction (FR/R+FR)
u

Figure 4. Influence of six indoor LED lighting treatments during the seedling stage on average days to subsequent flower at 68F (20C) and a 16-hour photoperiod. The subscript value after each LED type (B=blue; R=red; FR=far-red) indicates its photon flux density in µmol·m–2·s–1. Average days to subsequent flower from transplant followed by the same letter are statistically similar.
R160 R160 R160 B80R80
B80R80 B80R80 FR20 FR160 FR10 FR80
14 GROWERTALKS The L ight ing Guide 2021
In addition, at the end of the plug stage, we transplanted seedlings into 4-in. pots and subsequently grew them in a common greenhouse at 68F with a 16-hour photoperiod to determine whether the lighting treatments had any residual effects after transplant. For geranium and petunia, we determined days to the first open flower from transplant, the number of visible flower buds or inflorescences, and plant height at flowering. For coleus, plant height was measured when they were con-sidered of marketable size. The ex-periment was performed three times for petunia and geranium, and twice for coleus. Data were statistically analyzed and interpreted.
Research results Stem elongation. Without blue light, seedling height of petunia, geranium and coleus increased as more far-red light was added (Figure 1). How-ever, with 80 μmol∙m–2∙s–1 of blue light, adding far-red light had little effect on seedling height in petunia and coleus. In geranium, blue light suppressed the promotive effects of far-red on stem elongation by 46%.
Dry weight. Shoot dry weight is an effective indicator of plant growth. It’s measured by cutting each plant at the surface of the growing substrate, drying it in an oven and then measuring its weight. Shoot dry weight of petunia, gera-nium and coleus increased linearly by up to 41% to 53% as the portion of far-red light increased, regardless of blue light (Figure 2). Only in pet-unia, blue light reduced shoot dry weight (by 24% to 28%) at the same portion of far-red.
Leaf chlorophyll. The soil and plant analyzer development (SPAD) value is an index of relative leaf chlorophyll concentration. Adding far-red light decreased the SPAD value (and thus were less green) of petunia by 41% and geranium by 24%, regardless of blue light (Figure 3). In coleus, far-red light had little effect on leaf chlorophyll concentra-tion. In all species, blue light in-creased SPAD value at each intensity of far-red.
Subsequent flowering and plant height at finishing. In the long-day plant petunia, regardless of blue light, the plants provided with far-red light at R:FR = 1:1 during the seedling stage flowered seven to 10 days earlier than those grown without far-red (Figure 4). In day-neutral geranium, far-red treatment during the seedling stage had lit-tle effect on subsequent flowering at each blue light level. However, the plants grown with an R:FR = 1:1 and without blue light flowered five days earlier than those grown without far-red light, but with blue light.
In both petunia and geranium, plant height at flowering were similar among lighting treatments. In contrast, coleus plants grown with an R:FR = 1:1 and with-out blue light were taller than those grown
without or with 10 μmol∙m–2∙s–1 of far-red light, but with blue light (Figure 5).
Conclusions Our results showed that inclusion of 80 μmol∙m–2∙s–1 of blue light suppresses the promotive effects of far-red on stem elon-gation and had little effect on flowering. In addition, including blue light increased leaf chlorophyll concentration independently of far-red, so leaves were slightly darker green.
We can conclude that including far-red light with a moderately high intensity of blue light in an LED spectrum can promote flowering in at least some long-day plants, while still producing compact plants with greener leaves.
Figure 5. Influence of six indoor LED lighting treatments during the seedling stage on plant height (cm) of coleus at the finishing stage. The subscript value after each LED type (B= blue; R=red; FR=far-red) indicates its photon flux density in µmol·m–2·s–1. Plant heights followed by the same letter are statistically similar.
Petunia ‘Wave Blue’
28 a 26 ab 18 c 29 a 27 ab 22 bc
46 ab 45 ab 42 b 47 a 46 ab 42 ab
Geranium ‘Pinto Premium Orange Bicolor’
R160 R160 R160 B80R80
B80R80 B80R80 FR20 FR160 FR10 FR80
14.7 ab 14.6 ab 15.4 a 12.8 b 12.7 b 13.4 ab
Coleus ‘Wizard Golden’

The L ight ing Guide 2021 GROWERTALKS 15
Indoor growing of transplants can enable a high level of growth and quality control, as clearly shown by the research presented in this guide. The key question for commercialization is: “Does it pay?”
With any economic analysis, the devil is in the assumptions. In this article, our goal is to help provide you with a framework on how to evaluate costs and profitability. First, we’ll go through an example of a plant factory based on Japanese research. We’ll then highlight two U.S. grower operations, and later provide a prototype approach you can adapt to test performance and profitability.
A lettuce indoor plant factory case study Japan has been the leader in indoor plant factory research and devel-opment. We highly recommend “Smart Plant Factory” edited by Toyoki Kozai (2018) as a reference. In this e-book, Uraisami (2018) estimated costs for a 1,000 m2 (10,764 ft2) lettuce plant fac-tory that had six layers of production to provide 2,183 m2 (23,498 ft2) of cultiva-tion space. This approximately $2.2 mil-lion (U.S.) facility would have the
capacity to hold 14,686 propagation trays with 11 in. × 21 in. dimensions (1.6 ft2) if adapted for young plants.
Table 1 shows a few summary fig-ures for the lettuce operation. About 30% of the initial investment cost was in LED fixtures, sufficient to provide 100 μmol∙m–2∙s–1 of photosynthetically active radiation (PAR), with the remaining 70% in other material and facility costs.
Electrical operating cost from LEDs to run at 100 μmol∙m–2∙s–1 of PAR for 16 hours per day would add $0.18 per tray per week from this partial budget, as-suming a U.S. average of $0.12/kWh based on commercial electricity rates from the U.S. Energy Information Ad-ministration for February 2021. This light level and duration, which would provide a daily light integral (DLI) of 5.8 mol∙m–2∙s–1, is a reasonable assumption for young plants, but much more would typically be required for lettuce and other edible crops.
Although costs will vary for a pur-pose-built facility for young plants, the lettuce example highlights several points:
n There’s a high capital cost per unit area of production and LEDs are only
one component of investment costs. A complete budget would include the building itself, an HVAC system, carts, racks, shelves, an irrigation system, en-vironmental controls (carbon dioxide, temperature) and plant processing areas.
n Electricity is a major operational cost. Japanese researchers find that 75% to 80% of the electrical cost is for light-ing, with about 15% to 20% for cooling in a well-insulated room, and the re-mainder to run fans and pumps.
n The photosynthetic photon effi-cacy of lighting fixtures (efficiency of converting electricity into PAR photons, see the article on page 4) selected for the operation is critically important for indoor production. Electrical energy that isn’t converted into PAR light results in waste heat that must be removed using HVAC.
n Carbon dioxide isn’t included in Table 1, but is a minor cost (about $1/ft2 per year) in a tightly-insulated growth room that has 0.02 or less air exchanges per hour.
n Labor efficiency is just as critical in an indoor facility as in greenhouse production. Labor savings can occur from automation, reduced need for pest and growth control activities, and more standardized operations. However, pro-duct handling and flow must be labor-efficient. For example, if plant products are moved on carts into a cramped modified shipping container with a sin-gle entrance and exit, work efficiency is likely to be poor.
Commercial indoor young plant operations We’ve been fortunate to learn from Battlefield Farms and Shenandoah
By Paul Fisher, Celina Gómez, Megh Poudel & Erik Runkle
The Economics of Lighting Young Plants Indoors
u
per m2 per ft2 per tray area (1.6 ft2)
Initial Capital Investment $1,019 $95 $151
LED Fixtures $310 $29 $46
Other Materials and Facility $709 $66 $105
Electrical consumption for LEDs (kWh/week) $10.71 $1.00 $1.60
Electrical cost for LEDs @ $0.12/kWh $1.29 $0.12 $0.19
Labor cost per week $1.61 $0.15 $0.24
Table 1. Partial cost figures for an indoor lettuce plant factory, adapted from Uraisami (2018).

16 GROWERTALKS The L ight ing Guide 2021
Growers in Virginia, who are pioneering indoor young-plant production. Our onsite measure-ments of their energy use for LED and HVAC, along with cost estimates for LED fixtures provided by these growers, provide confidence that values in Table 1 are reasonable ballpark figures for a commercial indoor propagation facility.
Battlefield Farms installed a system initially to improve rooting success of high-valued heu-chera tissue-culture transplants and have now expanded to other crops. Shipping carts are wheeled into a modified seed germination chamber (Figure 1). LEDs are mounted in bays to light either from the sides or above each shelf on the carts. The average light intensity is 100 μmol∙m–2∙s–1 and the photoperiod is 12 to 24 hours, resulting in a DLI of 4.3 to 8.6 mol∙m–2∙s–1.
Shenandoah Growers uses indoor growing to start many of their herb seedlings and also to produce micro-greens. They have a purpose-built facility, including automated subirrigation (Figure 2). You can see an excellent video about the operation at youtube.com/watch?v= DTFWSOca080.
Applying these concepts to a prototype for testing Based on these large-scale commercial designs, at the University of Florida we’re taking a proto-type approach to help growers test indoor prop-agation. Table 2 provides cost estimates for one configuration of a single shipping cart modified with LED lights for placement in a humidity and temperature-controlled room such as a ger-mination chamber.
In this scenario, a shipping cart with five solid shelves has three LED fixtures per shelf consuming a total of 90W, dimmed by 50% to provide 100 μmol∙m–2∙s–1. Electrical costs for the LEDs for Table 2 are calculated based on the total wattage (90W × 5 shelves) × the 50% dimmer level × 16-hour photoperiod × 365 days per year × 50% space use/1,000 = 657 kWh at an electricity rate of $0.12/kWh, which equals $79 per year.
Table 2 has conservative (high) cost assump-tions—we believe that the investment cost of $3,047 per cart could be reduced with design improvements and volume discounts. In ad-dition, we assume that the shelves average only 50% use during the year because of seasonality, whereas maximizing capacity would decrease the investment cost per tray. However, Table 2 doesn’t include all overhead and capital expen-ditures needed in a complete vertical farm, such as air conditioning.
Adapt Table 2 for your own de-sign. Alternative technologies are available, such as LEDs mounted on strips and panels. Make sure the LED option you choose has a high fixture efficacy (more than 2.0 μmol·J–1), is designed for a humid environment and has a suitable spectrum as described in this guide.
Ultrasonic fog could be added to this structure for air humidity con-trol. Plants could be hand-watered (which is the approach at Battlefield Farms), but subirrigation could be
added (as used in Shenandoah Growers).
We can divide the annual costs in Table 2 ($514) by the number of trays that can be grown (we assume 30 trays per cart at any one time × 52 weeks/4-week crop time × 50% use = 195 trays per year). That gives $514/195 = $2.64 per tray or $0.01 per plant if you grow 288 plants per tray. The bottom line from Table 2 is that each tray costs approximately $0.66 per week to grow indoors.
Figure 1. The enhanced rooting chamber at Battlefield Farms, Virginia. Shipping carts of young plants are lit by LEDs mounted horizontally in bays.
Figure 2. Starting herb seedlings indoors at Shenandoah Growers, Virginia.
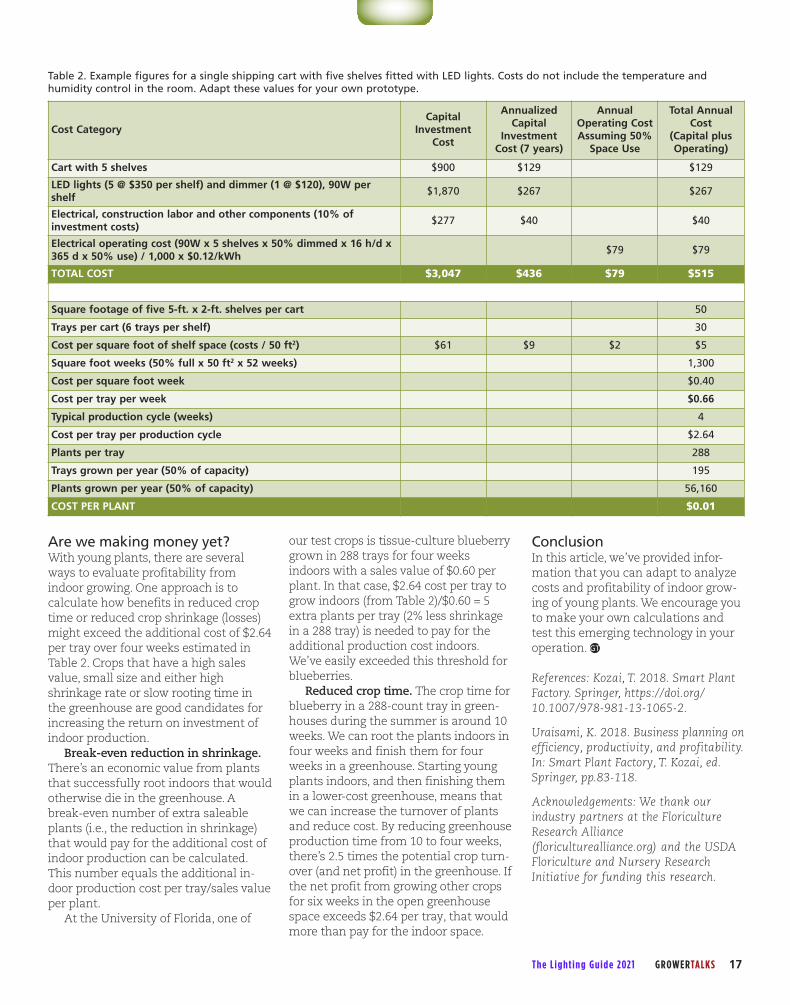
Are we making money yet? With young plants, there are several ways to evaluate profitability from indoor growing. One approach is to calculate how benefits in reduced crop time or reduced crop shrinkage (losses) might exceed the additional cost of $2.64 per tray over four weeks estimated in Table 2. Crops that have a high sales value, small size and either high shrinkage rate or slow rooting time in the greenhouse are good candidates for increasing the return on investment of indoor production.
Break-even reduction in shrinkage. There’s an economic value from plants that successfully root indoors that would otherwise die in the greenhouse. A break-even number of extra saleable plants (i.e., the reduction in shrinkage) that would pay for the additional cost of indoor production can be calculated. This number equals the additional in-door production cost per tray/sales value per plant.
At the University of Florida, one of
our test crops is tissue-culture blueberry grown in 288 trays for four weeks indoors with a sales value of $0.60 per plant. In that case, $2.64 cost per tray to grow indoors (from Table 2)/$0.60 = 5 extra plants per tray (2% less shrinkage in a 288 tray) is needed to pay for the additional production cost indoors. We’ve easily exceeded this threshold for blueberries.
Reduced crop time. The crop time for blueberry in a 288-count tray in green-houses during the summer is around 10 weeks. We can root the plants indoors in four weeks and finish them for four weeks in a greenhouse. Starting young plants indoors, and then finishing them in a lower-cost greenhouse, means that we can increase the turnover of plants and reduce cost. By reducing greenhouse production time from 10 to four weeks, there’s 2.5 times the potential crop turn-over (and net profit) in the greenhouse. If the net profit from growing other crops for six weeks in the open greenhouse space exceeds $2.64 per tray, that would more than pay for the indoor space.
The L ight ing Guide 2021 GROWERTALKS 17
Cost CategoryCapital
Investment Cost
Annualized Capital
Investment Cost (7 years)
Annual Operating Cost Assuming 50%
Space Use
Total Annual Cost
(Capital plus Operating)
Cart with 5 shelves $900 $129 $129
LED lights (5 @ $350 per shelf) and dimmer (1 @ $120), 90W per shelf
$1,870 $267 $267
Electrical, construction labor and other components (10% of investment costs)
$277 $40 $40
Electrical operating cost (90W x 5 shelves x 50% dimmed x 16 h/d x 365 d x 50% use) / 1,000 x $0.12/kWh
$79 $79
TOTAL COST $3,047 $436 $79 $515
Square footage of five 5-ft. x 2-ft. shelves per cart 50
Trays per cart (6 trays per shelf) 30
Cost per square foot of shelf space (costs / 50 ft2) $61 $9 $2 $5
Square foot weeks (50% full x 50 ft2 x 52 weeks) 1,300
Cost per square foot week $0.40
Cost per tray per week $0.66
Typical production cycle (weeks) 4
Cost per tray per production cycle $2.64
Plants per tray 288
Trays grown per year (50% of capacity) 195
Plants grown per year (50% of capacity) 56,160
COST PER PLANT $0.01
Conclusion In this article, we’ve provided infor-mation that you can adapt to analyze costs and profitability of indoor grow-ing of young plants. We encourage you to make your own calculations and test this emerging technology in your operation.
References: Kozai, T. 2018. Smart Plant Factory. Springer, https://doi.org/ 10.1007/978-981-13-1065-2. Uraisami, K. 2018. Business planning on efficiency, productivity, and profitability. In: Smart Plant Factory, T. Kozai, ed. Springer, pp.83-118. Acknowledgements: We thank our industry partners at the Floriculture Research Alliance (floriculturealliance.org) and the USDA Floriculture and Nursery Research Initiative for funding this research.
Table 2. Example figures for a single shipping cart with five shelves fitted with LED lights. Costs do not include the temperature and humidity control in the room. Adapt these values for your own prototype.
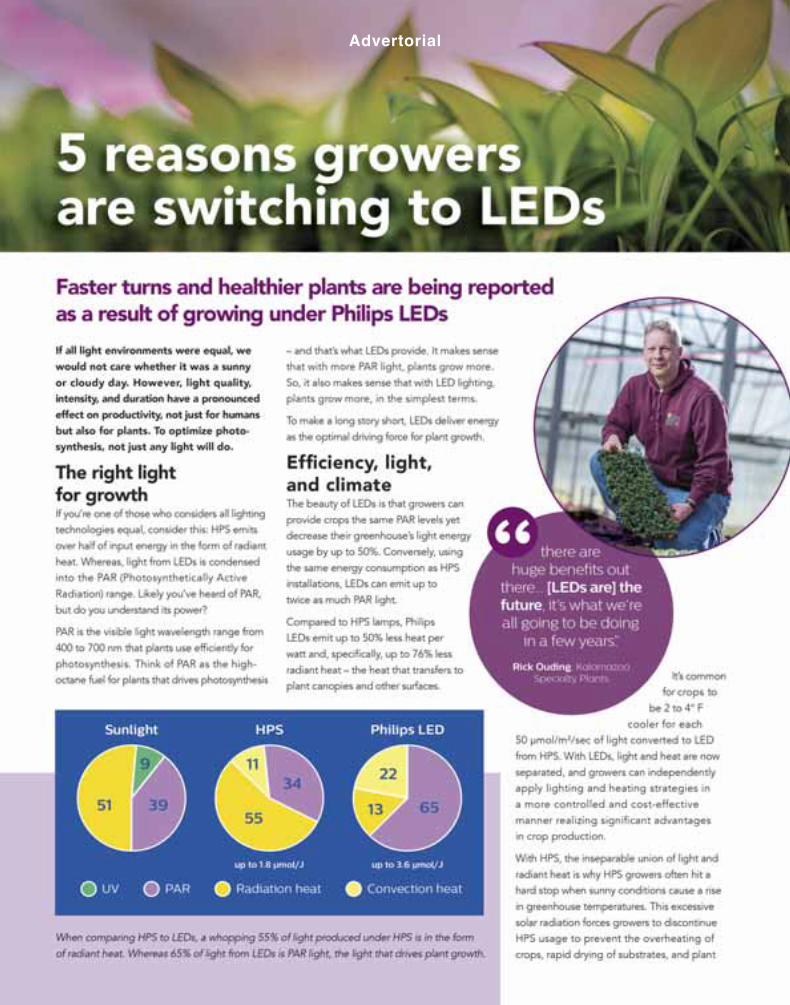
Advertorial

20 GROWERTALKS The L ight ing Guide 2021
One of our research foci has been to better un-derstand the pros and cons of including far-red light (700 to 800 nm) in an indoor lighting spec-trum. As shown in the article on page 8, adding more far-red light (or decreasing the R-to-FR ratio) promotes stem elongation, leaf expansion and sometimes overall growth. In addition, it can decrease leaf chlorophyll concentration, which makes leaves appear slightly less green. The ad-dition of far-red light also accelerates the sub-sequent flowering of some long-day plants.
In the article on page 12, we demonstrated that blue light (400 to 500 nm) suppressed the promotive effects of far-red light on stem elon-gation, but had little effect on flowering. Here, we share results of an experiment performed to learn more about how much far-red light is needed, at two different levels of blue light, to elicit desired plant responses in a range of flori-culture crop seedlings.
Experimental protocol We selected floriculture crops for study based on their differing tolerances to sun and shade, as well as their different flowering responses to photoperiod. Seeds of three long-day plants (Dianthus Jolt Cherry, Petunia Wave Blue and Snapdragon Liberty Classic Yellow), three short-day plants (African Marigold Antigua Orange, Coleus Wizard Golden and Zinnia Magellan Pink), and three day-neutral plants (Geranium Pinto Premium Orange Bicolor, Impatiens Super Elfin XP Red and Tomato Micro Tom) were sown in 128-cell plug trays by Raker-Roberta’s. Impatiens and coleus are shade-tolerant plants, while the others are shade-avoiding plants.
Upon emergence of the first true leaf for each crop, plug trays were placed on vertically stacked shelves under nine lighting treatments (Table 1) inside the Controlled Environment Lighting Laboratory at Michigan State University. Four intensities of far-red light (0, 10, 20 and 40 μmol∙m–2∙s–1) were added to two different combi-nations of blue and red (600 to 700 nm) light. In addition, we grew plants indoors under warm-white LEDs and in a research greenhouse with the same photoperiod, and similar temperature and daily light integral (around 12 mol∙m–2∙s–1).
On each shelf indoors, lights were operated for
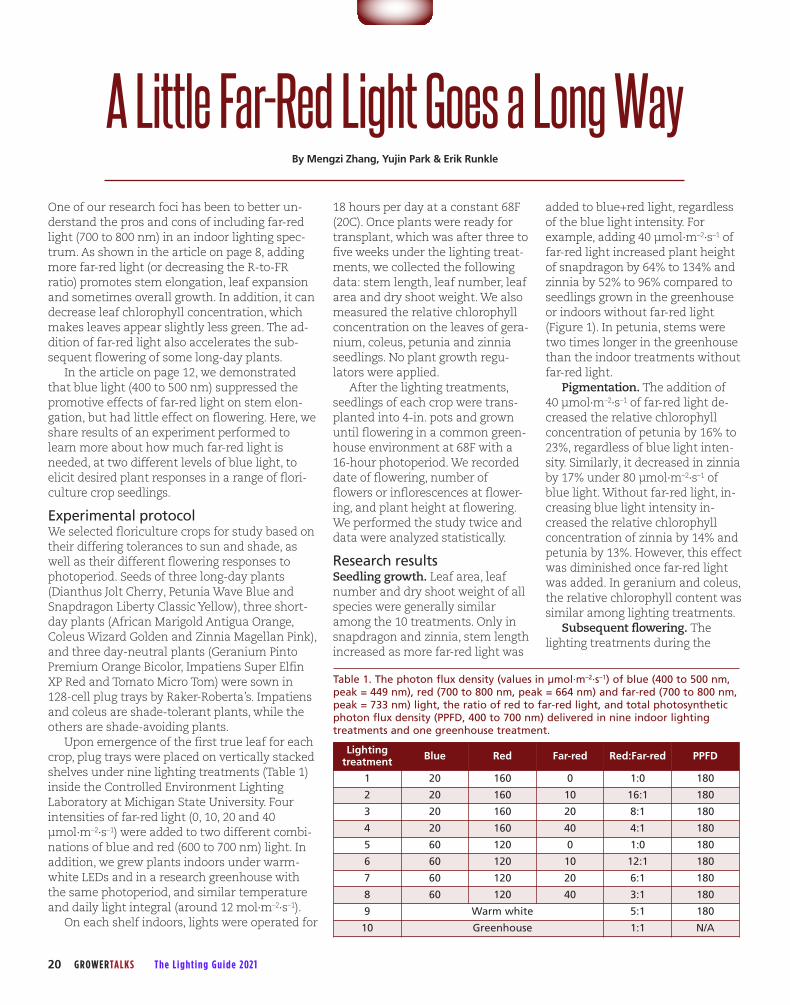
Table 1. The photon flux density (values in µmol·m–2·s–1) of blue (400 to 500 nm, peak = 449 nm), red (700 to 800 nm, peak = 664 nm) and far-red (700 to 800 nm, peak = 733 nm) light, the ratio of red to far-red light, and total photosynthetic photon flux density (PPFD, 400 to 700 nm) delivered in nine indoor lighting treatments and one greenhouse treatment.
Lighting treatment Blue Red Far-red Red:Far-red PPFD
1 20 160 0 1:0 180
2 20 160 10 16:1 180
3 20 160 20 8:1 180
4 20 160 40 4:1 180
5 60 120 0 1:0 180
6 60 120 10 12:1 180
7 60 120 20 6:1 180
8 60 120 40 3:1 180
9 Warm white 5:1 180
10 Greenhouse 1:1 N/A
By Mengzi Zhang, Yujin Park & Erik Runkle
A Little Far-Red Light Goes a Long Way18 hours per day at a constant 68F (20C). Once plants were ready for transplant, which was after three to five weeks under the lighting treat-ments, we collected the following data: stem length, leaf number, leaf area and dry shoot weight. We also measured the relative chlorophyll concentration on the leaves of gera-nium, coleus, petunia and zinnia seedlings. No plant growth regu-lators were applied.
After the lighting treatments, seedlings of each crop were trans-planted into 4-in. pots and grown until flowering in a common green-house environment at 68F with a 16-hour photoperiod. We recorded date of flowering, number of flowers or inflorescences at flower-ing, and plant height at flowering. We performed the study twice and data were analyzed statistically.
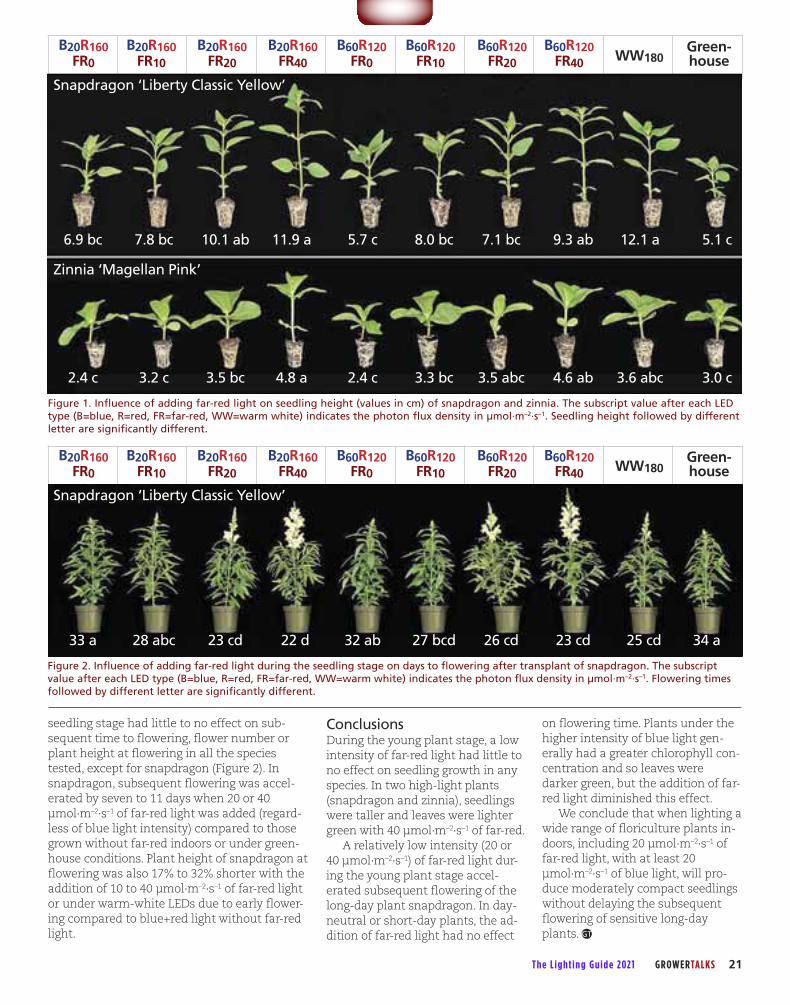
Research results Seedling growth. Leaf area, leaf number and dry shoot weight of all species were generally similar among the 10 treatments. Only in snapdragon and zinnia, stem length increased as more far-red light was
added to blue+red light, regardless of the blue light intensity. For example, adding 40 μmol∙m–2∙s–1 of far-red light increased plant height of snapdragon by 64% to 134% and zinnia by 52% to 96% compared to seedlings grown in the greenhouse or indoors without far-red light (Figure 1). In petunia, stems were two times longer in the greenhouse than the indoor treatments without far-red light.
Pigmentation. The addition of 40 μmol∙m–2∙s–1 of far-red light de-creased the relative chlorophyll concentration of petunia by 16% to 23%, regardless of blue light inten-sity. Similarly, it decreased in zinnia by 17% under 80 μmol∙m–2∙s–1 of blue light. Without far-red light, in-creasing blue light intensity in-creased the relative chlorophyll concentration of zinnia by 14% and petunia by 13%. However, this effect was diminished once far-red light was added. In geranium and coleus, the relative chlorophyll content was similar among lighting treatments.
Subsequent flowering. The lighting treatments during the
B20R160 B20R160 B20R160 B20R160 B60R120 B60R120 B60R120 B60R120 Green- FR0 FR10 FR20 FR40 FR0 FR10 FR20 FR40 WW180 house
The L ight ing Guide 2021 GROWERTALKS 21
seedling stage had little to no effect on sub-sequent time to flowering, flower number or plant height at flowering in all the species tested, except for snapdragon (Figure 2). In snapdragon, subsequent flowering was accel-erated by seven to 11 days when 20 or 40 μmol∙m–2∙s–1 of far-red light was added (regard-less of blue light intensity) compared to those grown without far-red indoors or under green-house conditions. Plant height of snapdragon at flowering was also 17% to 32% shorter with the addition of 10 to 40 μmol∙m–2∙s–1 of far-red light or under warm-white LEDs due to early flower-ing compared to blue+red light without far-red light.
B20R160 B20R160 B20R160 B20R160 B60R120 B60R120 B60R120 B60R120 Green- FR0 FR10 FR20 FR40 FR0 FR10 FR20 FR40 WW180 house
Snapdragon ‘Liberty Classic Yellow’
Zinnia ‘Magellan Pink’
6.9 bc 7.8 bc 10.1 ab 11.9 a 5.7 c 8.0 bc 7.1 bc 9.3 ab 12.1 a 5.1 c
2.4 c 3.2 c 3.5 bc 4.8 a 2.4 c 3.3 bc 3.5 abc 4.6 ab 3.6 abc 3.0 c
Figure 2. Influence of adding far-red light during the seedling stage on days to flowering after transplant of snapdragon. The subscript value after each LED type (B=blue, R=red, FR=far-red, WW=warm white) indicates the photon flux density in µmol·m–2·s–1. Flowering times followed by different letter are significantly different.
Figure 1. Influence of adding far-red light on seedling height (values in cm) of snapdragon and zinnia. The subscript value after each LED type (B=blue, R=red, FR=far-red, WW=warm white) indicates the photon flux density in µmol·m–2·s–1. Seedling height followed by different letter are significantly different.
33 a 28 abc 23 cd 22 d 32 ab 27 bcd 26 cd 23 cd 25 cd 34 a
Snapdragon ‘Liberty Classic Yellow’
Conclusions During the young plant stage, a low intensity of far-red light had little to no effect on seedling growth in any species. In two high-light plants (snapdragon and zinnia), seedlings were taller and leaves were lighter green with 40 μmol∙m–2∙s–1 of far-red.
A relatively low intensity (20 or 40 μmol∙m–2∙s–1) of far-red light dur-ing the young plant stage accel-erated subsequent flowering of the long-day plant snapdragon. In day-neutral or short-day plants, the ad-dition of far-red light had no effect
on flowering time. Plants under the higher intensity of blue light gen-erally had a greater chlorophyll con-centration and so leaves were darker green, but the addition of far-red light diminished this effect.
We conclude that when lighting a wide range of floriculture plants in-doors, including 20 μmol∙m–2∙s–1 of far-red light, with at least 20 μmol∙m–2∙s–1 of blue light, will pro-duce moderately compact seedlings without delaying the subsequent flowering of sensitive long-day plants.

22 GROWERTALKS The L ight ing Guide 2021
By producing plants indoors under sole-source lighting, not only can we control plant traits by manipulating the light quality and/or quantity, but we can potentially produce more resilient plants that better tolerate stress. When plants are exposed to high light levels, UV-A (315 to 400 nm) or blue (400 to 500 nm) light, they can accumulate antho-cyanins. These pigments make leaves more purple in color and generally increase their tolerance to stressful environments. Additionally, far-red (700 to 800 nm) light can decrease and blue light can increase chlorophyll content, making leaves lighter or darker green, respectively.
We performed an indoor lighting study with seedling plugs in an attempt to increase the protective compounds in leaves to increase plant resilience and post-transplant performance. One week before transplant, we grew them under an elevated light intensity or with additional blue, FR and/or UV-A light. We postulated that an increase in light intensity or elevated intensities of blue and/or UV-A light would stimulate anthocyanin accumulation and better tolerate stressful conditions.
Experiment set-up Seeds of Dianthus Super Parfait Raspberry, Geranium Pinto Premium Orange Bicolor, Petunia Easy Wave Blue and Wave Purple Improved, and Snapdragon Liberty Classic Yellow were sown into 162-cell trays by Raker-Roberta’s and picked up seven days later. Seeds of Tomato Micro Tom and Zinnia Magellan Pink were sown into 128-cell trays at Michigan State Univer-sity (MSU). All seedlings were then placed onto growing racks in the Controlled-Environment Lighting Laboratory (CELL) at MSU that provided a total photon flux density (315 to 800 nm) of 160 μmol∙m–2∙s–1 from warm-white (WW160) LEDs for 18 hours per day at an air temperature of 68F (20C).
One week before seedlings were ready to transplant, trays were placed under five LED lighting treatments consisting of WW160 alone (control treatment) or with an additional 90 μmol∙m–2∙s–1 of blue light (+B90), 60 and 30 μmol∙m–2∙s–1 of blue and UV-A (+B60UV-A30) light, 60 and 30 μmol∙m–2∙s–1 of blue and FR light (+B60FR30), or 90 μmol∙m–2∙s–1 of WW (WW250; Table 1). When seedlings were ready for transplant, we measured relative leaf chlorophyll content, overall leaf color, fresh and dry shoot mass, leaf area, and stem height. No growth regulators were applied.
All plants were then placed in a dark growth chamber at 86F (30C) with a relative humidity of 65% for two days to simulate stressful transportation conditions. After the stress treatment, we measured relative leaf chlorophyll content and leaf color again, then trans-planted the seedlings into 4.5-in. pots and placed them in a greenhouse with a 16-hour photoperiod supplemented by high-pressure sodium lamps and an average temperature of 68F. We grew them in the greenhouse until flowering, and recorded the date and height at first open flower.
Results Seedlings. Lighting treatments only affected stem height of dianthus, snapdragon and zinnia. For example, zinnia was 20% taller under the control
treatment compared to +B60FR30 (Figure 1). In contrast, snapdragon was 17% to 37% taller under the control compared to all other treatments except for +B60FR30. With the exception of gera-nium and Petunia Easy Wave Blue, the fresh and dry shoot mass (overall indi-cators of plant growth) and leaf area typically decreased with additional blue light. For instance, fresh shoot mass and leaf area of Petunia Wave Purple Im-proved were 24% to 27% smaller under +B90 than the +B60UV-A30 or +B60FR30 treatments. The additional 90 μmol∙m–2∙s–1 of blue light decreased the dry shoot mass of dianthus by 23% and snapdragon by 52% compared to the control.
Geranium, Petunia Wave Purple Im-proved, snapdragon and zinnia under the WW250 and/or +B60FR30 treatments had lower relative chlorophyll concen-tration values (i.e., were a lighter green color) than plants grown under the con-trol. In most cases, the stress treatment decreased chlorophyll content across lighting treatments. Hue angle, or the color, of the seedlings was usually simi-lar among lighting treatments before being subjected to heat stress.
Finished production. Only subsequent flowering of geranium, Petunia Easy Wave Blue and tomato were influenced by lighting treatments (Figure 2). For instance, tomato flowered nine days earlier when grown under WW250 compared to +B90. In contrast,
By Annika Kohler & Erik Runkle
End-of-Production Lighting Indoors
Table 1. The photon flux density of UV-A (315 to 400 nm), blue (B, 400 to 500 nm), green (500 to 600 nm), red (600 to 700 nm) and far-red (FR, 700 to 800 nm) light, and their totals for five LED lighting treatments delivered for one week at the end of the plug stage.
Lighting treatment
Photon flux density (µmol·m–2·s–1)
UV-A Blue Green Red Far-red Total
WW160 (control) 0 12 45 85 18 160
+B90 0 102 45 85 18 250
+B60UV-A30 30 72 45 85 18 250
+B60FR30 0 72 45 85 48 250
WW250 0 18 70 134 28 250

The L ight ing Guide 2021 GROWERTALKS 23
geranium flowered three days earlier under +B90 than WW250. Petunia Easy Wave Blue grown under +B60FR30 flowered four days earlier than those under the +B60UV-A30 treatment. Lighting treatments had no effect on stem height of finished plants.
Conclusions In this study, we tried to increase the post-shipping and transplant performance of bedding plant plugs by delivering additional light during the last week of indoor pro-duction. Leaf size, and fresh and dry shoot mass were generally smaller under additional blue light than the control or with the addition of blue and FR light. Chlorophyll content generally decreased after exposure to the stress treatment, and purpling of the leaves of petunia (anthocyanin accumulation) was more apparent for plugs provided with the +B90 or +B60UV-A30 lighting treatments. However, there were few persist-ent lighting effects after trans-plant. We conclude that providing seedlings with at least an ad-ditional 60 μmol∙m–2∙s–1 of blue light at the end of production can produce compact and dark green plants.
WW160 +B90 +B60UV-A30 +B60FR30 WW250
WW160 +B90 +B60UV-A30 +B60FR30 WW250
6.5 a 4.7 d 5.2 cd 6.2 ab 5.5 bc
5.3 a 4.9 ab 4.4 ab 4.4 b 5.1 ab
Snapdragon ‘Liberty Classic Yellow’
Zinnia ‘Magellan Pink’
Plant Height (cm)
Petunia ‘Easy Wave Blue’
Tomato ‘Micro Tom’
31 bc 32 b 34 a 30 c 31 bc
26 abc 31 a 30 ab 24 bc 22 c
Geranium ‘Pinto Premium Orange Bicolor’
52 ab 50 b 52 ab 52 ab 53 aTime to Flower (days)
Figure 1. Stem height (cm) of snapdragon and zinnia seedlings after growing under lighting treat-ments for the final seven days of plug production. The lighting treatments consisted of 160 µmol·m–2·s–1 of light from warm-white (WW) LEDs without or with 30, 60 or 90 µmol·m–2·s–1 of blue (B), UV-A, far-red (FR) and/or WW light. Stem heights followed by the same letter are statistically similar.
Figure 2. Days from transplant to flowering of petunia, tomato and ge-ranium after plugs received five LED lighting treatments during the last seven days. The lighting treatments consisted of 160 µmol·m–2·s–1 of light from warm-white (WW) LEDs without or with 30, 60 or 90 µmol·m–2·s–1 of blue (B), UV-A, far-red (FR) and/or WW light. Days to flower followed by the same letter are statistically similar.