Embed Size (px)
Citation preview
THE INEQUALITY OF WEALTH I N BRITAIN'S
NORTH AMERICAN COLONIES:
THE IMPORTANCE OF THE RELATIVELY POOR
Dalhousie University
This paper presents original estimates of the distribution of personal wealth in Nova Scotia, Canada in 1871 using the estate multiplier technique and discusses the sensitivity of estimates of the wealth distribution to the assumed wealth holdings of non-probated decedents. We examine, in particular, the implications of assuming: (1) that non-probated decedents had zero wealth, (2) that the wealth distribution was quasi-Paretian (with parameters that can be estimated from the distribution of wealth of probated decedents) or (3) that the wealth distribution had the form assumed by A. H. Jones in her analysis of wealth inequality in the Thirteen Colonies in 1774. We conclude that it is unlikely that large estates escaped the probate process in Nova Scotia, but it is also unlikely that all non-probated decedents had equal wealth-thus our "best guess" is that the wealth distribution of non-probated decedents was quasi-Paretian. However, a methodology similar to Jones' would have implied considerably less measured inequality in the wealth distribution and greater average wealth in 1871- and would therefore have altered our perception of long term trends in the distribution of wealth and in the rate of accumulation of wealth. The measurement of wealth inequality in a society with a significant slave population, such as the thirteen colonies in 1774, is also highly sensitive to the treatment of slavery. Our preferred estimates of wealth inequality in Nova Scotia in 1871 and in the Thirteen Colonies in 1774 indicate a much higher inequality in the distribution of personal wealth than exists today.
In her article in 1972, and in her later book (1980) Alice H. Jones presented estimates of the inequality of wealth in colonial America that have served as benchmarks for further research. Although others have examined the share of assets held by the top few percentiles of the wealth distribution and/or focused on particular regions or municipalities, Jones' estimates remain unique in their comprehensive coverage of regions, and wealth classes, in colonial America. Her estimates have therefore been very influential in shaping the view that colonial America was relatively egalitarian and that there was a substantial "surge" in inequality of wealth in the period leading up to the Civil War-a conclusion that has been used as evidence in favour of the Kuznets hypothesis that inequality first increases, and then decreases, with economic development (see Williamson and Lindert, 1980, p. 36).
However, if we accept the best currently available estimates concerning wealth inequality in the United States in recent decades (Wolff, 1986) then one would conclude that inequality in personal wealth has, if anything, increased in the United States over the past two hundred years (see Table 3).' Considering
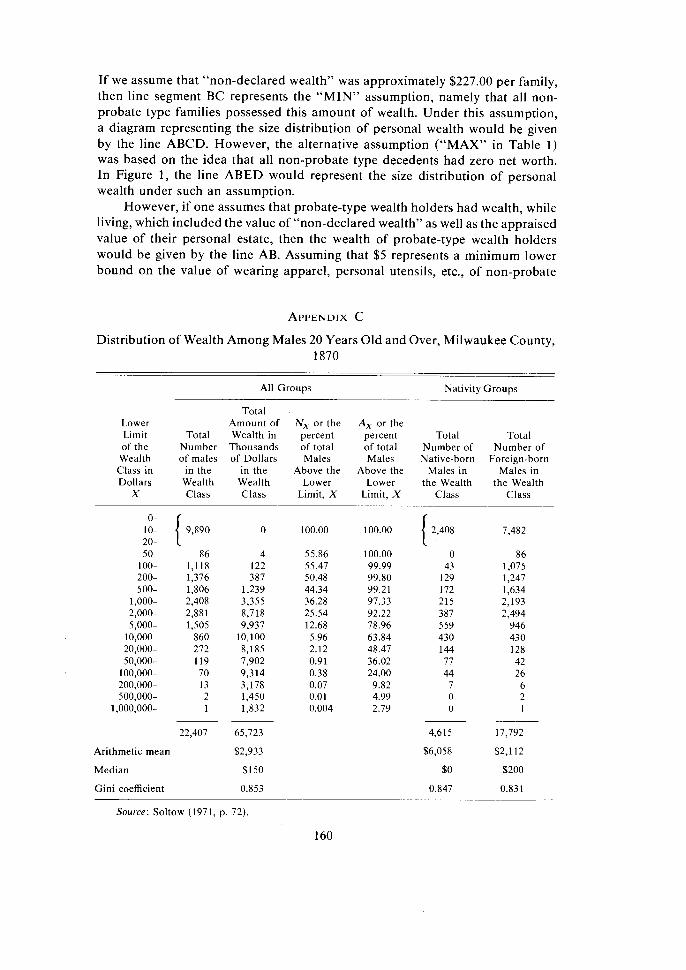
We reproduce in Appendix C the estimates of Soltow (1971) of the wealth distribution in Milwaukee County in 1870. Soltow also reported on the entire distribution of wealth, unlike Gallman (1969) or others (see Williamson and Lindert (1980) for a survey) who report only the shares of total wealth held by the top few percentiles of the wealth distribution. One can note that Soltow's estimate of a Gini coefficient of 0.853 is quite close to our "best" estimate for Nova Scotia reported in Table 1 and to our "zero" estimate for the 13 Colonies (Table 5) .
that some 22.7 percent (Jones, 1980, p. 37) of the population were, in 1774, slaves and therefore possessed zero wealth, even a constant degree of inequality in the distribution of wealth in the United States would appear to be a significant finding.' A widening in the gulf between the rich and the poor over this period would, if confirmed, be important evidence on the nature of the process of capitalist development in the US.-especially since the available evidence on long-run trends in wealth inequality elsewhere (i.e. in the U.K. (Harbury and Hitchens, 1983) or in Sweden (Spant, 1987), or in the U.S. over the last 6 decades (Wolff and Marley, 1986), indicate a trend to decreased inequality of personal wealth.
However, perception of trends in the distribution of wealth over time are greatly affected by our estimates of the starting point, and a major problem with the "estate multiplier" method of estimating the distribution of wealth from probate records is the fact that we have no data on the wealth of those individuals whose estates did not pass through the probate process. The major point of this paper is to discuss the sensitivity of estimates of the wealth distribution derived from probate records to the (unverifiable) assumption one chooses to make on the wealth holdings of non-probated decedents. We examine, in particular, the implications of assuming that non-probates had zero wealth, that their wealth distribution was quasi-Paretian and that their wealth distribution had the par- ticular form assumed by Jones. We make use of micro-data on estates probated in Nova Scotia, Canada, in 1871 and a reconstruction of Jones' data.
Section 2 of this paper begins by presenting estimates of the distribution of wealth in another British colony in North America (the province of Nova Scotia, Canada) and comparing those estimates with current estimates of the distribution of wealth in Canada.
Section 3 notes that although we share the use of the "estate tax multiplier" methodology based on probate records with the path breaking work of Jones (1980) for the United States, our "best guess" estimate diverges substantially in the assumption we make on the wealth of decedents whose estates did not pass through the probate process. We compare the results of section two with the estimates of the wealth distribution which we would have obtained had we adopted the same assumptions on the wealth of non-probated decedents as Jones.
As sections 2 and 3 indicate, the assumption one makes concerning the wealth of non-probated decedents can make a substantial difference to one's estimates of wealth inequality in Nova Scotia-in particular the Jones-type methodology implies a significantly lower measurement of wealth inequality. In section 4, we reconstruct from Jones' work the estimates of wealth inequality in the 13 Colonies in 1774 which Jones would have obtained had she adopted either
It has been argued (e.g. Feldstein, 1976) that the emergence of social security in the United States has acted as a substitute for private wealth acquisition, and that one should correct the current statistics on net worth to include "social security wealth," or the net present value of expected social security entitlements. Wolff (1983) has examined the impact of including social security wealth in analysis of wealth inequality statistics for the United States and finds, not surprisingly, that it implies a decrease in measured wealth inequality. However, the point of this paper is to examine the evidence on long-run trends in a comparably defined magnitude-the distribution of net worth (i.e. marketable assets minus liabilities) and the robustness of such measurement to alternative assumptions on non-probate wealth.
of two alternative assumptions for non-probates. It is clear that measured inequality in the distribution of wealth increases under both these assumptions and it is equally clear that the size of the increase in inequality depends on the index of inequality one chooses to adopt. Since our focus throughout is on the impact of alternative assumptions regarding the wealth of the relatively poor, we must consider also Jones' treatment of slavery. We demonstrate that Jones' wealth estimates are highly sensitive to her treatment of slavery.
In section 5 , we outline the reasons why we prefer the methodology of section 2 for the Nova Scotia data. The implication, for the U.S., is that one can conjecture that wealth inequality may have been roughly constant in the pre-Civil War period in the U.S. (and that the long-run trend since then is for decreasing inequality of wealth).
Section 6 is a conclusion.
The data used in this section are drawn from the estate papers of residents of the province of Nova Scotia, Canada who died in the year 1871, death records for 1871 for Nova Scotia and the 1871 census of Canada (for more details, see Appendix A). The "estate multiplier" technique for estimating the distribution of wealth of the living population from the distribution of the estates left by decedents has been used by many researchers over the This technique is based on the idea that in any given year a certain fraction (p,) of those people in agelsex cohort i will die. If they leave an estate, the value of that estate will be determined as part of the legal process of probate. If the probability of death is determined by a person's age and sex each decedent can then be seen as "representing" a certain number of living persons ( l lp , ) , hence the size distribu- tion of personal wealth (w,) can be estimated from the size distribution of estates (E,) as in equation (1).
W W
(1
where F ( ) is the cumulative distribution function and f ( ) is the probability density function.
In spirit, the present study is very similar to that of Jones (1972, 1980) and we share with Jones the problem that we can only identify the probability of mortality that is associated with age and sex, and cannot distinguish any differen- tial effects of occupation or social class.4
See, for example, Mendershausen (1956), Lampman (1962), Lyons (1972), McGrath (1982), Smith (1974)-as well as, of course, Jones (1972, 1980).
To the extent that the poor, or the working class, have a higher probability of mortality at any given age than more advantaged individuals, using the average probability of mortality for that age/sex cohort, will over-represent their numerical importance in the estimated size distribution of personal wealth. Estimation of the sensitivity of historical statistics of distribution of wealth to differential probabilities of mortality by occupation or social class is clearly a subject for further research. Siddiq (1986, pp. 119-129) examines the sensitivity of estimates of the distribution of wealth in Nova Scotia to the choice of alternative possible assumptions on age/sex specific mortality rates for Nova Scotia in 1871.
The mortality rates used in this study are derived from the 1871 census of Canada, for the province of Nova Scotia.
Although there are some ways which current data on the wealth distribution is an improvement on historical data, there is one crucial way in which the data of Jones (1980) or the present study are superior. Currently available data (e.g. Smith and Franklin (1974)) are based on the valuation of estates for estate tax purposes, hence the incentive to individuals is to underreport the size of their estates or to circumvent the probate process by gifts inter vivos. However, during the 18th and 19th century the absence of estate taxes meant that there was no incentive to individuals to evade the probate process. Indeed, since it was necessary to go through the process of probate in order to establish a clear transfer of legal title, there was a positive incentive to individuals to list fully the assets of the estate, whose value was determined by court appointed appraisers. Further- more, probate fees were, in those days, relatively small-averaging some 15 dollars per estate in the sample under consideration.
Probate records are available both for those who died with a will (testate) and without (intestate). In the latter case, the court of probate had to assign a division of the estate. Notably, the majority of those who died with negative net worth were also intestate, and their estates were probated at the insistence of their creditors, who appealed to the court of probate for a proportionate settlement of their claims against the assets of the estate.
It was not until the Married Womens' Property Act of 1898 that it became normal for women to be the legal owners of property in Nova Scotia. Prior to that date, unless special provision was made in the marriage contract, the assets of single women at the time of their marriage were transferred to their husband^.^ During this period, therefore, all the assets used by all members of a family were legally owned by the male head of family, in contrast to today, when assets may be the legal property of individual family members. It is thus most appropriate to think of the distribution of wealth discussed in this section as corresponding to the modern day distribution of net worth (assets minus liabilities) among economic families and unattached individuals.
Given that we know the probability of mortality (P,) and the number of estates (N,) left by each age-sex cohort, it follows that the number of families whose wealth is represented by the estates probated in a given year is C , (l/P,) - (N,). We refer to these as "probate type" families. Using the estate multiplier methodology discussed above, we estimate that there were 23,046 "probate type" families in 1871. Nevertheless, the census of Canada for that year reveals that there were 51,987 families in the 13 counties on which we have probate data, and it is the remaining 28,941 "non-probate type" families who are the major focus of this paper.
However, although we focus on the importance of alternative assumptions on the wealth of non-probated decedents, we also must note that some of the wealth of probated estates was not recorded in the probate process. By s t a t ~ t e , ~ articles of apparel and ornament of the widow and any minor children, wearing apparel of the deceased not exceeding 10 pounds in value and "such provisions and other articles as shall be necessary for the reasonable sustenance of the
'Only 1.5 percent of the estates in our sample were those of married women. Revised statues of Nova Scotia, 1864, chapter 127, section 21, pp. 449-450.
widow, if any, and also the family of the deceased for 90 days after his death" were to be excluded from the calculation of the value of the estate.
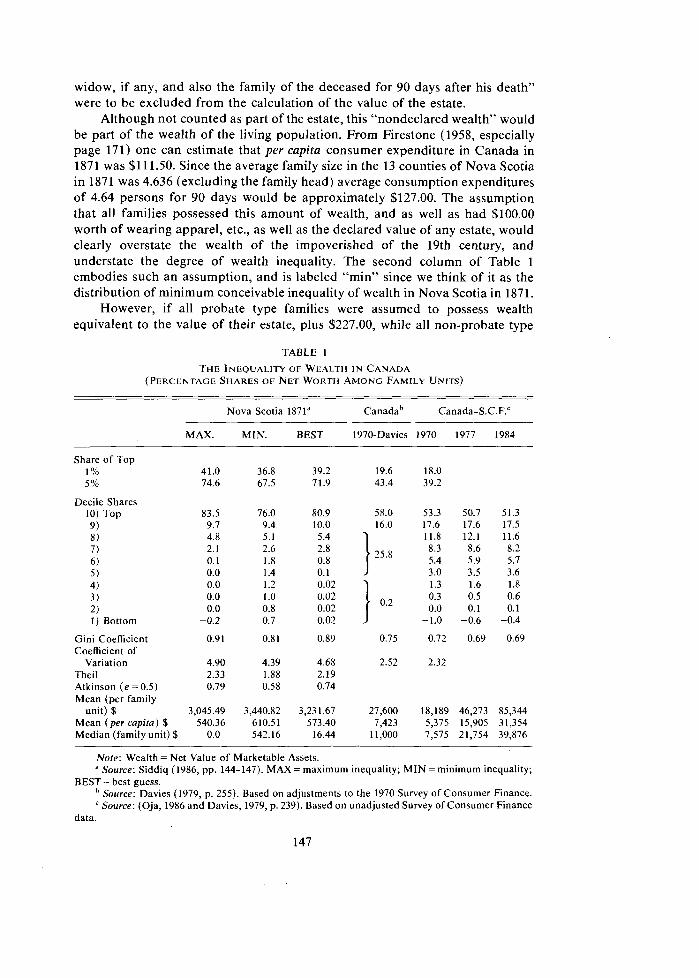
Although not counted as part of the estate, this "nondeclared wealth" would be part of the wealth of the living population. From Firestone (1958, especially page 171) one can estimate that per capita consumer expenditure in Canada in 1871 was $1 11.50. Since the average family size in the 13 counties of Nova Scotia in 1871 was 4.636 (excluding the family head) average consumption expenditures of 4.64 persons for 90 days would be approximately $127.00. The assumption that all families possessed this amount of wealth, and as well as had $100.00 worth of wearing apparel, etc., as well as the declared value of any estate, would clearly overstate the wealth of the impoverished of the 19th century, and understate the degree of wealth inequality. The second column of Table 1 embodies such an assumption, and is labeled "min" since we think of it as the distribution of minimum conceivable inequality of wealth in Nova Scotia in 1871.
However, if all probate type families were assumed to possess wealth equivalent to the value of their estate, plus $227.00, while all non-probate type
TABLE 1
Nova Scotia 1871" canadah Canada-S.C.F.'
MAX. MIN. BEST 1970-Davies 1970 1977 1984
Share of Top 1 % 5%
Decile Shares 10) Top 9) 8 ) 7 6 ) 5 4) 3) 2) 1) Bottom
Gini Coefficient Coefficient of
Variation Theil Atkinson (e = 0.5) Mean (per family
unit) $ Mean (per capita) $ Median (family unit) $
Note: Wealth = Net Value of Marketable Assets. " Source: Siddiq (1986, pp. 144-147). MAX = maximum inequality; MIN = minimum inequality;
BEST= best guess. Source: Davies (1979, p. 255). Based on adjustments to the 1970 Survey of Consumer Finance. Source: (Oja, 1986 and Davies, 1979, p. 239). Based on unadjusted Survey of Consumer Finance
data.
families were assumed to possess zero wealth, then one would clearly be understat- ing the resources available to some families. The column headed "MAX" in Table 3 embodies such an assumption, since we think of it as the distribution of maximum conceivable inequality in wealth holdings in the Nova Scotia of 1871.
Both the "max" and "min" assumptions imply a uniform level of wealth of non-probate families (equal to 0 for "MAX", equal to $227 for "MIN"). It seems more reasonable to assume that there was a graduation in relative wealth among non-probate families, with the richer non-probate type wealth holders possessing wealth equivalent to at least some probate type wealth holders, while the poorest had nil wealth. A Paretian distribution fits the wealth holdings of probate type wealth holders with R~ of 0.96 (see Appendix B) and we use this function to interpolate the wealth holdings of the lower tail of the wealth distribution.'
In particular, we assume that the maximum wealth holding of non-probate type wealth holders was $227.00 in 1871 and that the frequency distribution of non-probate type wealth holders follow the same Paretian function as estimated for probate type wealth holders, with the constraint that the minimum wealth holding of any family was 5 dollars. The results of such calculations, immodestly labeled "BEST", are presented in column 3 of Table 1.
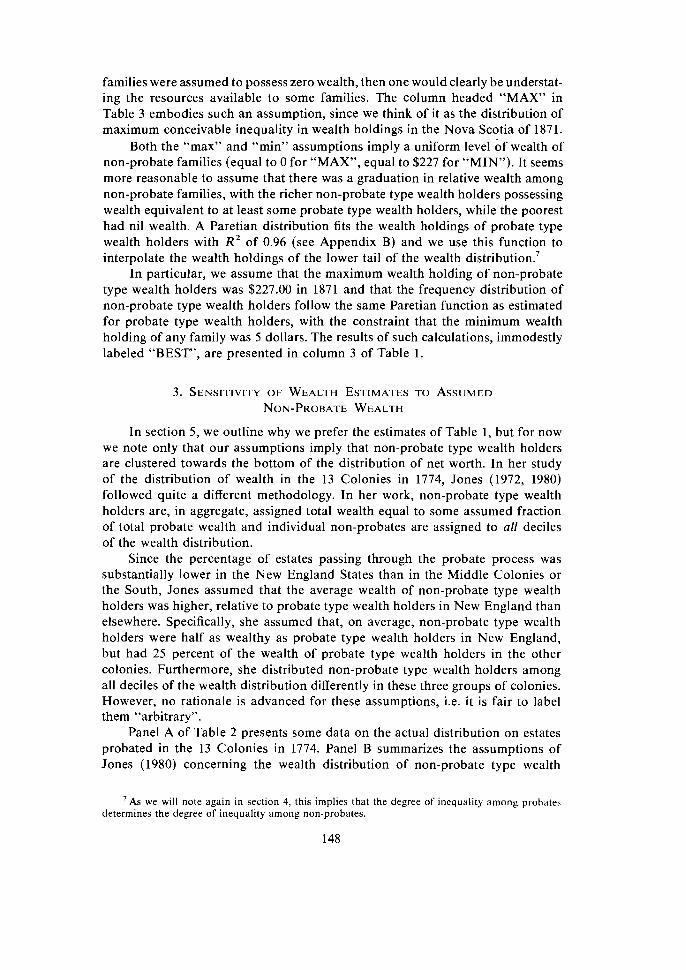
In section 5, we outline why we prefer the estimates of Table 1, but for now we note only that our assumptions imply that non-probate type wealth holders are clustered towards the bottom of the distribution of net worth. In her study of the distribution of wealth in the 13 Colonies in 1774, Jones (1972, 1980) followed quite a different methodology. In her work, non-probate type wealth holders are, in aggregate, assigned total wealth equal to some assumed fraction of total probate wealth and individual non-probates are assigned to aN deciles of the wealth distribution.
Since the percentage of estates passing through the probate process was substantially lower in the New England States than in the Middle Colonies or the South, Jones assumed that the average wealth of non-probate type wealth holders was higher, relative to probate type wealth holders in New England than elsewhere. Specifically, she assumed that, on average, non-probate type wealth holders were half as wealthy as probate type wealth holders in New England, but had 25 percent of the wealth of probate type wealth holders in the other colonies. Furthermore, she distributed non-probate type wealth holders among all deciles of the wealth distribution differently in these three groups of colonies. However, no rationale is advanced for these assumptions, i.e. it is fair to label them "arbitrary".
Panel A of Table 2 presents some data on the actual distribution on estates probated in the 13 Colonies in 1774. Panel B summarizes the assumptions of Jones (1980) concerning the wealth distribution of non-probate type wealth
'As we will note again in section 4, this implies that the degree of inequality among prohates determines the degree of inequality among non-probates.
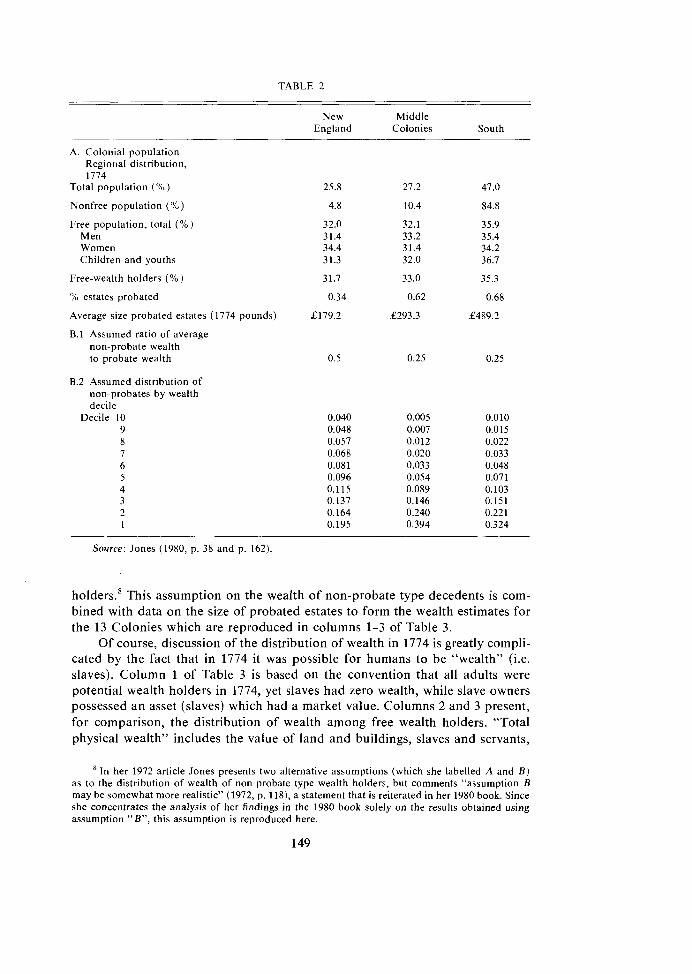
TABLE 2
New Middle England Colonies South
A. Colonial population Regional distribution, 1774
Total population (74)
Nonfree population (%)
Free population, total ('10) Men Women Children and youths
Free-wealth holders ('10)
% estates probated
Average size probated estates (1774 pounds)
B.l Assumed ratio of average non-probate wealth to probate wealth
8.2 Assumed distribution of non-probates by wealth decile
Decile 10 9 8 7 6 5 4 3
Source: Jones (1980, p. 38 and p. 162)
holder^.^ This assumption on the wealth of non-probate type decedents is com- bined with data on the size of probated estates to form the wealth estimates for the 13 Colonies which are reproduced in columns 1-3 of Table 3.
Of course, discussion of the distribution of wealth in 1774 is greatly compli- cated by the fact that in 1774 it was possible for humans to be "wealth" (i.e. slaves). Column 1 of Table 3 is based on the convention that all adults were potential wealth holders in 1774, yet slaves had zero wealth, while slave owners possessed an asset (slaves) which had a market value. Columns 2 and 3 present, for comparison, the distribution of wealth among free wealth holders. "Total physical wealth" includes the value of land and buildings, slaves and servants,
In her 1972 article Jones presents two alternative assumptions (which she labelled A and B ) as to the distribution of wealth of non-probate type wealth holders, but comments "assumption B may be somewhat more realistic" (1972, p. 118), a statement that is reiterated in her 1980 book. Since she concentrates the analysis of her findings in the 1980 book solely on the results obtained using assumption "B", this assumption is reproduced here.
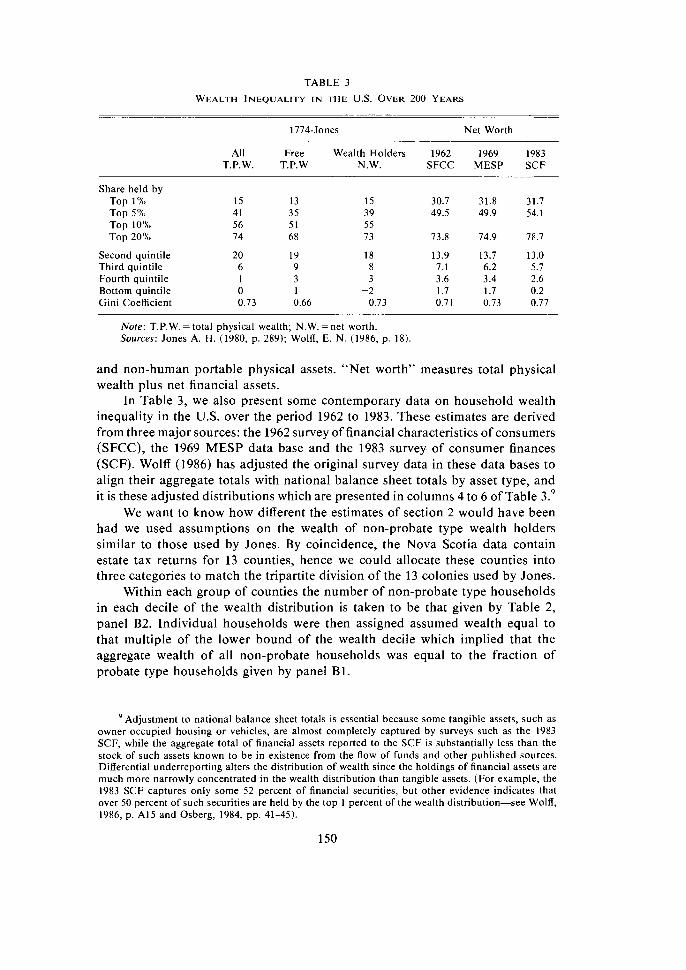
TABLE 3
WEALTH INEQUALITY I N THE U.S. OVER 200 YEARS
1774-Jones Net Worth
All Free Wealth Holders 1962 1969 1983 T.P.W. T.P.W N.W. SFCC MESP SCF
Share held by Top 1% Top 5% Top 10% Top 20%
Second quintile Third quintile Fourth quintile Bottom quintile Gini Coefficient
Note: T.P.W. = total physical wealth; N.W. =net worth. Sources: Jones A. H . (1980, p. 289); Wolff, E. N. (1986, p. 18).
and non-human portable physical assets. "Net worth" measures total physical wealth plus net financial assets.
In Table 3, we also present some contemporary data on household wealth inequality in the U.S. over the period 1962 to 1983. These estimates are derived from three major sources: the 1962 survey of financial characteristics of consumers (SFCC), the 1969 MESP data base and the 1983 survey of consumer finances (SCF). Wolff (1986) has adjusted the original survey data in these data bases to align their aggregate totals with national balance sheet totals by asset type, and it is these adjusted distributions which are presented in columns 4 to 6 of Table 3.9
We want to know how different the estimates of section 2 would have been had we used assumptions on the wealth of non-probate type wealth holders similar to those used by Jones. By coincidence, the Nova Scotia data contain estate tax returns for 13 counties, hence we could allocate these counties into three categories to match the tripartite division of the 13 colonies used by Jones.
Within each group of counties the number of non-probate type households in each decile of the wealth distribution is taken to be that given by Table 2, panel B2. Individual households were then assigned assumed wealth equal to that multiple of the lower bound of the wealth decile which implied that the aggregate wealth of all non-probate households was equal to the fraction of probate type households given by panel B1.
Adjustment to national balance sheet totals is essential because some tangible assets, such as owner occupied housing or vehicles, are almost completely captured by surveys such as the 1983 SCF, while the aggregate total of financial assets reported to the SCF is substantially less than the stock of such assets known to be in existence from the flow of funds and other published sources. Differential underreporting alters the distribution of wealth since the holdings of financial assets are much more narrowly concentrated in the wealth distribution than tangible assets. (For example, the 1983 SCF captures only some 52 percent of financial securities, but other evidence indicates that over 50 percent of such securities are held by the top 1 percent of the wealth distribution-see Wolff, 1986, p. A15 and Osberg, 1984, pp. 41-45).
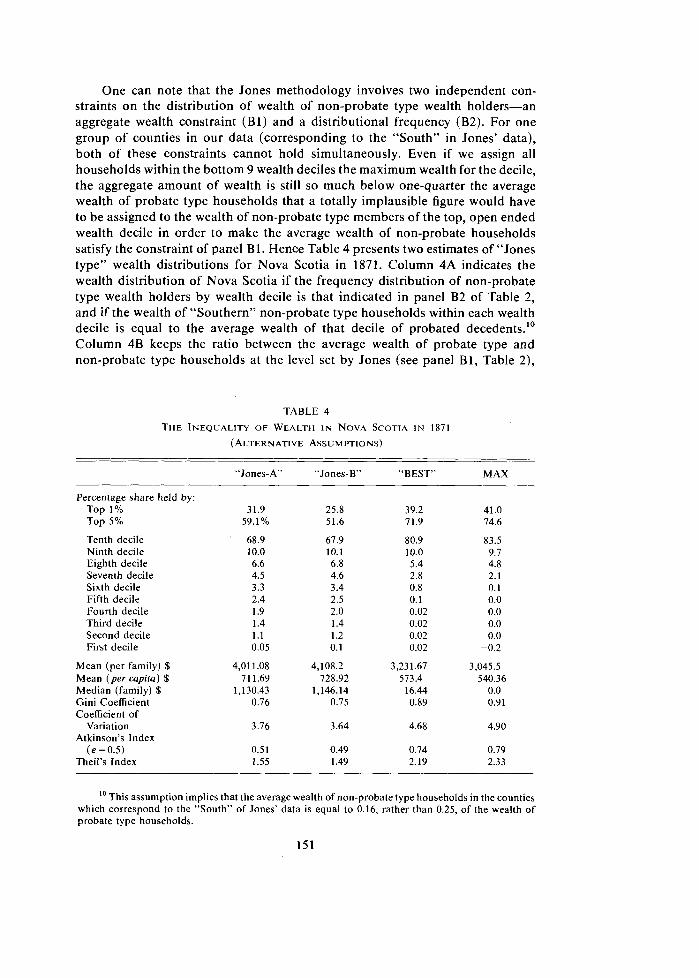
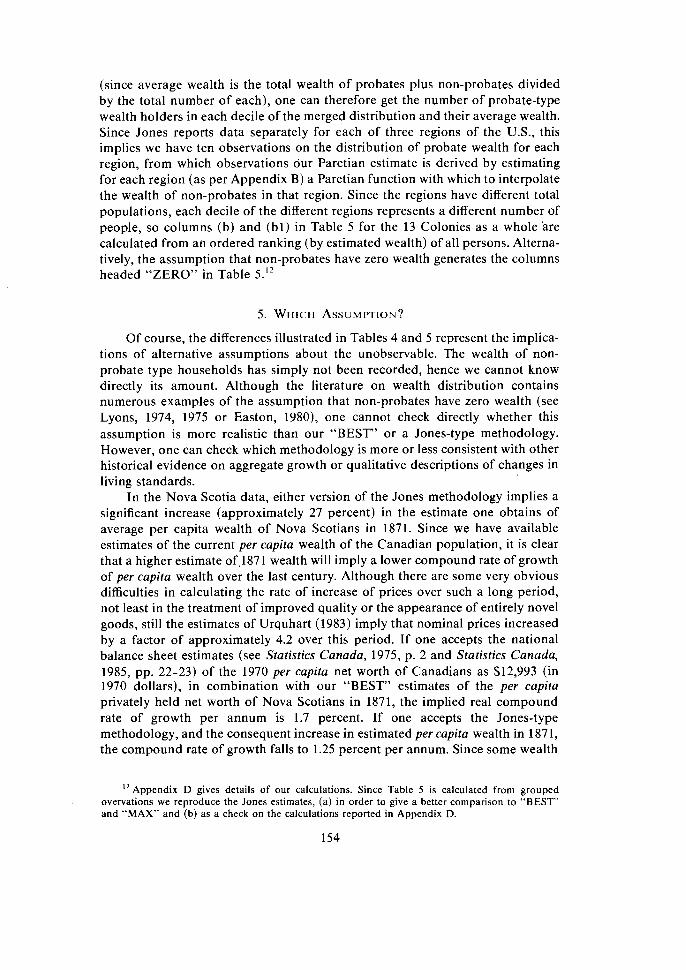
One can note that the Jones methodology involves two independent con- straints on the distribution of wealth of non-probate type wealth holders-an aggregate wealth constraint (B1) and a distributional frequency (B2). For one group of counties in our data (corresponding to the "South" in Jones' data), both of these constraints cannot hold simultaneously. Even if we assign all households within the bottom 9 wealth deciles the maximum wealth for the decile, the aggregate amount of wealth is still so much below one-quarter the average wealth of probate type households that a totally implausible figure would have to be assigned to the wealth of non-probate type members of the top, open ended wealth decile in order to make the average wealth of non-probate households satisfy the constraint of panel B1. Hence Table 4 presents two estimates of "Jones type" wealth distributions for Nova Scotia in 1871. Column 4A indicates the wealth distribution of Nova Scotia if the frequency distribution of non-probate type wealth holders by wealth decile is that indicated in panel B2 of Table 2, and if the wealth of "Southern" non-probate type households within each wealth decile is equal to the average wealth of that decile of probated decedents." Column 4B keeps the ratio between the average wealth of probate type and non-probate type households at the level set by Jones (see panel B1, Table 2),
TABLE 4
THE INEQUALITY OF WEALTH I N NOVA SCOTIA I N 1871
(ALTERNATIVE ASSUMPTIONS)
"BEST" MAX
Percentage share held by: Top 1% Top 5%
Tenth decile Ninth decile Eighth decile Seventh decile Sixth decile Fifth decile Fourth decile Third decile Second decile First decile
Mean (per family) $ Mean (per capita) $ Median (family) $ Gini Coefficient Coefficient of
Variation Atkinson's Index
( e = 0.5) Theil's Index
10 This assumption implies that the average wealth of non-probate type households in the counties which correspond to the "South" of Jones' data is equal to 0.16, rather than 0.25, of the wealth of probate type households.
but assumes that the frequency distribution of non-probate type wealth holders across wealth deciles in the "Southern" counties is the same as that in the "New England" counties.
For ease of comparison we reproduce in Table 4 our "BEST" and "MAX" estimates of the wealth distribution, already presented in Table 1. Our major point, of course, is that our "BEST" estimates display sharply greater inequality in the wealth distribution than that indicated by the Jones methodology. The Jones methodology implies that the GiniCoefficient of the distribution of wealth in Nova Scotia in 1871 was approximately 0.75, an estimate quite similar to that reported by Jones for the 13 Colonies in 1774 (or for the US. in 1969) (see Table 3). However, our "BEST" estimate of the Gini coefficient puts it at 0.89 and the "zero-wealth" assumption for non-probates ("MAX") implies even greater measured inequality.
As many authors have noted," the Gini coefficient is a measure of inequality which is particularly sensitive to variations in inequality in the middle range of the wealth distribution. Further, if the Lorenz curves of the wealth distribution had happened to cross under the two alternative assumptions, then rankings of wealth inequality would be ambiguous (see Atkinson, 1970). However, in this case there is no ambiguity in ranking since the "BEST" and "MAX" estimates imply a wealth distribution that is more unequal at every point in the distribution.
The degree of change which one perceives in measured inequality is, of course, dependent on which index of inequality one uses. The Atkinson index, which is framed to emphasize inequality in the lower tail of the distribution of wealth, increases much more dramatically than the Gini index, i.e. to 0.74 under the best guess estimates compared to 0.51 under the Jones methodology. Clearly, our measurement of the distribution of wealth is sensitive to the assumption we make regarding non-probate wealth, but the degree of sensitivity depends partially on the index of inequality we adopt (and, therefore, on our implicit social welfare function-see Atkinson, 1970).
4. WEALTH INEQUALITY I N THE 13 COLONIES
How different would Jones' estimates of American wealth inequality in 1774 have been if she had used alternative assumptions on non-probate wealth? Table 5 presents our estimates of the implications of assuming: (a) that non-probate wealth was distributed as in panel B of Table 2; (b) that the distribution of non-probate wealth, within region, can be estimated as a Paretian function of probate wealth and (c) that non-probates had zero wealth.
In order to compute Table 5, we had to separate probate and non-probate type wealth holders-something which Jones does not do explicitly. However, one can compute the average wealth of each decile of probate and non-probate type wealth holders, by region, from Jones (see Table 6.1, 1980, p. 162). One knows as well the number of non-probate types, by region (see Table 2, panel B2), who were added to each decile of original probate-type individuals to give the total population, on which Jones reported. By subtraction and manipulation
I ' E.g. Charnpernowne (1974), Cowell (1977, p. 28) or Osberg (1984 pp. 16-24).
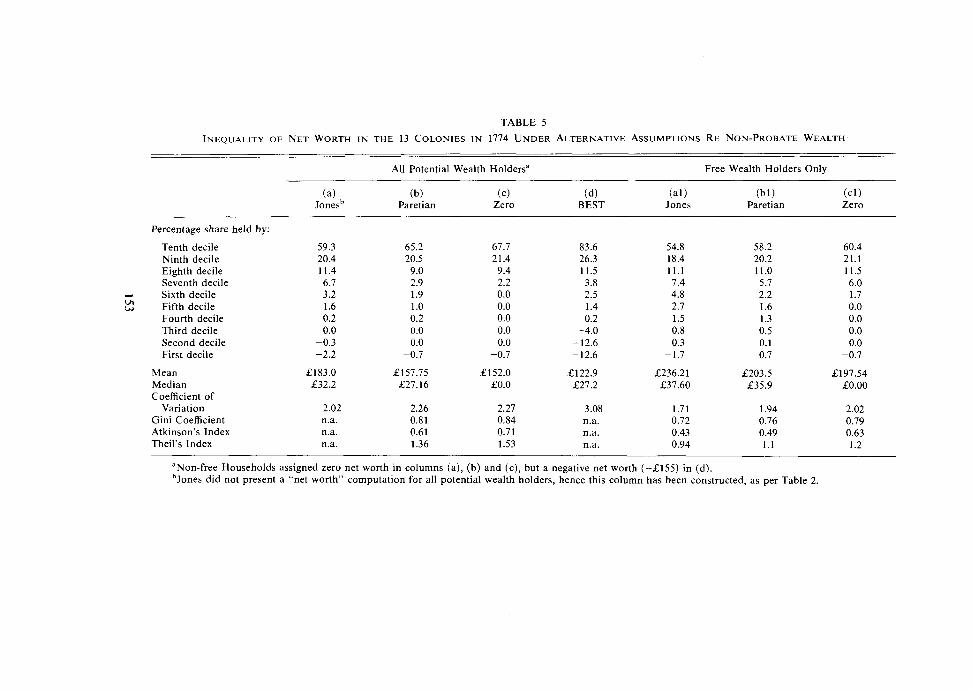
TABLE 5
INEQUALITY OF NET WORTH I N THE 13 COLONIES IN 1774 UNDER ALTERNATIVE ASSUMPTIONS RE NON-PROBATE WEALTH
All Potential Wealth Holdersa Free Wealth Holders Only
(a) (b? (c) (d? ( a l l (b l ) (cl) ones^ Paretian Zero BEST Jones Paretian Zero
Percentage share held by:
Tenth decile Ninth decile Eighth decile Seventh decile Sixth decile Fifth decile Fourth decile Third decile Second decile First decile
Mean Median Coefficient of
Variation Gini Coefficient Atkinson's Index Theil's Index
--
"Non-free Households assigned zero net worth in columns (a), (b) and (c), but a negative net worth (-2 155) in (d). hJones did not present a "net worth" computation for all potential wealth holders, hence this column has been constructed, as per Table 2.
(since average wealth is the total wealth of probates plus non-probates divided by the total number of each), one can therefore get the number of probate-type wealth holders in each decile of the merged distribution and their average wealth. Since Jones reports data separately for each of three regions of the U.S., this implies we have ten observations on the distribution of probate wealth for each region, from which observations our Paretian estimate is derived by estimating for each region (as per Appendix B) a Paretian function with which to interpolate the wealth of non-probates in that region. Since the regions have different total populations, each decile of the different regions represents a different number of people, so columns (b) and (b l ) in Table 5 for the 13 Colonies as a whole Bre calculated from an ordered ranking (by estimated wealth) of all persons. Alterna- tively, the assumption that non-probates have zero wealth generates the columns headed "ZERO" in Table 5.12
Of course, the differences illustrated in Tables 4 and 5 represent the implica- tions of alternative assumptions about the unobservable. The wealth of non- probate type households has simply not been recorded, hence we cannot know directly its amount. Although the literature on wealth distribution contains numerous examples of the assumption that non-probates have zero wealth (see Lyons, 1974, 1975 or Easton, 1980), one cannot check directly whether this assumption is more realistic than our "BEST" or a Jones-type methodology. However, one can check which methodology is more or less consistent with other historical evidence on aggregate growth or qualitative descriptions of changes in living standards.
In the Nova Scotia data, either version of the Jones methodology implies a significant increase (approximately 27 percent) in the estimate one obtains of average per capita wealth of Nova Scotians in 1871. Since we have available estimates of the current per capita wealth of the Canadian population, it is clear that a higher estimate of.1871 wealth will imply a lower compound rate of growth of per capita wealth over the last century. Although there are some very obvious difficulties in calculating the rate of increase of prices over su h a long period, 'i not least in the treatment of improved quality or the appearance of entirely novel goods, still the estimates of Urquhart (1983) imply that nominal prices increased by a factor of approximately 4.2 over this period. If one accepts the national balance sheet estimates (see Statistics Canada, 1975, p. 2 and Statistics Canada, 1985, pp. 22-23) of the 1970 per capita net worth of Canadians as $12,993 (in 1970 dollars), in combination with our "BEST" estimates of the per capita privately held net worth of Nova Scotians in 1871, the implied real compound rate of growth per annum is 1.7 percent. If one accepts the Jones-type methodology, and the consequent increase in estimated per capita wealth in 1871, the compound rate of growth falls to 1.25 percent per annum. Since some wealth
"Appendix D gives details of our calculations. Since Table 5 is calculated from grouped overvations we reproduce the Jones estimates, (a) in order to give a better comparison to "BEST" and "MAX" and (b) as a check on the calculations reported in Appendix D.
was publicly held in 1871, both estimates are undoubtedly in errorI3 but we have no hesitation in choosing the former as more credible.
Furthermore, if we accept both the Jones' methodology and the price index calculations of Urquhart, we will be driven to the conclusion that the wealth of some of the lower deciles of the wealth distribution must have fallen absolutely over the last century. If we chose either "Jones-type" methodology, the third decile is estimated to have 1.4 percent of net worth, or about $568.35 on average in 1871 dollars, or approximately $2,393 in 1970 dollars. But, Oja's (1986, p. 352) estimate of the decile shares of Canadian families implies that the net worth of the third decile of the 1971 wealth distribution was 0.3 percent of total net worth of all Canadian family units. Since the mean wealth of all families was $33,67214 in 1970, the average wealth of the third decile of Canadian families in 1970 was $1,010. Although Marx did argue that capitalist development will "immiserize the proletariat" we think that available qualitative descriptions of Nova Scotia life in the 1870s are just not consistent with the idea that workers then were substantially more wealthy than today.
We also think it likely that wealth holdings of any appreciable size did pass through the probate process in Nova Scotia. As early as 1758, separate courts of probate, each headed by a probate judge, had been established in each county of Nova Scotia. The mechanism of probate was thus very well established in the province, and the provincial statute of wills of 1758 directed the executor of an estate to register the estate within 30 days of the death of the testator with a penalty of 2 5 sterling for each month of delay. With such an incentive, it would be reasonable to expect most executors to comply with the probate process.
For individuals who died intestate, it was expected that the widow or next of kin would apply for administration of the estate within 30 days after the death had occurred. If they failed to apply in that time, Murdoch (1833, p. 41) states that the judge of probate "shall grant administration to such person or persons as he shall judge fit." This implies the judge was expected to know about the deaths of wealth holders in his county-a not unreasonable expectation given the relatively small size and rural nature of most counties. Since three months subsistence was automatically to be excluded from the calculation of the estate, it would be reasonable to suppose that the probate judge would not bother to assess estates which he had reasonable grounds to believe would fall below this amount. However, the heirs to an individual who died intestate with any larger amount of assets would have a clear incentive to apply to the court of probate for settlement of the estate, in order to ensure clear legal title to any of the property of the estate, and in particular to any land.
We therefore find it most likely that the estates which did not pass through the probate process were those of the relatively poor, consisting largely of items
"That is, since the 1970 balance sheet includes all assets and liabilities, public and private, the rate of growth of real wealth per capita would only be 1.7 percent per annum if the public sector had zero net assets in 1871, and represents an over estimate of the growth rate of net assets if the public sector was a net creditor. Unfortunately, although the liabilities of the public sector in 1871 can be established, no comprehensive valuation of publicly owned capital assets is available.
l4 Note that mean net worth reported in Table 1 is substantially lower, at $27,600. The difference arises because the net worth estimates of Oja refer to marketable assets (i.e. they exclude life insurance and funded pension plans) while the "wealth" concept includes these items-see Davies (1979, p. 225).
of personal apparel, tools and household utensils. For these assets, an informal division upon death would be sufficient. Many of the poor, in the nineteenth century undoubtedly had assets less than 90 days subsistence and would not participate in the probate process. But we do not think it likely that estates of any appreciable magnitude would have evaded the probate process. And, since there was no estate duty or other form of inheritance tax enforced at this time, no incentive existed to underreport the magnitude of estates.
For all these reasons, we reject the Jones methodology-at least for the Nova Scotia data. Yet we find it equally hard to presume that there were no distinctions among non-probates, i.e. that they were all penniless. Hence, our preference is for the "BEST" estimates.
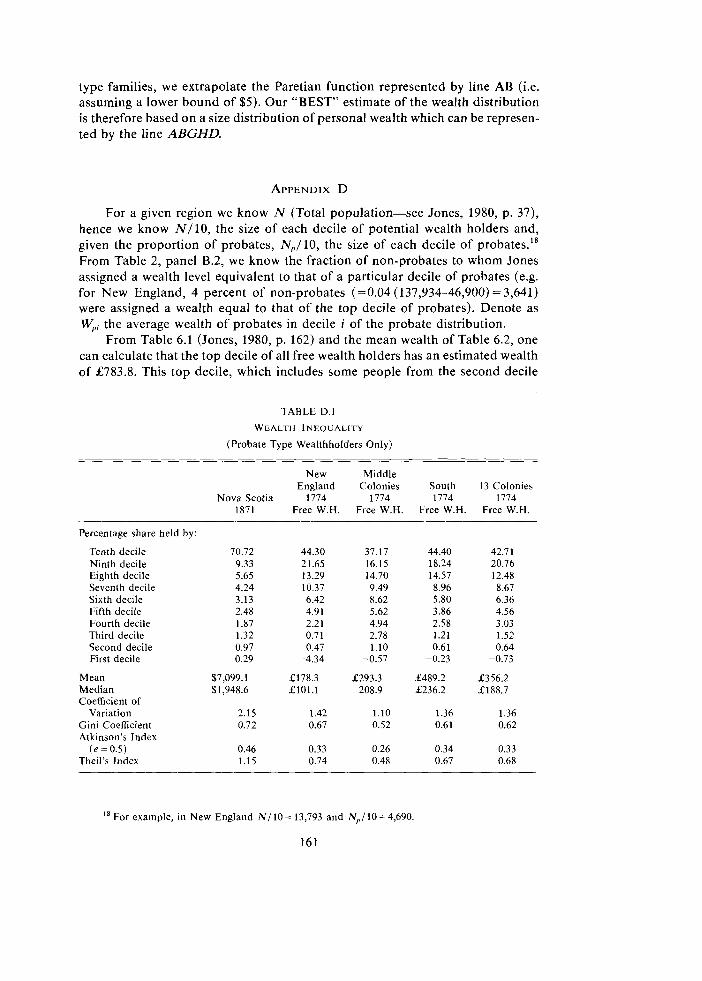
In the 13 Colonies, alternative assumptions on non-probate wealth make a less dramatic difference to measured inequality than in Nova Scotia, if we rely on a mid-range sensitive measure such as the Gini index. As Table D.l illustrates, among probated decedents there was less inequality in any of the three regions of the 13 Colonies than in Nova Scotia. Our methodology of extrapolating from probates basically "builds in" this lesser probate inequality into our estimate of non-probate inequality. Since alternative assumptions regarding non-probate wealth really concern the lower tail of the distribution of wealth, while the Gini index is mid-range sensitive, it is not surprising that the greatest sensitivity is shown by measures such as the Atkinson index.
In the 13 Colonies data, slaves were clearly at the bottom of the distribution of wealth and the implications of slavery are particularly troublesome. We are of the opinion that in measuring inequality one should count all persons some- where-slaves were, after all, a part of Colonial society, albeit an exploited part. Yet the convention of counting slaves as possessors of zero wealth (and slave- owners as the owners of a slave's market value) has the dubious implication that freeindividuals withdebts exceeding assets are countedas "worse off" thanslaves !I5
As well, including the value of slaves as "wealth" to their owners counts some of the human capital of the 13 Colonies, but the human capital of the free population is omitted, hence aggregate "wealth" cannot be compared easily with current wealth estimates. Although it is somewhat distasteful to "put a price upon liberty", presumably slaves had negative net worth at least equal to the price of their freedom-i.e. in order to be as well off as a free person with zero assets, a slave had to pay, to his or her owner, his/her market price. If we make this assumption, then (1) the degree of increase which we observe in measured inequality is especially sensitive to the index of inequality we use and (2) we must rely on measures of inequality which can be calculated for negative wealth values.16
l 5 And since a Jones methodology inflates the number of individuals in each probate decile, the number of negative net worth individuals is higher than in columns b or c.
l 6 Strictly speaking we should refer to a "quasi-Gini" index in Tables 4 and 5 since a true Gini Index cannot be calculated for a distribution with negative values-see Cowell (1977). Nevertheless, wealth distributions contain negative values and the Gini index is by far the most popular measure of inequality. The "Gini" we report is based on aggregating the bottom fractiles of the distribution until cumulative net worth is zero and calculating a Gini index as if they all possessed zero net worth. Similarly, Atkinson's and Theil's indices cannot be calculated for negative values-but we have included approximations in those cases where negative wealth holders were relatively rare (i.e. by
Column (d) of Table 5 assigns all slave families a negative net worth of £155.16, which is the weighted average of slave prices reported in Jones (1980, p. 16) assuming the age/sex distribution of slaves was the same as that of the free population. We label this column "BEST" since we believe that estimating the distribution of wealth among families must count slaves as persons who were less wealthy than penniless free families, and we believe that non-probate free families had a range of wealth, albeit slight. We note that the decile shares indicate a rather high degree of wealth inequality-greater than that reported in Table 4 and certainly greater than present-day wealth inequality.
We conclude that it is most reasonable to assume that non-probate type families were clustered at the bottom of the distribution of personal wealth in Nova Scotia in 1871. It follows from this that we believe that inequality in the distribution of personal net worth in Nova Scotia in 1871 was substantially greater than that which exists today in Canada. Since the equalization of personal net worth over the past century has been accompanied by a steady rise in the proportion of assets which are publicly owned" and an increasing importance of non-marketable pension rights as a store of future consumption, we conclude that there has been a long-run trend to greater equality in the distribution of wealth in Canada.
However, we also conclude that we would have arrived at a measure of personal wealth inequality in 1871 that was only slightly greater than wealth inequality in the 1970s in Canada, had we adopted methodological assumptions similar to those used by Jones (1972, 1980). We noted the sensitivity of estimates of historic wealth inequality using the estate multiplier methodology to the assumptions one makes as to the wealth of non-probated decedents. Since we argue that one should assume that non-probate type families were clustered at the bottom of the distribution of personal wealth, we examined the sensitivity of Jones' estimates of the inequality of persona1 wealth in the 13 Colonies in 1774 to alternative assumptions concerning the distribution of non-probate wealth.
Although the 13 Colonies data for free wealth holders do not appear to be as sensitive to alternative non-probate assumptions as the Nova Scotia data we conclude that if Jones had adopted a methodology similar to our "BEST" estimates, measured wealth inequality in 1774 would have been seen as higher, leading one to perceive a fairly uninterrupted long-run trend to the equalization of personal wealth in the United States. This perception of a trend to decreased inequality is strengthened if one counts (as we believe one should) slaves as persons who were significantly less wealthy than the penniless free.
It is, however, difficult to compare the degree of inequality in a society which is partially in slavery to the degree of inequality in a wholly free society-not
putting negative net worth to zero). These approximations may not do much harm when net debtors are relatively rare (as in an entirely free population), but cannot be defended if slaves (who were a substantial fraction of the 13 Colonies' population) are assigned negative net worth.
"The share of private wealth in national wealth had dropped to 75.5. percent in 1970 and percent in 1977, Statistics Canada (1985, pp. 22-23, 36-37).
least because of the philosophical issues involved. It does seem clear to us that the sensitivity of measured wealth inequality to the non-probate wealth and slavery assumptions implies that future studies of wealth inequality using the estate multiplier methodology should report the results of a variety of assumptions on the wealth of slaves and of non-probated decedents.
APPENDIX A
Data Sources
Three main sources of data were used in this study-the 1871 census of Canada, death records for the province of Nova Scotia in 1871 and probate records and estate papers filed in 1871 and later years for those who died in 1871. Due to a combination of circumstances, 1871 is one of the few years in which all three data sources are available.
The 1871 census of Canada provides a detailed description of the population of the province of Nova Scotia by age, sex and household characteristics. The death records of the province of Nova Scotia were used, in combination with population estimates of the census by age and sex, to construct mortality rate estimates by age and sex. In addition, the census estimate of the number of households in the province of Nova Scotia in 1871 is assumed here to be the number of potential wealth-holding units (i.e. households). The wealth data used in the study comes from the probate records of decedents who died in Nova Scotia in 1871, in 13 of Nova Scotia's 18 counties. Five counties (Digby, Guysborough, Richmond, Cumberland and Inverness) were excluded from the study because their estate papers were either missing or unusable. In the remaining 13 counties, 387 estate papers (i.e. wills, letters testamentary, letters of administra- tion and probate acts) were found for 1871 decedents. Since some estate papers were incomplete, and some could not be matched with death records for 1871, this study is based on 243 primary records.
The gross value of an estate in this study is the estimated market value of all the real and personal estate, including cash and bank deposits as well as moneys owing to the deceased, at the time of his death as appraised by court appraisers. The net worth of the estate is the value of the estate after all legitimate claims against the estate and debts due by the estate at the time of the wealth holder's death are deducted from the gross value.
In order to use the estate multiplier technique, one must know the age at death of each probated decedent. This information is not typically available in the estate papers, hence it was necessary to match the names of probated decedents whose estates were filed in 1871 and 1872 with the names on the death records for each county of Nova Scotia. The death records for the period 1864 to 1876177 are available at the provincial archives of Nova Scotia, but not for other years. They record the age and sex of each decedent, and appear to be highly reliable. However, for 103 of the 346 estates whose net worth could be clearly established, it was not possible to establish an unambiguous link to the death records. These cases were therefore dropped from analysis. If one compares the mean, and the variance, of the distribution of estate size for the 103 excluded decedents and the 243 included cases, there is no statistically significant difference. Hence, one
has some confidence in concluding that the 243 included cases are a random sample of the 346 estates whose sizes were known.
The two largest estates in the sample of 346 for 1871 were dropped from analysis, the first because the individual involved (one Enos Collins) was reported to be the richest man in British North America when he died (and therefore one could not conclude that his estate "represented" the wealth of any other living persons), while the second largest estate could not be matched for age. Our measurement of wealth inequality in 1871 would have been greater if these two estates had been included, but their inclusion would also have exposed our study to the potential criticism that sampling variability in the extreme upper tail of the distribution of estates was dominating our estimate of the concentration of wealth.
The primary records are from the 1871 census, death records are for the province of Nova Scotia and the probate court records are available at the Public Archives of Nova Scotia, Halifax, Canada. Micro-data summarizing this information is available on request from the authors.
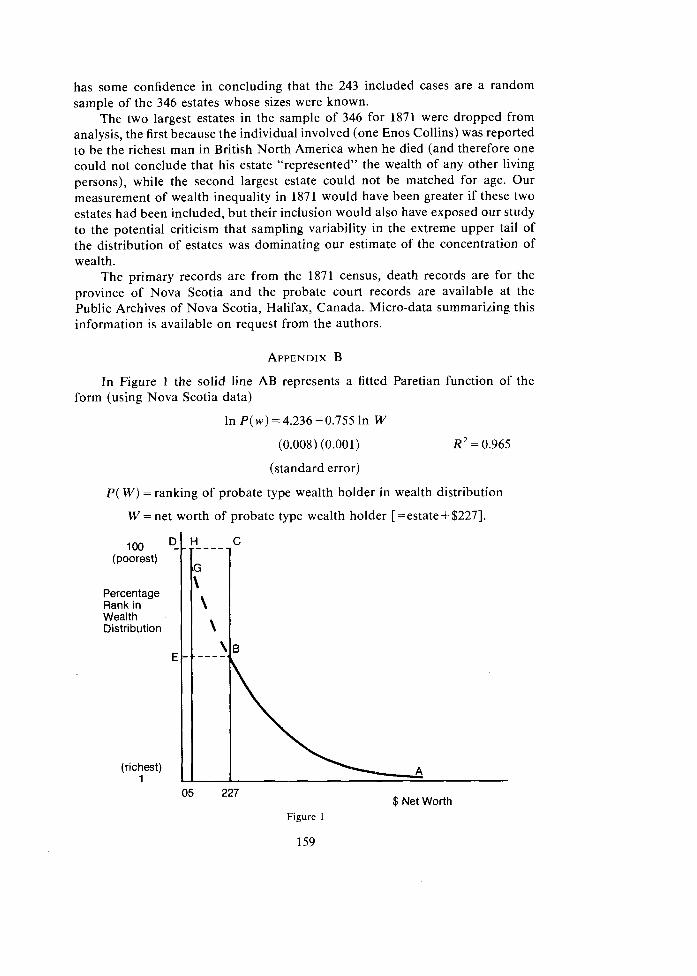
In Figure 1 the solid line AB represents a fitted Paretian function of the form (using Nova Scotia data)
(standard error)
P( W) = ranking of probate type wealth holder in wealth distribution
W = net worth of probate type wealth holder [=estate + $2271.
100 (poorest)
Percentage Rank in Wealth Distribution
(richest) 1
05 227 $ Net Worth
Figure 1
If we assume that "non-declared wealth" was approximately $227.00 per family, then line segment BC represents the "MIN" assumption, namely that all non- probate type families possessed this amount of wealth. Under this assumption, a diagram representing the size distribution of personal wealth would be given by the line ABCD. However, the alternative assumption ("MAX" in Table 1) was based on the idea that all non-probate type decedents had zero net worth. In Figure 1, the line ABED would represent the size distribution of personal wealth under such an assumption.
However, if one assumes that probate-type wealth holders had wealth, while living, which included the value of "non-declared wealth" as well as the appraised value of their personal estate, then the wealth of probate-type wealth holders would be given by the line AB. Assuming that $5 represents a minimum lower bound on the value of wearing apparel, personal utensils, etc., of non-probate
Distribution of Wealth Among Males 20 Years Old and Over, Milwaukee County, 1870
Lower Limit Total of the Number Wealth of males Class in in the Dollars Wealth
X Class
All Groups
Total Amount of N, or the Wealth in percent
Thousands of total of Dollars Males
in the Above the Wealth Lower Class Limit, X
Nativity Groups
A, or the percent Total Total of total Number of Number of Males Native-born Foreign-born
Above the Males in Males in Lower the Wealth the Wealth
Limit, X Class Class
Arithmetic mean
Median
Gini coefficient
Source: Soltow (1971, p. 72).
type families, we extrapolate the Paretian function represented by line AB (i.e. assuming a lower bound of $5). Our "BEST" estimate of the wealth distribution is therefore based on a size distribution of personal wealth which can be represen- ted by the line ABGHD.
For a given region we know N (Total population-see Jones, 1980, p. 37), hence we know N/10, the size of each decile of potential wealth holders and, given the proportion of probates, N,/10, the size of each decile of probates.'8 From Table 2, panel B.2, we know the fraction of non-probates to whom Jones assigned a wealth level equivalent to that of a particular decile of probates (e.g. for New England, 4 percent of non-probates (=0.04 (137,934-46,900) = 3,641) were assigned a wealth equal to that of the top decile of probates). Denote as Wpi the average wealth of probates in decile i of the probate distribution.
From Table 6.1 (Jones, 1980, p. 162) and the mean wealth of Table 6.2, one can calculate that the top decile of all free wealth holders has an estimated wealth of X783.8. This top decile, which includes some people from the second decile
TABLE D.l
WEALTH INEQUALITY
(Probate Type Wealthholders Only)
New Middle England Colonies South 13 Colonies
Nova Scotia 1774 1774 1774 1774 1871 Free W.H. Free W.H. Free W.H. Free W.H.
Percentage share held by:
Tenth decile Ninth decile Eighth decile Seventh decile Sixth decile Fifth decile Fourth decile Third decile Second decile First decile
Mean Median Coefficient of
Variation Gini Coefficient Atkinson's Index
( e = 0.5) Theil's Index
For example, in New England N/10= 13,793 and N,/10=4,690.
161
of probates, therefore has total wealth of
We have, therefore, a system of ten equations in ten unknowns which becomes an over-determined system of eleven equations if the aggregate probatelnon- probate wealth constraint (Table 2, panel B.l) is included. We solved this system "from the bottom up," using the solution which preserved decile ranking where multiple solutions were possible. Table D.l presents our estimates of the inequality of probate type wealth holders only-which is notably greater in the Nova Scotia data than in the 13 Colonies data.
Atkinson, A. B., On the Measurement of Equality, Journal of Economic Theory, 2, 244-263, 1970. Census of Canada (1871), Ministry of Agriculture, Ottawa, 1873. Champernowne, D. G., A Comparison of Measures of Inequality of Income Distribution, The
Economic Journal, 84, 788-816, 1974. Cowell, F. A., Measuring Inequalrty, Philip Allan Publishers, Oxford, 1977. Davies, J. B., On the Size Distribution of Wealth in Canada, Review of Income and Wealth, 25 (3),
237-259, 1979. Death Records of Nova Scotia (1871), Microfilm copy, Public Archives of Nova Scotia, Halifax, Nova
Scotia. Easton, B. H., Social, Policy and the Welfare State in New Zealand, Allen and Unwin, London, 1980. Feldstein, M., Social Security and the Distribution of Wealth, Journal of the American Statistical
Association, 71 (356) 800-807, 1976. Firestone, 0. J., Canada's Economic Development: 1857-1953, Bowes, London, 1958. Gallman, R. E., Trends in the Size Distribution of Wealth in the 19th Century, 6 Papers on the
Distribution of Wealth and Income, Soltow, L. (ed.), NBER, New York, pp. 1-30, 1969. Harbury, C. D. and Hitchens, D. M., The Injluence of Relative Prices on the Distribution of Wealth
and the Measurement of Inheritance, Unpublished manuscript, 1983. C. V. Starr Conference on the International Measurement of the Distribution of Wealth-revised version in Wolff (1987).
Harrison, A. J., The Distribution of Wealth in 10 Countries, Royal Commission o n the Distribution of Income and Wealth, Background Paper No. 7, Her Majesty's Stationery Office, London, 1979.
Internal Revenue Service, Statistics in Income-1972, Personal Wealth Estimates from Estate Tax Returns, U.S. Government Printing Office, 1976.
Jones, A. H., Wealth Estimates for the New England Colonies About 1770, Journal of Economic History, 32. (I), 98-127, 1972.
-, Wealth of a Nation to Be: The American Colonies on the Eve of the Revolution, Columbia University Press, New York, 1980.
Lampman, R. J., The Share of Top Wealth Holders in National Wealth, 1922 to 1956, NBER, Princeton University Press, Princeton, New Jersey, 1962.
Lyons, P. M., The Distribution of Personal Wealth in Ireland, in Tait, A. A. and Bristow, J. A. (eds.), Ireland-Some Problems of a Developing Economy, Gill and Macmillan, Dublin, 1972.
-, P. M., The Size Distribution of Personal Wealth in the Republic of Ireland, Review of Income and Wealth, 20. (2), 181-202, 1974.
-, Estate Duty Wealth Estimates and the Mortality Multiplier, Economic and Social Review, (3) 337-352, 1975.
Marx, Karl, Das Capital International Publishers Company, New York, New York, Vol. 1, 1987. McGrath, M. D., Distribution of Personal Wealth in South Africa, Economic Research Unit, Occasional
Paper No. 14, University of Natal, Durban, 1982. Mendershausen, H., The Pattern of Estate Tax Wealth, in A Study of Saving in the United States,
Goldsmith, R. W. (ed.), Vol. 3, Princeton University Press, Princeton, New Jersey, 1956. Murdoch, B., Epitome of the Laws of Nova Scotia, Vol. 3, Printed by Joseph Howe, Halifax, 1833. Oja, Gail, Distribution of Wealth in Canada 1970-1984, Unpubolished manuscript, paper presented
to Conference on "Trends in Social Inequality" University of Western Ontario, October 1986. Osberg, L., Economic Inequality in the United States, M. E. Sharpe, Inc., New York, 1984. Probate Records of Nova Scotia (1871, 1872), microfilm copy, Public Archives of Nova Scotia,
Halifax, Nova Scotia.
162
Revised Statutes of Nova Scotia (1864), Of the Probate Court, chapter 127, J . M. W. Compton, Publishers, pp. 447-465.
-, (1900), Married Womens' Property Act 1898, chapter 112, The Commissioner of Works and Mines, Queens Printer, pp. 233-245.
Siddiq, F. K., The Inequality of Wealth and its Distribution in a Life-Cycle Framework, Ph.D. Dissertation, Dalhousie University, Halifax, Nova Scotia, 1986.
Smith, J. D. (ed.), Modelling the Distribution and Intergenerational Transmission of Wealth, NBER Studies in Income & Wealth, Vol. 46, University of Chicago Press, Chicago, 1980.
Smith, J. D. and Franklin, S. D., The Concentration of Personal Wealth, 1922-1969, American Economic Review, 64 (2), 162-167, 1974.
Spant, R. Wealth Distribution in Sweden, 1920-1983, in Wolff, E. N. 1987. Soltow, L. (ed.), Six papers on the Size Distribution of Wealth and Income, National Bureau of
Economic Research, New York, 1969. Soltow, L., Patterns of Wealthholding in Wisconsin since 1850, The University of Wisconsin Press,
Madison, 1971. Statistics Canada, Quarterly Estimates of Population for Canada, the Provinces and the Territories, No.
91-001, the Minister of Supply and Services of Canada, Ottawa, 1975. The National Balance Sheer Accounts, 1961-1984, International and Financial Economics Division, Financial Flows Section, No. 13-214, the Minister of Supply and Services of Canada, Ottawa, 1985.
Urquhart, F. H., Historical Statistics of Canada, Leavy, F. H. (ed.), 2nd edn, Ottawa; published by Statistics Canada in joint sponsorship with the Social Science Federation of Canada, 1983.
Williamson, J. G. and Lindert, P. H., Long-Term Trends in Amercan Wealth Inequality, in Smith, J. D. (ed.), pp. 9-94, 1980.
Wolff, E. N., The Size Distribution of Household Disposable Wealth in the United States, Review of Income and Wealth, 29 (2), 125-146, 1983.
-, Estimates of Household Wealth and Inequality in the U.S., 1962 to 1983, Research Report Number 27, C. V. Starr, Center for Applied Economics, New York University, October 1986.
Wolff, E. N. and Marley, M., Long Term Trends in U S . Wealth Inequality: Methodological Issues and Results, Paper presented to Conference on Measurement of Saving Investment and Wealth, Baltimore, February 1986.