Embed Size (px)
Citation preview
UNLV Theses, Dissertations, Professional Papers, and Capstones
12-2010
The Interaction of rock and water during shock decompression: A The Interaction of rock and water during shock decompression: A
hybrid model for fluidized ejecta formation hybrid model for fluidized ejecta formation
Audrey Hughes Rager University of Nevada, Las Vegas
Follow this and additional works at: https://digitalscholarship.unlv.edu/thesesdissertations
Part of the Geology Commons, Other Earth Sciences Commons, and the Physical Processes
Commons
Repository Citation Repository Citation Rager, Audrey Hughes, "The Interaction of rock and water during shock decompression: A hybrid model for fluidized ejecta formation" (2010). UNLV Theses, Dissertations, Professional Papers, and Capstones. 667. http://dx.doi.org/10.34917/1869303
This Dissertation is protected by copyright and/or related rights. It has been brought to you by Digital Scholarship@UNLV with permission from the rights-holder(s). You are free to use this Dissertation in any way that is permitted by the copyright and related rights legislation that applies to your use. For other uses you need to obtain permission from the rights-holder(s) directly, unless additional rights are indicated by a Creative Commons license in the record and/or on the work itself. This Dissertation has been accepted for inclusion in UNLV Theses, Dissertations, Professional Papers, and Capstones by an authorized administrator of Digital Scholarship@UNLV. For more information, please contact [email protected].
THE INTERACTION OF ROCK AND WATER
DURING SHOCK DECOMPRESSION:
A HYBRID MODEL FOR
FLUIDIZED EJECTA
FORMATION
by
Audrey Hughes Rager
Bachelor of Arts University of Colorado
1989
Master of Science Emporia State University
2003
A dissertation submitted in partial fulfillment of the requirements for the
Doctor of Philosophy Degree in Geoscience Department of Geoscience
College of Science
Graduate College University of Nevada, Las Vegas
December 2010

Copyright© 2011 by Audrey Hughes Rager All Rights Reserved
ii
THE GRADUATE COLLEGE We recommend the dissertation prepared under our supervision by Audrey Hughes Rager entitled The Interaction of Rock and Water during Shock Decompression: A Hybrid Model for Fluidized Ejecta Formation be accepted in partial fulfillment of the requirements for the degree of Doctor of Philosophy in Geoscience Eugene Smith, Committee Chair Elisabeth Hausrath, Committee Member Rosaly Lopes, Committee Member Adam Simon, Committee Member Stephen Lepp, Graduate Faculty Representative Ronald Smith, Ph. D., Vice President for Research and Graduate Studies and Dean of the Graduate College December 2010
iii
ABSTRACT
The Interaction of Rock and Water during Shock Decompression: A Hybrid Model for Fluidized Ejecta Formation
by
Audrey Hughes Rager
Dr. Eugene Smith, Examination Committee Chair Professor of Geology
University of Nevada Las Vegas
Crater and ejecta morphology provide insight into the composition and structure
of the target material. Martian rampart craters, with their unusual single-layered (SLE),
double-layered (DLE), and multi-layered ejecta (MLE), are the subject of particular
interest among planetary geologists because these morphologies are thought to result
from the presence of water in the target. Also of interest are radial lines extending from
the crater rim to the distal rampart of DLE craters. Exactly how these layered ejecta
morphologies and radial lines form is not known, but they are generally thought to result
from interaction of the ejecta with the atmosphere, subsurface volatiles, or some
combination of both.
Using the shock tube at the University of Munich, this dissertation tests the
hypothesis that the decompression of a rock-water mixture across the vaporization curve
for water during the excavation stage of impact cratering results in an increased
proportion of fines in the ejecta. This increase in fine material causes the ejecta to flow
with little or no liquid water. Also tested are the effects of water on rock fragmentation
during shock decompression when the vaporization curve for water is not crossed.
Using results from these experiments, a hybrid model is proposed for the
formation of fluidized ejecta and suggests that the existing atmospheric and subsurface
iv
volatile models are end members of a mechanism resulting in ejecta fluidization.
Fluidized ejecta can be emplaced through interaction with an atmosphere (atmospheric
model) or through addition of liquid water into the ejecta through shock melting of
subsurface ice (subsurface volatile model). This dissertation proposes that these models
are end members that explain the formation of fluidized ejecta on Mars.
When the vaporization curve for water is crossed, the expanding water vapor
increases the fragmentation of the ejecta as measured by a significant reduction in the
median grain size of ejecta. Reducing the average particle size in the ejecta curtain
reduces the height above the ground at which the advancing curtain becomes permeable
to the atmosphere it is compressing. This allows a vortex ring to form behind the curtain
and deposit fine ejecta in a fluidized fashion. When the vaporization curve for water is
not crossed, water within open pore space increases the fragmentation threshold of rocks,
shifting the median grain size to larger sizes. If the amount of water within open pore
space is sufficiently large and the vaporization curve is not crossed, the ejecta may
contain very large blocks. In the model proposed in this dissertation, the inner layer of
DLE forms when there are very large blocks at the base of the ejecta curtain and much
finer particles toward the top. In this situation, the larger blocks fall out first and produce
the inner ejecta layer. A ring vortex is still formed where the ejecta curtain becomes
permeable to the atmosphere. This vortex deposits finer grained material behind the
advancing ballistic ejecta and deposits the outer layer. At discrete locations within the
ejecta curtain, some of the larger blocks extend outside the average curtain width. At
these points Raleigh-Taylor or Kelvin-Helmholtz instabilities (Chandrasekhar, 1981;

v
Boyce et al., 2010) form, punching holes in the curtain and forming scouring jets below
the ring vortex. These jets carve out the radial lines in the inner and outer ejecta blanket.
vi
ACKNOWLEDGEMENTS
Completing a Ph.D. in Geology is an enormous undertaking for anyone. It’s
especially hard to do while working and raising a young child. I could not possibly have
done it without the support I’ve received from so many wonderful people.
I’d like to thank all of my committee members for their support and input. Most
of all I’d like to thank my advisor, Dr. Eugene Smith. Thank you for your enthusiasm for
geology and scientific inquiry; for your dedication to all of your students, for your
financial and emotional support, for sticking up for me, for encouraging me to work on a
topic I was passionate about, for your sense of humor, and for peanut butter cookies.
Thank you to Dr. Adam Simon. When I was close to quitting, your enthusiasm for
my project kept me going. Thank you, Dr. Simon, for bringing Dr. Don Dingwell to
speak in our department. If I’d never met Dr. Dingwell, this research never would have
been completed.
Thank you to Dr. Rosaly Lopes (Jet Propulsion Laboratory) for taking time out of
her very busy schedule to be on my committee and for being such a fantastic role model.
Thank you to Dr. Elisabeth Hausrath for her expertise and for joining my committee
when I needed her most. Thanks to Dr. Stephen Lepp for his time and for bringing an
astronomer’s perspective to my work.
This dissertation never would have been written if it weren’t for Dr. Don
Dingwell and Dr. Bettina Scheu from the University of Munich (LMU). Thank you for
your interest in my ideas and your willingness to open your lab to me. I hope our
experiments will be the start of a new method of research into impact cratering. I’d also
like to thank Dr. Uli Küppers (LMU) for assisting me with analysis of fine particles and
vii
for letting me use his desk while he was in the field. Thanks to all the staff and faculty at
LMU who made me feel very welcome during my stays in Munich.
Thank you to the NASA Nevada Space Grant Consortium for awarding me the
Nevada Space Grant Fellowship for six semesters. Thank you to the UNLV Graduate and
Professional Student Association for awarding me research grants. Thank you to the
Bernarda E. French, Barton Family, and Desert Space Grant for providing me with
scholarships. The research would not have been possible without your funding.
Thank you to Dr. Nadine Barlow (Northern Arizona University) and Dr. Sarah
Stewart (Harvard University) for their input and reviews of portions of this dissertation.
I’d like to thank fellow graduate students Racheal Johnsen, Dr. Colin Robins, and
Amanda Williams for listening to me and giving me encouragement when I really needed
it. You are more than just good scientists; you are all really good people.
Thanks to the amazing undergraduate students at UNLV who made teaching so
much fun. You are too numerous to name here, but I’ll do it anyway: Lora Griffin,
Valerie Tu, Rhonda Roe Wicker, Erin Orozco, Tiesa Dunlop, Lindsey Clark, Thomas
Andolfsson, Eli Dreschel, Jason Norgan, Hunter Campbell, Aaron Acena, Thomas
Adams, Andrew Miller, Brita Purvis, Christina Urmanski, Katie Zollars, Stephen
Paplinski, Chris Kopietz, Jaclyn Carrington, Judy Costa, Eden Espino, Pasquale
DelVecchio, Jonathan Carter, Carl Swenberg, Seth Page, Brittany Ruiter, Shereena Dyer,
Craig McNeil, Tyler Birthisel, Heather Proa, Brittany Ruiter, and Jackie Blair.
Congratulations to those of you who have graduated and gone on to jobs and Graduate
School. I know you’ll do well.
viii
Thank you to the hard-working office staff (Maria Figueroa, Liz Smith, and
Kathryn Birgy) and student workers (Rainne Tiske and Joy Valdivia) for all your help
with administrative matters. Thank you Nicolle Booker (Graduate Coordinator, College
of Sciences) for helping me navigate the labyrinth of paper work to graduate.
Thank you to Dr. Sean Mulcahy for assisting me with SEM analysis of my
samples. Even though the SEM results were not fruitful, I learned a lot and I appreciate
you taking time to help me. Thank you to Rebecca Huntoon for helping me with
computer, printer, and GIS problems. Thank you to Dr. Helen Neill (UNLV), for being
understanding and supportive and letting me take time off to finish my dissertation.
Thank you to my Master’s advisor, Dr. James Aber (Emporia State University)
for believing in me and teaching me the independence and discipline I needed to
complete my Ph.D.
Thank you to Tibor Balint (Jet Propulsion Laboratory) for being such an
inspirational mentor at the 2005 NASA/JPL Planetary Sciences Summer School (PSSS).
And thanks to my fellow PSSS participants: Jennifer Anderson, Christina Calvin,
Timothy Cassidy, Daniel Chavez-Clemente, Brook Corbett, , Heidi Hammerstein,
Thomas Hanley, Alice Letcher, Eileen McGowan, Dianna McMenamin, Nathaniel
Murphy, Michael Obland, Jeff Parker, Taylor Perron, Noah Petro, Marc Pulupa, Delia
Santiago , Robyn Schofield, and Hanna Sizemore. Our week together changed my life
and inspired me to pursue a career in planetary geology.
Thank you to Dr. Elizabeth Steininger Wolf for being a true friend. Thank you to
my cousin, Cathy Patton, and my aunt, Helene Shay, for emotional support and advice on

ix
you-know-what. Thank you to my cousin, Robert Cook, for his interest in my research
and for long conversations and e-mails about phase equilibria.
It takes a village to raise a child. Thank you to all my son’s day care providers,
teachers, Sunday school teachers, sports instructors, physicians, and support specialists:
Edith Brooks, Mike Speck, Christy Wheeler Buckingham, Jeani Crist-Vidal, Eve Jeanos,
Kiyo Frazier, James Cunningham, Angel Amboy, Jessica Campbell, Connie Dula, Dr.
Julie Beasley, Dr. Johanna Fricke, Dr. Paul Smith, Dr. Ralph Conti, Dr. Mary Grant, Sue
Huff, Chris Holcomb, Mona Agamez, Danielle Bell, Danette Barber, Gerri Horka, Ariel
Sublett, Derick Egan, Nicki Allison, Raul Baugh, Steven Baugh, and Sydney Baugh.
Thank you to my parents, Tom and Ellen Hughes, for all your love and support
throughout the years. I love you very much.
Thank you to my wonderful son, Ian. Ever since you were born you’ve been an
amazing person. You are the one who inspired me to follow my dreams and start the
Ph.D. program at UNLV. You are the most wonderful person I have ever met. I hope you
will always follow your dreams. Be happy.
Above all, I’d like to thank the one person who stood by me day after day, who
shared in my triumphs, propped me up during hard times, kicked me in the butt when I
needed it, and always believed in me: my husband, Hal Rager. You are my source of
strength. I love you. Now, let’s move on to our next adventure.
x
TABLE OF CONTENTS
ABSTRACT ....................................................................................................................... iii
ACKNOWLEDGEMENTS ............................................................................................... vi LIST OF FIGURES .......................................................................................................... xii LIST OF TABLES ........................................................................................................... xiii CHAPTER ONE DISSERTATION OVERVIEW .......................................................... 1 Fundamental Dissertation Objectives ..................................................................... 1 The Application of Novel Experimental Techniques to Established Problems ....... 1 Summary of Salient Results ..................................................................................... 2 Submission of Individual Chapters as Manuscripts for Publication ....................... 3 Chapter Two Synopsis ............................................................................................ 3 Chapter Three Synopsis .......................................................................................... 4 Chapter Four Synopsis ............................................................................................ 5 CHAPTER TWO THE EFFECTS OF WATER VAPORIZATION ON ROCK
FRAGMENTATION DURING RAPID DECOMPRESSION: IMPLICATIONS FOR THE FORMATION OF FLUIDIZED EJECTA ON MARS ........................................................................... 6
Abstract .................................................................................................................... 6 Introduction .............................................................................................................. 7 Background .............................................................................................................. 7
Martian Rampart Craters ............................................................................ 7 Models for Fluidized Ejecta Formation ...................................................... 9
The Atmospheric Model ................................................................. 9 The Subsurface Volatile Model .................................................... 14
Summary ................................................................................................... 17 Methods ................................................................................................................. 17 Fragmentation Methods ........................................................................... 17 Sample Preparation ................................................................................... 19 Methods for adding water to the sample ................................................... 21 Sieving methods and grain shape analysis ................................................ 21 Results .................................................................................................................... 22 Grain-size Distribution ............................................................................. 22 Qualitative Observations and Grain-shape Analysis ................................ 26 Discussion .............................................................................................................. 27 Proposed Model for the Formation of SLE and MLE ............................. 29 Conclusions ........................................................................................................... 32
xi
CHAPTER THREE HOW WATER IN OPEN PORE SPACE AFFECTS THE FRAGMENTATION THRESHOLD OF ROCKS: IMPLICATIONS FOR DOUBLE LAYER EJECTA FORMATION ............................................................................... 51
Abstract ................................................................................................................. 51 Introduction ........................................................................................................... 52 Martian Rampart Craters........................................................................... 52 Fluidized Ejecta Formation ....................................................................... 53 Summary ................................................................................................... 54 Methods................................................................................................................. 55 Fragmentation Methods ............................................................................ 56 Sample Preparation ................................................................................... 57 Methods for adding water to the sample ................................................... 58 Sieving Methods ....................................................................................... 59 Results ................................................................................................................... 60 Discussion: ............................................................................................................ 63 Conclusions ........................................................................................................... 66 CHAPTER FOUR SUMMARY AND FUTURE RESEARCH .................................. 76 Introduction ........................................................................................................... 76 Summary ............................................................................................................... 76
Results ...................................................................................................... 76 Proposed Model ....................................................................................... 77
Future Research .................................................................................................... 79 REFERENCES CITED ..................................................................................................... 80 APPENDIX 1 IMPACT CRATERING .................................................................... 90 APPENDIX 2 MARTIAN RAMPART CRATERS: MORPHOLOGY, DISTRIBUTION, AND CURRENT FORMATION MODELS .................................. 101
APPENDIX 3 PHASE EQUILIBRIA OF WATER AND CARBON DIOXIDE ONE- AND TWO-COMPONENT SYSTEMS AND THEIR RELATION TO THE MARTIAN SURFACE CONDITIONS AND FRAGMENTATION EXPERIMENTS............................................ 116
APPENDIX 4 SIEVING RESULTS ........................................................................ 129
VITA ............................................................................................................................... 143
xii
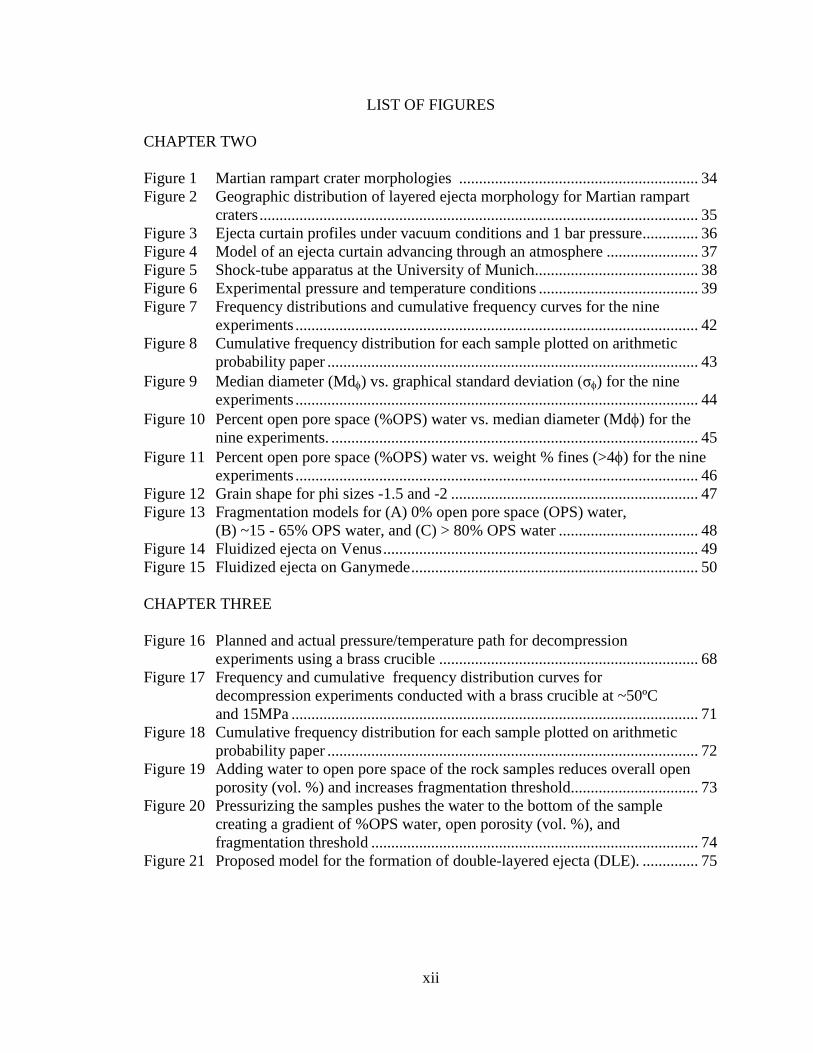
LIST OF FIGURES CHAPTER TWO Figure 1 Martian rampart crater morphologies ............................................................ 34 Figure 2 Geographic distribution of layered ejecta morphology for Martian rampart
craters .............................................................................................................. 35 Figure 3 Ejecta curtain profiles under vacuum conditions and 1 bar pressure .............. 36 Figure 4 Model of an ejecta curtain advancing through an atmosphere ....................... 37 Figure 5 Shock-tube apparatus at the University of Munich......................................... 38 Figure 6 Experimental pressure and temperature conditions ........................................ 39 Figure 7 Frequency distributions and cumulative frequency curves for the nine experiments ..................................................................................................... 42 Figure 8 Cumulative frequency distribution for each sample plotted on arithmetic probability paper ............................................................................................. 43 Figure 9 Median diameter (Mdφ) vs. graphical standard deviation (σφ) for the nine experiments ..................................................................................................... 44 Figure 10 Percent open pore space (%OPS) water vs. median diameter (Mdφ) for the nine experiments. ............................................................................................ 45 Figure 11 Percent open pore space (%OPS) water vs. weight % fines (>4φ) for the nine experiments ..................................................................................................... 46 Figure 12 Grain shape for phi sizes -1.5 and -2 .............................................................. 47 Figure 13 Fragmentation models for (A) 0% open pore space (OPS) water, (B) ~15 - 65% OPS water, and (C) > 80% OPS water ................................... 48 Figure 14 Fluidized ejecta on Venus ............................................................................... 49 Figure 15 Fluidized ejecta on Ganymede ........................................................................ 50 CHAPTER THREE Figure 16 Planned and actual pressure/temperature path for decompression experiments using a brass crucible ................................................................. 68 Figure 17 Frequency and cumulative frequency distribution curves for decompression experiments conducted with a brass crucible at ~50ºC and 15MPa ...................................................................................................... 71 Figure 18 Cumulative frequency distribution for each sample plotted on arithmetic probability paper ............................................................................................. 72 Figure 19 Adding water to open pore space of the rock samples reduces overall open
porosity (vol. %) and increases fragmentation threshold................................ 73 Figure 20 Pressurizing the samples pushes the water to the bottom of the sample creating a gradient of %OPS water, open porosity (vol. %), and fragmentation threshold .................................................................................. 74 Figure 21 Proposed model for the formation of double-layered ejecta (DLE). .............. 75
xiii
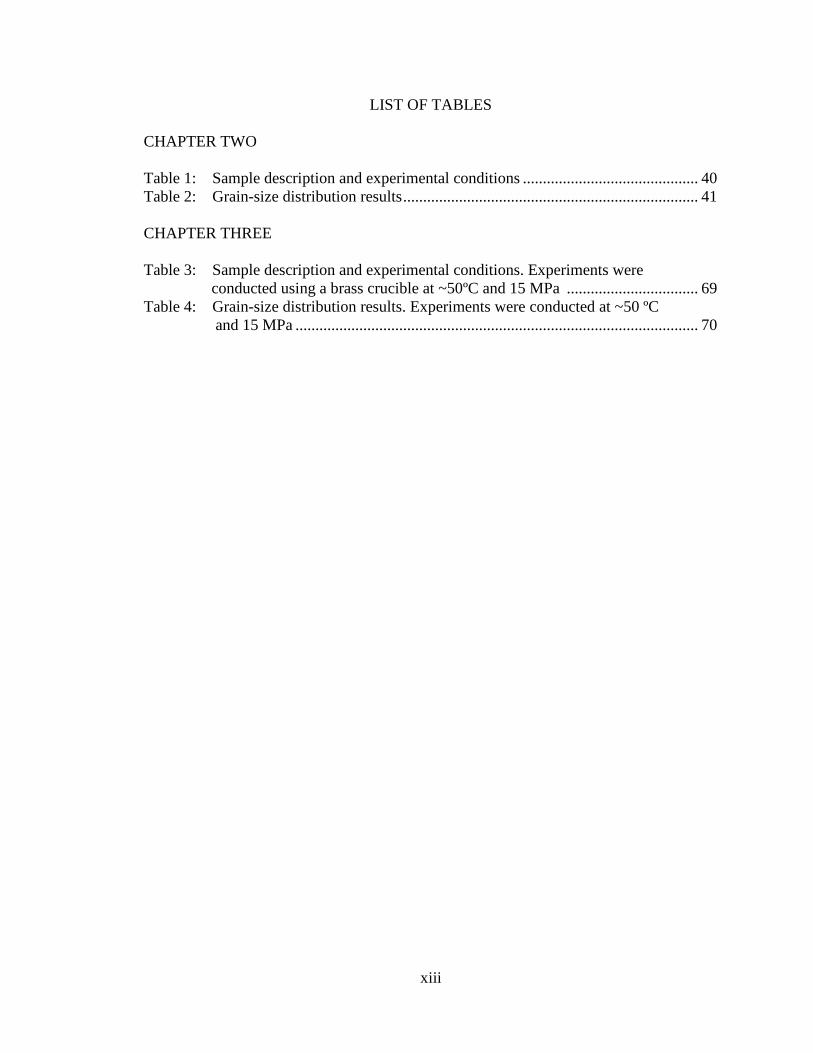
LIST OF TABLES CHAPTER TWO Table 1: Sample description and experimental conditions ............................................ 40 Table 2: Grain-size distribution results .......................................................................... 41 CHAPTER THREE Table 3: Sample description and experimental conditions. Experiments were conducted using a brass crucible at ~50ºC and 15 MPa ................................. 69 Table 4: Grain-size distribution results. Experiments were conducted at ~50 ºC and 15 MPa ..................................................................................................... 70
1
CHAPTER ONE
DISSERTATION OVERVIEW
Fundamental Dissertation Objectives
Layered fluidized ejecta blankets on Mars are unique among terrestrial bodies of
the Solar System. Models for the formation of fluidized ejecta on Mars fall into two
categories: the subsurface volatile model and the atmospheric model. The relative role of
subsurface volatiles versus the atmosphere in the formation of layered ejecta blankets is
one of the major questions remaining concerning the geology of Mars.
Rapid decompression during the excavation state of impact cratering may result in
water or ice crossing the vaporization curve explosively. This dissertation tests the
hypothesis that this explosive vaporization of water increases the degree of fragmentation
of ejecta and adds finer materials to the ejecta curtain. These smaller particles interact
with the atmosphere to produce a vortex ring behind the advancing ejecta curtain,
resulting in the fluidized emplacement of the ejecta. For background information on the
impact cratering process, the reader is referred to Appendix 1. Appendix 2 describes
Martian rampart crater morphologies, a summary of current models of fluidized ejecta
formation, and descriptions of previous studies relevant to the research presented in this
dissertation.
The Application of Novel Experimental Techniques
To Established Problems
Most studies on impact cratering and fluidized ejecta emplacement rely on
hypervelocity impact experiments and numerical modeling of material response to
2
hypervelocity impacts. This research takes a unique approach of measuring the effects of
water vaporization on rock fragmentation during decompression associated with the
excavation stage of impact cratering. This hypothesis was tested using the shock tube
apparatus at the University of Munich typically used for research on volcanic rocks and
processes (Alidibirov and Dingwell, 1996a, 1996b; Küppers et al., 2006). This is the first
study to look at the effects of water vaporization through rapid decompression on rock
fragmentation.
Summary of Salient Results
Results of studies undertaken for this dissertation using a volcaniclastic sandstone
from the Eldorado Mountains, Nevada indicate that the vaporization of water during
rapid decompression alters the grain size distribution of ejecta. For a volcaniclastic
sandstone with ~28% open porosity, the average grain size is significantly reduced. When
the open pore space is filled to capacity with water, grain shape and grain size
distribution are altered. The grain size distribution becomes more bimodal (increased
amounts of fines and larger particles).
When the vaporization curve for water is not crossed during rapid decompression,
water within pore spaces can increase the fragmentation threshold of rocks by decreasing
the amount of open pore space. Ejection angle is inversely proportional to target strength.
Therefore, this increased strength may result in lower initial ejection angle and affect the
structure of the ejecta curtain.
These results are used to propose a hybrid model for fluidized ejecta formation
that accounts for the single-, double-, and multi-layered ejecta found on Mars. The model
3
also suggests an explanation for the similarities and differences between double-layered
ejecta on Mars and Ganymede.
Submission of Individual Chapters as Manuscripts for Publication
Chapters two and three of this document were written as manuscripts intended for
publication in scientific journals. Brief summaries and descriptions of the original
manuscripts serving as chapters are detailed in following sections along with the co-
authors and the submission dates.
Chapter Two Synopsis
This chapter tests the hypothesis that, during shock decompression associated
with the excavation stage of impact cratering, water that crosses the vaporization curve
expands explosively, increasing the degree of ejecta fragmentation and producing an
overall shift toward smaller average ejecta particle diameter. To test this hypothesis,
fragmentation experiments were conducted using a shock-tube apparatus at the
University of Munich, Germany. Results of these experiments show that rock samples
with water in about 15 – 50% open pore space produced much smaller grain sizes.
Samples with >80% water in open pore space had an increase in fines and larger particles
and a decreased number of intermediate particles. Fragments from experiments with
>80% water in open pore space displayed a more compact grain shape, indicating that
decompression of water caused fracturing perpendicular to the release wave front. These
results provide insight into the morphology of Martian rampart craters and indicate that it
may take less water than previously thought to produce fluidized ejecta because a
4
relatively small amount of vaporized water can reduce the average ejecta particle
diameter so that it is small enough to interact with the thin Martian atmosphere to
produce fluidized ejecta. The experiments are used to develop a hybrid model of single-
and multi-layered ejecta formation on Mars.
Audrey Rager is the primary author on this article. Eugene Smith (University of
Nevada Las Vegas), Bettina Scheu (University of Munich), and Don Dingwell
(University of Munich) are coauthors. Eugene Smith provided input on experimental
design and assisted with the interpretation of the data. Bettina Scheu ran the laboratory
experiments and assisted with the interpretation of the data. Donald Dingwell provided
expertise on fragmentation. This article was submitted for publication to the Geologic
Society of America (GSA) Bulletin in December 2010.
Chapter Three Synopsis
This study looks at the effects of water within open pore space on rock
fragmentation when the vaporization curve for water is not crossed. Results from these
experiments indicate that, when the vaporization curve for water is not crossed, water
within open pore space increases the fragmentation threshold of rocks, shifting the
median grain size to larger sizes. This information is used to add a mechanism for the
formation of double-layered ejecta to the hybrid model presented in chapter two. In the
expanded model, the inner layer of double-layered ejecta is formed when there are very
large ejecta blocks at the base of the curtain and much finer particles toward the top. In
this situation, the larger blocks fall out first and produce the inner ejecta layer. A ring
vortex is still formed where the ejecta curtain becomes permeable to the atmosphere. This
5
vortex deposits finer grained material behind the advancing ballistic ejecta and deposits
the outer layer. At discrete locations within the ejecta curtain, some of the larger blocks
extend outside the average curtain width. At these points Raleigh-Taylor or Kelvin-
Helmholtz instabilities (Chandrasekhar, 1981; Boyce et al., 2010) form, punching holes
in the curtain and forming scouring jets below the ring vortex. These jets carve out the
radial lines in the inner and outer ejecta blanket.
Audrey Rager is the primary author on this article. Eugene Smith (University of
Nevada Las Vegas), Bettina Scheu (University of Munich), and Don Dingwell
(University of Munich) are coauthors. Eugene Smith provided input on experimental
design and assisted with the interpretation of the data. Bettina Scheu ran the laboratory
experiments and assisted with the interpretation of the data. Donald Dingwell provided
expertise on fragmentation. This article was submitted for publication to the Journal of
Geophysical Research (JGR) Planets in December 2010.
Chapter Four Synopsis
Chapter four summarizes the results of the two studies and a summary of the
hybrid model of fluidized ejecta emplacement. Future research topics are also discussed.
6
CHAPTER TWO
THE EFFECTS OF WATER VAPORIZATION ON ROCK FRAGMENTATION
DURING RAPID DECOMPRESSION: IMPLICATIONS FOR
THE FORMATION OF FLUIDIZED EJECTA ON MARS
Abstract
Crater and ejecta morphology provide insight into the composition and structure
of the target material. Fluidized ejecta surrounding Martian rampart craters is thought to
result from the addition of water to the ejecta during impact into a water-rich (ice or
liquid) regolith. In this study, an alternate hypothesis that the decompression of a rock-
water mixture across the vaporization curve for water during the excavation stage of
impact cratering results in an increased proportion of fines in the ejecta is tested. This
increase in fine material causes the ejecta to flow with little or no liquid water. To test
this hypothesis, fragmentation experiments were conducted on sandstone (28% open pore
space) from the northern Eldorado Mountains, Nevada, using a shock-tube apparatus at
the University of Munich, Germany. Rock samples containing 0 – 92% of their open pore
space filled with water were subjected to 15 MPa at 177 ºC and 300 ºC and rapidly
decompressed. When the vaporization curve for water is crossed, water content within
open pore space has a significant effect on the grain size distribution and grain shape of
the decompressed rock samples. When compared to control samples, samples with water
in about 15 – 50% open pore space had much smaller grain sizes. Samples with >80%
water in open pore space had an increase in fines and larger particles and a decreased
number of intermediate particles. Fragments from experiments with >80% water in open
pore space displayed a more equant grain shape, indicating that decompression of water
7
caused fracturing perpendicular to the release wave front. These results provide insight
into the morphology of Martian rampart craters and indicate that it may take less water
than previously though to produce fluidized ejecta.
Introduction
Impact crater and ejecta morphology reveal information about the structure and
composition of the target. This is a topic of special interest on Mars where the presence
of fluidized ejecta may provide clues to the history of water on the Martian surface. This
study tests the hypothesis that the vaporization of water during the excavation stage of
impact cratering increases the amount of rock fragmentation as measured by an overall
decrease in the average grain size. Because smaller particles flow more easily than larger
blocks, less water is required to produce fluidized ejecta than is currently thought. To test
this hypothesis, rock fragmentation experiments were conducted using the shock tube
apparatus in the Earth and Environmental Science Department of the University of
Munich (Alidibirov and Dingwell, 1996a and 1996b). This section includes a discussion
of Martian rampart craters morphology and distribution and current models for their
formation.
Background
Martian Rampart Craters
Imagery from the Viking Orbiter cameras, Mars Global Surveyor (MGS), Mars
Orbital Camera (MOC), Mars Odyssey Thermal Emission Imaging System (THEMIS),
and Mars Reconnaissance Orbiter (MRO) revealed that Martian impact craters are very
different from the radial ejecta on the Moon and Mercury (Carr et al, 1977; Barlow,
8
2005). Most Martian impact craters have fluidized ejecta (89% of 10, 651 cataloged
craters ≥5 km diameter; Barlow, 2005) that hug topography and terminate in a distal
rampart about 1.5 to 2 crater radii from the crater rim (Barlow, 2005; Garvin et al., 2000,
2003; Melosh, 1989). Barlow (2005) classified three types of fluidized ejecta (Figure 1):
(1) single layer ejecta (SLE), (2) double layer ejecta (DLE), and (3) multiple layer ejecta
(MLE).
Secondary craters are rare within the fluidized ejecta (Barlow, 2003b, 2005)
blanket. Beyond the rampart, secondary craters extend many crater radii beyond the edge
of the blanket (Barlow, 2005). For example McEwen et al. (2003) identified a 10-km-
diameter crater in the Cerberus region of Mars that has strings of secondary craters
extending more than 800 km from the rim but no secondary craters within the fluidized
ejecta. These extensive secondary crater strings outside of the fluidized ejecta provide
important constraints on the cohesiveness of the target material (Head et al., 2002) and
any model of rampart crater formation must account for this distinctive feature.
Fluidized ejecta morphologies do not appear to correlate with elevation or terrain
age and there is only a weak correlation with terrain type (Mouginis-Mark, 1979;
Costard, 1989; Barlow and Bradley, 1990, Barlow, 2005). However, layered ejecta
morphologies do exhibit a strong relationship with crater diameter and geographic
location (Figure 2; Barlow, 2005). In the Martian equatorial region (±30º latitude), SLE
craters are generally ~5 to 20 km in diameter. However, at higher latitudes, SLE craters
are <1-65 km in diameter (Mouginis-Mark, 1979; Kuzmin et al., 1988; Costard, 1989;
Barlow and Bradley, 1990; Barlow, 2005). DLE craters are concentrated at higher
latitudes, particularly in the northern plains. DLE are typically 5-25 km in diameter.
9
MLE craters are usually in the 20-45 km diameter range. MLE tend to be concentrated in
lower latitudes.
There are two models for the formation of fluidized ejecta on Mars (Barlow,
2005): the atmospheric model and the subsurface volatile model. In this section, both
models are described with special attention to previous studies that are incorporated into
our proposed model for fluidized ejecta formation.
Models for Fluidized Ejecta Formation
The Atmospheric Model
The atmospheric model for fluidized ejecta formation states that the thin Martian
atmosphere is the medium in which ejecta are entrained (Schultz and Gault, 1979a and
1979b; Schultz, 1992a and1992b; Barnouin-Jha and Schultz, 1998; Barnouin-Jha et al.,
1999a and 1999b; Barlow, 2005). Laboratory and experimental studies (Schultz and
Gault, 1979; Schultz, 1992a and1992b; Barnouin-Jha and Schultz, 1998; Barnouin-Jha et
al., 1999a, 1999b) show that atmospheric turbulence produces a vortex ring that entrains,
transports, and deposits fine-grained ejecta in a layered pattern (Barlow, 2005). In this
model, larger material is ballistically emplaced ahead of the vortex ring. As the vortex
ring passes, it may remobilize these larger clasts and pile them up in the distal rampart.
Ejecta composed of fine grain material can flow without an accompanying gas or liquid
phase (Schultz, 1992a). However, for the ejecta to flow in this manner it is necessary that
the target material be composed of fine grain material or that the impact itself produces
an enormous amount of fine grained material during impact excavation (Schultz, 1992a;
Boyce and Mouginis-Mark, 2006).
10
Schultz (1992a) conducted laboratory experiments using the vertical gun at the
NASA Ames Research Center to investigate the complex interactions between impact
ejecta and the atmosphere. Schultz (1992a) found that, under vacuum conditions, ballistic
ejecta form the classic cone-shaped profile. However, as atmospheric density increases,
the ejecta form at a higher angle (from horizontal), bulging at the base and pinching
above (Figure 3). This change in the ejecta curtain results from the combined effects of
deceleration of ejecta smaller than a critical size and entrainment of these ejecta within
atmospheric vortices created as the ejecta curtain moves outward displacing the
atmosphere. The degree of ejecta entrainment depends on the ratio of drag to gravity
forces acting on individual ejecta and the intensity of the winds created by the advancing
ejecta curtain (Schultz, 1992a). The degree of ejecta entrainment is positively correlated
with atmospheric density and ejection velocity, but negatively correlated with ejecta
density and size. He found that a wide variety of nonballistic ejecta styles were produced
by varying ejecta sizes even without water in the target and that ejecta run-out distances
scaled to crater size on Mars should increase as R1/2 (where R is crater radius). Therefore,
long run-out ejecta flows dependent on crater diameter do not necessarily reflect the
depth to a reservoir of water.
According to Schultz (1992a), nonballistic ejecta emplacement results from a
two-stage process. First, the ejecta are aerodynamically decelerated to near-terminal
velocity. Next, the ejecta are entrained in atmospheric turbulence created by the outward
expanding wall of ballistic ejecta. Conditions leading to nonballistic ejecta emplacement
depend on a critical ejecta size which depends on (1) crater size (i.e., ejection velocity),
(2) ejecta size, and (3) atmospheric pressure (i.e., density).
11
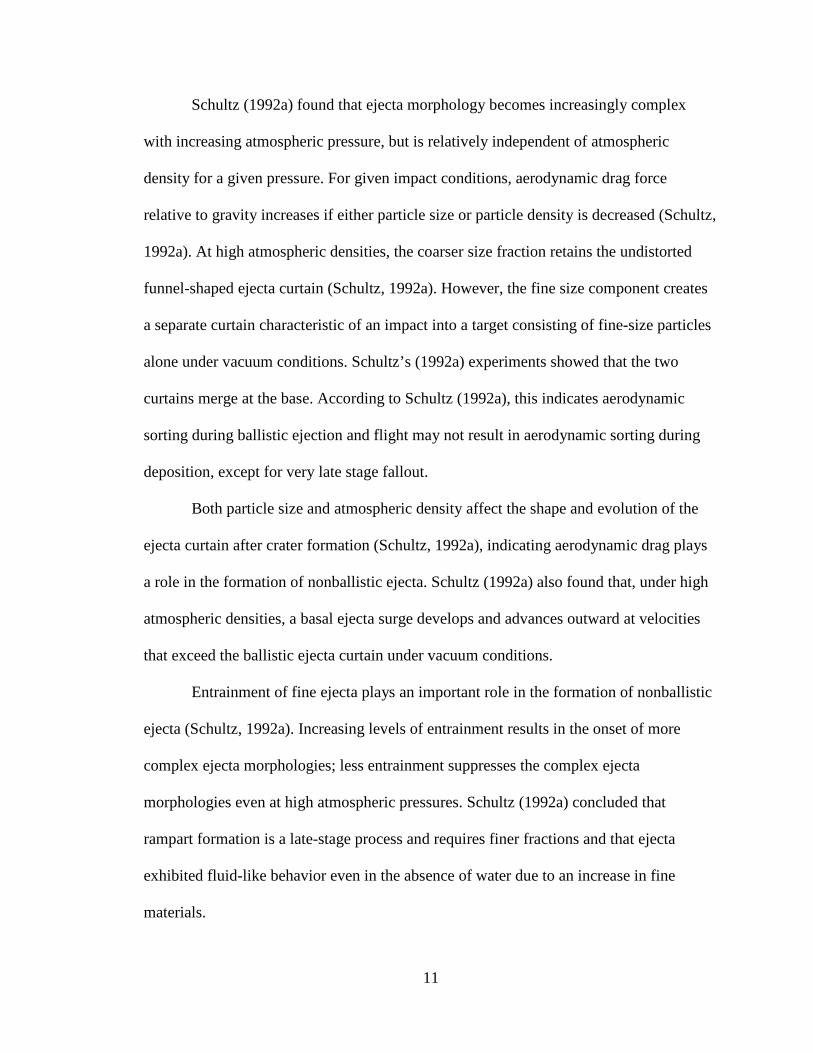
Schultz (1992a) found that ejecta morphology becomes increasingly complex
with increasing atmospheric pressure, but is relatively independent of atmospheric
density for a given pressure. For given impact conditions, aerodynamic drag force
relative to gravity increases if either particle size or particle density is decreased (Schultz,
1992a). At high atmospheric densities, the coarser size fraction retains the undistorted
funnel-shaped ejecta curtain (Schultz, 1992a). However, the fine size component creates
a separate curtain characteristic of an impact into a target consisting of fine-size particles
alone under vacuum conditions. Schultz’s (1992a) experiments showed that the two
curtains merge at the base. According to Schultz (1992a), this indicates aerodynamic
sorting during ballistic ejection and flight may not result in aerodynamic sorting during
deposition, except for very late stage fallout.
Both particle size and atmospheric density affect the shape and evolution of the
ejecta curtain after crater formation (Schultz, 1992a), indicating aerodynamic drag plays
a role in the formation of nonballistic ejecta. Schultz (1992a) also found that, under high
atmospheric densities, a basal ejecta surge develops and advances outward at velocities
that exceed the ballistic ejecta curtain under vacuum conditions.
Entrainment of fine ejecta plays an important role in the formation of nonballistic
ejecta (Schultz, 1992a). Increasing levels of entrainment results in the onset of more
complex ejecta morphologies; less entrainment suppresses the complex ejecta
morphologies even at high atmospheric pressures. Schultz (1992a) concluded that
rampart formation is a late-stage process and requires finer fractions and that ejecta
exhibited fluid-like behavior even in the absence of water due to an increase in fine
materials.
12
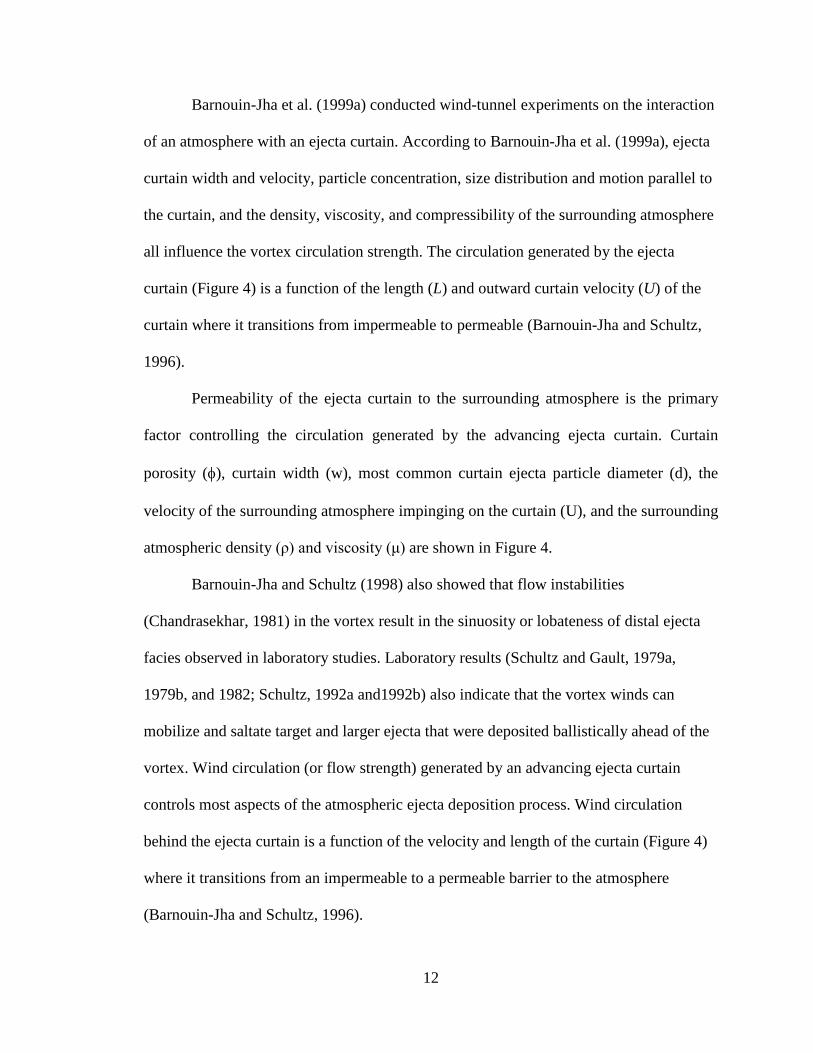
Barnouin-Jha et al. (1999a) conducted wind-tunnel experiments on the interaction
of an atmosphere with an ejecta curtain. According to Barnouin-Jha et al. (1999a), ejecta
curtain width and velocity, particle concentration, size distribution and motion parallel to
the curtain, and the density, viscosity, and compressibility of the surrounding atmosphere
all influence the vortex circulation strength. The circulation generated by the ejecta
curtain (Figure 4) is a function of the length (L) and outward curtain velocity (U) of the
curtain where it transitions from impermeable to permeable (Barnouin-Jha and Schultz,
1996).
Permeability of the ejecta curtain to the surrounding atmosphere is the primary
factor controlling the circulation generated by the advancing ejecta curtain. Curtain
porosity (φ), curtain width (w), most common curtain ejecta particle diameter (d), the
velocity of the surrounding atmosphere impinging on the curtain (U), and the surrounding
atmospheric density (ρ) and viscosity (μ) are shown in Figure 4.
Barnouin-Jha and Schultz (1998) also showed that flow instabilities
(Chandrasekhar, 1981) in the vortex result in the sinuosity or lobateness of distal ejecta
facies observed in laboratory studies. Laboratory results (Schultz and Gault, 1979a,
1979b, and 1982; Schultz, 1992a and1992b) also indicate that the vortex winds can
mobilize and saltate target and larger ejecta that were deposited ballistically ahead of the
vortex. Wind circulation (or flow strength) generated by an advancing ejecta curtain
controls most aspects of the atmospheric ejecta deposition process. Wind circulation
behind the ejecta curtain is a function of the velocity and length of the curtain (Figure 4)
where it transitions from an impermeable to a permeable barrier to the atmosphere
(Barnouin-Jha and Schultz, 1996).
13
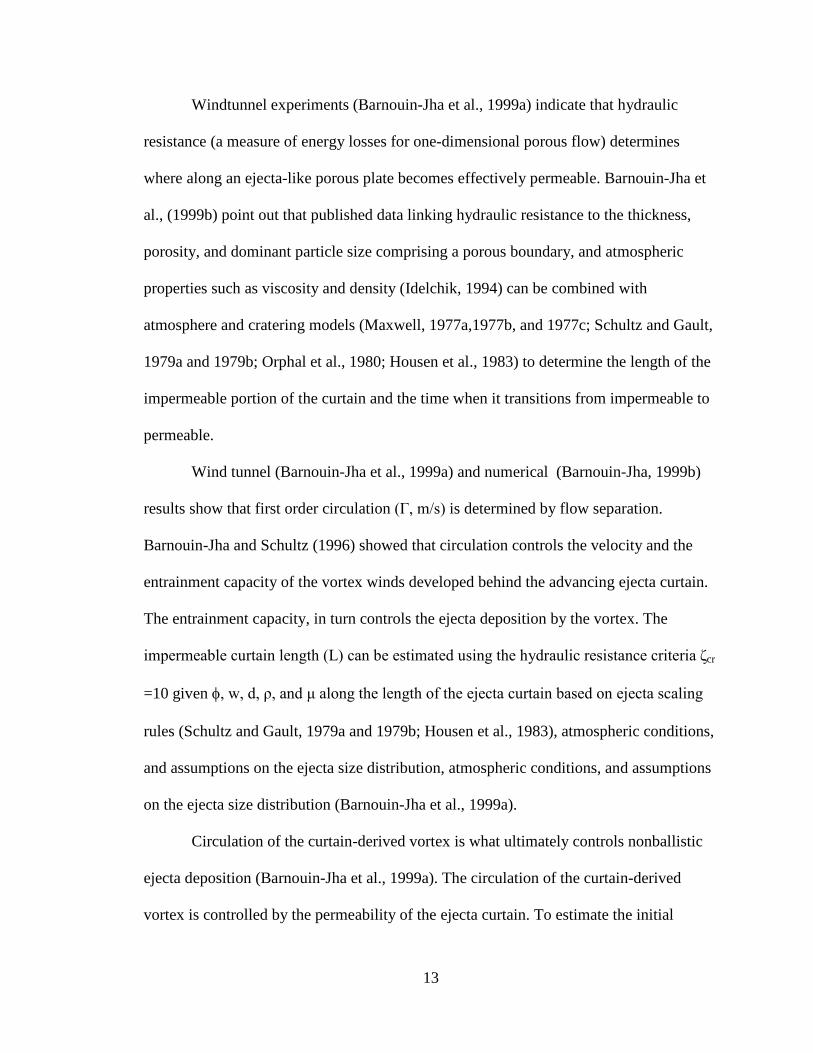
Windtunnel experiments (Barnouin-Jha et al., 1999a) indicate that hydraulic
resistance (a measure of energy losses for one-dimensional porous flow) determines
where along an ejecta-like porous plate becomes effectively permeable. Barnouin-Jha et
al., (1999b) point out that published data linking hydraulic resistance to the thickness,
porosity, and dominant particle size comprising a porous boundary, and atmospheric
properties such as viscosity and density (Idelchik, 1994) can be combined with
atmosphere and cratering models (Maxwell, 1977a,1977b, and 1977c; Schultz and Gault,
1979a and 1979b; Orphal et al., 1980; Housen et al., 1983) to determine the length of the
impermeable portion of the curtain and the time when it transitions from impermeable to
permeable.
Wind tunnel (Barnouin-Jha et al., 1999a) and numerical (Barnouin-Jha, 1999b)
results show that first order circulation (Γ, m/s) is determined by flow separation.
Barnouin-Jha and Schultz (1996) showed that circulation controls the velocity and the
entrainment capacity of the vortex winds developed behind the advancing ejecta curtain.
The entrainment capacity, in turn controls the ejecta deposition by the vortex. The
impermeable curtain length (L) can be estimated using the hydraulic resistance criteria ζcr
=10 given φ, w, d, ρ, and μ along the length of the ejecta curtain based on ejecta scaling
rules (Schultz and Gault, 1979a and 1979b; Housen et al., 1983), atmospheric conditions,
and assumptions on the ejecta size distribution, atmospheric conditions, and assumptions
on the ejecta size distribution (Barnouin-Jha et al., 1999a).
Circulation of the curtain-derived vortex is what ultimately controls nonballistic
ejecta deposition (Barnouin-Jha et al., 1999a). The circulation of the curtain-derived
vortex is controlled by the permeability of the ejecta curtain. To estimate the initial
14
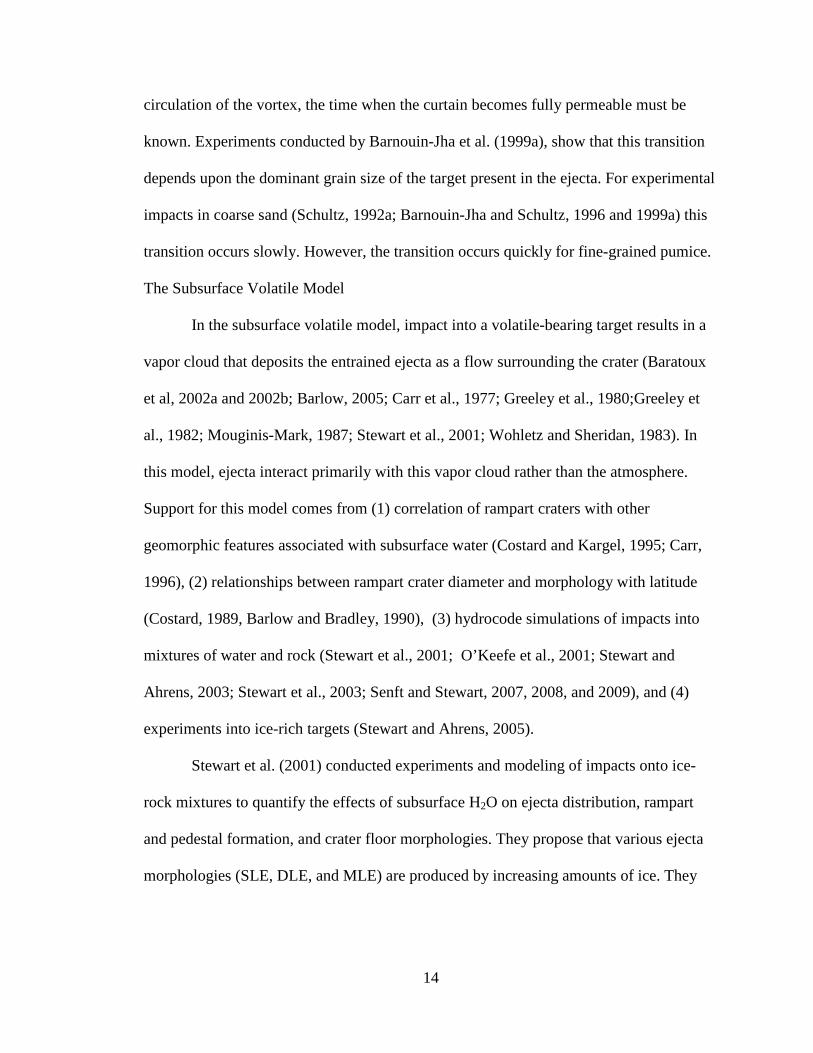
circulation of the vortex, the time when the curtain becomes fully permeable must be
known. Experiments conducted by Barnouin-Jha et al. (1999a), show that this transition
depends upon the dominant grain size of the target present in the ejecta. For experimental
impacts in coarse sand (Schultz, 1992a; Barnouin-Jha and Schultz, 1996 and 1999a) this
transition occurs slowly. However, the transition occurs quickly for fine-grained pumice.
The Subsurface Volatile Model
In the subsurface volatile model, impact into a volatile-bearing target results in a
vapor cloud that deposits the entrained ejecta as a flow surrounding the crater (Baratoux
et al, 2002a and 2002b; Barlow, 2005; Carr et al., 1977; Greeley et al., 1980;Greeley et
al., 1982; Mouginis-Mark, 1987; Stewart et al., 2001; Wohletz and Sheridan, 1983). In
this model, ejecta interact primarily with this vapor cloud rather than the atmosphere.
Support for this model comes from (1) correlation of rampart craters with other
geomorphic features associated with subsurface water (Costard and Kargel, 1995; Carr,
1996), (2) relationships between rampart crater diameter and morphology with latitude
(Costard, 1989, Barlow and Bradley, 1990), (3) hydrocode simulations of impacts into
mixtures of water and rock (Stewart et al., 2001; O’Keefe et al., 2001; Stewart and
Ahrens, 2003; Stewart et al., 2003; Senft and Stewart, 2007, 2008, and 2009), and (4)
experiments into ice-rich targets (Stewart and Ahrens, 2005).
Stewart et al. (2001) conducted experiments and modeling of impacts onto ice-
rock mixtures to quantify the effects of subsurface H2O on ejecta distribution, rampart
and pedestal formation, and crater floor morphologies. They propose that various ejecta
morphologies (SLE, DLE, and MLE) are produced by increasing amounts of ice. They
15
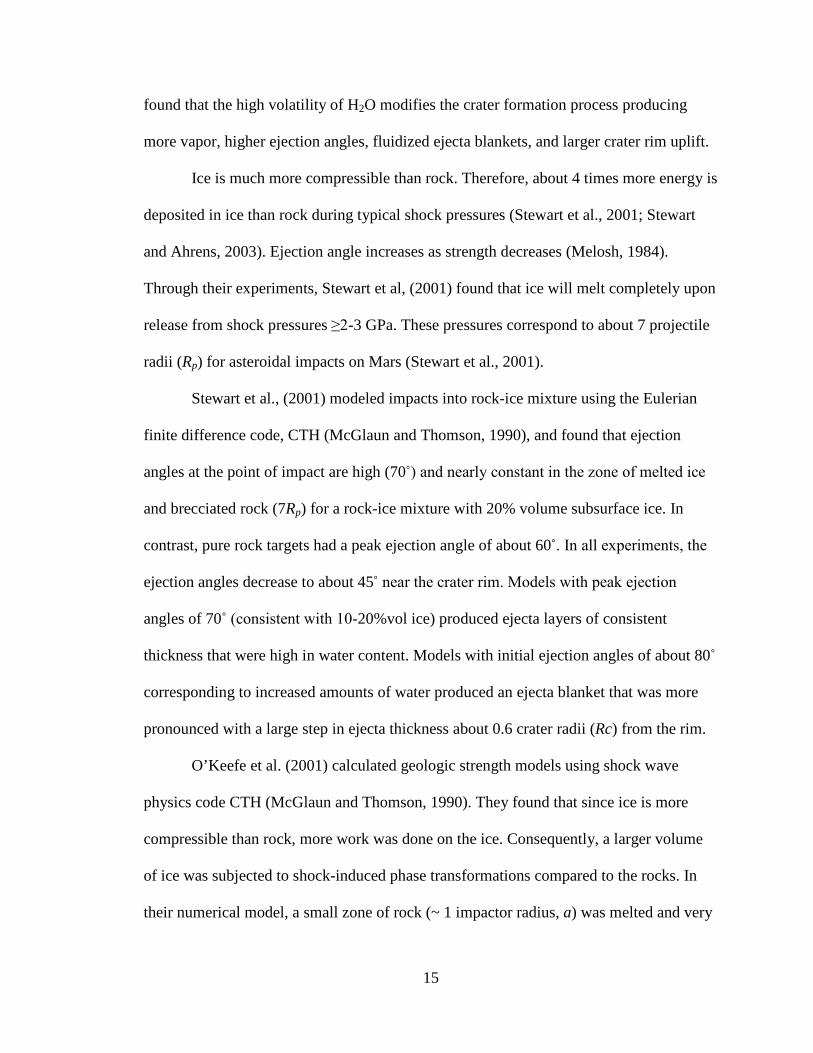
found that the high volatility of H2O modifies the crater formation process producing
more vapor, higher ejection angles, fluidized ejecta blankets, and larger crater rim uplift.
Ice is much more compressible than rock. Therefore, about 4 times more energy is
deposited in ice than rock during typical shock pressures (Stewart et al., 2001; Stewart
and Ahrens, 2003). Ejection angle increases as strength decreases (Melosh, 1984).
Through their experiments, Stewart et al, (2001) found that ice will melt completely upon
release from shock pressures ≥2-3 GPa. These pressures correspond to about 7 projectile
radii (Rp) for asteroidal impacts on Mars (Stewart et al., 2001).
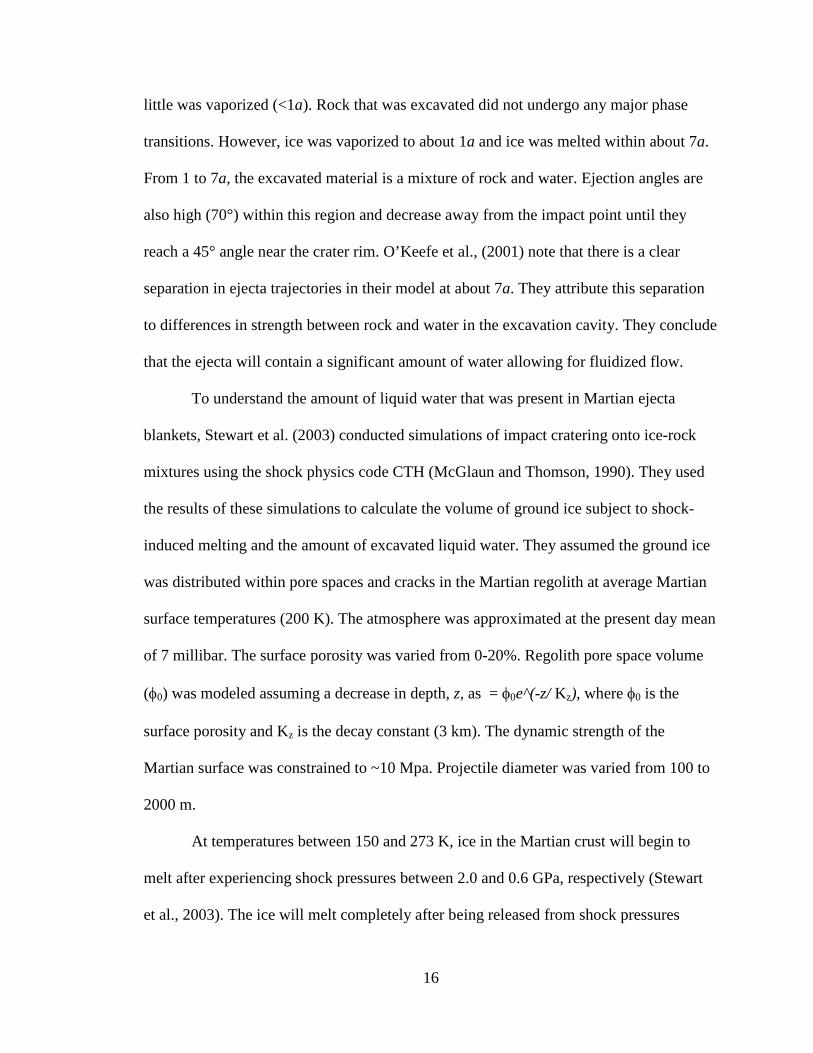
Stewart et al., (2001) modeled impacts into rock-ice mixture using the Eulerian
finite difference code, CTH (McGlaun and Thomson, 1990), and found that ejection
angles at the point of impact are high (70˚) and nearly constant in the zone of melted ice
and brecciated rock (7Rp) for a rock-ice mixture with 20% volume subsurface ice. In
contrast, pure rock targets had a peak ejection angle of about 60˚. In all experiments, the
ejection angles decrease to about 45˚ near the crater rim. Models with peak ejection
angles of 70˚ (consistent with 10-20%vol ice) produced ejecta layers of consistent
thickness that were high in water content. Models with initial ejection angles of about 80˚
corresponding to increased amounts of water produced an ejecta blanket that was more
pronounced with a large step in ejecta thickness about 0.6 crater radii (Rc) from the rim.
O’Keefe et al. (2001) calculated geologic strength models using shock wave
physics code CTH (McGlaun and Thomson, 1990). They found that since ice is more
compressible than rock, more work was done on the ice. Consequently, a larger volume
of ice was subjected to shock-induced phase transformations compared to the rocks. In
their numerical model, a small zone of rock (~ 1 impactor radius, a) was melted and very
16
little was vaporized (<1a). Rock that was excavated did not undergo any major phase
transitions. However, ice was vaporized to about 1a and ice was melted within about 7a.
From 1 to 7a, the excavated material is a mixture of rock and water. Ejection angles are
also high (70°) within this region and decrease away from the impact point until they
reach a 45° angle near the crater rim. O’Keefe et al., (2001) note that there is a clear
separation in ejecta trajectories in their model at about 7a. They attribute this separation
to differences in strength between rock and water in the excavation cavity. They conclude
that the ejecta will contain a significant amount of water allowing for fluidized flow.
To understand the amount of liquid water that was present in Martian ejecta
blankets, Stewart et al. (2003) conducted simulations of impact cratering onto ice-rock
mixtures using the shock physics code CTH (McGlaun and Thomson, 1990). They used
the results of these simulations to calculate the volume of ground ice subject to shock-
induced melting and the amount of excavated liquid water. They assumed the ground ice
was distributed within pore spaces and cracks in the Martian regolith at average Martian
surface temperatures (200 K). The atmosphere was approximated at the present day mean
of 7 millibar. The surface porosity was varied from 0-20%. Regolith pore space volume
(φ0) was modeled assuming a decrease in depth, z, as = φ0e^(-z/ Kz), where φ0 is the
surface porosity and Kz is the decay constant (3 km). The dynamic strength of the
Martian surface was constrained to ~10 Mpa. Projectile diameter was varied from 100 to
2000 m.
At temperatures between 150 and 273 K, ice in the Martian crust will begin to
melt after experiencing shock pressures between 2.0 and 0.6 GPa, respectively (Stewart
et al., 2003). The ice will melt completely after being released from shock pressures
17
above 5.5 and 3.7 GPa. Stewart et al. (2003) concluded that, in the present climate, about
half the excavated ice is melted by impact shock. About 60% of ground ice will
completely melt in equatorial zones while at the poles more that 20% will be melted.
Their results indicate that ejecta fluidization does not require pre-existing water near the
surface because shock-melting of ground ice will introduce large quantities of liquid
water into the ejecta blanket.
According to Barlow (2010), the relative role of subsurface volatiles versus the
atmosphere in the formation of layered ejecta blankets is one of the major questions
remaining concerning the geology of Mars. Barlow (2005) suggests that fluidized ejecta
are produced by some combination of the atmospheric and subsurface volatiles models.
Building upon Schultz’s (1992a) idea that ejecta can flow without water if the particles
are small enough, the goal of this study is to test the hypothesis that the vaporization of
water during the excavation stage of impact cratering is the mechanism that decreases the
size of ejecta and facilitates its fluidized emplacement. The interaction between water and
rock during decompression may be the bridge between the atmospheric and subsurface
volatile models.
Summary
Methods
The shock tube apparatus, described in detailed in Alidibirov and Dingwell
(1996a), was used to conduct decompression experiments on rock-water mixtures. This
instrument consists of a lower chamber which can be pressurized up to 40 MPa with Ar
Fragmentation Methods
18
gas (Figure 5). This lower chamber is separated from the upper chamber (room
temperature and pressure) by a series of metal diaphragms. These diaphragms are of
various thicknesses and are inscribed with a ring and cross pattern that cut into the
diaphragm at various depths. The combinations of diaphragm material (Cu or Al) and
thickness and imprint depth determine the pressure at which the diaphragm will open.
When the diaphragm breaks cleanly, a shock wave propagates through the lower chamber
as the Ar gas is instantaneously released into the low-pressure, upper chamber. This
shock wave travels through the sample from the top to the bottom in the lower chamber.
As the release wave travels down through the sample, the sample is unloaded and
fractures occur parallel to the release wave front. The fragmented rock particles are
accelerated and eject into the upper chamber.
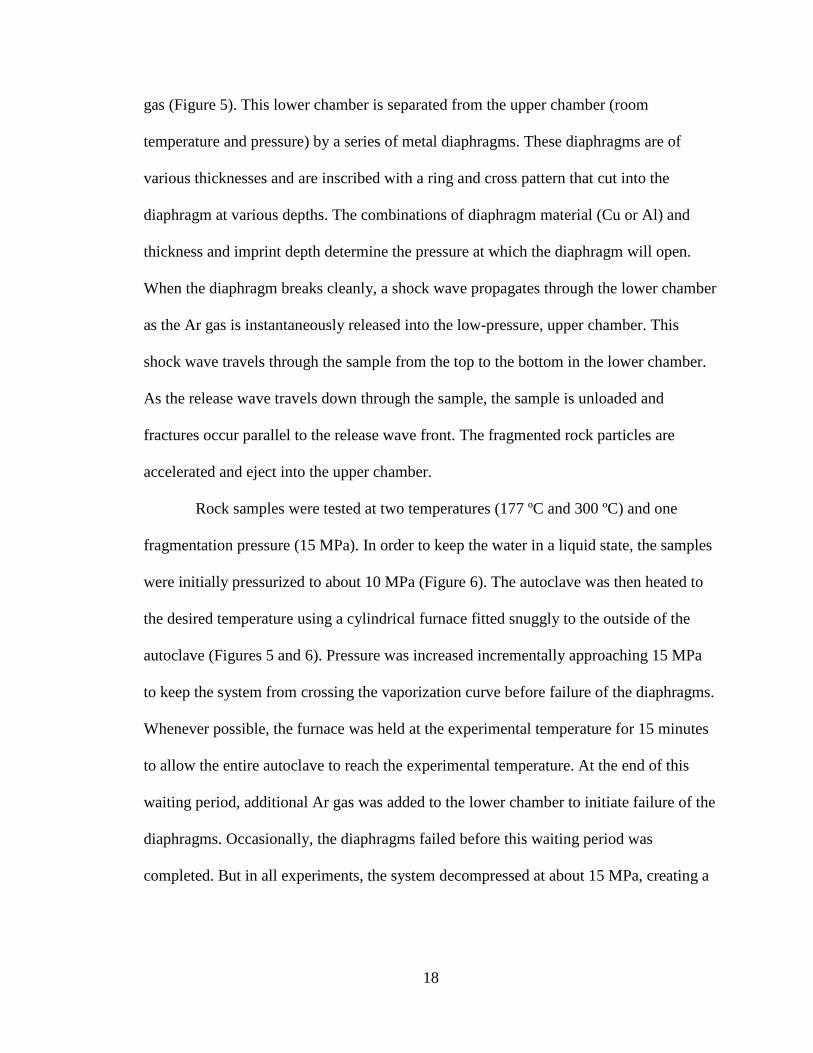
Rock samples were tested at two temperatures (177 ºC and 300 ºC) and one
fragmentation pressure (15 MPa). In order to keep the water in a liquid state, the samples
were initially pressurized to about 10 MPa (Figure 6). The autoclave was then heated to
the desired temperature using a cylindrical furnace fitted snuggly to the outside of the
autoclave (Figures 5 and 6). Pressure was increased incrementally approaching 15 MPa
to keep the system from crossing the vaporization curve before failure of the diaphragms.
Whenever possible, the furnace was held at the experimental temperature for 15 minutes
to allow the entire autoclave to reach the experimental temperature. At the end of this
waiting period, additional Ar gas was added to the lower chamber to initiate failure of the
diaphragms. Occasionally, the diaphragms failed before this waiting period was
completed. But in all experiments, the system decompressed at about 15 MPa, creating a
19
release wave that propagated downward and ejected the rock fragments into the upper
chamber.
Sample Preparation
Our purpose is the investigation of the behavior of water-bearing Martian regolith
when the rock-water mixture crosses the vaporization curve during the rapid
decompression associated with crater excavation. Carrying out these experiments
requires a rock that is as close as reasonably possible to a generic regolith composition
and structure for Mars. The Martian surface is covered by sedimentary deposits derived
from basalt and andesite (Bandfield et al. 2000; Malin and Edgett, 2000a and 200b;
Barlow, 2008). A volcaniclastic rock from the northern Eldorado Mountains of southern
Nevada, U.S.A. (Anderson, 1971) was used for these experiments. This is a thinly bedded
(1 – 3 mm) volcaniclastic sandstone composed of olivine, quartz, and occasional small
(<3 mm) rock and pumice fragments derived from mid-Miocene Patsy Mine basalt,
dacite, and rhyolite. This rock was chosen for two reasons. First, it is composed of eroded
volcanic rocks similar to Martian regolith. Second, the rock’s uniform structure and
composition make it ideal for use in these experiments where the physical property of the
rock must be consistent for each trial. The rock samples used in this investigation are not
meant to be an accurate representation of the Martian regolith. Indeed the regolith is
made up of varying rock types. It would be impossible to find one rock that would fit all
target conditions on Mars. The rock used is similar to many rocks on Mars, in particular
those found at Meridiana Planum (Squyres et al., 2006), in that it is a sedimentary rock
derived from volcanic rocks. It contains basalt, which is common on Mars, but it also
contains rhyolite, which is not. Because no study of this kind has ever been conducted, it
20
is more important to test a homogeneous material that allows testing the effects of
vaporization of varying amounts of water.
The rock was cut into 2.5-cm-diameter, 4-cm-long cylindrical samples. The
samples were placed in a 190°C oven overnight to drive off water from the open pore
space. After cooling in a desiccator, each sample was weighed in grams on an electronic
balance. Two diameter measurements were made using digital calipers, one at each end
of the cylinder (about 0.5 to 1 cm from the end). The average of these two diameters was
used to calculate the sample volume (Vcalc). Each sample was placed in a helium
pycnometer to determine the sample volume minus open pore space (Vhc). The percent
of open porosity ([[Vcalc - Vhc ]/ Vcalc] x 100%) was then calculated. The sandstone has
an average calculated density of 1.8958 g/cm2 and average measured density of 2.1627
g/cm2, with standard deviations of 0.005 and 0.0053, respectively. The average open
porosity of the samples is 27.4450%, with a standard deviation of 3.3277. Samples were
stored in air-tight containers until experimental preparation.
Prior to the experiment, each rock sample was placed in a steel crucible cylinder
open on one end with an interior diameter slightly smaller than the rock sample. This
tight fit facilitates fracture of the sample during decompression by preventing the entire
rock cylinder from ejecting into the upper chamber upon decompression. This was
accomplished by placing the rock sample on the open end of the cylinder and heating the
steel cylinder with a hot air gun causing it to expand slightly while pressing the rock into
the cylinder using a hydraulic press. Each sample in its crucible was stored in an air tight
container until the experiment was conducted (no more than 24 hours).
21
To test the effects of water content on rock fragmentation, varying amounts of
water were added to each sample. The goal was to cover the range of possible percent
open pore space (%OPS) water contents from 0 – 100 at approximately 15%-intervals
(0%, 15%, 30%, 45%, 70%, and 100%). To determine the amount of water to add to each
sample, the volume (ml) of open pore space for was calculated for each sample,
determined the volume of the desired %OPS water, and added that amount of distilled
water to the top of the rock sample in the crucible. The sample was placed in a vacuum to
draw the water as evenly as possible through the sample. After a few hours, the sample
was inspected to determine whether the top of the rock sample and the bottom (visible
through a small hole) appeared to have about the same degree of wetness. The sample
was weighed to determine if it still had the correct amount of water. More water was
added if necessary. The sample was iteratively inspected and weighed, adding water as
necessary, until the target %OPS water closely approximated. The sample was weighed
immediately prior to placement in the lower chamber of the shock tube apparatus and the
actual %OPS water was recorded (Table 1).
Methods for adding water to the sample
Sieving methods and grain shape analysis
After each experiment, a high-pressure water hose was used to flush the upper
tank. The rock fragments were collected, dried, and sieved between sieve sizes -4 and 4
phi at 0.5-phi intervals. The contents of each sieve were weighed on an electronic balance
and the weight percent of each sieve interval was calculated. A grain size distribution
curve was plotted on an arithmetic probability grid for each sample using GRANPLOT, a
Microsoft Excel Spreadsheet developed by Balsillie et al. (2002). Inman (1952)
22
parameters were calculated, including (1) median diameter (Mdφ = φ50), the phi-size
where the cumulative distribution curve crosses the 50% mark; (2) graphical standard
deviation (σφ = [φ84 - φ16]/2), which is a measure of sorting; and (3) first order skewness
(αφ = [((φ84 + φ16) – Mdφ]/σφ), which is a measure of asymmetry of the distribution. Also
calculated was kurtosis, a measure of the peakedness of the distribution, and the short (S),
intermediate (I), and long (L) axes of each fragment from phi sizes -1.5 and -2 for each
experiment. Using the S/L index and form index ([L-I]/[L-S]) developed by Sneed and
Folk (1958), the grain shape for each sample was determined. The average S/L and form
index as well as standard deviation were calculated and plotted for each experiment.
Results
Although the control experiments (samples 102 and 422; 0% OPS H
Grain-size Distribution
2O; 177 and
300 ˚C, respectively) were run at different temperatures, both have an overall similar
grain size distribution as evidenced by their similar median diameter (Mdφ), graphic
standard deviation (σφ), and shape for their frequency distribution and cumulative
frequency (Figures 7A, 7B, and 8). For sample 102 (0% OPS H2O, 177 ˚C) Mdφ = -
1.4265 φ and σφ = 1.45 φ. Sample 422 (0% OPS H2O, 300 ˚C) has Mdφ = -1.3078 φ and
σφ = 1.45 φ (Figures 7A, 7B, and 8; and Table 2). In addition, they have similar values of
skewness (sample 102: 1.2575; sample 422: 1.0919) and kurtosis (sample 102: 4,2256;
sample 422: 4.0003) (Table 2). The similarities in grain size distribution indicate that
temperature did not play a significant role in the fragmentation behavior of the control
samples. As water is added to the open pore space of the sample, there is a shift toward
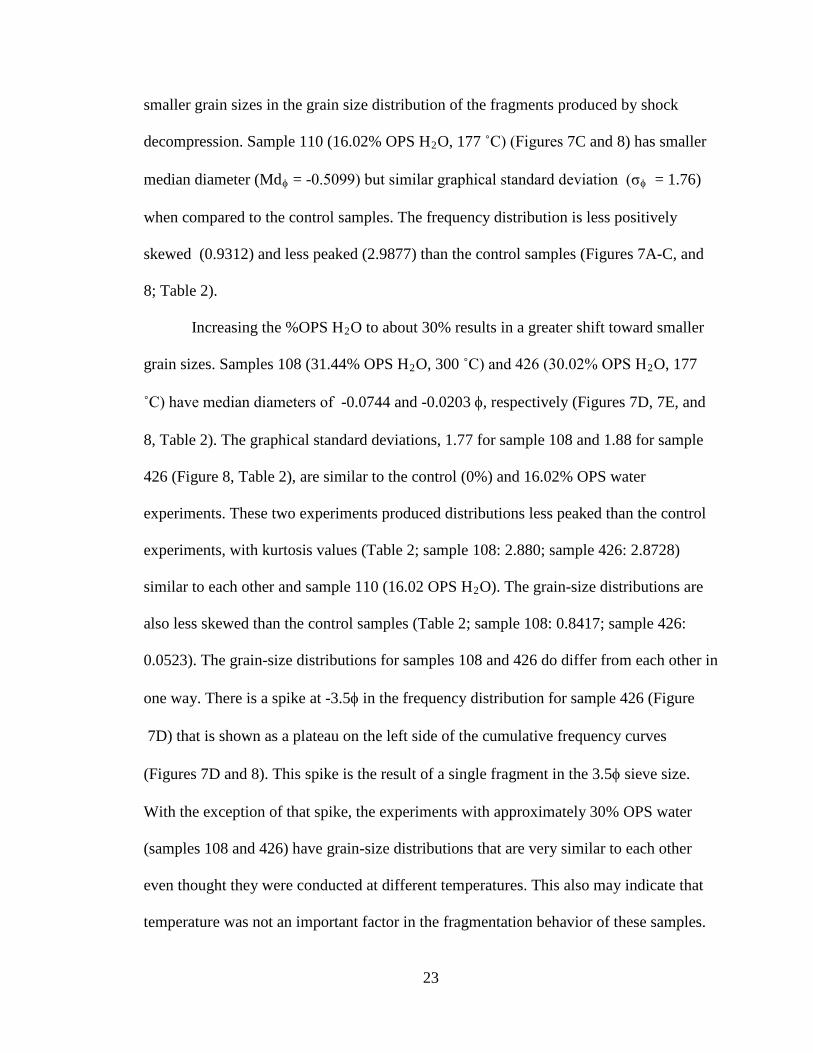
23
smaller grain sizes in the grain size distribution of the fragments produced by shock
decompression. Sample 110 (16.02% OPS H2
median diameter (Md
O, 177 ˚C) (Figures 7C and 8) has smaller
φ = -0.5099) but similar graphical standard deviation (σφ
skewed (0.9312) and less peaked (2.9877) than the control samples (Figures 7A-C, and
8; Table 2).
= 1.76)
when compared to the control samples. The frequency distribution is less positively
Increasing the %OPS H2O to about 30% results in a greater shift toward smaller
grain sizes. Samples 108 (31.44% OPS H2O, 300 ˚C) and 426 (30.02% OPS H2O, 177
˚C) have median diameters of -0.0744 and -0.0203 φ, respectively (Figures 7D, 7E, and
8, Table 2). The graphical standard deviations, 1.77 for sample 108 and 1.88 for sample
426 (Figure 8, Table 2), are similar to the control (0%) and 16.02% OPS water
experiments. These two experiments produced distributions less peaked than the control
experiments, with kurtosis values (Table 2; sample 108: 2.880; sample 426: 2.8728)
similar to each other and sample 110 (16.02 OPS H2
7D) that is shown as a plateau on the left side of the cumulative frequency curves
(Figures 7D and 8). This spike is the result of a single fragment in the 3.5φ sieve size.
With the exception of that spike, the experiments with approximately 30% OPS water
(samples 108 and 426) have grain-size distributions that are very similar to each other
even thought they were conducted at different temperatures. This also may indicate that
temperature was not an important factor in the fragmentation behavior of these samples.
O). The grain-size distributions are
also less skewed than the control samples (Table 2; sample 108: 0.8417; sample 426:
0.0523). The grain-size distributions for samples 108 and 426 do differ from each other in
one way. There is a spike at -3.5φ in the frequency distribution for sample 426 (Figure
24
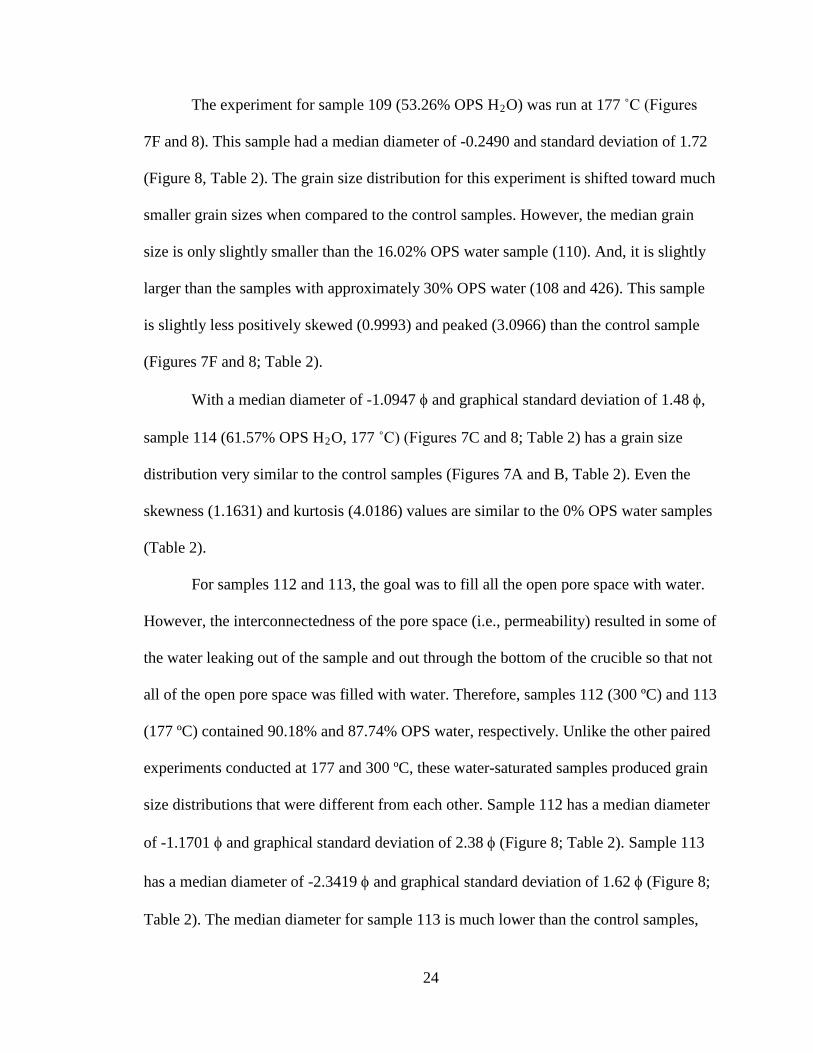
The experiment for sample 109 (53.26% OPS H2
With a median diameter of -1.0947 φ and graphical standard deviation of 1.48 φ,
sample 114 (61.57% OPS H
O) was run at 177 ˚C (Figures
7F and 8). This sample had a median diameter of -0.2490 and standard deviation of 1.72
(Figure 8, Table 2). The grain size distribution for this experiment is shifted toward much
smaller grain sizes when compared to the control samples. However, the median grain
size is only slightly smaller than the 16.02% OPS water sample (110). And, it is slightly
larger than the samples with approximately 30% OPS water (108 and 426). This sample
is slightly less positively skewed (0.9993) and peaked (3.0966) than the control sample
(Figures 7F and 8; Table 2).
2
For samples 112 and 113, the goal was to fill all the open pore space with water.
However, the interconnectedness of the pore space (i.e., permeability) resulted in some of
the water leaking out of the sample and out through the bottom of the crucible so that not
all of the open pore space was filled with water. Therefore, samples 112 (300 ºC) and 113
(177 ºC) contained 90.18% and 87.74% OPS water, respectively. Unlike the other paired
experiments conducted at 177 and 300 ºC, these water-saturated samples produced grain
size distributions that were different from each other. Sample 112 has a median diameter
of -1.1701 φ and graphical standard deviation of 2.38 φ (Figure 8; Table 2). Sample 113
has a median diameter of -2.3419 φ and graphical standard deviation of 1.62 φ (Figure 8;
Table 2). The median diameter for sample 113 is much lower than the control samples,
O, 177 ˚C) (Figures 7C and 8; Table 2) has a grain size
distribution very similar to the control samples (Figures 7A and B, Table 2). Even the
skewness (1.1631) and kurtosis (4.0186) values are similar to the 0% OPS water samples
(Table 2).
25
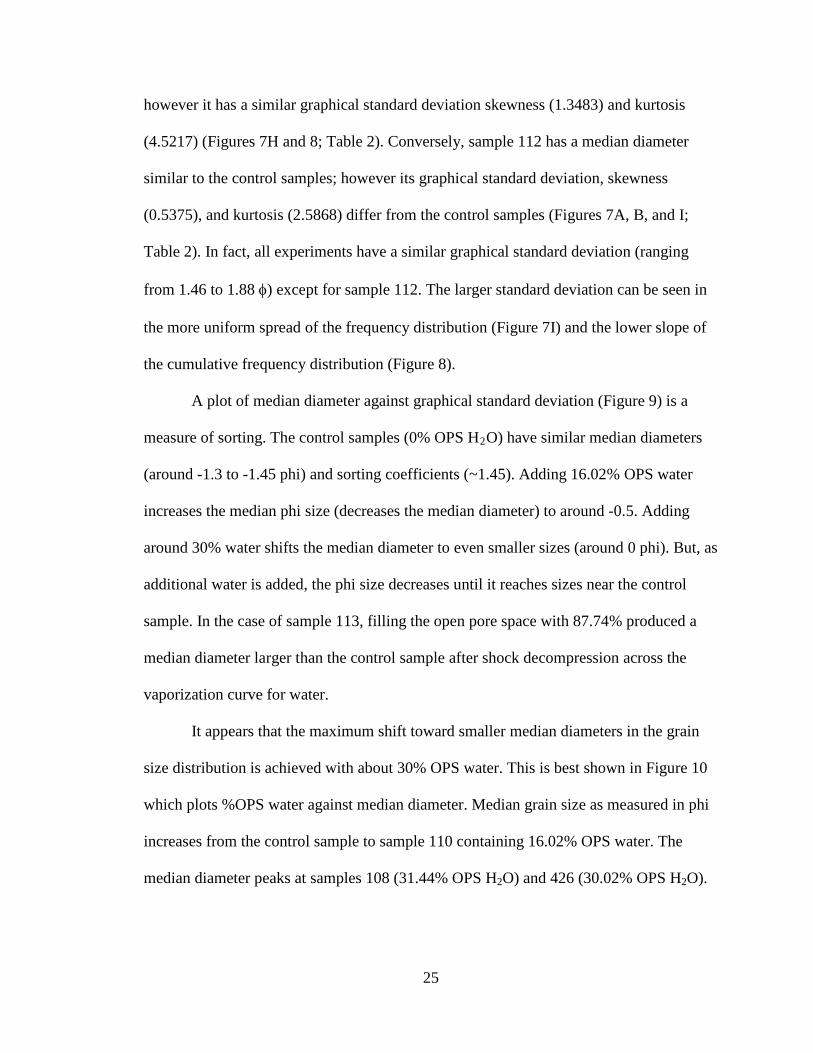
however it has a similar graphical standard deviation skewness (1.3483) and kurtosis
(4.5217) (Figures 7H and 8; Table 2). Conversely, sample 112 has a median diameter
similar to the control samples; however its graphical standard deviation, skewness
(0.5375), and kurtosis (2.5868) differ from the control samples (Figures 7A, B, and I;
Table 2). In fact, all experiments have a similar graphical standard deviation (ranging
from 1.46 to 1.88 φ) except for sample 112. The larger standard deviation can be seen in
the more uniform spread of the frequency distribution (Figure 7I) and the lower slope of
the cumulative frequency distribution (Figure 8).
A plot of median diameter against graphical standard deviation (Figure 9) is a
measure of sorting. The control samples (0% OPS H2
It appears that the maximum shift toward smaller median diameters in the grain
size distribution is achieved with about 30% OPS water. This is best shown in Figure 10
which plots %OPS water against median diameter. Median grain size as measured in phi
increases from the control sample to sample 110 containing 16.02% OPS water. The
median diameter peaks at samples 108 (31.44% OPS H2O) and 426 (30.02% OPS H2O).
O) have similar median diameters
(around -1.3 to -1.45 phi) and sorting coefficients (~1.45). Adding 16.02% OPS water
increases the median phi size (decreases the median diameter) to around -0.5. Adding
around 30% water shifts the median diameter to even smaller sizes (around 0 phi). But, as
additional water is added, the phi size decreases until it reaches sizes near the control
sample. In the case of sample 113, filling the open pore space with 87.74% produced a
median diameter larger than the control sample after shock decompression across the
vaporization curve for water.
26
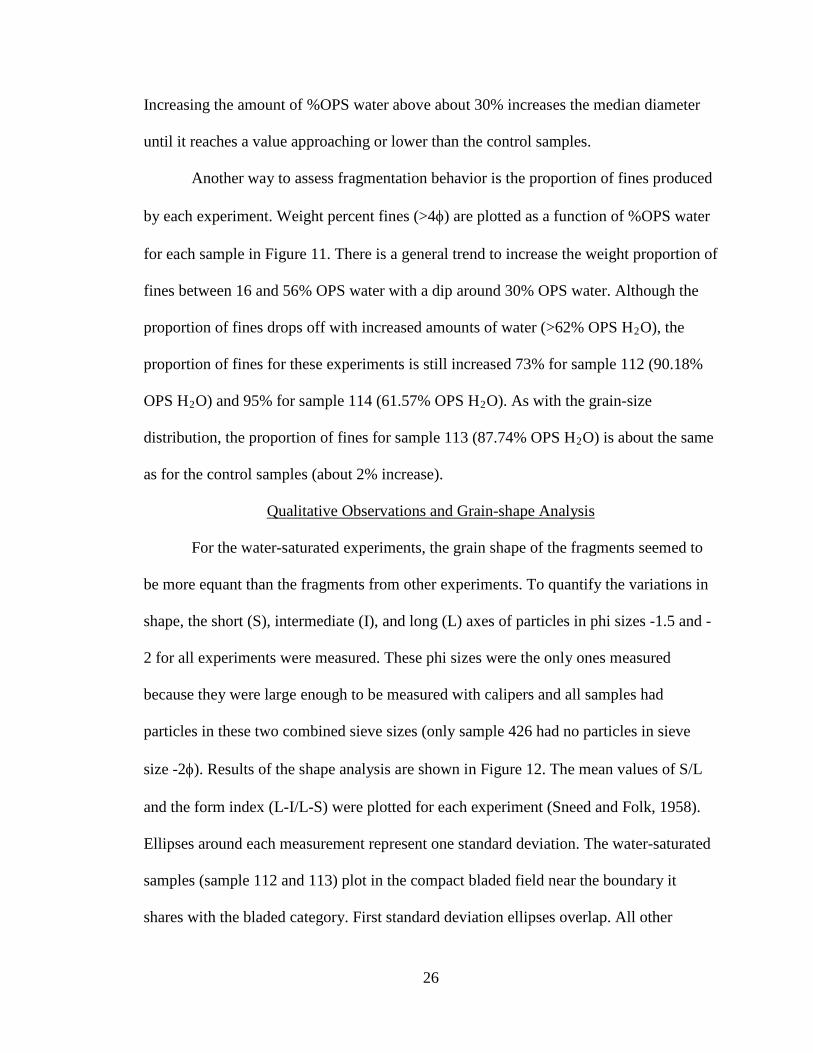
Increasing the amount of %OPS water above about 30% increases the median diameter
until it reaches a value approaching or lower than the control samples.
Another way to assess fragmentation behavior is the proportion of fines produced
by each experiment. Weight percent fines (>4φ) are plotted as a function of %OPS water
for each sample in Figure 11. There is a general trend to increase the weight proportion of
fines between 16 and 56% OPS water with a dip around 30% OPS water. Although the
proportion of fines drops off with increased amounts of water (>62% OPS H2O), the
proportion of fines for these experiments is still increased 73% for sample 112 (90.18%
OPS H2O) and 95% for sample 114 (61.57% OPS H2O). As with the grain-size
distribution, the proportion of fines for sample 113 (87.74% OPS H2O) is about the same
as for the control samples (about 2% increase).
For the water-saturated experiments, the grain shape of the fragments seemed to
be more equant than the fragments from other experiments. To quantify the variations in
shape, the short (S), intermediate (I), and long (L) axes of particles in phi sizes -1.5 and -
2 for all experiments were measured. These phi sizes were the only ones measured
because they were large enough to be measured with calipers and all samples had
particles in these two combined sieve sizes (only sample 426 had no particles in sieve
size -2φ). Results of the shape analysis are shown in Figure 12. The mean values of S/L
and the form index (L-I/L-S) were plotted for each experiment (Sneed and Folk, 1958).
Ellipses around each measurement represent one standard deviation. The water-saturated
Qualitative Observations and Grain-shape Analysis
samples (sample 112 and 113) plot in the compact bladed field near the boundary it
shares with the bladed category. First standard deviation ellipses overlap. All other
27
samples plot within the bladed field and have overlapping first standard deviation
ellipses. The first standard deviation ellipses of the water-saturated samples do not
overlap with the other samples.
Discussion
Increased water in the open pore space does not result in an overall decrease in
grain size, but water vaporization does affect the grains size distribution of the ejecta. The
degree of fragmentation appears to peak around 30% OPS water (sample 108: 31.44%
OPS water, 300 ˚C; sample 426: 30.02 % OPS water, 177 ˚C) (Figures 7D, 7E, and 8,
Table 2). Sample 426 (30.02% OPS H2
Control samples have the lowest proportion of fines. The weight percent of fines
increases drastically at 16% OPS water, decreases somewhat at around 30% OPS water,
increases again around 50% OPS water, then drops again as the sample approaches water
saturation (samples 112 and 113). Experiments for 0%, ~30%, and water-saturated
samples were conducted during the same week. Two qualitative observations suggest
another fracture mechanism contributes to the difference in grain shape. First, the water
O, 300 ˚C) had one fragment in -4 φ, which
produced a flattening in the curve up to -2 φ. Slightly larger median diameter sizes were
produced by the 53.26% OPS and 16.02% OPS water experiments which have median
diameters of -0.2490 φ and -0.5099 φ, respectively. Experiments using 0%, 61.57%, and
90.18% OPS water produced a sample with an even larger median diameter of about -
1.25 φ. The experiment that resulted in the largest median diameter contained 87.74%
OPS water and was run at 177 ºC. All samples have similar sorting coefficients as
represented by the similar slope to each curve.
28
saturated experiments were much louder than the other experiments. Second, fine
particles were found clinging to the lid and rim of the upper tank after the water-saturated
experiments. This was not the case for any of the other experiments.
The shape of the water saturated samples is blockier, indicating that the
vaporization of water in this case may cause fracturing perpendicular to the release wave
front (Figure 13). The water saturated samples were much louder than the other samples.
They also caused ejecta to be expelled to the top of the chamber. These two qualitative
observations indicate that the water saturated samples may have caused the rock to be
expelled into the upper chamber with more force and at a higher speed. Future studies
may involve high speed photography and/or use of a pressure transducer to measure the
speed of the ejection. One of the characteristics of rampart craters is that they generally
lack secondary craters within the ejecta blanket. If high water content results in a higher
ejection velocity and force, this could cause larger blocks to be transported farther than is
typical for ballistically emplaced ejecta.
Not all samples were held heated at peak furnace temperature for 15 minutes
before fragmentation, so it is not absolutely certain that the crucible and sample
equilibrated and reached the target temperature. The timing of the diaphragm failure is
often beyond experimental control. Diaphragms may fail due to variations in the
thickness of the imprint depth. For future investigations, the temperature of the sample
chamber will be measured at various times during heating so that if early diaphragm
failure occurs, an accurate estimate of the temperature of the sample during
fragmentation can be obtained. This will provide confirmation that water added to the
sample crossed the vaporization curve.
29
It is possible that not all of the water contained in the open pore space of each
sample was driven off. Therefore the actual %OPS water probably varies from that listed
in Table 1. However, all samples were treated consistently, so the relative effects of
adding water can still be measured.
The distribution of open pore space in the sample may be another factor affecting
grain size distribution of the fragmented samples. If a sample’s open porosity varies too
much within a sample, it may cause part of a sample to fracture more than another and
that may account for some differences in grain size distribution curve shape. Future
studies will account for this problem by measuring permeability and mapping the open
pore space with tomography.
Fluidized ejecta are present on Venus (Figure 14), a planet with a very thick
atmosphere but without subsurface volatiles; and, on Ganymede (Figure 15), a body with
an icy surface but no atmosphere. These situations represent end-members of the
fluidized ejecta mechanism. Venus represents the atmospheric end-member, and
Ganymede represents the subsurface volatile end member. With its relatively thin
atmosphere and ice-bearing regolith, Mars is somewhere in between.
Proposed Model for the Formation of SLE and MLE ejecta
In laboratory experiments, Schultz (1992a) produced fluidized ejecta in two ways.
First, in a vacuum, fluidized ejecta could be produced by impact into targets with fine
grain particles. Second, impact into coarser grained materials produced fluidized ejecta
when the atmospheric pressure was increased. Venus is an example of the latter case.
Schultz contends that fluidized ejecta are produced at lower pressures if the ejecta
particles are small enough. The goal of these experiments was to test the idea that
30
explosive vaporization of water during rapid decompression associated with impact
cratering is the mechanism that introduces these fine particles into the ejecta. Our results
indicate that water vaporization can affect the grain size distribution of ejecta particles.
Our results indicate that with ~28% open porosity, the grain size distribution is
significantly reduced by water vaporization when the rock has about 30% of the open
pore space filled with water. This begs the question of whether or not water crosses the
vaporization curve during impact cratering. Experiments and modeling conducted by
Stewart et al. (2003) indicate that a substantial amount of water ice is melted and
vaporized during impact cratering. The proportion of subsurface ice that is melted or
vaporized varies with impactor size (and consequently crater size), water content, and
surface temperature (latitude). Stewart et al., (2003) found that for a 500-m diameter
impactor, about half the amount of water within the excavation zone will melt and a
quarter will vaporize. This amount of water is sufficient to drastically reduce the median
diameter of the ejecta particles.
According to Barnouin-Jha et al. (1999a, b), during hypervelocity planetary
impacts, ejecta are excavated along ballistic trajectories in an inverted cone shape that
displaces the atmosphere as it advances and creates a vortex ring (Figures 4). This vortex
ring can entrain, transport, and deposit ejecta and fine-grained surface materials. They
concluded that ejecta curtain width and velocity, particle concentration, ejecta size
distribution, motion of ejecta particles parallel to the curtain, and the density, viscosity,
and compressibility of the surrounding atmosphere all influence the vortex circulation
strength. The circulation generated by the ejecta curtain is largely a function of the length
(L) and outward curtain velocity (U) of the curtain where it transitions from impermeable
31
to permeable (Barnouin-Jha and Schultz, 1996, 1999a, and1999b). Permeability of the
ejecta curtain to the surrounding atmosphere is the primary factor controlling the
circulation generated by the advancing ejecta curtain (Barnouin-Jha et al., 1999a; 1999b).
The most common diameter size is a major factor affecting the length at which the
curtain becomes permeable. Smaller ejecta diameter will result in a shorter length at
which the curtain transitions from impermeable to permeable.
This study proposes that the decompression of water increases the degree of
fragmentation of the ejecta and decreases the average ejecta size. Consequently, this
decrease in average ejecta size lowers the length at which the ejecta curtain becomes
permeable. This allows a vortex ring to form behind the ejecta curtain in a manner
described by Schultz (1992a), Barnouin-Jha and Schultz (1996 and 1998), and Barnouin-
Jha et al. (1999a, 1999b). The vortex ring winnows finer grained materials from the
ejecta blanket, remobilizes material on the surface, and deposits the material in a
fluidized ejecta blanket with a terminal rampart (Figures 1 and 4).
In addition to facilitating ejecta fluidization by creating smaller ejecta particles
that interact with the atmosphere, the vaporization of water may also play a part in the
dearth of secondary craters within the ejecta blanket. Results suggest it takes relatively
small amounts of water (in a rock with ~28% open porosity, 30% of that open pore space
is filled with water) to add a tremendous amount of fines to the ejecta.
Fluidized ejecta on Venus can be thought of as a purely atmospheric end-member
of a hybrid atmospheric/sub-surface volatile model. The Venutian regolith contains no
water; but, in this case, no sub-surface volatiles are required because the ejecta interact
with Venus’ thick atmosphere to produce lobate ejecta with large runout distances
32
indicating high ejecta mobility (Schultz, 1992a; Barnouin-Jha and Schultz, 1996 and
1998; Barnouin-Jha et al., 1999a and 1999b).
In the atmospheric model, fluidized ejecta are produced by interaction of ejecta
with the atmosphere. Fluidized ejecta are produced when ejecta diameter is decreased or
atmospheric pressure is increased (Schultz, 1992a). Under these conditions, the ejecta can
flow and produce fluidized ejecta without any liquid water (Schultz, 1992a).
According to the sub-surface volatile model, fluidized ejecta are produced by the
interaction of ejecta with subsurface volatiles. There are two subsets to this model. In
one, the ejecta interact with the vapor cloud produced by release of volatiles during the
impact (Wohletz and Sheridan, 1983). In the other subset of this model, the ejecta are
fluidized by release of liquid water added to the ejecta during shock melting of ice
(Stewart et al., 2003).
Conclusions
According to Barlow (2010), the relative role of subsurface volatiles versus the
atmosphere in the formation of layered ejecta blankets is one of the major questions
remaining concerning the geology of Mars. A hybrid of the subsurface volatile and
atmospheric models is proposed for the formation of fluidized ejecta. In this model, rapid
decompression of a rock-water mixture causes a portion of the water to vaporize
(subsurface volatile model). This explosive vaporization is the mechanism that adds fine
material to the ejecta and allows the material to be emplaced by the vortex ring behind
the larger blocks in the advancing ejecta curtain (atmospheric model). This reduction in
the grain size of the ejecta may reduce the length at which the ejecta curtain becomes
33
permeable to the atmosphere (Schultz, 1992a; Barnouin-Jha and Schultz, 1996 and 1998;
Barnouin-Jha et al., 1999a and 1999b) and allow the formation of a vortex ring behind
the advancing curtain. This ring is responsible for the fluidization of the ejecta. When a
rock’s pore space is nearly filled with water, larger blocks may be propelled further than
expected, creating smaller secondary craters outside the fluidized ejecta blanket. This
may explain why they are rarely found within fluidized ejecta blankets. More
experiments are needed to better constrain the effects of water vaporization on rock
fragmentation. Additional experiments to test other variables including rock type,
porosity, and permeability are planned with the goal of providing information that can be
included in numerical models of impact cratering so these models can be used to test the
proposed hybrid model.

34
Figure 1. Martian rampart crater morphologies. (A) Single layer ejecta (SLE) crater (THEMIS image I02493005 located near 24ºN 101ºE); (B) Double layer ejecta (DLE) crater (THEMIS image I03350005 located near 49ºN 230.5ºE); and (C) Multiple layer ejecta (MLE) crater (THEMIS image I03218002 located near 6ºN 304ºE). All scale bars are approximate. Adapted from Barlow, 2005.
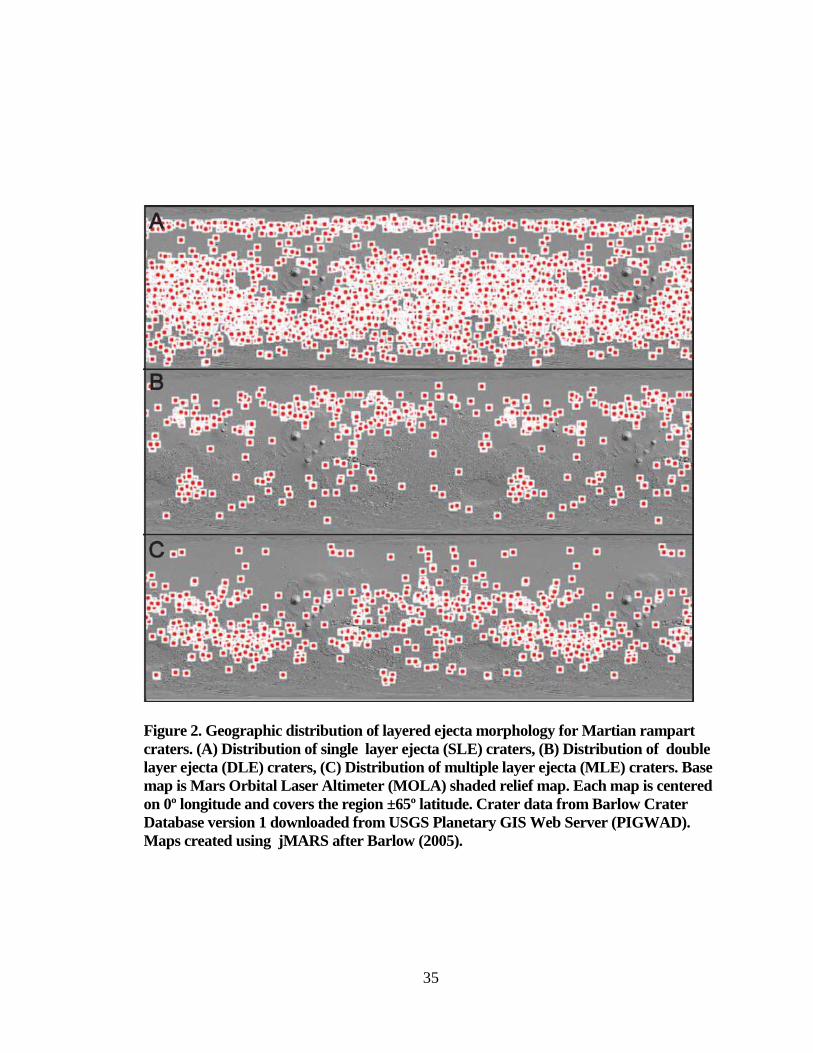
35
Figure 2. Geographic distribution of layered ejecta morphology for Martian rampart craters. (A) Distribution of single layer ejecta (SLE) craters, (B) Distribution of double layer ejecta (DLE) craters, (C) Distribution of multiple layer ejecta (MLE) craters. Base map is Mars Orbital Laser Altimeter (MOLA) shaded relief map. Each map is centered on 0º longitude and covers the region ±65º latitude. Crater data from Barlow Crater Database version 1 downloaded from USGS Planetary GIS Web Server (PIGWAD). Maps created using jMARS after Barlow (2005).
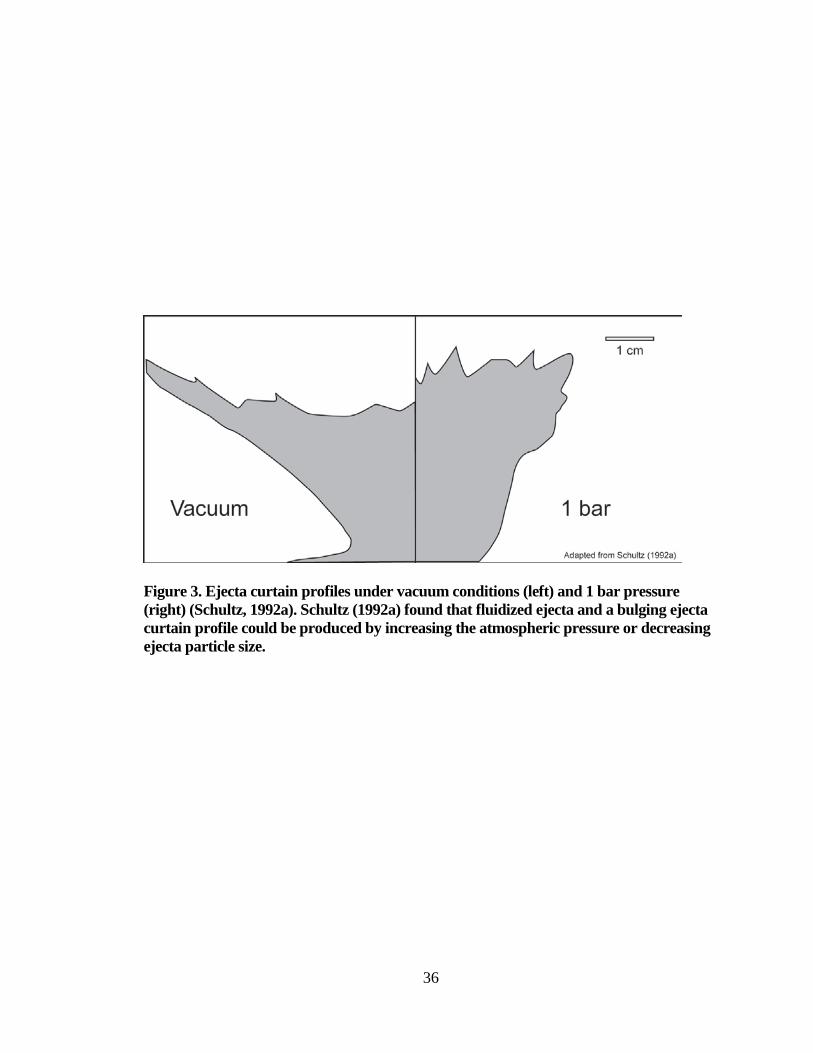
36
Figure 3. Ejecta curtain profiles under vacuum conditions (left) and 1 bar pressure (right) (Schultz, 1992a). Schultz (1992a) found that fluidized ejecta and a bulging ejecta curtain profile could be produced by increasing the atmospheric pressure or decreasing ejecta particle size.
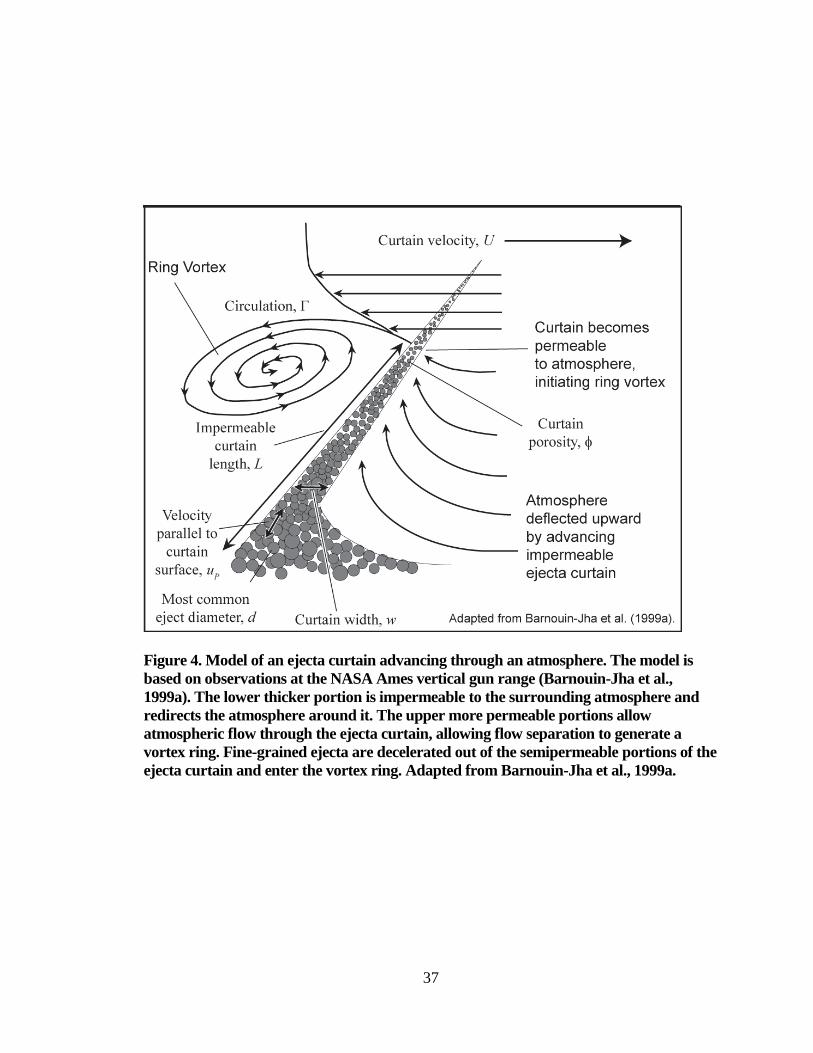
37
Figure 4. Model of an ejecta curtain advancing through an atmosphere. The model is based on observations at the NASA Ames vertical gun range (Barnouin-Jha et al., 1999a). The lower thicker portion is impermeable to the surrounding atmosphere and redirects the atmosphere around it. The upper more permeable portions allow atmospheric flow through the ejecta curtain, allowing flow separation to generate a vortex ring. Fine-grained ejecta are decelerated out of the semipermeable portions of the ejecta curtain and enter the vortex ring. Adapted from Barnouin-Jha et al., 1999a.
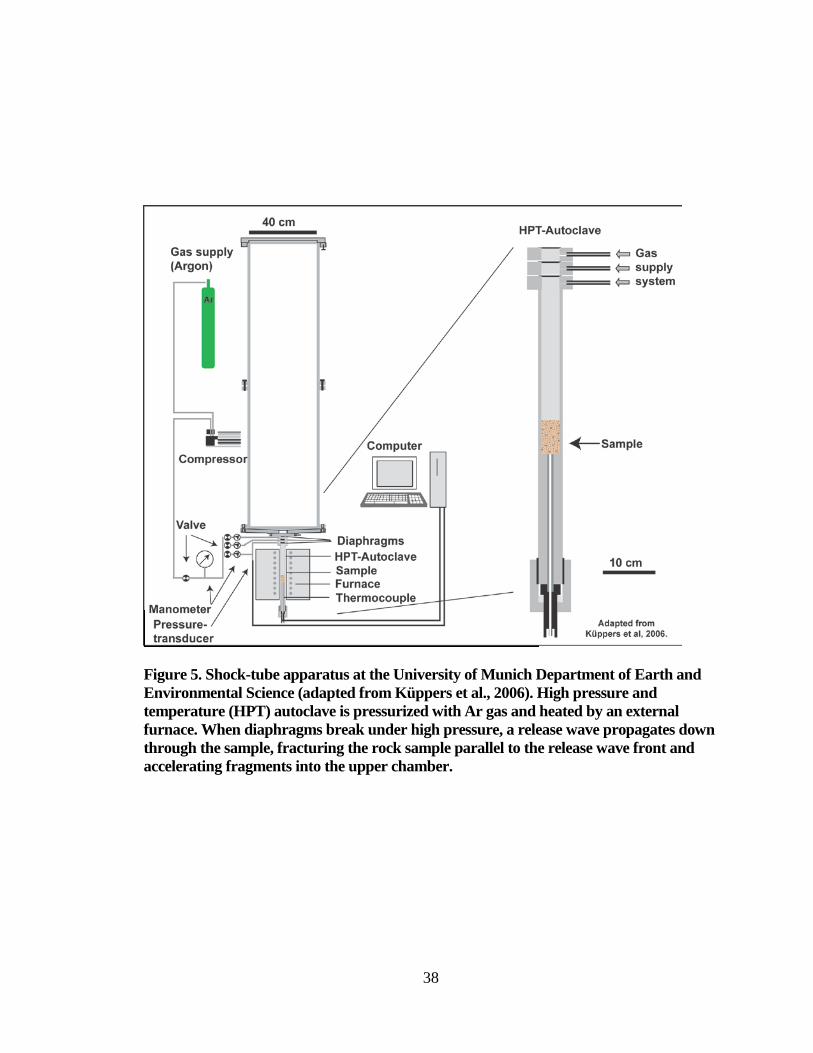
38
Figure 5. Shock-tube apparatus at the University of Munich Department of Earth and Environmental Science (adapted from Küppers et al., 2006). High pressure and temperature (HPT) autoclave is pressurized with Ar gas and heated by an external furnace. When diaphragms break under high pressure, a release wave propagates down through the sample, fracturing the rock sample parallel to the release wave front and accelerating fragments into the upper chamber.
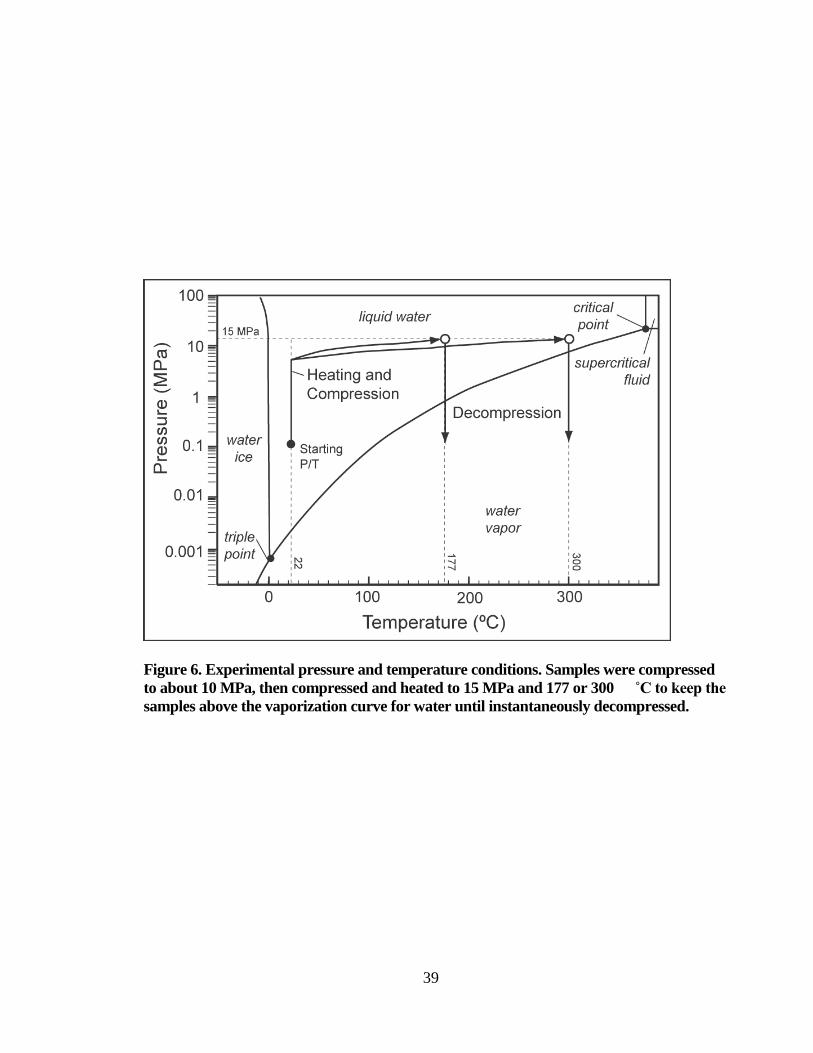
39
Figure 6. Experimental pressure and temperature conditions. Samples were compressed to about 10 MPa, then compressed and heated to 15 MPa and 177 or 300 ˚C to keep the samples above the vaporization curve for water until instantaneously decompressed.
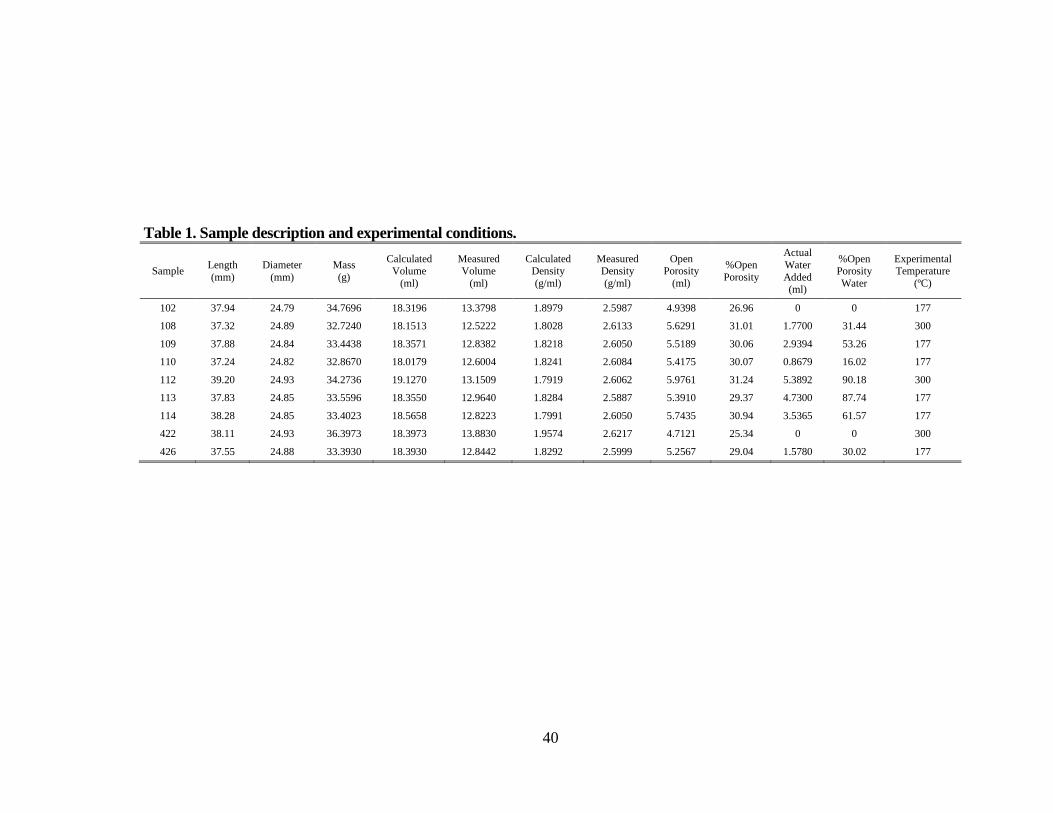
40
Table 1. Sample description and experimental conditions.
Sample Length (mm)
Diameter (mm)
Mass (g)
Calculated Volume
(ml)
Measured Volume
(ml)
Calculated Density (g/ml)
Measured Density (g/ml)
Open Porosity
(ml)
%Open Porosity
Actual Water Added (ml)
%Open Porosity Water
Experimental Temperature
(ºC)
102 37.94 24.79 34.7696 18.3196 13.3798 1.8979 2.5987 4.9398 26.96 0 0 177
108 37.32 24.89 32.7240 18.1513 12.5222 1.8028 2.6133 5.6291 31.01 1.7700 31.44 300
109 37.88 24.84 33.4438 18.3571 12.8382 1.8218 2.6050 5.5189 30.06 2.9394 53.26 177
110 37.24 24.82 32.8670 18.0179 12.6004 1.8241 2.6084 5.4175 30.07 0.8679 16.02 177
112 39.20 24.93 34.2736 19.1270 13.1509 1.7919 2.6062 5.9761 31.24 5.3892 90.18 300
113 37.83 24.85 33.5596 18.3550 12.9640 1.8284 2.5887 5.3910 29.37 4.7300 87.74 177
114 38.28 24.85 33.4023 18.5658 12.8223 1.7991 2.6050 5.7435 30.94 3.5365 61.57 177
422 38.11 24.93 36.3973 18.3973 13.8830 1.9574 2.6217 4.7121 25.34 0 0 300
426 37.55 24.88 33.3930 18.3930 12.8442 1.8292 2.5999 5.2567 29.04 1.5780 30.02 177
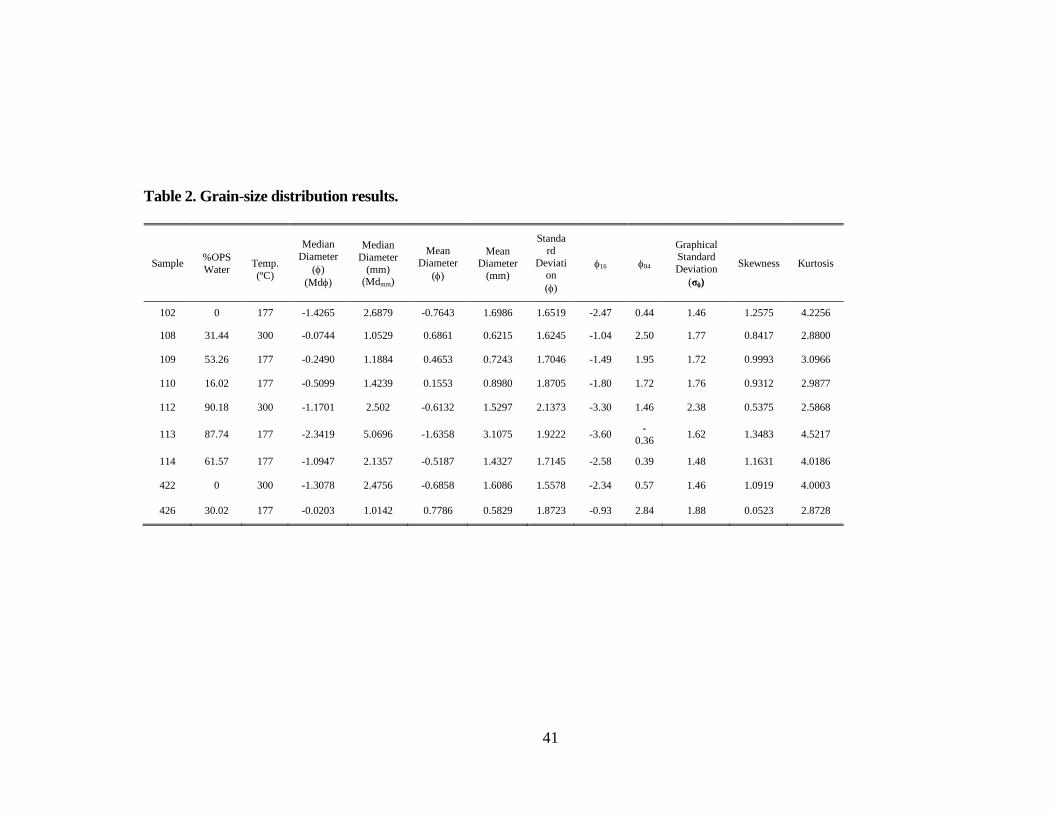
41
Table 2. Grain-size distribution results.
Sample %OPS Water
Temp. (ºC)
Median Diameter
(φ) (Mdφ)
Median Diameter
(mm) (Mdmm)
Mean Diameter
(φ)
Mean Diameter
(mm)
Standard
Deviation (φ)
φ16 φ84
Graphical Standard Deviation
(σφ)
Skewness Kurtosis
102 0 177 -1.4265 2.6879 -0.7643 1.6986 1.6519 -2.47 0.44 1.46 1.2575 4.2256
108 31.44 300 -0.0744 1.0529 0.6861 0.6215 1.6245 -1.04 2.50 1.77 0.8417 2.8800
109 53.26 177 -0.2490 1.1884 0.4653 0.7243 1.7046 -1.49 1.95 1.72 0.9993 3.0966
110 16.02 177 -0.5099 1.4239 0.1553 0.8980 1.8705 -1.80 1.72 1.76 0.9312 2.9877
112 90.18 300 -1.1701 2.502 -0.6132 1.5297 2.1373 -3.30 1.46 2.38 0.5375 2.5868
113 87.74 177 -2.3419 5.0696 -1.6358 3.1075 1.9222 -3.60 -
0.36 1.62 1.3483 4.5217
114 61.57 177 -1.0947 2.1357 -0.5187 1.4327 1.7145 -2.58 0.39 1.48 1.1631 4.0186
422 0 300 -1.3078 2.4756 -0.6858 1.6086 1.5578 -2.34 0.57 1.46 1.0919 4.0003
426 30.02 177 -0.0203 1.0142 0.7786 0.5829 1.8723 -0.93 2.84 1.88 0.0523 2.8728
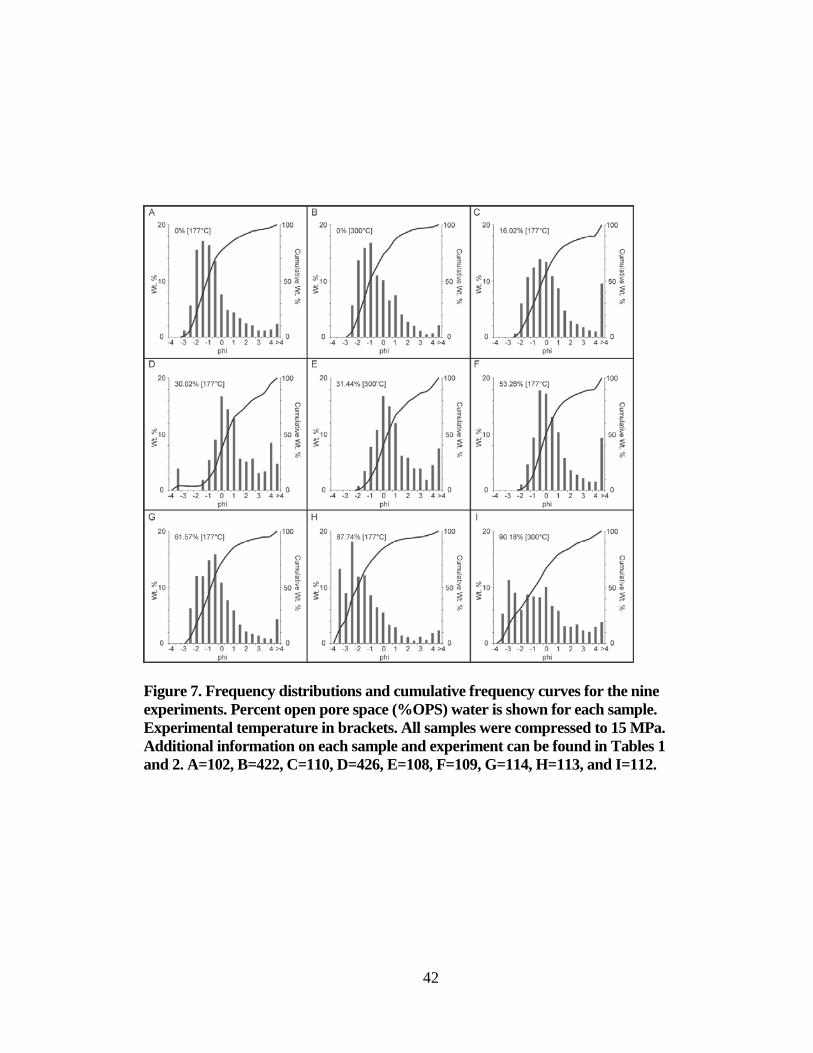
42
Figure 7. Frequency distributions and cumulative frequency curves for the nine experiments. Percent open pore space (%OPS) water is shown for each sample. Experimental temperature in brackets. All samples were compressed to 15 MPa. Additional information on each sample and experiment can be found in Tables 1 and 2. A=102, B=422, C=110, D=426, E=108, F=109, G=114, H=113, and I=112.
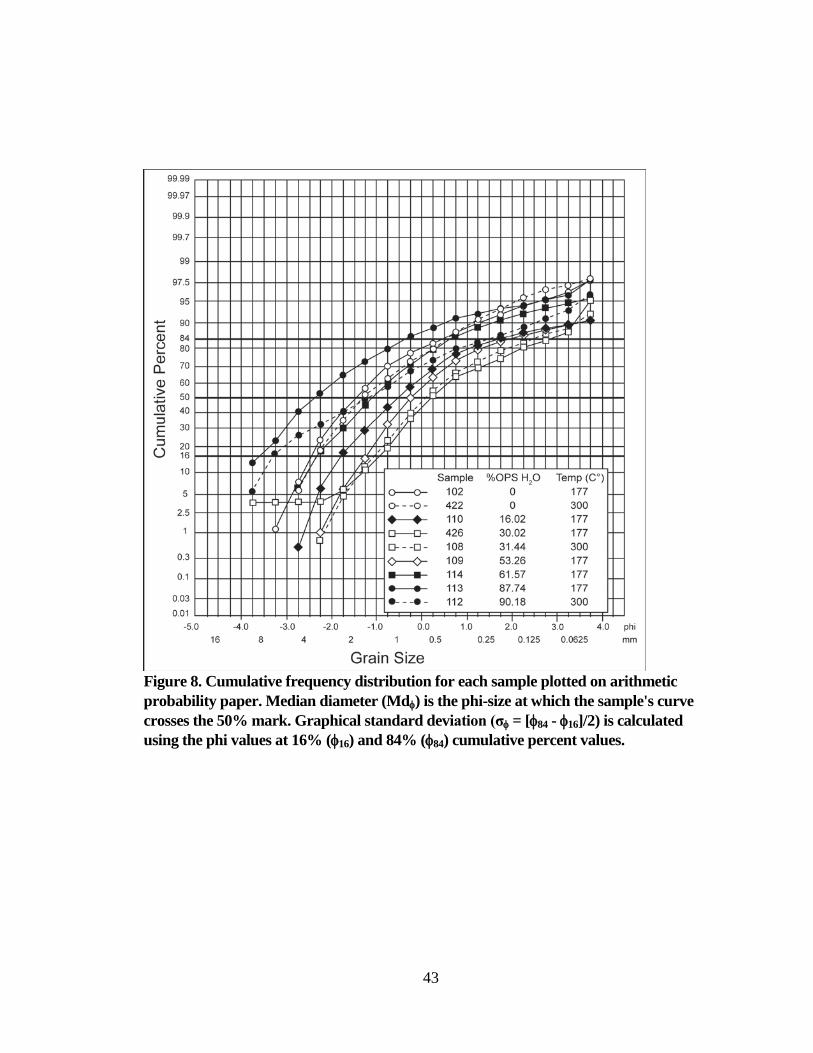
43
Figure 8. Cumulative frequency distribution for each sample plotted on arithmetic probability paper. Median diameter (Mdφ) is the phi-size at which the sample's curve crosses the 50% mark. Graphical standard deviation (σφ = [φ84 - φ16]/2) is calculated using the phi values at 16% (φ16) and 84% (φ84) cumulative percent values.
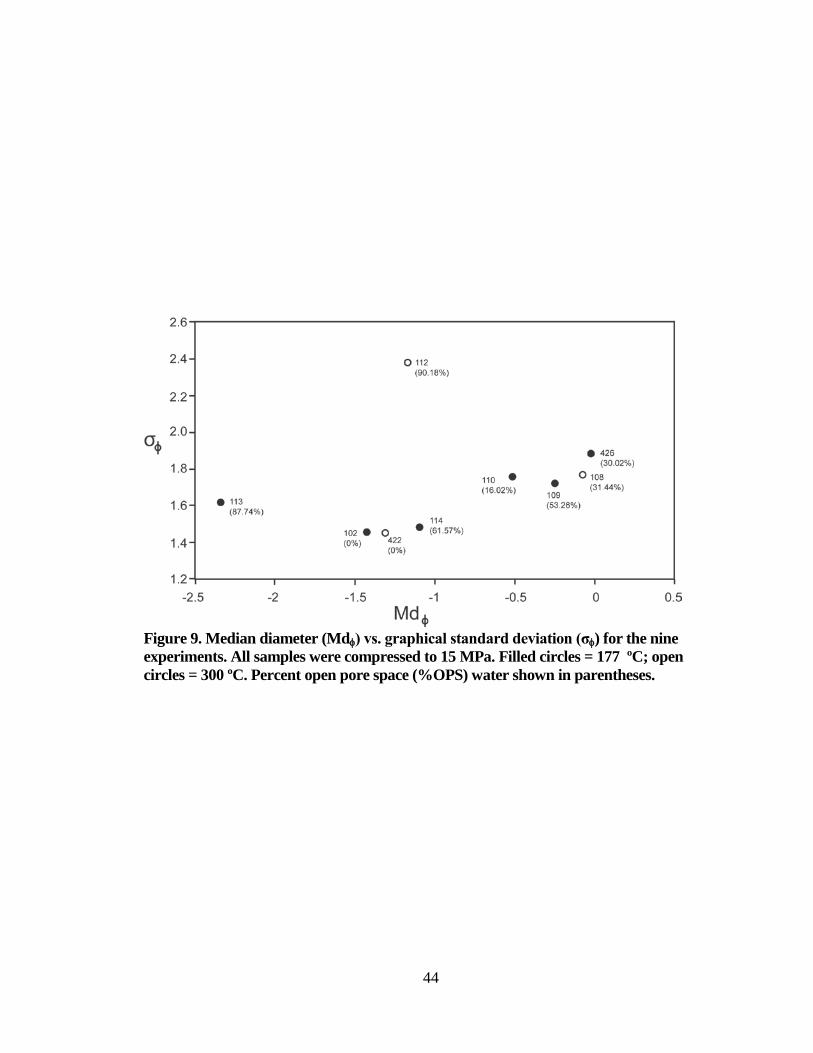
44
Figure 9. Median diameter (Mdφ) vs. graphical standard deviation (σφ) for the nine experiments. All samples were compressed to 15 MPa. Filled circles = 177 ºC; open circles = 300 ºC. Percent open pore space (%OPS) water shown in parentheses.
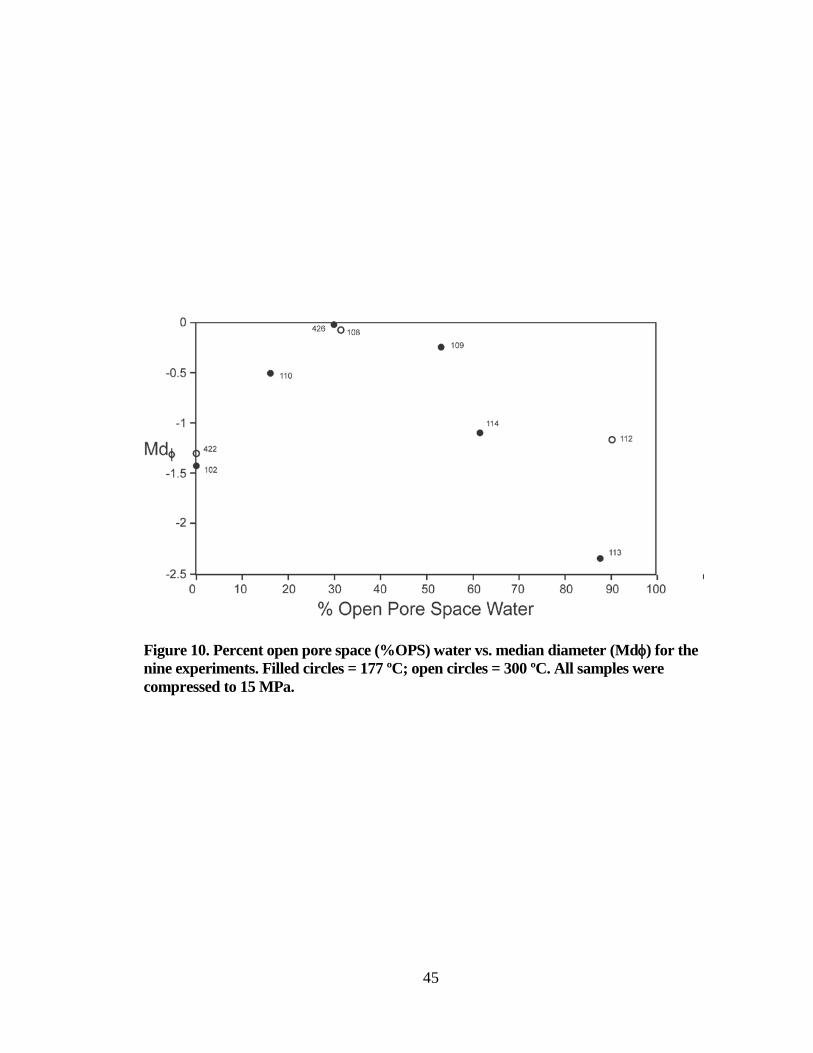
45
Figure 10. Percent open pore space (%OPS) water vs. median diameter (Mdφ) for the nine experiments. Filled circles = 177 ºC; open circles = 300 ºC. All samples were compressed to 15 MPa.
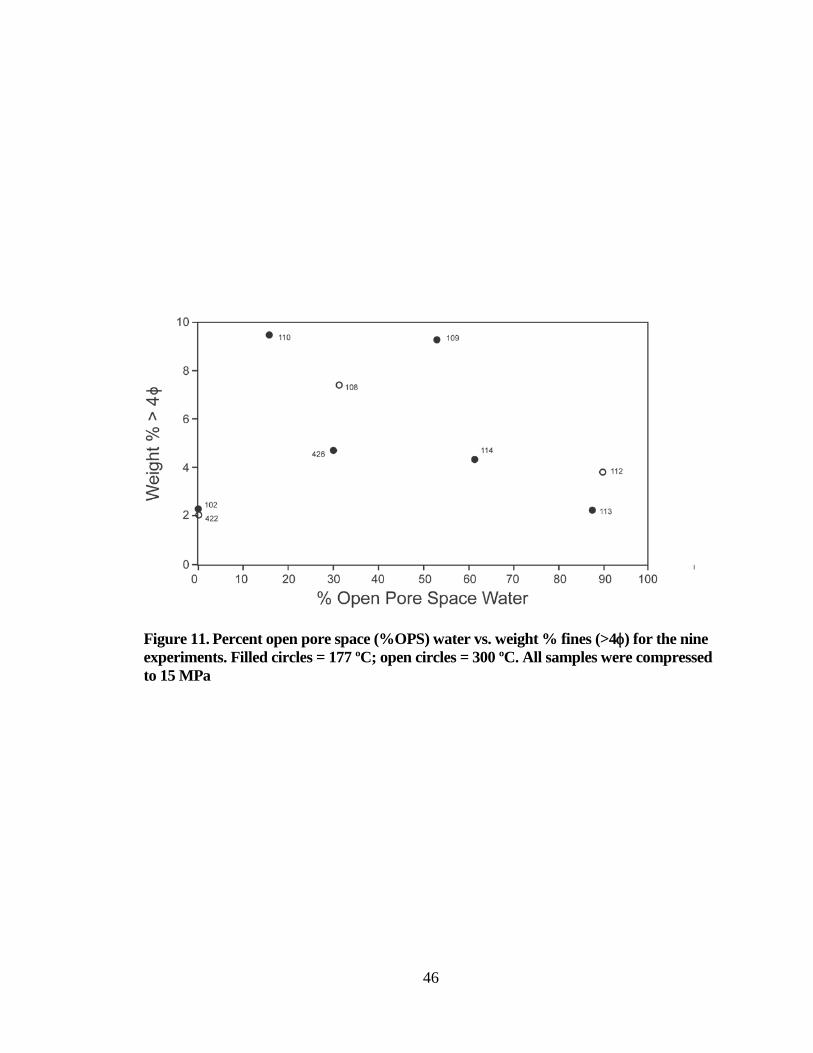
46
Figure 11. Percent open pore space (%OPS) water vs. weight % fines (>4φ) for the nine experiments. Filled circles = 177 ºC; open circles = 300 ºC. All samples were compressed to 15 MPa
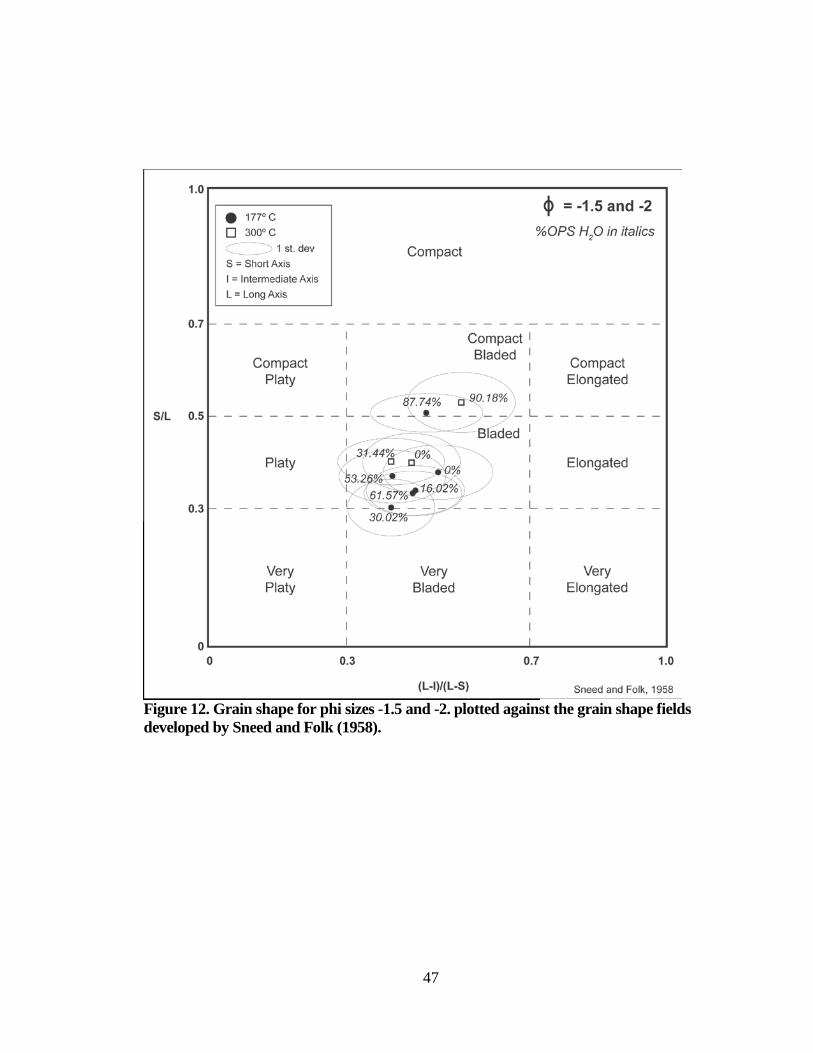
47
Figure 12. Grain shape for phi sizes -1.5 and -2. plotted against the grain shape fields developed by Sneed and Folk (1958).
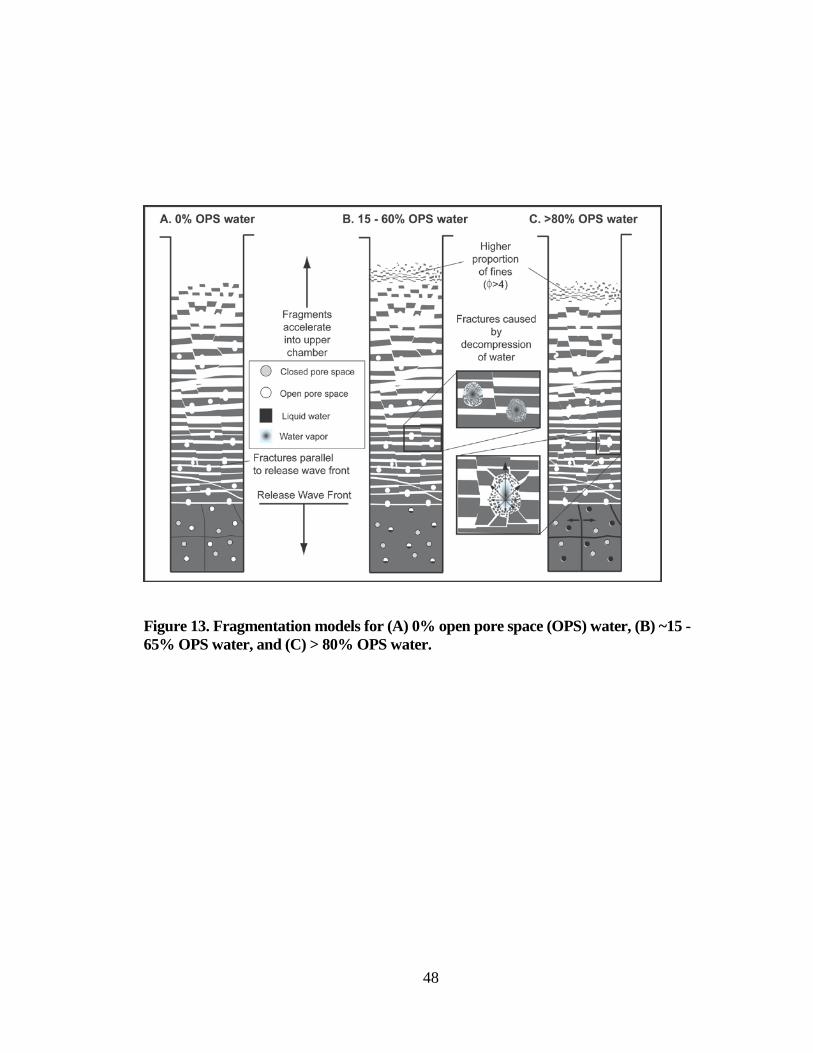
48
Figure 13. Fragmentation models for (A) 0% open pore space (OPS) water, (B) ~15 - 65% OPS water, and (C) > 80% OPS water.
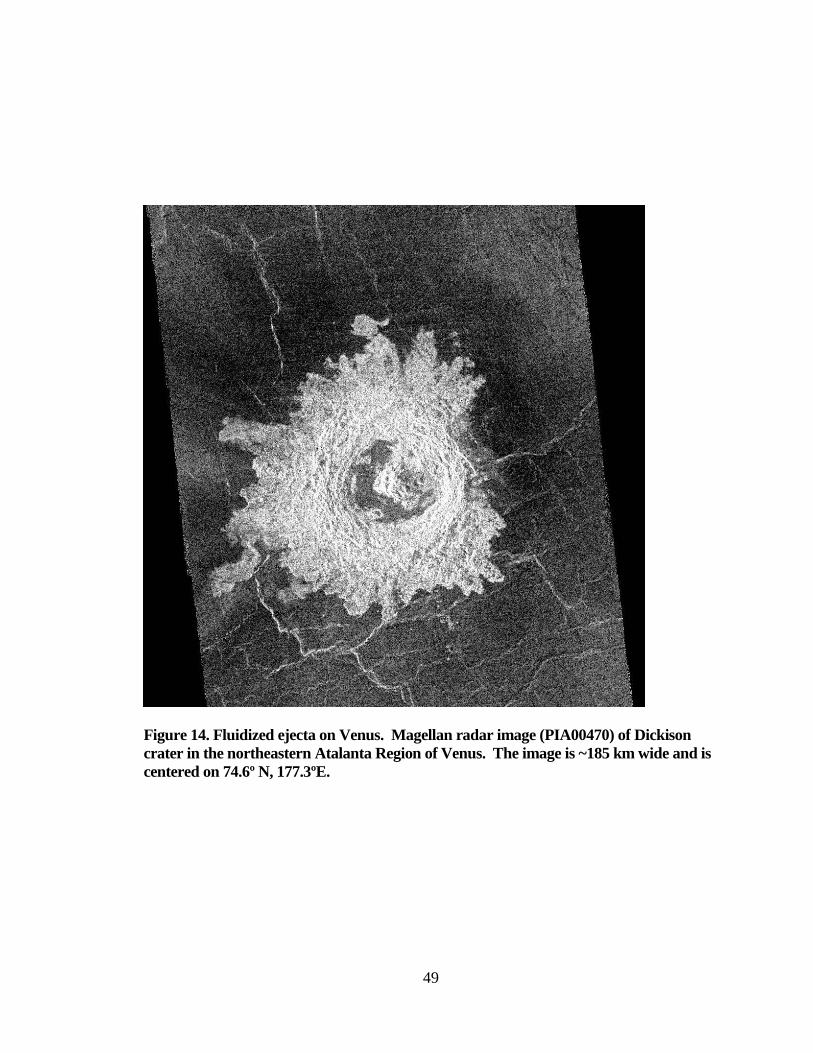
49
Figure 14. Fluidized ejecta on Venus. Magellan radar image (PIA00470) of Dickison crater in the northeastern Atalanta Region of Venus. The image is ~185 km wide and is centered on 74.6º N, 177.3ºE.
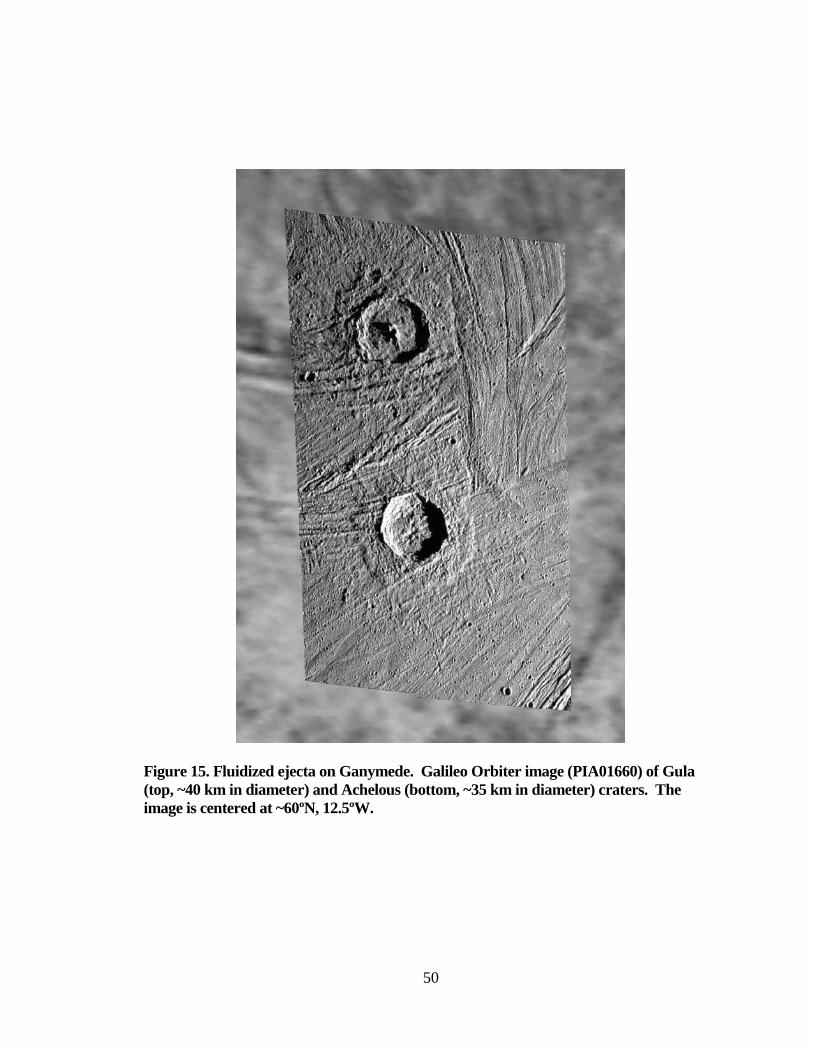
50
Figure 15. Fluidized ejecta on Ganymede. Galileo Orbiter image (PIA01660) of Gula (top, ~40 km in diameter) and Achelous (bottom, ~35 km in diameter) craters. The image is centered at ~60ºN, 12.5ºW.
51
CHAPTER THREE
HOW WATER IN OPEN PORE SPACE AFFECTSTHE
FRAGMENTATION THRESHOLD OF ROCKS:
IMPLICATIONS FOR DOUBLE LAYER
EJECTA FORMATION
Abstract
In chapter two, the effects of water vaporization during rapid decompression on
rock fragmentation were tested. Those experiments showed that expanding water vapor
increases the fragmentation and significantly reduces the median grain size of the target
rock. In this chapter, rock fragmentation is measured when water does not cross the
vaporization curve. Under these conditions, water within open pore space increases the
fragmentation threshold of rocks, shifting the median grain size to larger sizes. This study
complements the hybrid model presented in chapter two by suggesting a mechanism for
the formation of double-layered ejecta (DLE), a common crater ejecta type on Mars. In
this model, the inner layer of DLE is formed when the ejecta curtain contains large blocks
at the base and much finer particles toward the top. This size partitioning is caused by
relatively high (>75% of open pore space filled with water for a sandstone with 28%
open porosity) amounts of water ice in the target that melt during impact cratering. In this
situation, the larger blocks fall out of the ejecta curtain first and produce the inner layer.
A ring vortex is formed where the ejecta curtain becomes permeable to the atmosphere.
This vortex deposits finer grained material behind the advancing ballistic ejecta,
generating the outer ejecta layer. At discrete locations near the base of the ejecta curtain,
some of the larger blocks extend outside the average curtain width. At these points
52
Raleigh-Taylor or Kelvin-Helmholtz instabilities (Chandrasekhar, 1981; Boyce et al.,
2010) form, punching holes in the curtain and forming scouring jets below the ring
vortex. These jets carve out the radial lines in the inner and outer ejecta blanket
Introduction
This section provides a brief summary of Martian rampart craters, fluidized ejecta
morphology, and current models for fluidized ejecta formation. A more detailed
discussion can be found in chapter one, appendix one, and appendix two.
Martian Rampart Craters
Most Martian impact craters are surrounded by fluidized ejecta (89% of 10,651
cataloged craters ≥5 km diameter; Barlow, 2005) that differ from radial ejecta on the
Moon and Mercury (Carr et al, 1977; Barlow, 2005). Barlow (2005) classified three types
of fluidized ejecta (Figure 1): (1) single layer ejecta (SLE), (2) double layer ejecta (DLE),
and (3) multiple layer ejecta (MLE). Fluidized ejecta hug topography and terminate in a
distal rampart about 1.5 to 2 crater radii from the crater rim (Figure 1; Barlow, 2005;
Garvin et al., 2000, 2003; Melosh, 1989). Secondary craters are rare within the fluidized
ejecta (Barlow, 2003a, 2003b, and 2005) blanket for SLE, DLE, and MLE. Beyond the
rampart, secondary craters extend many crater radii beyond the edge of the blanket
(Barlow, 2005).
DLE craters have several features which distinguish them from SLE and MLE
and may indicate a slightly different emplacement mechanism (Boyce and Mouginis-
Mark, 2006; Boyce et al., 2010). DLE craters have two layers with an outer ejecta layer
that looks very much like an SLE layer (Boyce and Mouginis-Mark, 2006; Boyce et al.,
53
2010). The inner layer however, has a more rounded, less sinuous rampart and a convex
topographic profile. THEMIS and HiRISE images show that the rampart of the inner
DLE layer is made of larger blocks than the outer layer (Boyce and Mouginis-Mark,
2006; Boyce et al., 2010). Another distinctive feature of DLE craters is the presence of
radial grooves that extend from the crater rim to the distal rampart of the outer ejecta
layer (Barlow, 2005; Boyce and Mouginis-Mark, 2006; Barlow, 2010; Boyce et al.,
2010).
Fluidized Ejecta Formation
Barlow (2005) suggested that fluidized ejecta are produced by some combination
of the atmospheric model and subsurface volatile model. This dissertation presents a
hybrid model in which that atmospheric (Schultz and Gault, 1979; Schultz, 1992a and
1992b; Barnouin-Jha and Schultz, 1998; Barnouin-Jha et al., 1999a, 1999b) and
subsurface volatile (Baratoux et al, 2002a and 2002b; Barlow, 2005; Carr et al., 1977;
Greeley et al., 1980; Greeley et al., 1982, Mouginis-Mark, 1987; Stewart et al., 2001;
Wohletz and Sheridan, 1983) models are two end-members of fluidized ejecta
emplacement. Fluidized ejecta on Venus are an example of the purely atmospheric end-
member; Ganymede represents the subsurface volatile end-member. The previous chapter
proposed that the vaporization of water during the excavation stage of impact cratering
increases ejecta fragmentation which results in decreased ejecta sizes. The result is
smaller ejecta particles which are able to interact with the thin Martian atmosphere in a
manner described by Schultz (1992a and 1992b), Barnouin-Jha and Schultz (1998), and
Barnouin-Jha et al. (1999a and 1999b) to produce fluidized ejecta. These results were
used to develop a model for the formation of SLE and MLE.
54
This study looks at the effects of water content on rock fragmentation when the
vaporization curve for water is not crossed. Results show that when the vaporization
curve is not crossed during decompression (15 MPa, 50 ºC) the fragmentation threshold
is increased due to a decrease in open porosity. This is probably true only in situations
where the water is confined in open pore space in a rock that has relatively low
permeability preventing the liquid water from moving through the rock easily. Because
ejection angle is inversely proportional to material strength, this increase in strength may
result in larger blocks of ejecta being ejected at lower angles in regions where the
vaporization curve is not crossed.
Summary
Boyce and Mouginis-Mark (2006) and Boyce et al., (2010), point to the
distinctive morphology of Martian DLE craters as an indication that the process that
forms these craters is distinctive from SLE and MLE craters.
According to Boyce et al., (2010) the existence of fluidized ejecta craters on
Ganymede suggests that an atmosphere is not required to produce fluidized ejecta.
However, the existence of fluidized ejecta on Venus, a planet with a very thick
atmosphere and no subsurface volatiles, can be pointed to as evidence that subsurface
volatiles are not required to produce fluidized ejecta. It should also be noted that other icy
satellites lack fluidized ejecta. This suggests that fluidized ejecta emplacement is a
complex process that may not be easily explained by a single mechanism.
Experiments reported in this chapter show that DLE craters form in situations
where the target contains a relatively large amount of water and most of the water does
not cross the vaporization curve. This situation results in ejecta consisting of more larger
55
blocks and more fine-grained particles. The increase in larger blocks at the base of the
ejecta curtain results in places in the curtain where some larger blocks extend outside the
average ejecta curtain width Raleigh-Taylor or Kelvin-Helmholtz instabilities
(Chandrasekhar, 1981; Boyce et al., 2010) may form at these locations, creating jets
beneath the ring vortex. These jets do not form a vortex ring. They are closer to the
ground than the vortex ring and travel behind it, and scour the surface. When the larger
blocks fall out of the ejecta curtain, these jets persist behind the ring vortex and continue
producing the scouring pattern to the end of the outer DLE layer.
When the vaporization curve is crossed during decompression (15 MPa, 177 ºC or
300 ºC) the grain-size distribution shifts to smaller size with increased water. For the
northern Eldorado Mountains sandstone samples, the degree of fragmentation peaked at
around 30% OPS H2O. With increased amounts of water (>~75%) the grain size
distribution is similar to control samples where no water is present in the open pore space
but is more uniform with a higher proportion of fines and larger blocks and grain shape is
blockier. This indicates that the expansion of water during vaporization may be creating
fractures perpendicular to the release wave front.
Methods
Using the shock tube apparatus at the University of Munich fragmentation
experiments were run on rock-water mixtures. In these experiments, the system does not
cross the vaporization curve for water. This section describes the fragmentation methods,
sample preparation, sample recovery and sieving, and data analysis.
56
The shock tube apparatus at the University of Munich is described in detailed in
Alidibirov and Dingwell (1996a). It consists of a lower chamber that can be pressurized
up to 40 MPa with Ar gas (Figure 5). This lower chamber, which is at room temperature
and pressure, is separated from the upper chamber by a series of metal diaphragms.
These diaphragms, made of copper or aluminum, vary in thickness and are inscribed with
a ring and cross pattern that cut into the diaphragm at various depths. The lower chamber
can be pressurized up to 50 MPa. The combinations of diaphragm material (Cu or Al),
thickness, and imprint depth determine the pressure at which the diaphragm will open.
When the diaphragm breaks cleanly, a shock wave propagates through the lower chamber
as the Ar gas is instantaneously released into the low-pressure, upper chamber. As the
release wave travels down through the sample from top to bottom, the sample is
unloaded. Fractures are created parallel to the release wave front as it passes through the
sample. The fragmented rock particles are accelerated and eject into the upper chamber.
Fragmentation Methods
The original goal of these experiments was to heat the rock samples to 177 ºC and
achieve a fragmentation pressure of 15 MPa to ensure the rock sample crossed the
vaporization curve for water (Figure 16). In order to keep the water in a liquid state, the
samples were initially pressurized to about 10 MPa (Figure 16). The furnace surrounding
the autoclave was then set to 177 ºC and the autoclave was heated for 15 minutes
(Figures 5 and 16). Pressure was increased incrementally approaching 15 MPa to keep
the system from crossing the vaporization curve before failure of the diaphragms. After
15 minutes of heating, additional Ar gas was added to the lower chamber to initiate
failure of the diaphragms. Occasionally, the diaphragms failed before this waiting period
57
was completed. But in all experiments, the system decompressed at about 15 MPa. As
will be discussed in the results section of this chapter, it was later discovered that the
crucible and rock sample did not reach 177 ºC. They only reached 50 ºC. Consequently,
the rock samples did not cross the vaporization curve for water during shock
decompression.
The purpose of this investigation is to measure the fragmentation behavior of
water-bearing rocks during the rapid decompression associated with crater excavation.
Carrying out these experiments requires a rock that is as close as reasonably possible to a
generic regolith composition and structure for Mars. The Martian surface is covered by
sedimentary deposits derived from basalt and andesite (Bandfield et al. 2000; Barlow,
2008; Malin and Edgett, 2000a and 2000b). A volcaniclastic rock from the northern
Eldorado Mountains of southern Nevada, U.S.A. (Anderson, 1971) was used in these
experiments. This is a thinly bedded (1 – 3 mm) volcaniclastic sandstone composed of
olivine, quartz, and occasional small (<3 mm) rock and pumice fragments derived from
mid-Miocene Patsy Mine basalt, dacite, and rhyolite. This rock was chosen for two
reasons. First, it is composed of eroded volcanic rocks similar to Martian regolith.
Second, the rock’s uniform structure and composition make it ideal for use in these
experiments where the physical property of the rock must be consistent for each trial.
Sample Preparation
The rock was cut into 2.5-cm-diameter, 4-cm-long cylindrical samples. The
samples were placed in a 190 °C oven overnight to drive off water from the open pore
space. After cooling in a desiccator, each sample was weighed on an electronic balance.
Masses were recorded in grams. Digital calipers were used to measure length along the
58
axis of the cylinder. Two diameter measurements were made, one at each end of the
cylinder (about 0.5 to 1 cm from the end). The average of these two diameters was used
to calculate the sample volume (Vcalc). Each sample was placed in a helium pycnometer
to determine the volume the sample occupied minus open pore space (Vhc). The percent
of open porosity ([[Vcalc - Vhc ]/ Vcalc] x 100%) was calculated. The sandstone has an
average calculated density of 1.8958 g/cm2 and average measured density of 2.1627
g/cm2, with standard deviations of 0.005 and 0.0053 respectively. The average open
porosity of the samples is 27.4450%, with a standard deviation of 3.3277.
Prior to the experiment, each rock sample was placed in a brass crucible cylinder
open on one end with an interior diameter slightly smaller than the rock sample. This
tight fit facilitates fracture of the sample during decompression by preventing the entire
rock cylinder from ejecting into the upper chamber upon decompression. This was
accomplished by placing the rock sample on the open end of the cylinder and heating the
brass cylinder with a hot air gun causing it to expand slightly while pressing the rock into
the cylinder using a hydraulic press. Each sample in its crucible was stored in an airtight
container until the experiment was conducted (no more than 24 hours). Table 3 contains
descriptions of the physical properties measured for each sample.
To test the effects of water content on rock fragmentation, varying amounts of
water were added to each sample. In the previous chapter, percent open pore space
(%OPS) water contents of approximately 0%, 15%, 30%, 50%, 70%, and 100% OPS
water were tested. In order to fill in gaps between previously run %OPS values, %OPS
Methods for Adding Water to the Sample
59
values of 15.30, 45.84, 59.41, 74.61, and 92.32 were tested in these experiments (Table
3).
To determine the amount of water to add to each sample, (1) the volume (ml) of
open pore space for each sample was calculated and (2) the volume (ml) of the target
%OPS water was calculated. The calculated volume of distilled water was added to the
top of the rock sample in the crucible. The sample was placed in a vacuum to draw the
water as evenly as possible through the sample. After a few hours the sample was
inspected to determine whether the top of the rock sample and the bottom (visible
through a small hole) appeared to have about the same degree of wetness. The sample
was weighed to determine if it still had the correct amount of water. More water was
added if necessary. The sample was iteratively inspected and weighed, adding water as
necessary, until the target %OPS water closely approximated. The sample was weighed
immediately prior to placement in the lower chamber of the shock tube apparatus and the
actual %OPS water was recorded (Table 3).
After each experiment, a high-pressure water hose was used to flush the upper
tank. The rock fragments were collected, dried, and sieved between sieve sizes -4 and 4
phi at 0.5-phi intervals. The contents of each sieve were weighed on an electronic balance
and the weight percent of each sieve interval was calculated.
Sieving Methods
A grain size distribution curve was plotted on an arithmetic probability grid for
each sample using GRANPLOT, a Microsoft Excel Spreadsheet developed by Balsillie et
al. (2002). Inman (1952) parameters including (1) median diameter (Mdφ = φ50), the phi-
size where the cumulative distribution curve crosses the 50% mark; (2) graphical standard
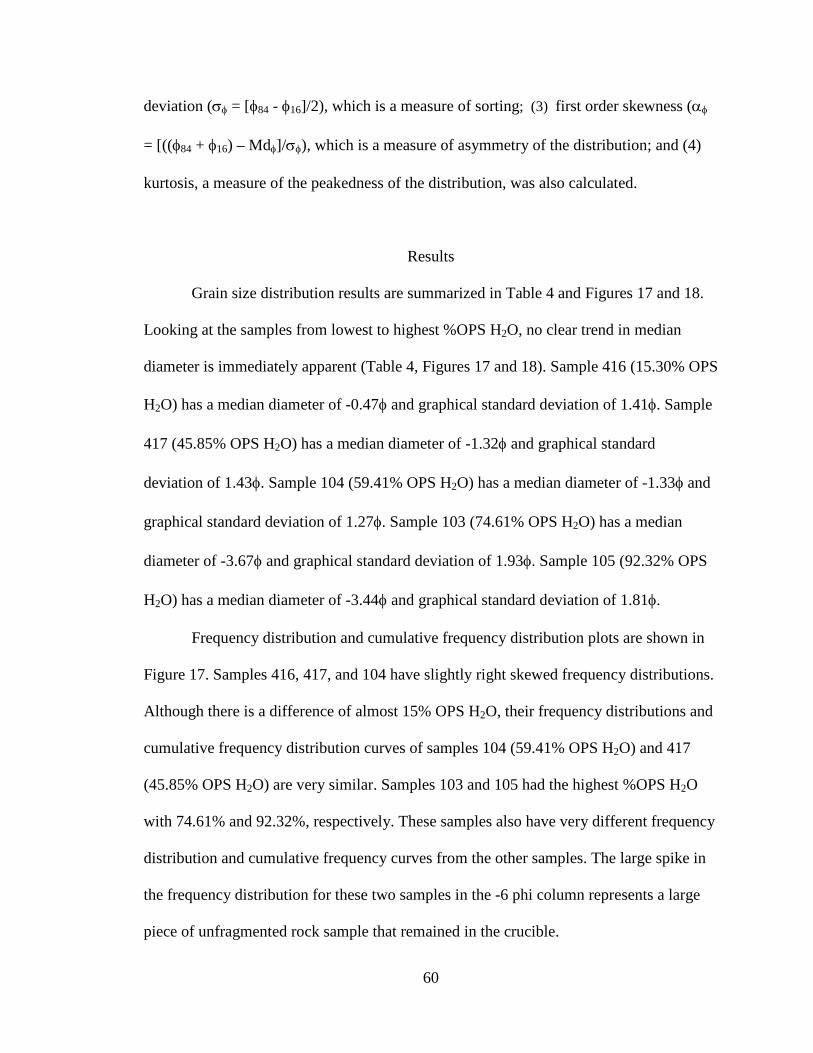
60
deviation (σφ = [φ84 - φ16]/2), which is a measure of sorting; (3) first order skewness (αφ
= [((φ84 + φ16) – Mdφ]/σφ), which is a measure of asymmetry of the distribution; and (4)
kurtosis, a measure of the peakedness of the distribution, was also calculated.
Results
Grain size distribution results are summarized in Table 4 and Figures 17 and 18.
Looking at the samples from lowest to highest %OPS H2O, no clear trend in median
diameter is immediately apparent (Table 4, Figures 17 and 18). Sample 416 (15.30% OPS
H2O) has a median diameter of -0.47φ and graphical standard deviation of 1.41φ. Sample
417 (45.85% OPS H2O) has a median diameter of -1.32φ and graphical standard
deviation of 1.43φ. Sample 104 (59.41% OPS H2O) has a median diameter of -1.33φ and
graphical standard deviation of 1.27φ. Sample 103 (74.61% OPS H2O) has a median
diameter of -3.67φ and graphical standard deviation of 1.93φ. Sample 105 (92.32% OPS
H2O) has a median diameter of -3.44φ and graphical standard deviation of 1.81φ.
Frequency distribution and cumulative frequency distribution plots are shown in
Figure 17. Samples 416, 417, and 104 have slightly right skewed frequency distributions.
Although there is a difference of almost 15% OPS H2O, their frequency distributions and
cumulative frequency distribution curves of samples 104 (59.41% OPS H2O) and 417
(45.85% OPS H2O) are very similar. Samples 103 and 105 had the highest %OPS H2O
with 74.61% and 92.32%, respectively. These samples also have very different frequency
distribution and cumulative frequency curves from the other samples. The large spike in
the frequency distribution for these two samples in the -6 phi column represents a large
piece of unfragmented rock sample that remained in the crucible.
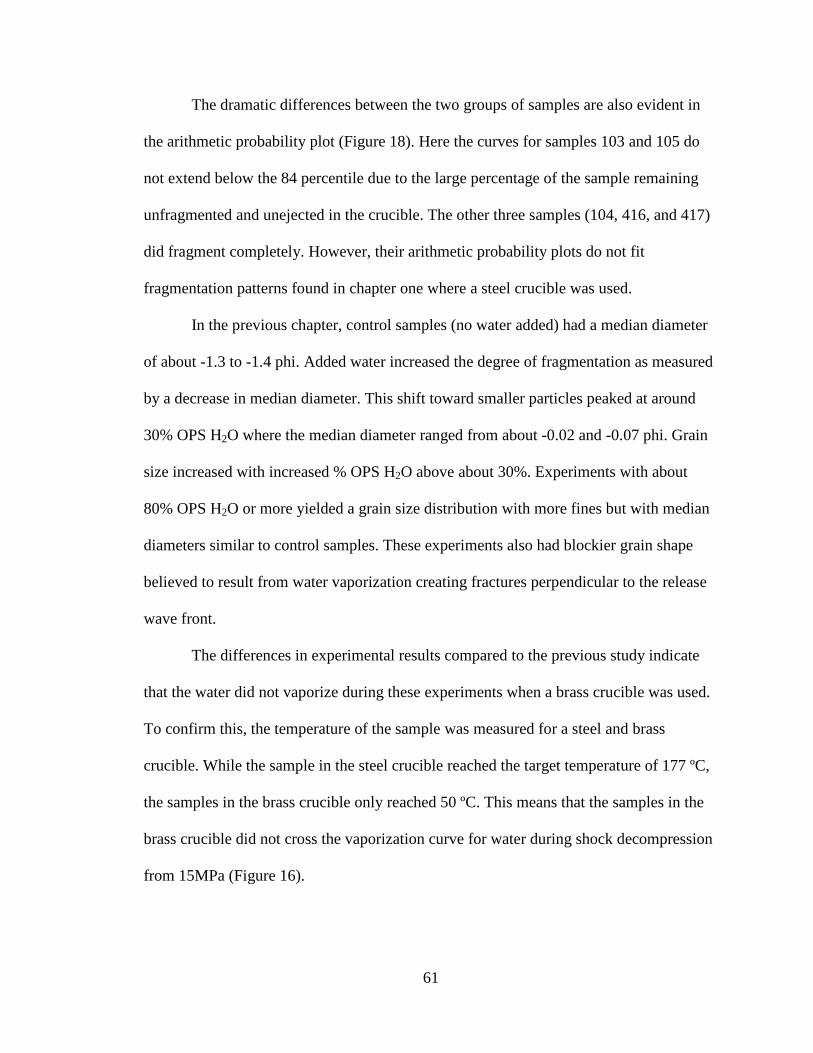
61
The dramatic differences between the two groups of samples are also evident in
the arithmetic probability plot (Figure 18). Here the curves for samples 103 and 105 do
not extend below the 84 percentile due to the large percentage of the sample remaining
unfragmented and unejected in the crucible. The other three samples (104, 416, and 417)
did fragment completely. However, their arithmetic probability plots do not fit
fragmentation patterns found in chapter one where a steel crucible was used.
In the previous chapter, control samples (no water added) had a median diameter
of about -1.3 to -1.4 phi. Added water increased the degree of fragmentation as measured
by a decrease in median diameter. This shift toward smaller particles peaked at around
30% OPS H2O where the median diameter ranged from about -0.02 and -0.07 phi. Grain
size increased with increased % OPS H2O above about 30%. Experiments with about
80% OPS H2O or more yielded a grain size distribution with more fines but with median
diameters similar to control samples. These experiments also had blockier grain shape
believed to result from water vaporization creating fractures perpendicular to the release
wave front.
The differences in experimental results compared to the previous study indicate
that the water did not vaporize during these experiments when a brass crucible was used.
To confirm this, the temperature of the sample was measured for a steel and brass
crucible. While the sample in the steel crucible reached the target temperature of 177 ºC,
the samples in the brass crucible only reached 50 ºC. This means that the samples in the
brass crucible did not cross the vaporization curve for water during shock decompression
from 15MPa (Figure 16).
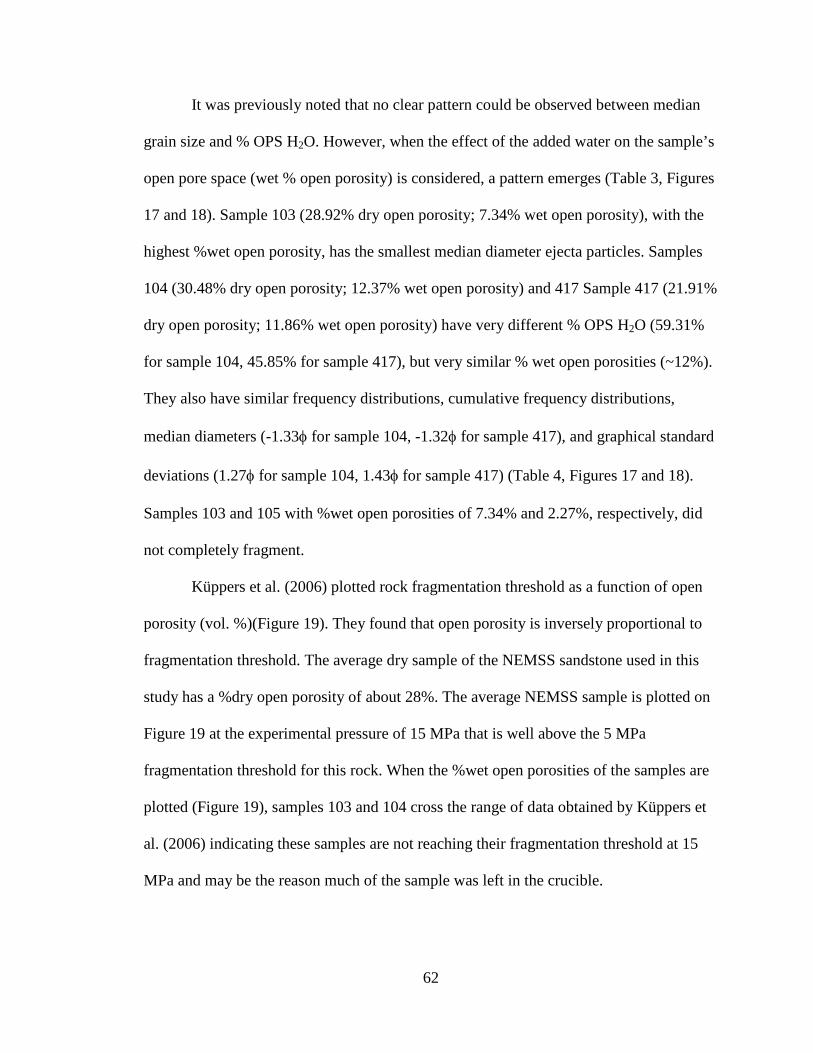
62
It was previously noted that no clear pattern could be observed between median
grain size and % OPS H2O. However, when the effect of the added water on the sample’s
open pore space (wet % open porosity) is considered, a pattern emerges (Table 3, Figures
17 and 18). Sample 103 (28.92% dry open porosity; 7.34% wet open porosity), with the
highest %wet open porosity, has the smallest median diameter ejecta particles. Samples
104 (30.48% dry open porosity; 12.37% wet open porosity) and 417 Sample 417 (21.91%
dry open porosity; 11.86% wet open porosity) have very different % OPS H2O (59.31%
for sample 104, 45.85% for sample 417), but very similar % wet open porosities (~12%).
They also have similar frequency distributions, cumulative frequency distributions,
median diameters (-1.33φ for sample 104, -1.32φ for sample 417), and graphical standard
deviations (1.27φ for sample 104, 1.43φ for sample 417) (Table 4, Figures 17 and 18).
Samples 103 and 105 with %wet open porosities of 7.34% and 2.27%, respectively, did
not completely fragment.
Küppers et al. (2006) plotted rock fragmentation threshold as a function of open
porosity (vol. %)(Figure 19). They found that open porosity is inversely proportional to
fragmentation threshold. The average dry sample of the NEMSS sandstone used in this
study has a %dry open porosity of about 28%. The average NEMSS sample is plotted on
Figure 19 at the experimental pressure of 15 MPa that is well above the 5 MPa
fragmentation threshold for this rock. When the %wet open porosities of the samples are
plotted (Figure 19), samples 103 and 104 cross the range of data obtained by Küppers et
al. (2006) indicating these samples are not reaching their fragmentation threshold at 15
MPa and may be the reason much of the sample was left in the crucible.
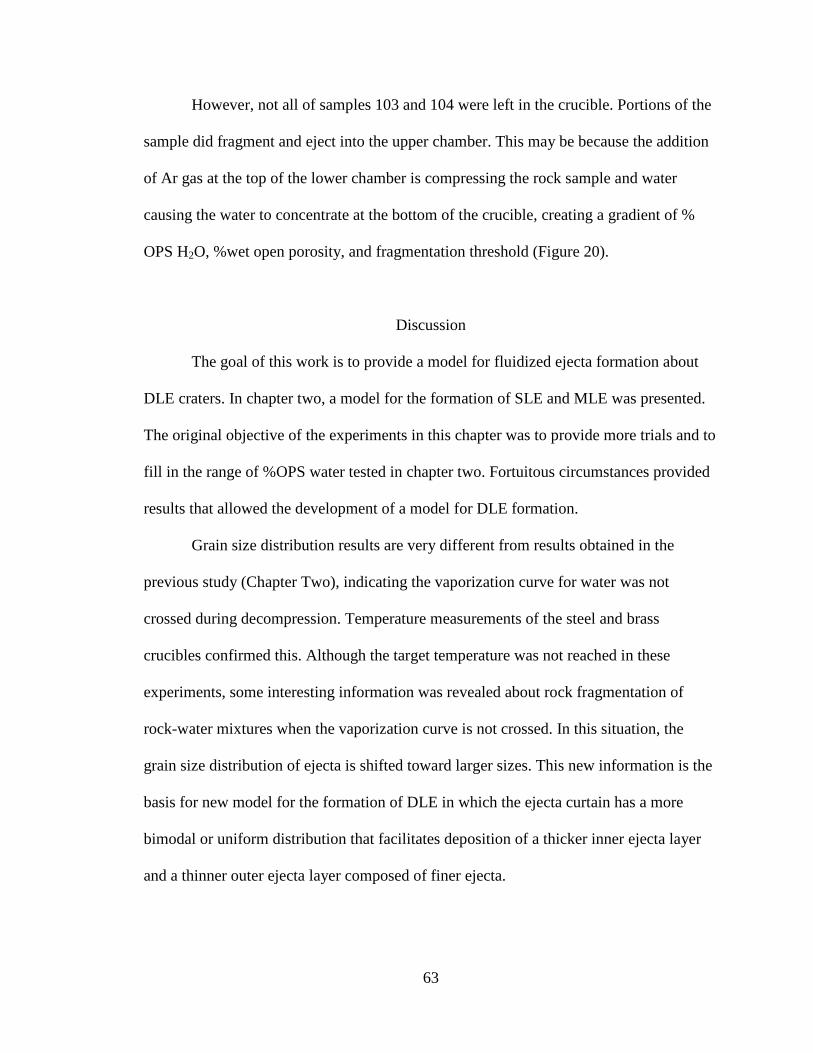
63
However, not all of samples 103 and 104 were left in the crucible. Portions of the
sample did fragment and eject into the upper chamber. This may be because the addition
of Ar gas at the top of the lower chamber is compressing the rock sample and water
causing the water to concentrate at the bottom of the crucible, creating a gradient of %
OPS H2O, %wet open porosity, and fragmentation threshold (Figure 20).
Discussion
The goal of this work is to provide a model for fluidized ejecta formation about
DLE craters. In chapter two, a model for the formation of SLE and MLE was presented.
The original objective of the experiments in this chapter was to provide more trials and to
fill in the range of %OPS water tested in chapter two. Fortuitous circumstances provided
results that allowed the development of a model for DLE formation.
Grain size distribution results are very different from results obtained in the
previous study (Chapter Two), indicating the vaporization curve for water was not
crossed during decompression. Temperature measurements of the steel and brass
crucibles confirmed this. Although the target temperature was not reached in these
experiments, some interesting information was revealed about rock fragmentation of
rock-water mixtures when the vaporization curve is not crossed. In this situation, the
grain size distribution of ejecta is shifted toward larger sizes. This new information is the
basis for new model for the formation of DLE in which the ejecta curtain has a more
bimodal or uniform distribution that facilitates deposition of a thicker inner ejecta layer
and a thinner outer ejecta layer composed of finer ejecta.
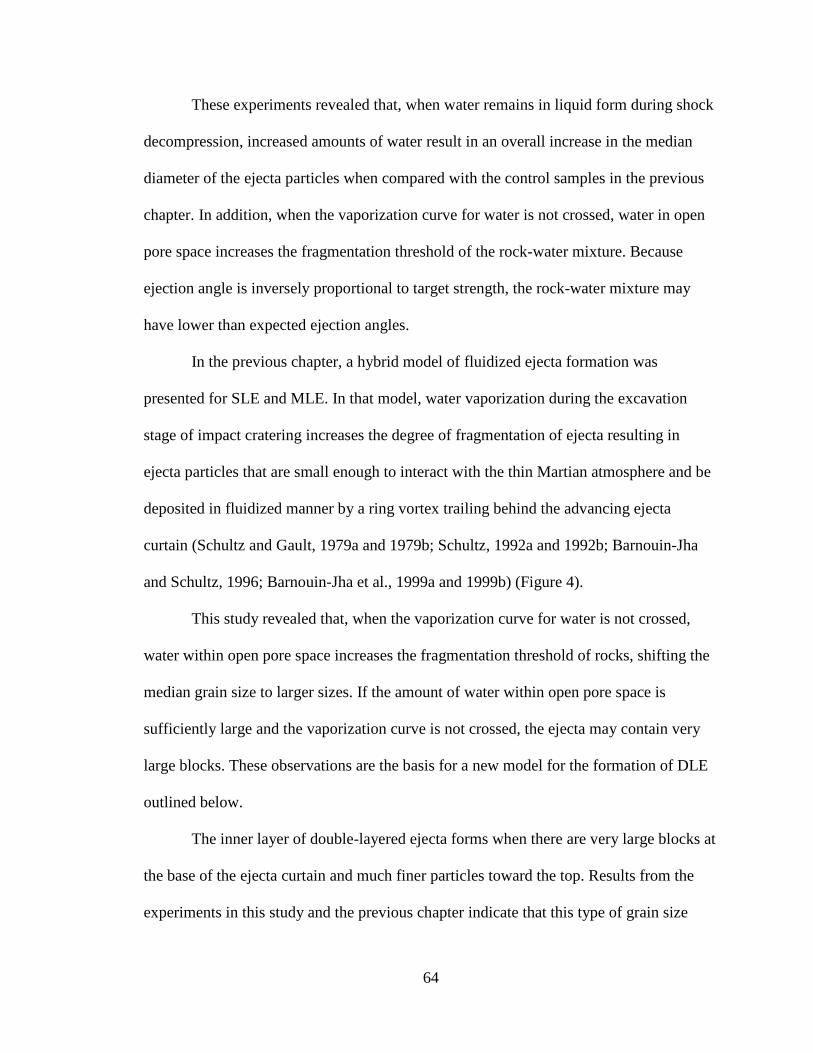
64
These experiments revealed that, when water remains in liquid form during shock
decompression, increased amounts of water result in an overall increase in the median
diameter of the ejecta particles when compared with the control samples in the previous
chapter. In addition, when the vaporization curve for water is not crossed, water in open
pore space increases the fragmentation threshold of the rock-water mixture. Because
ejection angle is inversely proportional to target strength, the rock-water mixture may
have lower than expected ejection angles.
In the previous chapter, a hybrid model of fluidized ejecta formation was
presented for SLE and MLE. In that model, water vaporization during the excavation
stage of impact cratering increases the degree of fragmentation of ejecta resulting in
ejecta particles that are small enough to interact with the thin Martian atmosphere and be
deposited in fluidized manner by a ring vortex trailing behind the advancing ejecta
curtain (Schultz and Gault, 1979a and 1979b; Schultz, 1992a and 1992b; Barnouin-Jha
and Schultz, 1996; Barnouin-Jha et al., 1999a and 1999b) (Figure 4).
This study revealed that, when the vaporization curve for water is not crossed,
water within open pore space increases the fragmentation threshold of rocks, shifting the
median grain size to larger sizes. If the amount of water within open pore space is
sufficiently large and the vaporization curve is not crossed, the ejecta may contain very
large blocks. These observations are the basis for a new model for the formation of DLE
outlined below.
The inner layer of double-layered ejecta forms when there are very large blocks at
the base of the ejecta curtain and much finer particles toward the top. Results from the
experiments in this study and the previous chapter indicate that this type of grain size
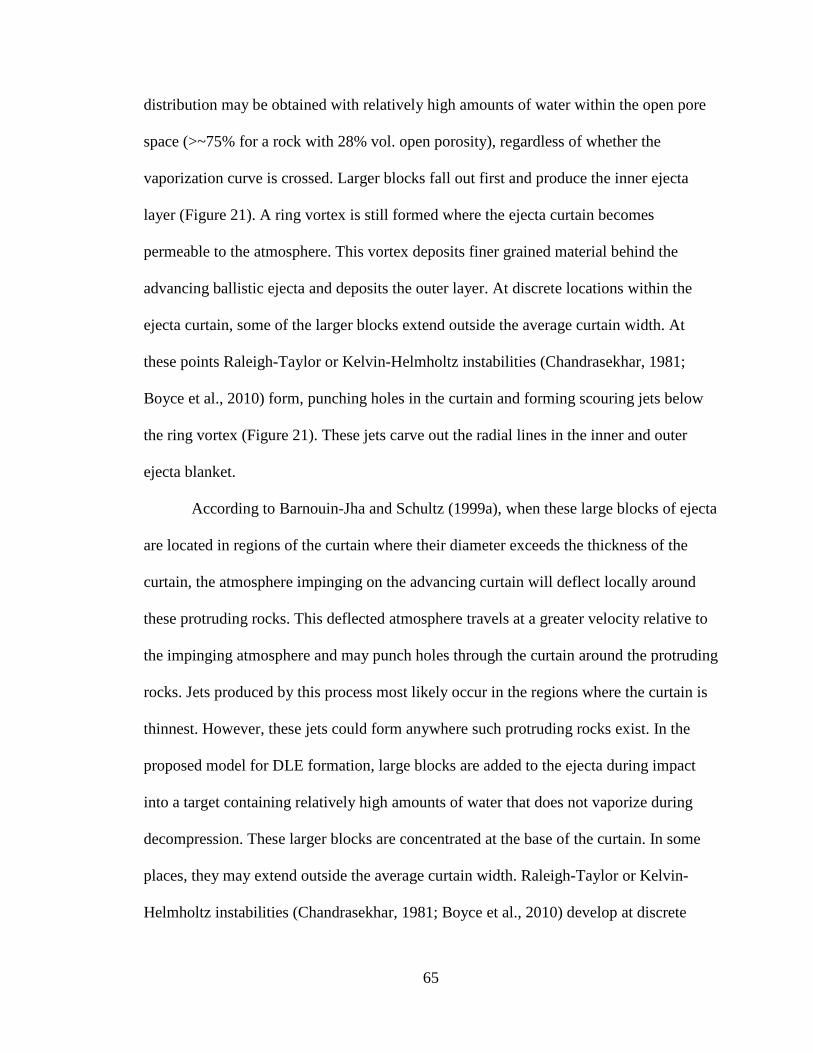
65
distribution may be obtained with relatively high amounts of water within the open pore
space (>~75% for a rock with 28% vol. open porosity), regardless of whether the
vaporization curve is crossed. Larger blocks fall out first and produce the inner ejecta
layer (Figure 21). A ring vortex is still formed where the ejecta curtain becomes
permeable to the atmosphere. This vortex deposits finer grained material behind the
advancing ballistic ejecta and deposits the outer layer. At discrete locations within the
ejecta curtain, some of the larger blocks extend outside the average curtain width. At
these points Raleigh-Taylor or Kelvin-Helmholtz instabilities (Chandrasekhar, 1981;
Boyce et al., 2010) form, punching holes in the curtain and forming scouring jets below
the ring vortex (Figure 21). These jets carve out the radial lines in the inner and outer
ejecta blanket.
According to Barnouin-Jha and Schultz (1999a), when these large blocks of ejecta
are located in regions of the curtain where their diameter exceeds the thickness of the
curtain, the atmosphere impinging on the advancing curtain will deflect locally around
these protruding rocks. This deflected atmosphere travels at a greater velocity relative to
the impinging atmosphere and may punch holes through the curtain around the protruding
rocks. Jets produced by this process most likely occur in the regions where the curtain is
thinnest. However, these jets could form anywhere such protruding rocks exist. In the
proposed model for DLE formation, large blocks are added to the ejecta during impact
into a target containing relatively high amounts of water that does not vaporize during
decompression. These larger blocks are concentrated at the base of the curtain. In some
places, they may extend outside the average curtain width. Raleigh-Taylor or Kelvin-
Helmholtz instabilities (Chandrasekhar, 1981; Boyce et al., 2010) develop at discrete
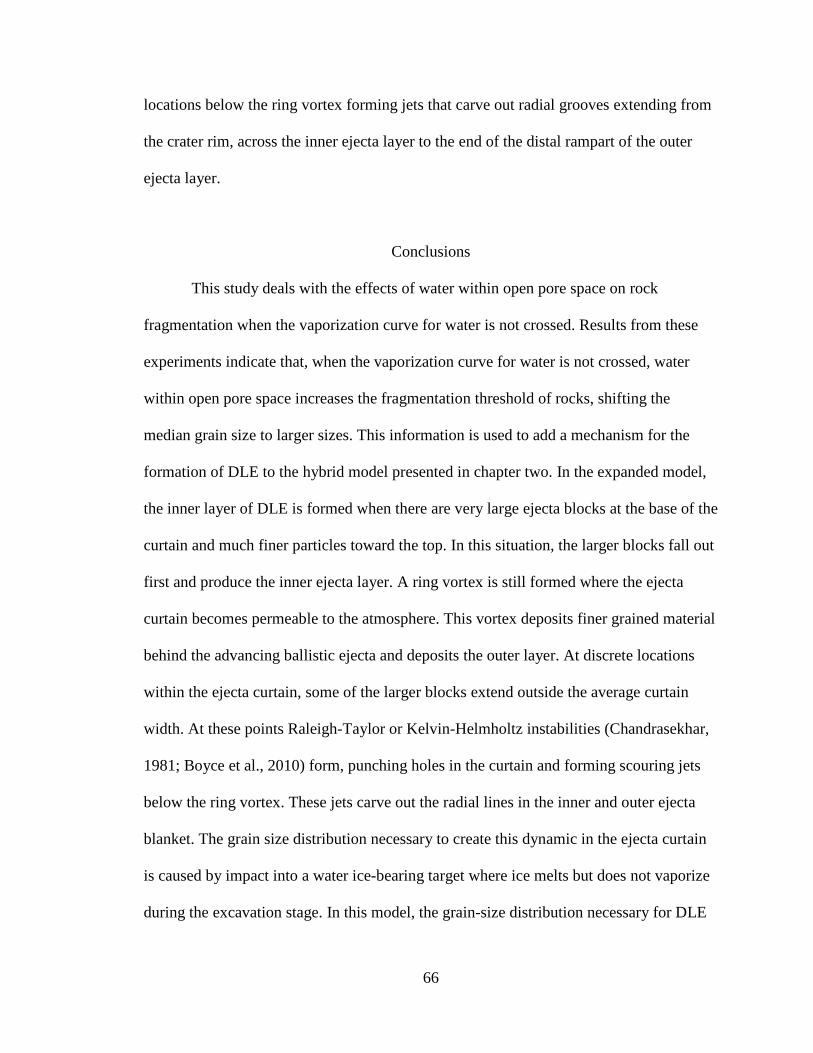
66
locations below the ring vortex forming jets that carve out radial grooves extending from
the crater rim, across the inner ejecta layer to the end of the distal rampart of the outer
ejecta layer.
Conclusions
This study deals with the effects of water within open pore space on rock
fragmentation when the vaporization curve for water is not crossed. Results from these
experiments indicate that, when the vaporization curve for water is not crossed, water
within open pore space increases the fragmentation threshold of rocks, shifting the
median grain size to larger sizes. This information is used to add a mechanism for the
formation of DLE to the hybrid model presented in chapter two. In the expanded model,
the inner layer of DLE is formed when there are very large ejecta blocks at the base of the
curtain and much finer particles toward the top. In this situation, the larger blocks fall out
first and produce the inner ejecta layer. A ring vortex is still formed where the ejecta
curtain becomes permeable to the atmosphere. This vortex deposits finer grained material
behind the advancing ballistic ejecta and deposits the outer layer. At discrete locations
within the ejecta curtain, some of the larger blocks extend outside the average curtain
width. At these points Raleigh-Taylor or Kelvin-Helmholtz instabilities (Chandrasekhar,
1981; Boyce et al., 2010) form, punching holes in the curtain and forming scouring jets
below the ring vortex. These jets carve out the radial lines in the inner and outer ejecta
blanket. The grain size distribution necessary to create this dynamic in the ejecta curtain
is caused by impact into a water ice-bearing target where ice melts but does not vaporize
during the excavation stage. In this model, the grain-size distribution necessary for DLE

67
is produced by impacts into water ice or rock-ice mixtures with high proportions of water
ice. This is consistent with the presence of DLE on Ganymede and at high latitudes on
Mars.
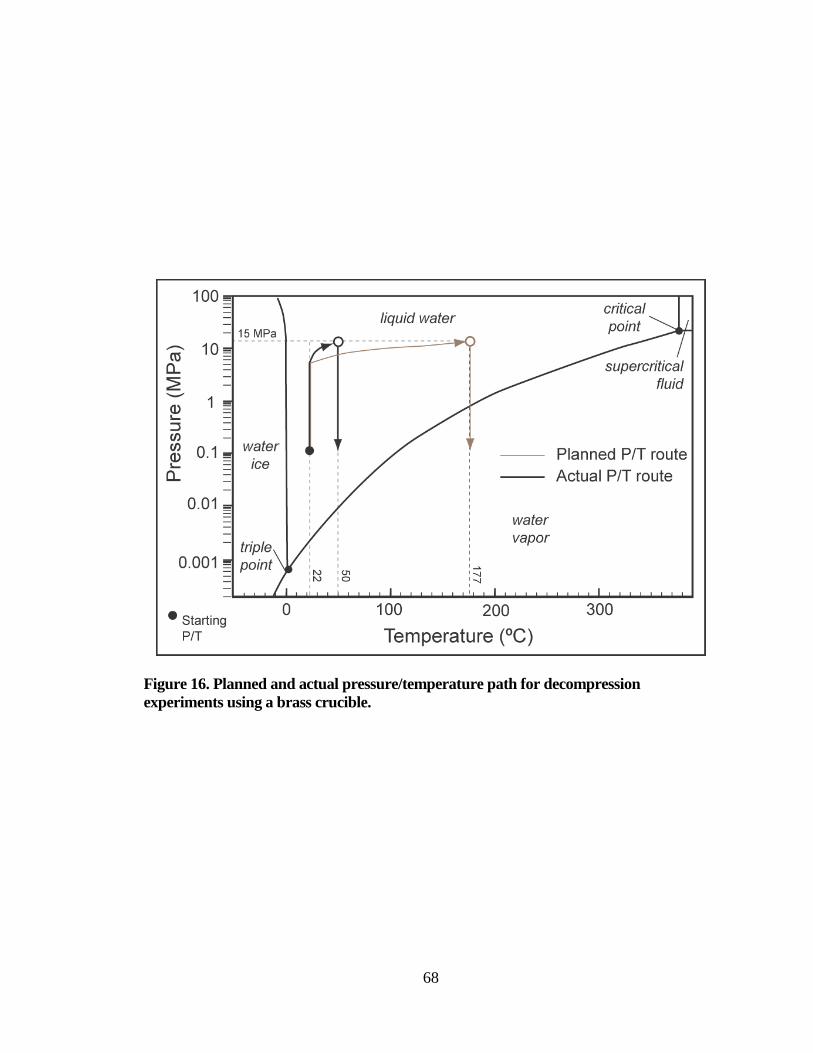
68
Figure 16. Planned and actual pressure/temperature path for decompression experiments using a brass crucible.
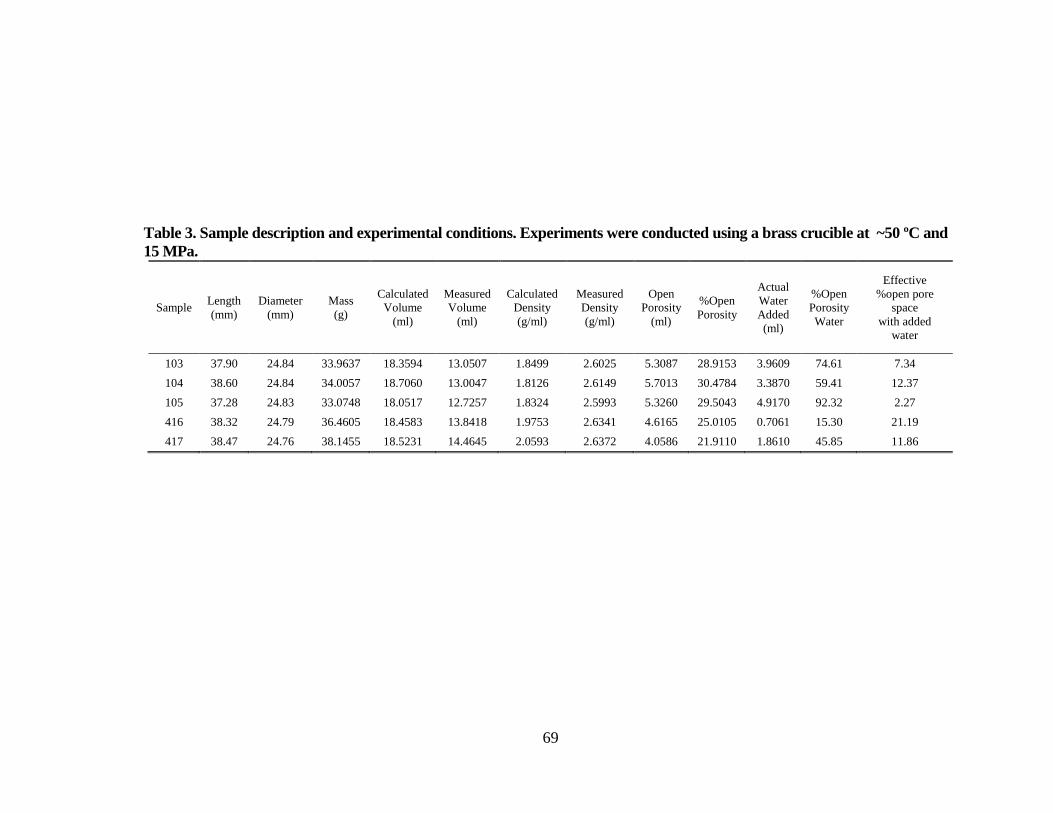
69
Table 3. Sample description and experimental conditions. Experiments were conducted using a brass crucible at ~50 ºC and 15 MPa.
Sample Length (mm)
Diameter (mm)
Mass (g)
Calculated Volume
(ml)
Measured Volume
(ml)
Calculated Density (g/ml)
Measured Density (g/ml)
Open Porosity
(ml)
%Open Porosity
Actual Water Added (ml)
%Open Porosity Water
Effective %open pore
space with added
water
103 37.90 24.84 33.9637 18.3594 13.0507 1.8499 2.6025 5.3087 28.9153 3.9609 74.61 7.34
104 38.60 24.84 34.0057 18.7060 13.0047 1.8126 2.6149 5.7013 30.4784 3.3870 59.41 12.37
105 37.28 24.83 33.0748 18.0517 12.7257 1.8324 2.5993 5.3260 29.5043 4.9170 92.32 2.27
416 38.32 24.79 36.4605 18.4583 13.8418 1.9753 2.6341 4.6165 25.0105 0.7061 15.30 21.19
417 38.47 24.76 38.1455 18.5231 14.4645 2.0593 2.6372 4.0586 21.9110 1.8610 45.85 11.86
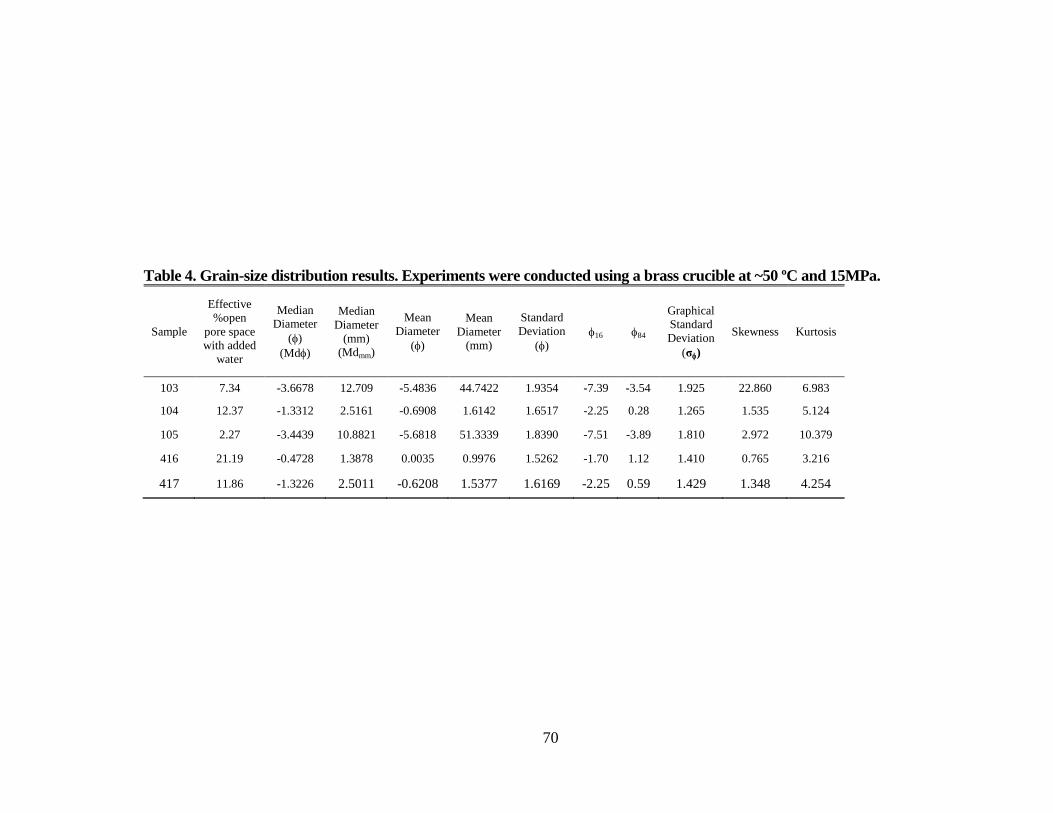
70
Table 4. Grain-size distribution results. Experiments were conducted using a brass crucible at ~50 ºC and 15MPa.
Sample
Effective %open
pore space with added
water
Median Diameter
(φ) (Mdφ)
Median Diameter
(mm) (Mdmm)
Mean Diameter
(φ)
Mean Diameter
(mm)
Standard Deviation
(φ) φ16 φ84
Graphical Standard Deviation
(σφ)
Skewness Kurtosis
103 7.34 -3.6678 12.709 -5.4836 44.7422 1.9354 -7.39 -3.54 1.925 22.860 6.983
104 12.37 -1.3312 2.5161 -0.6908 1.6142 1.6517 -2.25 0.28 1.265 1.535 5.124
105 2.27 -3.4439 10.8821 -5.6818 51.3339 1.8390 -7.51 -3.89 1.810 2.972 10.379
416 21.19 -0.4728 1.3878 0.0035 0.9976 1.5262 -1.70 1.12 1.410 0.765 3.216
417 11.86 -1.3226 2.5011 -0.6208 1.5377 1.6169 -2.25 0.59 1.429 1.348 4.254
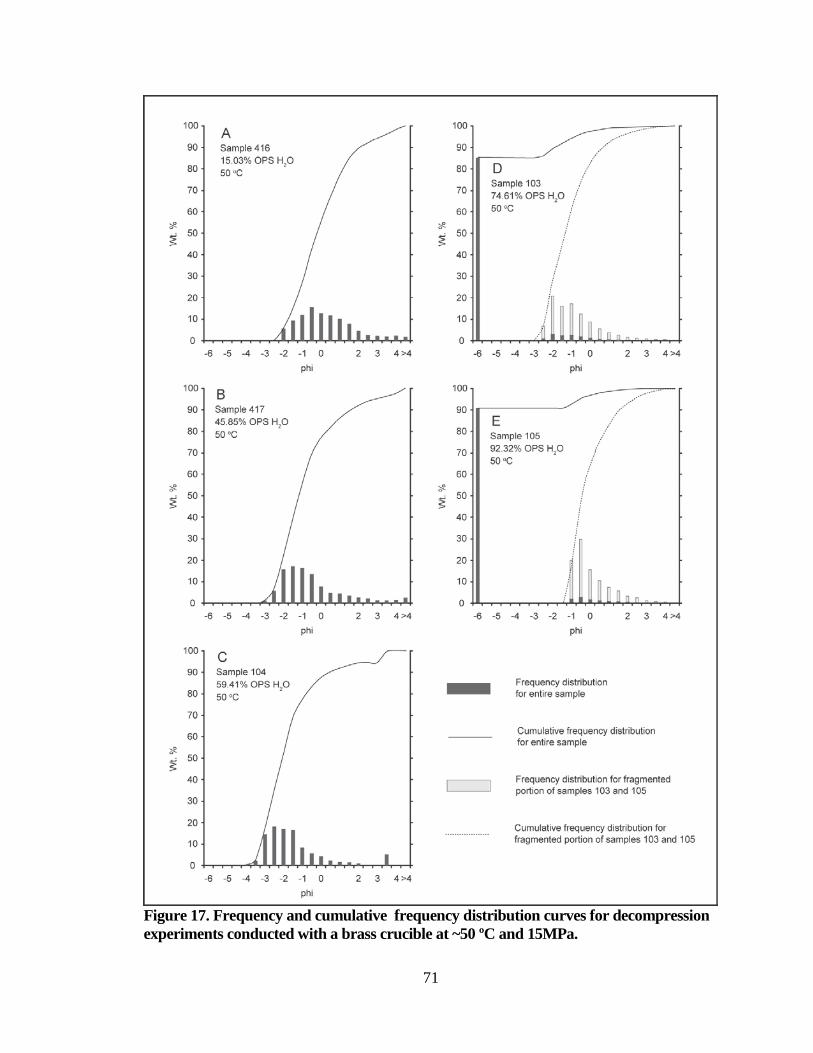
71
Figure 17. Frequency and cumulative frequency distribution curves for decompression experiments conducted with a brass crucible at ~50 ºC and 15MPa.
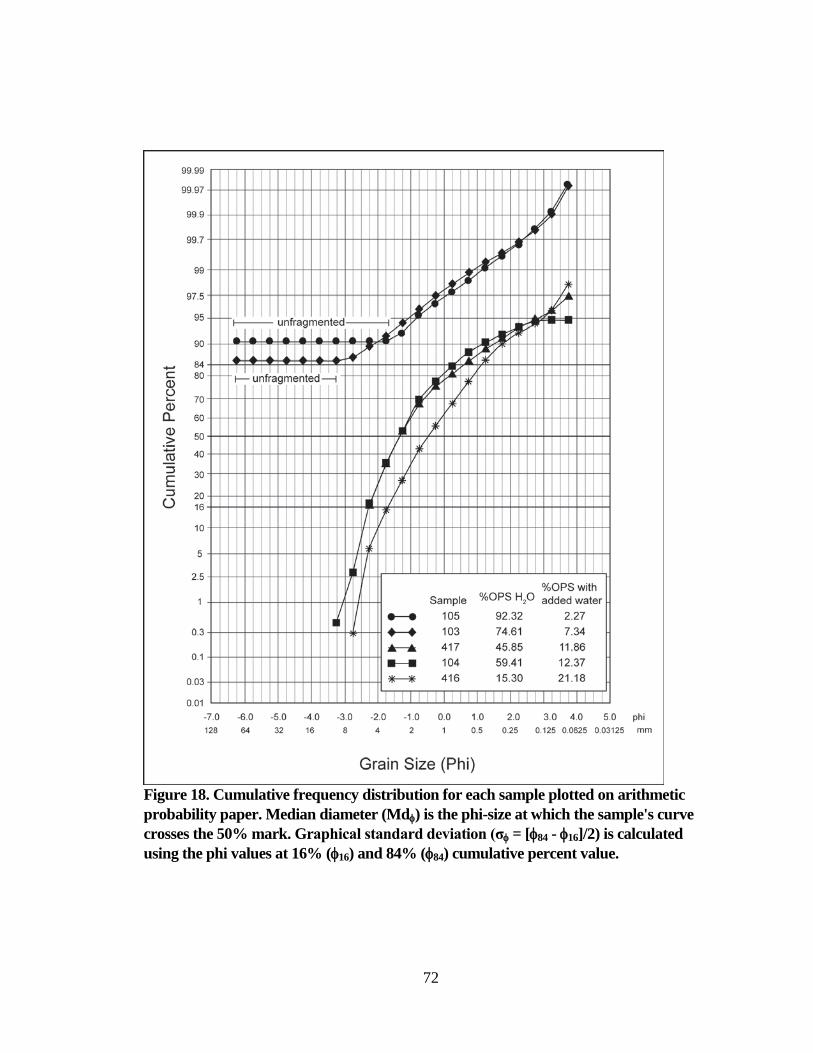
72
Figure 18. Cumulative frequency distribution for each sample plotted on arithmetic probability paper. Median diameter (Mdφ) is the phi-size at which the sample's curve crosses the 50% mark. Graphical standard deviation (σφ = [φ84 - φ16]/2) is calculated using the phi values at 16% (φ16) and 84% (φ84) cumulative percent value.
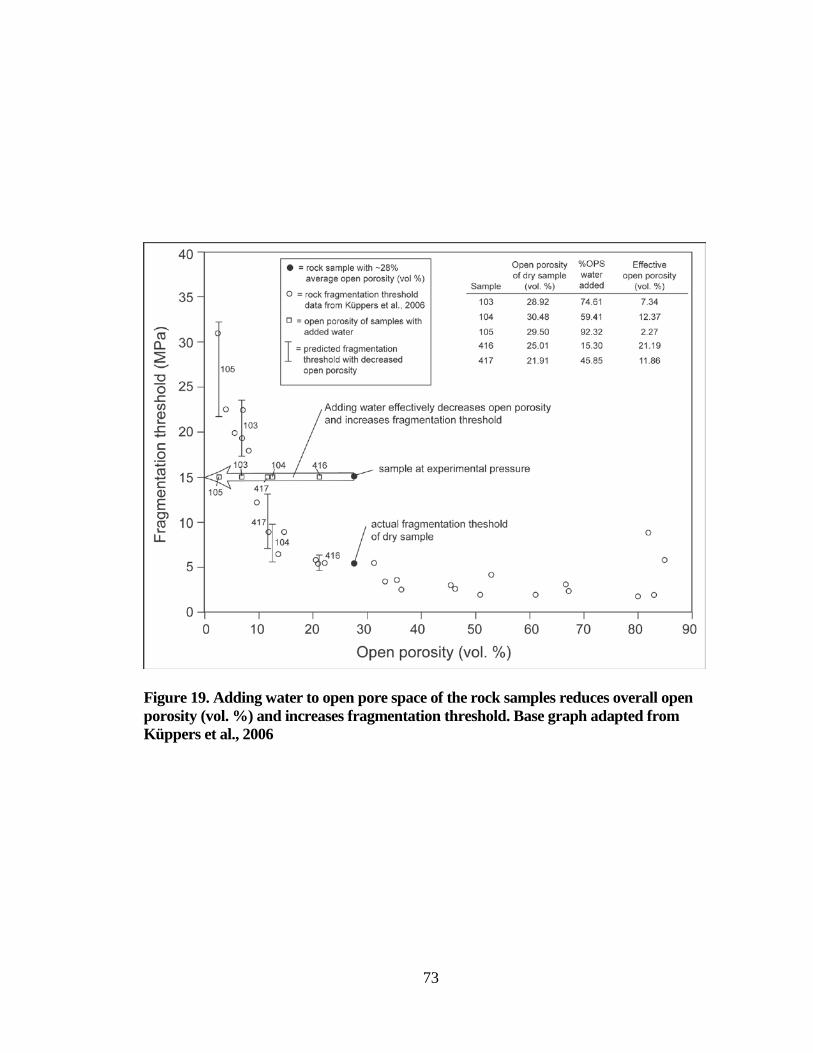
73
Figure 19. Adding water to open pore space of the rock samples reduces overall open porosity (vol. %) and increases fragmentation threshold. Base graph adapted from Küppers et al., 2006
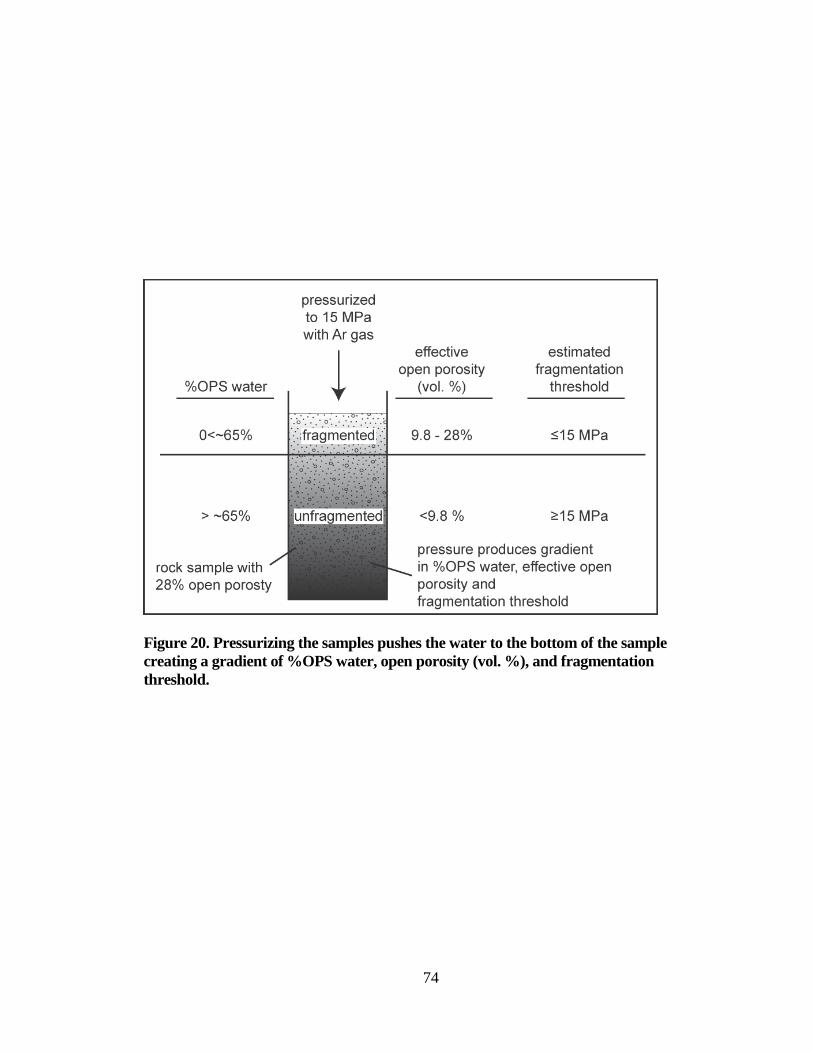
74
Figure 20. Pressurizing the samples pushes the water to the bottom of the sample creating a gradient of %OPS water, open porosity (vol. %), and fragmentation threshold.
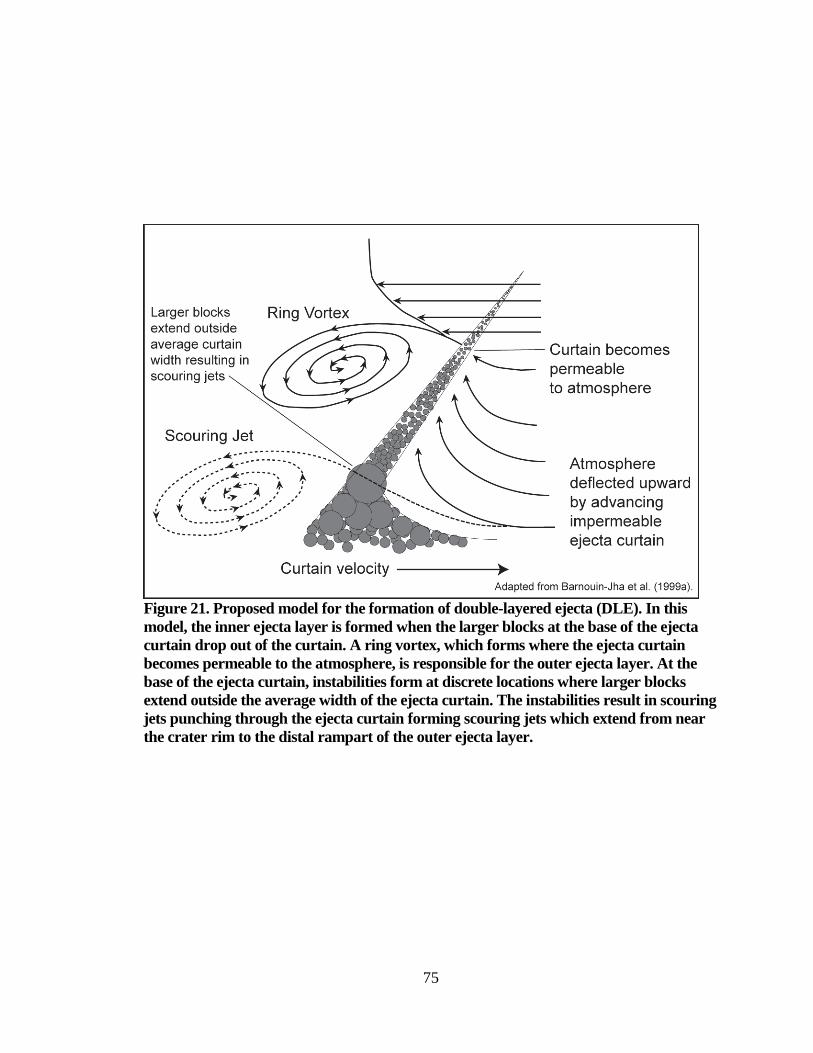
75
Figure 21. Proposed model for the formation of double-layered ejecta (DLE). In this model, the inner ejecta layer is formed when the larger blocks at the base of the ejecta curtain drop out of the curtain. A ring vortex, which forms where the ejecta curtain becomes permeable to the atmosphere, is responsible for the outer ejecta layer. At the base of the ejecta curtain, instabilities form at discrete locations where larger blocks extend outside the average width of the ejecta curtain. The instabilities result in scouring jets punching through the ejecta curtain forming scouring jets which extend from near the crater rim to the distal rampart of the outer ejecta layer.
76
CHAPTER FOUR
SUMMARY AND FUTURE RESEARCH
Introduction
This chapter presents a summary of the significant results from experiments
conducted for this dissertation and how those results fit into the proposed hybrid model
for fluidized ejecta formation. An outline of possible future research is also presented.
Summary
Results
This dissertation involved a study of the effects of water content on rock
fragmentation during rapid decompression using the Shock Tube Laboratory at the
University of Munich. Samples were decompressed from 15 MPa at starting temperatures
that resulted in the sample either (1) crossing the vaporization curve for water (177 ºC
and 300 ºC) or (2) remaining in liquid form upon decompression (50 ºC).
When the vaporization curve is crossed during decompression (15 MPa, 177 ºC or
300 ºC) the grain-size distribution shifts to smaller size with increased water. For the
northern Eldorado Mountains sandstone samples, the degree of fragmentation peaked at
around 30% OPS H2O. With increased amounts of water (>~75%) (1) the grain size
distribution is similar to control samples where no water is present in the open pore space
but is more uniform with a higher proportion of fines and larger blocks and (2) grain
shape is blockier, indicating that the expansion of water during vaporization may be
creating fractures perpendicular to the release wave front.
When the vaporization curve is not crossed during decompression (15 MPa, 50
ºC) the fragmentation threshold is increased due to a decrease in open porosity. This is
77
probably true only in situations where the water is confined in open pore space in a rock
that has relatively low permeability preventing the liquid water from moving through the
rock easily. Because ejection angle is inversely proportional to material strength, this
increase in strength may result in larger blocks of ejecta being ejected at lower angles in
regions where the vaporization curve is not crossed.
Proposed Model
Barlow (2005) suggested that fluidized ejecta are produced by some combination
of the atmospheric model and subsurface volatile model. This dissertation presents a
hybrid model in which that atmospheric and subsurface volatile models are two end-
members of fluidized ejecta emplacement. Fluidized ejecta on Venus are an example of
the purely atmospheric end-member; Ganymede represents the subsurface volatile end-
member.
Schultz (1992a and 1992b) found that fluidized ejecta were produced during his
experiments when either the grain size of the target was lowered or the atmospheric
pressure was increased. The high atmospheric pressure on Venus accounts for the
emplacement of fluidized ejecta on that planet even though it lacks subsurface volatiles.
The atmospheric pressure on Mars is much lower, however subsurface volatiles are
present. Results from studies undertaken in this dissertation suggest that when water
flashes from liquid or ice to vapor during the decompression stage of impact cratering
this explosive expansion increases the degree of fragmentation of the ejecta. Furthermore,
vaporization of water during the excavation stage of impact cratering is the mechanism
that reduces the average grain-size of the ejecta, allowing it to interact with the thin
Martian atmosphere and be deposited by a ring vortex (Schultz and Gault, 1979a and
78
1979b; Schultz, 1992a and 1992b; Barnouin-Jha and Schultz, 1996; Barnouin-Jha et al.,
1999a and 1999b) (Figure 4). The overall decrease in average grain size in the ejecta
curtain lowers the impermeable length of the ejecta curtain, allowing the formation of a
vortex ring that entrains and winnows the smaller ejecta from the curtain, depositing it in
a fluidized fashion.
Experiments indicate that moderate amounts of water (~30% OPS water for a
rock with ~28% open porosity) result in the greatest degree of fragmentation shifting the
grain size distribution of ejecta toward smaller sizes. This increase in the proportion of
fines allows the formation of a vortex ring in which finer particles are entrained and
winnowed from the curtain.
Recent studies suggest that MLE ejecta may not be emplaced in separate multiple
layers (Boyce et al., 2010). Instead, the morphology is created due to Raleigh-Taylor or
Kelvin-Helmholtz instabilities (Chandrasekhar, 1981; Boyce et al., 2010) in the ejecta.
This dissertation proposes that SLE and MLE are formed by a similar mechanism and the
difference in the morphologies is due to these instabilities (Chandrasekhar, 1981; Boyce
et al., 2010) correlated with the larger size of MLE craters and, consequently, larger
amounts of ejecta.
Experiments reported in this chapter show that DLE craters form in situations
where the target contains a relatively large amount of water and most of the water does
not cross the vaporization curve (Figures 17, 18, and 21). This situation results in ejecta
consisting of more larger blocks and more fine-grained particles. The increase in larger
blocks at the base of the ejecta curtain results in places in the curtain where some larger
blocks extend outside the average ejecta curtain width (Figure 21) Raleigh-Taylor or
79
Kelvin-Helmholtz instabilities (Chandrasekhar, 1981; Boyce et al., 2010) may form at
these locations, creating jets beneath the ring vortex (Figure 21). These jets do not form a
vortex ring. They are closer to the ground than the vortex ring and travel behind it, and
scour the surface. When the larger blocks fall out of the ejecta curtain, these jets persist
behind the ring vortex and continue producing the scouring pattern to the end of the outer
DLE layer.
Future Research
This dissertation has potentially opened up a new subdiscipline in impact crater
experimental research. This research marks the first time the fragmentation of rock-water
mixtures due to shock decompression has been studied. This is also the first research to
consider how the variations of grain-size distributions resulting from various rock-water
mixtures may affect the ejecta curtain and its interaction with the atmosphere. Because
this is a new area of research, a lot of questions remain to be answered.
Planned future research includes conducting more experiments on various rock
types, porosities, permeabilities, and water content. High-speed videography and/or
pressure transducers will be used to measure the relationship between water content and
the speed of fragmentation. This work may be applied to planetary surfaces to better
understand distribution of subsurface volatiles and the physical conditions of impacts.
80
REFERENCES CITED
Alidibirov, M. A., and Dingwell, D. B., 1996a, An experimental facility for the
investigation of magma fragmentation by rapid decompression: Bulletin of
Volcanology, v. 58, no. 5, p. 411-416.
Alidibirov, M., and Dingwell, D. B., 1996b, Magma fragmentation by rapid
decompression: Nature (London), v. 380, no. 6570, p. 146-148.
Anderson, R. E., 1971, Thin skin distension in Tertiary rocks of southeastern Nevada:
Geological Society of America Bulletin, v. 82, no. 1, p. 43-58.
Balsillie, J. H., Donoghue, J. F., Butler, K. M., and Koch, J. L., 2002, Plotting equation
for Gaussian percentiles and a spreadsheet program for generating probability
plots: Journal of Sedimentary Research, v. 72, no. 6, p. 929-933.
Bandfield, J.L., Hamilton, V.E., and Christensen, P.R., 2000, A global view of Martian
surface compositions from MGS-TES: Science, v. 287, no. 5458, p. 1626-1630
Baratoux, D., Delacourt, C., and Allemand, P., 2002a, An instability mechanism in the
formation of the Martian lobate craters and the implications for the rheology of
ejecta: Geophysical Research Letters, v. 29, no. 8: p. 51-1 – 51-4.
Baratoux, D., Mangold, N., Delacourt, C., and Allemand, P., 2002b, Evidence of liquid
water in recent debris avalanche on Mars: Geophysical Research Letters, v. 29,
no. 7, p.60-1 – 60-4.
Barlow, N.G., 2003a, Comparison of secondary crater production by Martian and lunar
impact craters: Bulletin of the American Astronomical Society. v. 35, p. 924-925.
81
Barlow, N.G., 2003b, Revision of the “Catalog of Large Martian Impact Craters”: 6th
International Conference on Mars: Houston, Texas, Lunar and Planetary Institute,
Abstract no. 3073.
Barlow, N.G., 2005, A review of Martian impact crater ejecta structures and their
implications for target properties, in Kenkmann, T., Hörz, F., and Deutsch, A.,
eds., Large meteorite impacts III: Geological Society of America Special Paper
384, p. 433-442.
Barlow, 2008, Mars: An introduction to its interior, surface, and atmosphere: Cambridge,
UK, Cambridge University Press, 264 pp.
Barlow, N.G., 2010, What we know about Mars from its impact craters: Geological
Society of America Bulletin, v. 122, no. 5-6, p. 644-657.
Barlow, N.G., and Bradley, T.L., 1990, Martian impact craters; correlations of ejecta and
interior morphologies with diameter, latitude, and terrain: Icarus, v. 87, no. 1, p.
156-179.
Barnouin-Jha, O.S., and Schultz, P.H., 1996, Ejecta entrainment by impact generated ring
vortices: Theory and experiments: Journal of Geophysical Research, v. 101, p.
21,099-21,115.
Barnouin-Jha, O.S., and Schultz, P.H., 1998, Lobateness of impact ejecta deposits from
atmospheric interactions: Journal of Geophysical Research, v. 103, p. 25739-
25756.
Barnouin-Jha, O.S., Schultz, P.H., and Lever, J.H., 1999a, Investigating the interactions
between an atmosphere and an ejecta curtain. 1. Wind tunnel tests: Journal of
Geophysical Research, v. 104, p. 27105-27115.
82
Barnouin-Jha, O.S., Schultz, P.H., and Lever, J.H., 1999b, Investigating the interactions
between an atmosphere and an ejecta curtain. 2. Numerical experiments: Journal
of Geophysical Research, v. 104, p. 27117-27131.
Boyce, J.M., Barlow, N.G., Mouginis-Mark, P.J., and Stewart, S.T., 2008, Ganymede
rampart craters: Their possible implications to the role of subsurface volatiles in
emplacement of Martian layered ejecta: Lunar and Planetary Institute, Abstract
1402.
Boyce, J.M., Barlow, N.G., Mouginis-Mark, P.J., and Stewart, S.T., 2010, Rampart
craters on Ganymede: Their implications for fluidized ejecta emplacement,
Meteoritics and Planetary Science, v. 45, no. 4, p. 638 – 661.
Boyce, J. M., and Mouginis-Mark, P. J., 2006, Martian craters viewed by the Thermal
Emission Imaging System instrument: Double-layered ejecta craters, Journal of
Geophysical Research: Planets, v. 111. p. 1-21.
Carr, M.H., 1996, Water on Mars: New York, Oxford University Press, 229 p.
Carr, M.H., Crumpler, L.S., Cutts, J.A., Greeley, R., Guest, J.E., and Masursky, H., 1977,
Martian impact craters and emplacement of ejecta by surface flow: Journal of
Geophysical Research, v. 82, p. 4055-4065.
Chandrasekhar, S. 1981, Hydrodynamic and Hydromagnetic Stability, Oxford: Clarendon
Press , 704 pp.
Costard, F.M., 1989, The spatial distribution of volatiles in the Martian hydrolithosphere:
Earth, Moon, and Planets, v. 45, p. 265-290.
Costard, F.M., and Kargel, J.S., 1995, Outwash plains and thermokarst on Mars: Icarus,
v. 114, p. 93-112.
83
de Pater, I., Lissauer, J. J., 2001, Planetary Sciences: New York, NY, Cambridge
University Press, 528 pp.
French, B. M., 1998, Traces of catastrophe: A handbook of shock-metamorphic effects in
terrestrial meteorite impact structures, Houston, TX, Lunar and Planetary
Institute, 118 pp.
Garvin, J.B., Sakimoto, S.E.H., Frawley, J.J., and Schnetzler, C., 2000, North polar
region crater forms on Mars: Geometric characteristics from the Mars Orbiter
Laswer Altimeter: Icarus, V. 144, p. 329-352.
Garvin, J.G., Sakimoto, S.E.H., and Frawley, J.J., 2003, Craters on Mars: Global
geometric properties from gridded MOLA topography: 6th International
Conference on Mars: Houston, Texas, Lunar and Planetary Institute, Abstract no.
3277.
Gault, D.E., Shoemaker, E.M., and Moore, H.J., 1963, Spray ejected from the lunar
surface by meteoroid impact: NASA Technical Note, 39 p.
Gault, D.E., 1974, Impact craters in Greeley, R., and Schultz, P., eds. A primer in lunar
geology; comment editionNASA, Ames Research Center, Moffett Field,
California, United States.
Gault, D.E., and Wedekind, J.A., 1978, Experimental studies of oblique impact, in
Proceedings, Lunar and Planetary Science Conference, 9th, Houston, March 1978,
v. 3, no. 9, p. 3843-3875.
Gault, D. D., and Wedekind, J. A., 1979, Experimental results for effects of gravity on
impact crater morphology; Second international colloquium on Mars: NASA
Conference Publication no. 2072, p. 29.
84
Greeley, R., Gault, D.E., Snyder, D.B., Sisson, V., Schultz, P.H., and Guest, P.H., 1979.
Martian multilobed craters; impact cratering simulations: EOS, Transactions,
American Geophysical Union, v. 60, no. 46, p. 873.
Greeley , R., Fink, J., Gault, D.E., Snyder, D.B., Guest, J.E., and Schultz, P.H., 1980,
Impact cratering in viscous targets: Laboratory experiments: Proceedings of the
11th Lunar and Planetary Science Conference: New York, NY, Pergamon Press, p.
2075-2097.
Greeley, R., Fink, J.H., Gault, D.E., and Guest, J.E., 1982, Experimental simulation of
impact cratering on icy satellites, in Morrison, D., eds., Satellites of Jupiter:
Tucson, Arizona, University of Arizona Press, p. 340-378.
Grieve, R.A.F., Dence, M.R., and Robertson, P.B., 1976, Cratering processes as
interpreted from the occurrence of impact melts, in Proceedings, Lunar Science
Institute topical conference, Symposium on planetary cratering mechanics,
Flagstaff, Ariz., United States, Sept. 13-17, 1976, p. 791- 814.
Grieve, R.A.F., and Cintala, M.J., 1981, A method for estimating the initial impact
conditions of terrestrial cratering events, exemplified by its application to Brent
Crater, Ontario, in Proceedings, Lunar and Planetary Science Conference, 12th,
Houston, March 1981, no. 12, Part B, p. 1607-1621.
Grieve, R. A. F., 1991, Terrestrial impact; the record in the rocks: Meteoritics, v. 26, no.
3, p. 175-194.
Head, J. N., Melosh, H.J., and Ivanov, B.A., 2002, Martian meteorite launch: High speed
ejecta from small craters: Science, v. 298, no. 5599, p. 1752-1756.
85
Housen, K.R., Schmidt, R.M., and Holsapple, K.A., 1983, Crater ejecta scaling laws:
Fundamental forms based on dimensional analysis: Journal of Geophysical
Research, v. 88, p. 2485-2499.
Idelchik, I.E., 1994, Handbook of Hydraulic Resistance, Boca Raton, Florida, CRC Press,
790 pp.
Inman, D. L., 1952, Measures for describing the size distribution of sediments: Journal of
Sedimentary Petrology, v. 22, no. 3, p. 125-145.
Küppers, U., Scheu, B., Spieler, O., and Dingwell, D.B., 2006, Fragmentation efficiency
of explosive volcanic eruptions; a study of experimentally generated pyroclasts;
MULTIMO; Multi-parameter monitoring, modeling and forecasting of volcanic
hazard results from a European project: Journal of Volcanology and Geothermal
Research, v. 153 (1-2), p. 125-135.
Kuzmin, R.O., Bobina, N.N., Zabalueva, E.V., and Shashkina, V.P., 1988, Structural
inhomogeneities of the Martian cryosphere: Solar System Research, v. 22, p. 121-
133.
Longhi, J., 2006, Phase equilibrium in the system CO2-H2O Application to Mars: Journal
of Geophysical Research, v. 111, no. E06011, p. 1-16.
Malin, M. C., and Edgett, K.S., 2000a, Evidence for recent groundwater seepage and
surface runoff on Mars: Science. v. 288, no. 5475, p. 2330-2335.
Malin, M. C., and Edgett, K.S., 2000b, Sedimentary rocks of early Mars: Science, v. 290,
no. 5498, p. 1927-1937.
86
Maxwell, D.E., 1977a, Simple Z-model of cratering, ejection and the overturned flap, in
Impact and Explosion Cratering, Roddy, D.J., Pepin, R.O., and Merrill, R.B.,
Pergamon Press, Tarrytown, New York, p. 1003-1008.
Maxwell, D. E., 1977b, Simple Z model of cratering, ejection, and the overturned flap;
Impact and explosion cratering; planetary and terrestrial implications;
Proceedings of the Symposium on planetary cratering mechanics, in Lunar
Science Institute topical conference; Symposium on planetary cratering
mechanics, Flagstaff, Arizona, United States (USA).
Maxwell, D.E., 1977c, Simple Z model of cratering, ejection, and the overturned flap, in
Roddy, D.J., Pepin, R.O., Merrill, R.B., eds., Impact and explosion cratering;
planetary and terrestrial implications; Proceedings of the Symposium on planetary
cratering mechanics, Lunar Science Institute topical conference ; Symposium on
planetary cratering mechanics, Flagstaff, Ariz., United States, Sept. 13-17, 1976,
p. 1003-1008.
McEwen, A., Turtle, E., Burr, D., Milazzo, M., Lanagan, P., Christensen, P., and Boyce,
J., and the THEMIS science team, 2003, Discovery of a large rayed crater on
Mars: Implications for recent volcanic and fluvial activity and the origin of
Martian meteorites: Lunar and Planetary Science XXXIV: Houston, Texas, Lunar
and Planetary Institute, Abstract no. 2040.
McGlaun, J.M., and Thomson, S.L., 1990, CTH: A three dimensional shock wave
physics code: International Journal of Impact Engineering, v. 10, p. 360-361.
Melosh, H. J., 1989, Impact cratering: A geologic process: Oxford, UK, Oxford
Monographs on Geology and Geophysics, v. 11, p. 245.
87
Melosh, H. J. 1984. Impact ejection, spallation, and the origin of meteorites: Icarus v. 59,
no. 2, p. 234-260.
Moore, J.G., 1967, Base surge in recent volcanic eruptions: Bulletin of Volcanology, v.
30, p. 337 – 363.
Mouginis-Mark, P., 1979, Martian fluidized ejecta morphology: Variations with crater
size, latitude, altitude, and target material: Journal of Geophysical Research, v.
84, p. 8011-8022.
Mouginis-Mark, P.J., 1987, Water or ice in the Martian regolith? Clues from rampart
craters seen at very high resolution: Icarus, v. 71, p. 268-286.
O’Keefe, J.D., Stewart, S.T., Lainhart, M.E., and Ahrens, T., 2001, Damage and rock-
volatile mixture effects on impact crater formation: International Journal of
Impact Engineering, v. 26, p. 543-553.
Orphal, D.L., Borden, W.F., Larson, S.A., and Schultz, P.H., 1980, Impact melt
generation and transport: Proceedings of the Lunar and Planetary Science
Conference, XI, p. 2309-2323.
Schultz, P.H., and Gault, D.E., 1979a, Atmospheric effects on Martian ejecta
emplacement: Journal of Geophysical Research, v. 84, p. 7669-7687.
Schultz, P. H., and Gault, D.E., 1979b, Martian impact crater ejecta emplacement:
Second international colloquium on Mars. NASA Conference Publication no.
2072, p. 72.
Schultz, P.H, and Gault, D.E, 1982, Impact ejecta dynamics in an atmosphere:
experimental results and extrapolations, in Silver, L.T., and Schultz, P.H., eds.,
88
Geological implications of impacts of large asteroids and comets on the Earth:
Geological Society of America Special Paper 190, p. 153-174.
Schultz, P.H., 1992a, Atmospheric effects on ejecta emplacement: Journal of
Geophysical Research, v. 97, p. 11623-11662.
Schultz, P.H., 1992b, Atmospheric effects on ejecta emplacement and crater formation on
Venus from Magellan: Journal of Geophysical Research, v. 97, p. 16183-16248.
Senft, L.E., and Stewart, S.T., 2007, Diagnostic features from modeling impact cratering
in icy layered terrains on Mars, in Proceedings, Seventh international conference
on Mars, Pasadena, CA, United States, July 9-13, 2007, Abstract 3309.
Senft, L.E., and Stewart, S.T., 2008, Impact crater formation in icy layered terrains on
Mars: Meteoritics & Planetary Science, v. 43, no. 12, p. 1993-2013.
Senft, L.E., and Stewart, S.T., 2009, The role of phase changes during impact cratering
on icy satellites, in Lunar and Planetary Science XL: Houston, Texas, Lunar and
Planetary Institute, Abstract 2130.
Sneed, E. D., and Folk, R.L, 1958, Pebbles in the lower Colorado River, Texas; a study in
particle morphogenesis: Journal of Geology, v. 66, no. 2, p. 114-150.
Squyres, S. W., Knoll, A. H., Arvidson, R. E., Clark, B. C. Grotzinger, J. P., Jolliff, B. L.,
McLennan, S. M., Tosca, N., Bell III, J. F., Calvin, W. M., Farrand, W. H.,
Glotch, T. D., Golombek, M. P., Herkenhoff, K. E., Johnson, J. R., Klingelhofer,
G., McSween, H. Y., Yen, A. S., 2006, Two years at Meridiani Planum: Results
from the opportunity rover: Science, v. 313, no. 5792, p. 1403- 1407.
Stewart, S.T. and Ahrens, T.J., 2003, Shock Hugoniot of H2O ice: Geophysical Research
Letters, v. 30, no. 6, 1332.
89
Stewart, S. T., Ahrens, T. J., and O'Keefe, J. D, 2003, Impact-induced melting of near-
surface water ice on Mars. in Shock Compression of Condensed Matter-2003, p.
1484-1487, Eds. M.D. Furnish, Y. M. Gupta, and J. W. Forbes, American
Institute of Physics, 2004.
Stewart, S.T., and Ahrens, T.J., 2005, Shock properties of H2O ice: Journal of
Geophysical Research, v. 110, 23 p.
Stewart, S.T., O’Keefe, J.D., and Ahrens, T.J., 2001, The relationship between rampart
crater morphologies and the amount of subsurface ice: Lunar and Planetary
Science XXXII: Houston, Texas Lunar and Planetary Institute, Abstract no. 2092.
Waters, A.C., and Fisher, R.V., 1971, Base surges and their deposits: Capelinhos and
Tall volcanoes: Journal of Geophysical Research, v. 76, p. 5596 – 5614.
Wohletz, K.H., and Sheridan, M.F., 1979, A model of pyroclastic surge: Geological
Society of America Special Paper, 180, p. 177-193.
Wohletz, K.H., and Sheridan, M.F., 1983, Martian rampart crater ejecta: Experiments and
analysis of melt-water interaction: Icarus, v. 56, p. 15-37.
90
APPENDIX 1
IMPACT CRATERING
Introduction
For the reader who is unfamiliar with the impact cratering process, this appendix
provides an overview. Impact cratering stages, morphologies, and factors that affect both
will be discussed.
Impact Cratering Stages
Contact/Compression Stage
The contact/compression stage (Figure 22) begins when the leading edge of a
projectile traveling at hypervelocity speeds (typically 10-40 km s-1 for large meteoroids
on Earth) impacts a target (de Pater and Lissauer 2001, French 1998, Melosh 1989). If the
target is solid, the projectile is stopped in a fraction of a second and penetrates the target
no more than 1 to 2 times its diameter. At this instant, kinetic energy is converted into
two sets of shock waves. One set of shock waves is transmitted forward from the
projectile/target interface into the target rocks while a complementary shock wave is
reflected back into the projectile.
At the impact point, peak shock-wave pressures (Figure 23) may exceed 100 GPa
for typical cosmic encounter velocities (French 1998). The shock waves transmitted into
the target rocks lose energy rapidly as they travel away from the impact point such that
the impact point as surrounded by a series of concentric, roughly hemispheric shock
zones. Each shock zone is distinguished by a certain range of peak shock pressures and
characterized by a unique suite of shock-metamorphic effects produced in the rocks.
91
Farther outward from the impact, pressures of 10 – 50 GPa may exist over
distances of many kilometers from the impact point. Intense pressures near the point of
impact produce total melting and/or vaporization of the projectile and surrounding rock.
At greater distances, peak shock wave pressures drop to 1 to 2 GPa (Figure 23).
This is the approximate location of what will eventually become the crater rim. At this
point, the shock waves become elastic waves or seismic waves. Velocity drops to that of
the speed of sound in the target rocks (5 to 8 km/s). These are low pressure waves,
similar to those generated by earthquakes and volcanic eruptions, which do not produce
any permanent deformation to the rocks through which they pass. They can, however,
produce fracturing, brecciation, faulting, and near-surface landslides which may be
difficult to distinguish from normal geologic processes.
When the shockwave reaches the back of the projectile, it is reflected forward into
the projectile as a rarefaction or tensional wave (also called a release wave). As the
rarefaction wave passes through the projectile from back to front, it unloads the projectile
from the high shock pressures it has experienced. This release results in the virtually
complete melting and vaporization of the projectile.
At the instant the rarefaction wave reaches projectile-target interface, the whole
projectile is unloaded and the release wave continues forward into the target and
continuing to decompress the target as well. The point at which the rarefaction wave
reaches the target marks the end of the contact/compression stage.
The duration of the contact compression stage is determined by the behavior of
the shock wave that is reflected back into the projectile from the projectile/target
interface. After the release wave has reached the projectile/target interface and has
92
unloaded the projectile, the projectile plays no further role in the formation of the impact
crater. The excavation of the crater is carried out by the shock waves expanding through
the target rocks. The vaporized portion of the projectile may expand out of the crater as
part of a vapor plume (Melosh, 1989) and the remainder, virtually all melted, may be
violently mixed into the melted and brecciated target rocks. The contact/compression
stage lasts no more than a few seconds, even for very large projectiles. For most impact
events, the contact compression stage takes less than one second.
Excavation Stage
During the excavation stage (Figure 22), the actual impact crater is opened up by
complex interactions between the expanding shock waves and the original ground surface
(Melosh 1989, Grieve 1991). At the beginning of the excavation stage, the projectile is
surrounded by a roughly hemispherical envelope of shock waves that expand rapidly
through the target rock. The center of this hemisphere actually lies within the original
target rock at a point below the original ground surface.
Within this hemispherical envelope, the shock waves that travel upward and
intersect the original ground surface are reflected downward as rarefactions (release
waves). In a near surface region where the stresses in the rarefaction wave exceed the
mechanical strength of the target rocks, the rarefaction wave is accompanied by
fracturing and shattering of the target rock. The reflection of the shock waves converts
the initial shock-wave energy to kinetic energy, and target material is accelerated
outward, usually as individual fragments traveling at high velocities.
The complex processes of the excavation stage push the target materials outward
from the impact point, producing a symmetric excavation flow around the center of the
93
developing crater. Exact flow directions vary with location within the target rocks. Most
target material from the upper levels moves downward and outward, quickly producing a
bowl-shaped depression (transient cavity or transient crater) in the target (Maxwell,
1977a,1977b, and 1977c; Grieve et al., 1976; Grieve and Cintala, 1981; and Melosh,
1989)
The growth of the transient crater ceases when the shock and release waves can
no longer excavate or displace the target rock. At this point, the excavation stage ends
and the modification stage begins (Melosh 1989).
Modification Stage
The excavation stage ends when the transient crater has grown to its maximum
size, and the subsequent modification stage begins immediately (Figure 22). The
expanding shock waves have now decayed to low-pressure elastic stress waves beyond
the crater rim, and they play no further part in the crater development. Instead, the
transient crater is immediately modified by more conventional geologic processes (e.g.
erosion, faulting). The extent to which the transient crater is modified is a function of its
size and (to a lesser extent) the properties of the target.
Modification of small bowl-shaped craters occurs mainly from collapse of their
upper walls and the final crater is changed very little from the original transient crater. In
larger craters, modification may involve major structural changes including uplift of the
central part of the floor and major peripheral collapse around the rim. Depending on the
extent to which the transient crater is modified, three distinct types of impact structures
can be formed. These crater morphology types (including simple craters, complex craters,
and multiring basins) occur in order of increasing crater size.
94
Crater Morphology
Simple Craters
Simple craters are small (generally less than a few kilometers in diameter) bowl-
shaped craters formed by hypervelocity (speeds exceeding a few kilometers per second)
impacts. The depth (rim to crater floor) of a simple crater is typically about one-fifth of
its diameter. Rim height is about 4% of the crater’s diameter. Variations in depth-to-
diameter ratio occur due to variations in strength of the target and surface gravity (Gault,
1974; Gault and Wedekind, 1979; Greeley, 1979; Melosh, 1989).
In the case of simple craters, the transient crater is modified only by minor
collapse of the steep upper crater wall and by redeposition of a small amount of ejected
material back into the crater. This results in an increase in crater diameter by as much as
20% relative to the transient crater. During modification, the simple crater is immediately
filled, to perhaps half its original depth, by a mixture of redeposited (fallback) ejecta and
debris slumped in from the walls and rim. The material that falls back into the crater is
called the breccia lens or crater-fill breccia. This breccia is a mixture of shocked and
unshocked rock fragments and impact melt fragments (Melosh, 1989).
There is no lower limit to the size of simple craters. However, the upper size limit
is inversely correlated with gravity. The transition from simple to complex crater
morphology occurs at a smaller diameter on Mars than on the Moon. This transition from
simple to complex morphology appears to reflect the onset of gravitational collapse.
Because of their relatively small size, simple craters are quickly eroded or buried on
planets with geologically active surfaces (Melosh, 1989).
95
Simple craters produced by hypervelocity impacts can be differentiated from
craters produced by meteoroids moving at slower speeds on the basis of morphology
(Melosh 1989). The latter tend to have irregular shapes in plan view and have broader,
less well-defined rims than the former. These craters are termed secondary craters
because they form by secondary ejecta thrown out during the excavation stage of large
primary impacts. Secondary craters tend to form in chains or clusters due to their
common, nearly simultaneous origin from a larger hypervelocity impact. There is no
lower limit to the size of simple craters. The upper limit to the size of simple craters is
inversely correlated with gravity (Gault, 1974; Gault and Wedekind, 1979; Greeley,
1979; Melosh, 1989), and thus varies among Solar System bodies.
Complex Craters
Large craters are more complex. They usually have a flat floor, a central peak,
and a terraced inner rim. Complex craters generally have diameters of a few tens up to a
few hundred km. The morphology of small craters is controlled by the strength of the
material, while the morphology of complex craters is controlled by gravity. Thus the
transition diameter between simple and complex craters varies on each Solar System
body.
The transition size between small and larger craters is ~18 km on the Moon and
scales inversely with the gravitational acceleration, gp, although it also depends on the
strength of the target’s surface material. On the Moon, Mars, and Mercury, craters 100 to
300 km in diameter show a concentric ring of peaks, rather than a single central peak.
This inner ring is usually half the crater diameter. The crater size at which the central
peak is replaced by a peak-ring scales in the same way as the transition diameter between
96
small and complex craters (French 1998, Melosh 1989). There are no peak-ring craters on
icy satellites (dePater and Lissauer 2001).
Multiring Basins
Multiring basins have been produced by the impact of projectiles tens to hundreds
of kilometers in diameter, and they date mainly from an early period in the solar system
(>3.9 Ga), when such large objects were more abundant and collisions were more
frequent. Multiring basins are systems of concentric rings, which cover a much larger
area than the complex craters. The inner rings often consist of hills in a rough circle, and
the crater floor may be partly flooded by lava and impact melt. The outer rings more
clearly resemble crater rims.
Multiring basins are typically observed on planets with well-preserved ancient
surfaces, such as the Moon, Mercury, parts of Mars, and some of the moons of Jupiter.
There are numerous large basins (e.g., Caloris Basin, Mercury; Argyre Basin, Mars) in
the solar system that do not display a pronounced multiring structure, possibly because
they have been deeply eroded since they formed.
Factors Affecting Crater Morphology
The size and morphology of impact craters are primarily controlled by: (1) the
kinetic energy of the impact (a function of the size and velocity of the bolide); (2) various
properties of the target such as rock strength, layering, and the presence or absence of
volatiles; and (3) gravity of the target body. Other controls on crater and ejecta blanket
morphology include the angle of the impact and interactions of the bolide and ejected
material with the atmosphere.
97
Kinetic Energy of the Impact
The size of an impact crater is positively correlated with kinetic energy (KE) an
impactor possesses. Kinetic energy is described as:
KE = 1/2(mv2) where m=mass of impactor(kilograms) and v = velocity of bolide (meters/second)
Structure and Composition of Target
Layers of different strength in the target produce concentric craters. Regional joint
trends may result in square or polygonal craters (e.g., Meteor Crater, Arizona, U.S.A.).
Preexisting topography of the target may produce extra-wide terraces in the walls of
complex craters adjacent to topographic highs
Gravity of Target Body
Gravity affects the impact cratering process by influencing (Gault 1974): (a) the
dimensions of the excavation bowl, (b) the extent of the ejecta, and (c) various post-
impact crater modifications. All things being equal, fragmented blocks of ejecta are
excavated more easily on low-gravity planets, resulting in larger craters relative to high-
gravity environments. Under low-gravity conditions, ejecta is thrown farther producing a
thinner ejecta layer extending a greater distance from the crater rim on lower gravity
bodies (e.g., the Moon) compared to higher-gravity bodies (e.g., Mars or Mercury).
During the modification stage, gravity governs the rate of isostatic adjustments,
influencing the degree of slumping and perhaps the magnitude of potential central uplifts.
98
Angle of Impact
The shape of impact craters plan view is controlled by the entry angle of the
incoming bolide. For most impacts, both the crater and the distribution of ejecta are
concentrically symmetrical about the point of impact, because most impacts (>15º entry
angle) involve essentially point-source transfers of energy.
Although common sense might suggest that a bolide contacting a target surface at
any angle other than a right angle would cause elongate craters, experiments have shown
that only for very low angles (<15º) do impact craters become noticeably asymmetrical
(Gault and Wedekind, 1978). These very low angle impacts often produce a butterfly-
shaped ejecta blanket.
Atmosphere
If the target body had a dense atmosphere (e.g., Earth, Venus) impacts may be
modified extensively. Atmospheric drag can slow down a small meteoroid, so that it
merely hits the surface at the terminal velocity producing a non-hypervelocity impact
crater. Larger bodies can explode in the air, never creating an impact crater. Projectiles
may be completely vaporized while plunging through the atmosphere, and never hit the
ground. Or the projectile might break up into many pieces, producing a chain of smaller
impact craters.
Ejecta may interact with a thick atmosphere and small particles may be suspended
in the atmosphere. This may result in particles being deposited over a longer period of
time, perhaps closer to the crater rim. Or the particles may be caught in the stratosphere
and transported greater distances (e.g., Chicxulub).
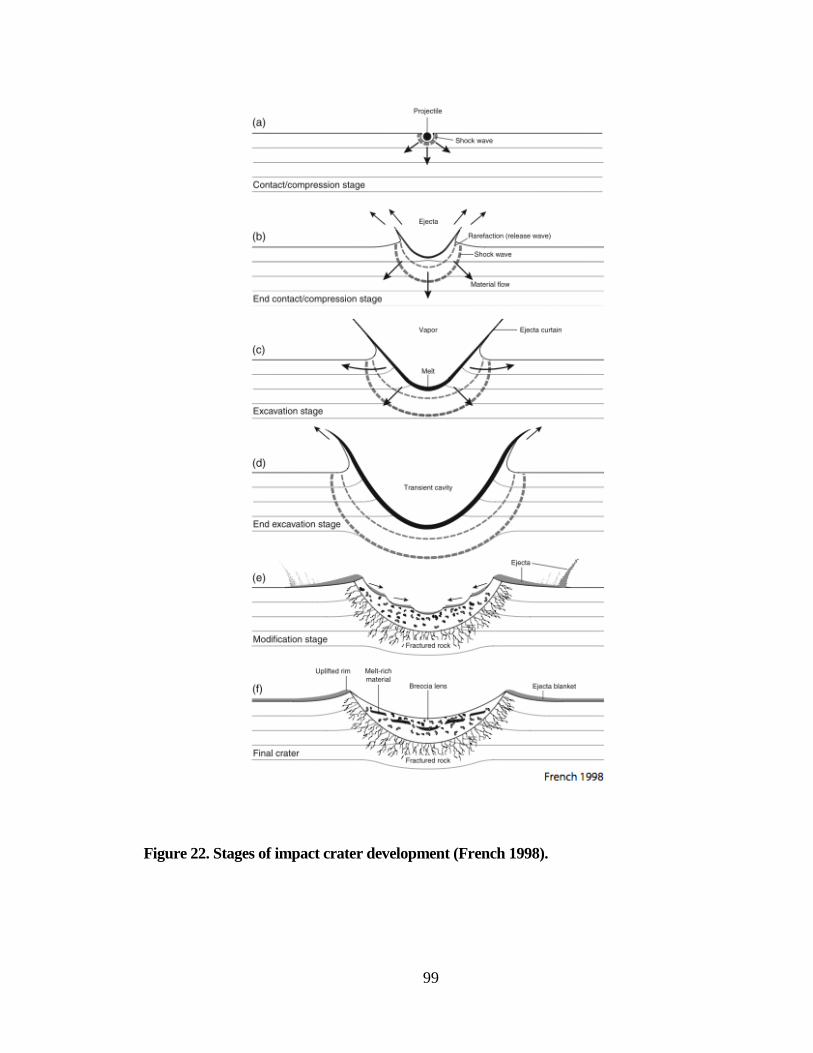
99
Figure 22. Stages of impact crater development (French 1998).
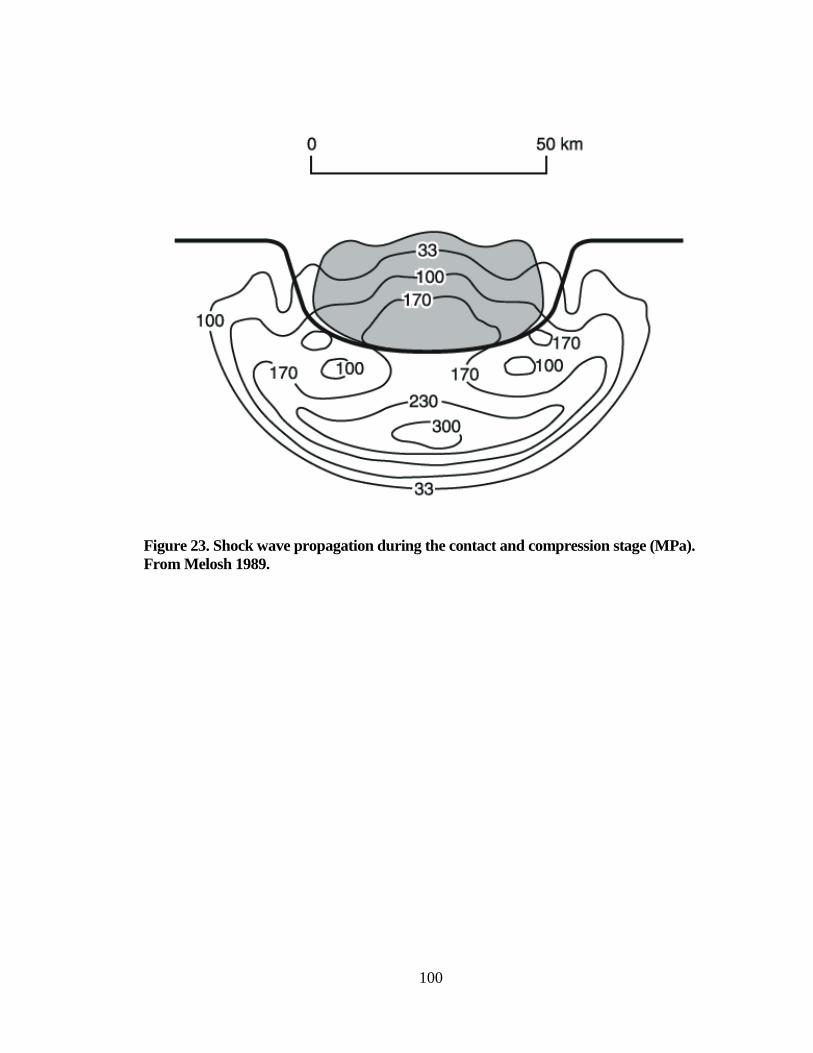
100
Figure 23. Shock wave propagation during the contact and compression stage (MPa). From Melosh 1989.
101
APPENDIX 2
MARTIAN RAMPART CRATERS:
MORPHOLOGY, DISTRIBUTION,
AND CURRENT FORMATION MODELS
Introduction
This appendix presents a description of Martian rampart crater and fluidized
ejecta morphologies, the distribution of fluidized ejecta morphologies, and the two
current models for fluidized ejecta formation. A more detailed description of some
previous studies relating to the proposed hybrid model is also presented.
Martian Rampart Crater
Imagery from the Viking Orbiter cameras, Mars Global Surveyor (MGS), Mars
Orbital Camera (MOC), Mars Odyssey Thermal Emission Imaging System (THEMIS),
and Mars Reconnaissance Orbiter (MRO) revealed that Martian impact craters are very
different from the radial ejecta on the Moon and Mercury (Carr et al, 1977; Barlow,
2005). Most Martian impact craters have fluidized ejecta (89% of 10, 651 cataloged
craters ≥5 km diameter; Barlow, 2005) that hugs topography and terminates in a distal
rampart about 1.5 to 2 crater radii from the rim (Barlow, 2005; Garvin et al., 2000 and
2003; Melosh, 1989). Barlow (2005) classified three types of fluidized ejecta (Figure 1):
(1) single layer ejecta (SLE), (2) double layer ejecta (DLE), and (3) multiple layer ejecta
(MLE). Secondary craters are rare within the fluidized ejecta (Barlow, 2003a and 2005)
blanket. Beyond the rampart, secondary craters extend many crater radii further (Barlow,
2005). For example McEwen et al. (2003) identified a 10-km-diameter crater in the
Cerberus region of Mars that had strings of secondary craters extending more than 800
102
km from the rim but had no secondary craters within the fluidized ejecta. These extensive
secondary crater strings outside of the fluidized ejecta provide important constraints on
the cohesiveness of the target material (Head et al., 2002) and any model of rampart
crater formation must account for this distinctive feature.
Boyce and Mouginis-Mark (2006) used Thermal Emission Imaging System
(THEMIS) visible (VIS) images to describe distinct features of DLE craters including (1)
a widening of the rampart in the inner ejecta layer, (2) a radial texture within the ejecta,
and (3) and absence of secondary craters. Although subsurface volatiles likely play a role
in the formation of SLE, DLE, and MLE, these morphologic differences suggest that
DLE formed in a slightly different way. Boyce and Mouginis-Mark (2006) suggest that
the DLE inner layer formed in the same way as SLE ejecta, perhaps involving both
ballistic and flow processes. But they believe the outer layer may have formed through a
high-velocity outflow of ejecta caused either by vortex winds generated by the advancing
ejecta curtain or by a base surge. According to Boyce and Mouginis-Mark (2006), the
lack of secondary craters suggests large blocks have been entrained and/or crushed by the
high-velocity outflow process or have been fragmented as a result of water in the target
material.
Fluidized ejecta morphologies do not appear to correlate with elevation or terrain
age and there is a weak correlation with terrain type (Mouginis-Mark, 1979; Costard,
1989; Barlow and Bradley, 1990, Barlow, 2005). However, layered ejecta morphologies
do exhibit a strong relationship with crater diameter and geographic location (Barlow,
2005). In the Martian equatorial region (±30º latitude), SLE craters are generally ~5 to 20
km in diameter; however, at higher latitudes, SLE craters are 5-25 km in diameter
103
(Mouginis-Mark, 1979; Kuzmin et al., 1988; Costard, 1989; Barlow and Bradley, 1990;
Barlow, 2005)
Models for Fluidized Ejecta Formation
There are two models for the formation of fluidized ejecta on Mars (Barlow,
2005): the atmospheric model and the subsurface volatile model.
The Atmospheric Model
The atmospheric model for fluidized ejecta formation argues that the thin Martian
atmosphere is the medium in which ejecta are entrained (Schultz and Gault, 1979a and
1979b; Schultz, 1992a and 1992b; Barnouin-Jha and Schultz, 1998; Barnouin-Jha et al.,
1999a, 1999b; Barlow, 2005). Laboratory and experimental studies (Schultz and Gault,
1979; Schultz, 1992a and 1992b; Barnouin-Jha and Schultz, 1998; Barnouin-Jha et al.,
1999a, 1999b) show that atmospheric turbulence produces a vortex ring that entrains,
transports, and deposits fine-grained ejecta in a layered pattern (Barlow, 2005). In this
model, larger material is ballistically emplaced ahead of the vortex ring. As the vortex
ring passes, it may remobilize these larger clasts and pile them up in the distal rampart.
Ejecta composed of fine grain material can flow without an accompanying gas or liquid
phase (Schultz, 1992a). However, for the ejecta to flow in this manner it is necessary that
the target material be composed of fine grain materials or that the impact itself produces
an enormous amount of fine grained material during impact excavation (Schultz, 1992a;
Boyce and Mouginis-Mark, 2006).
The Subsurface Volatile Model
In the subsurface volatile model, impact into a volatile-bearing target results in a
vapor cloud that deposits the entrained ejecta as a flow surrounding the crater (Baratoux
104
et al, 2002; Barlow, 2005; Carr et al., 1977; Greeley et al., 1980; Greeley et al., 1982;
Mouginis-Mark, 1987; Stewart et al., 2001; Stewart and Ahrens, 2003; Wohletz and
Sheridan, 1983). In this model, ejecta interact primarily with this vapor cloud rather than
the atmosphere. Support for this model comes from (1) correlation of rampart craters with
other geomorphic features associated with subsurface water (Costard and Kargel, 1995;
Carr, 1996), (2) relationships between rampart crater diameter and morphology with
latitude (Costard, 1989, Barlow and Bradley, 1990), (3) hydrocode simulations of
impacts into mixtures of water and rock (Stewart et al., 2001; O’Keefe et al., 2001;
Stewart et al., 2003; Stewart and Ahrens, 2003; Senft and Stewart, 2007, 2008, and
2009), and (4) experiments into ice-rich targets (Stewart and Ahrens, 2005).
In chapter two, evidence that the vaporization of water increases the degree of
fragmentation allowing smaller particles to interact with the atmosphere and produce
fluidized ejecta found in SLE and MLE rampart craters and the outer ejecta layer of SLE
is presented. In chapter three, it is argued that when the vaporization curve for water is
not crossed, the ejecta will consist of larger blocks with a higher liquid water content that
is deposited as the thicker, convex inner layer of DLE rampart craters. This section
presents some previous studies supporting the atmospheric and sub-surface volatile
models with an emphasis on those studies that are pertinent to the models presented in
chapters two and three.
Previous Studies
Atmospheric Model
Schultz (1992a) conducted laboratory experiments using the vertical gun at the
NASA Ames Research Center to investigate the complex interactions between impact
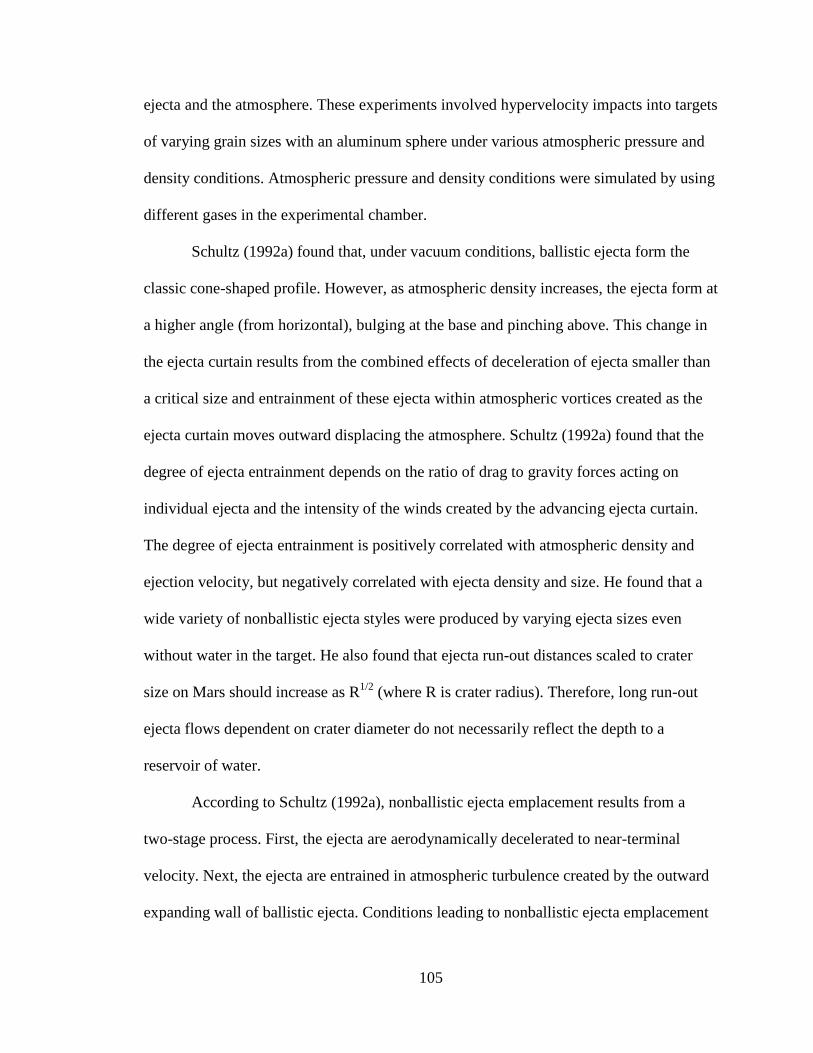
105
ejecta and the atmosphere. These experiments involved hypervelocity impacts into targets
of varying grain sizes with an aluminum sphere under various atmospheric pressure and
density conditions. Atmospheric pressure and density conditions were simulated by using
different gases in the experimental chamber.
Schultz (1992a) found that, under vacuum conditions, ballistic ejecta form the
classic cone-shaped profile. However, as atmospheric density increases, the ejecta form at
a higher angle (from horizontal), bulging at the base and pinching above. This change in
the ejecta curtain results from the combined effects of deceleration of ejecta smaller than
a critical size and entrainment of these ejecta within atmospheric vortices created as the
ejecta curtain moves outward displacing the atmosphere. Schultz (1992a) found that the
degree of ejecta entrainment depends on the ratio of drag to gravity forces acting on
individual ejecta and the intensity of the winds created by the advancing ejecta curtain.
The degree of ejecta entrainment is positively correlated with atmospheric density and
ejection velocity, but negatively correlated with ejecta density and size. He found that a
wide variety of nonballistic ejecta styles were produced by varying ejecta sizes even
without water in the target. He also found that ejecta run-out distances scaled to crater
size on Mars should increase as R1/2 (where R is crater radius). Therefore, long run-out
ejecta flows dependent on crater diameter do not necessarily reflect the depth to a
reservoir of water.
According to Schultz (1992a), nonballistic ejecta emplacement results from a
two-stage process. First, the ejecta are aerodynamically decelerated to near-terminal
velocity. Next, the ejecta are entrained in atmospheric turbulence created by the outward
expanding wall of ballistic ejecta. Conditions leading to nonballistic ejecta emplacement
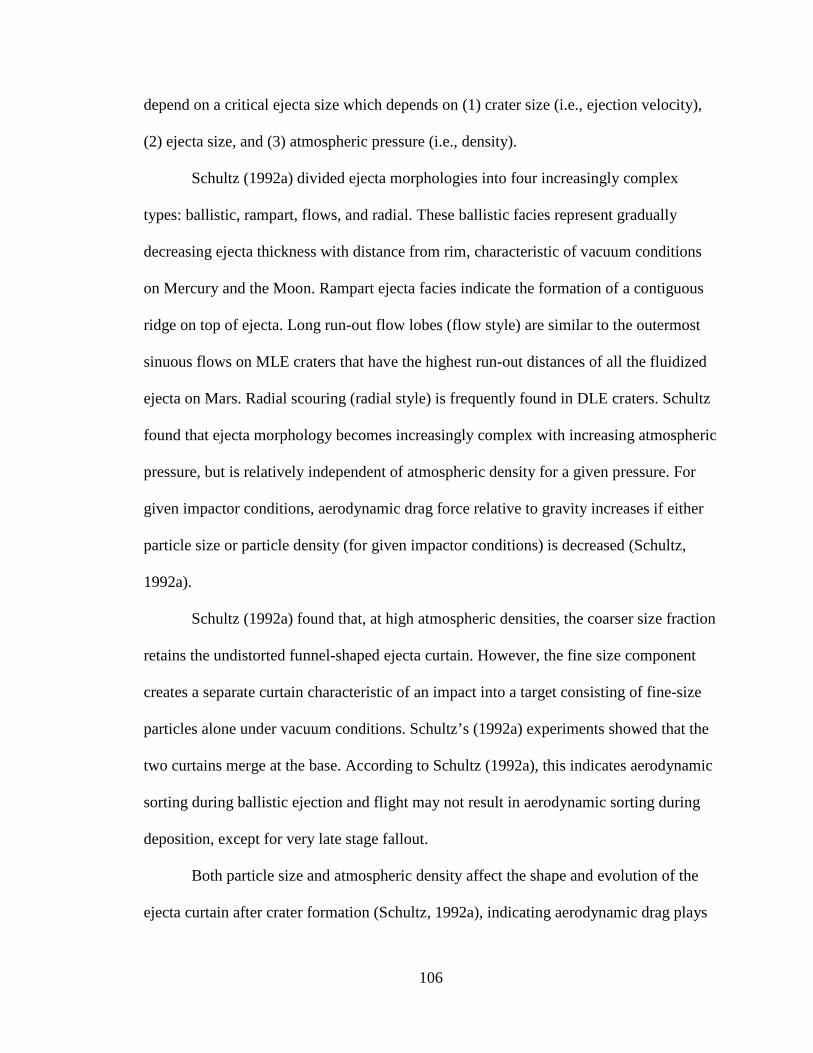
106
depend on a critical ejecta size which depends on (1) crater size (i.e., ejection velocity),
(2) ejecta size, and (3) atmospheric pressure (i.e., density).
Schultz (1992a) divided ejecta morphologies into four increasingly complex
types: ballistic, rampart, flows, and radial. These ballistic facies represent gradually
decreasing ejecta thickness with distance from rim, characteristic of vacuum conditions
on Mercury and the Moon. Rampart ejecta facies indicate the formation of a contiguous
ridge on top of ejecta. Long run-out flow lobes (flow style) are similar to the outermost
sinuous flows on MLE craters that have the highest run-out distances of all the fluidized
ejecta on Mars. Radial scouring (radial style) is frequently found in DLE craters. Schultz
found that ejecta morphology becomes increasingly complex with increasing atmospheric
pressure, but is relatively independent of atmospheric density for a given pressure. For
given impactor conditions, aerodynamic drag force relative to gravity increases if either
particle size or particle density (for given impactor conditions) is decreased (Schultz,
1992a).
Schultz (1992a) found that, at high atmospheric densities, the coarser size fraction
retains the undistorted funnel-shaped ejecta curtain. However, the fine size component
creates a separate curtain characteristic of an impact into a target consisting of fine-size
particles alone under vacuum conditions. Schultz’s (1992a) experiments showed that the
two curtains merge at the base. According to Schultz (1992a), this indicates aerodynamic
sorting during ballistic ejection and flight may not result in aerodynamic sorting during
deposition, except for very late stage fallout.
Both particle size and atmospheric density affect the shape and evolution of the
ejecta curtain after crater formation (Schultz, 1992a), indicating aerodynamic drag plays
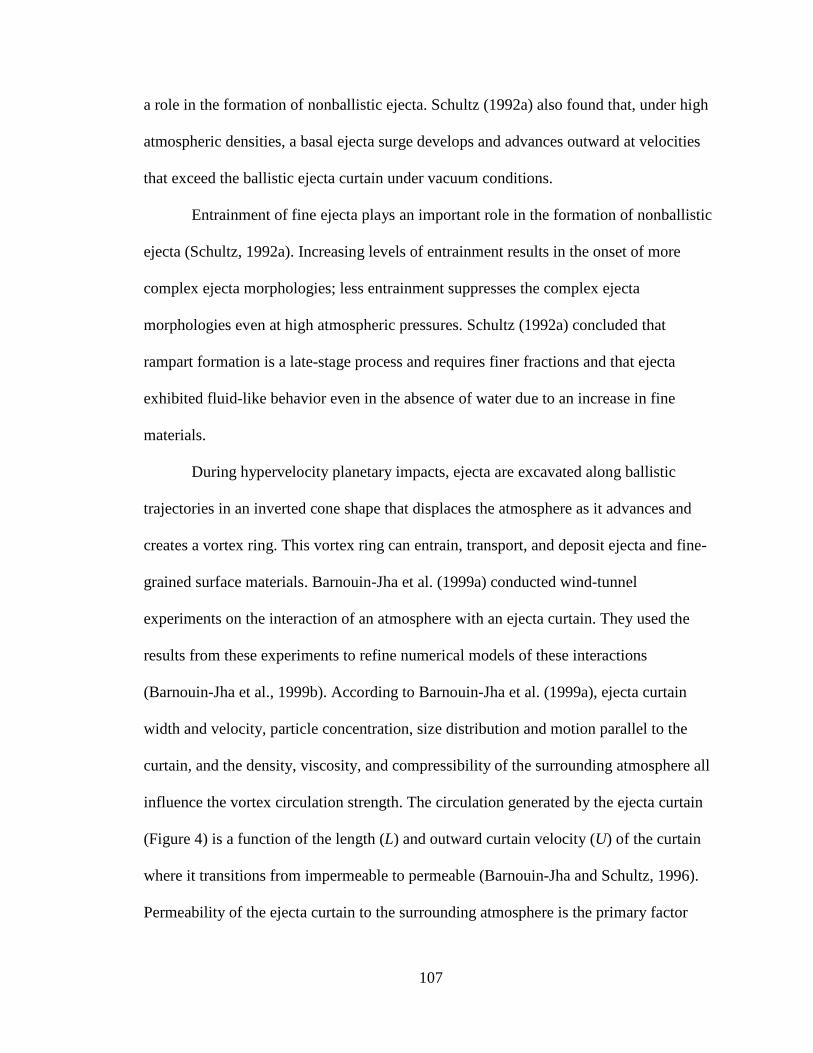
107
a role in the formation of nonballistic ejecta. Schultz (1992a) also found that, under high
atmospheric densities, a basal ejecta surge develops and advances outward at velocities
that exceed the ballistic ejecta curtain under vacuum conditions.
Entrainment of fine ejecta plays an important role in the formation of nonballistic
ejecta (Schultz, 1992a). Increasing levels of entrainment results in the onset of more
complex ejecta morphologies; less entrainment suppresses the complex ejecta
morphologies even at high atmospheric pressures. Schultz (1992a) concluded that
rampart formation is a late-stage process and requires finer fractions and that ejecta
exhibited fluid-like behavior even in the absence of water due to an increase in fine
materials.
During hypervelocity planetary impacts, ejecta are excavated along ballistic
trajectories in an inverted cone shape that displaces the atmosphere as it advances and
creates a vortex ring. This vortex ring can entrain, transport, and deposit ejecta and fine-
grained surface materials. Barnouin-Jha et al. (1999a) conducted wind-tunnel
experiments on the interaction of an atmosphere with an ejecta curtain. They used the
results from these experiments to refine numerical models of these interactions
(Barnouin-Jha et al., 1999b). According to Barnouin-Jha et al. (1999a), ejecta curtain
width and velocity, particle concentration, size distribution and motion parallel to the
curtain, and the density, viscosity, and compressibility of the surrounding atmosphere all
influence the vortex circulation strength. The circulation generated by the ejecta curtain
(Figure 4) is a function of the length (L) and outward curtain velocity (U) of the curtain
where it transitions from impermeable to permeable (Barnouin-Jha and Schultz, 1996).
Permeability of the ejecta curtain to the surrounding atmosphere is the primary factor
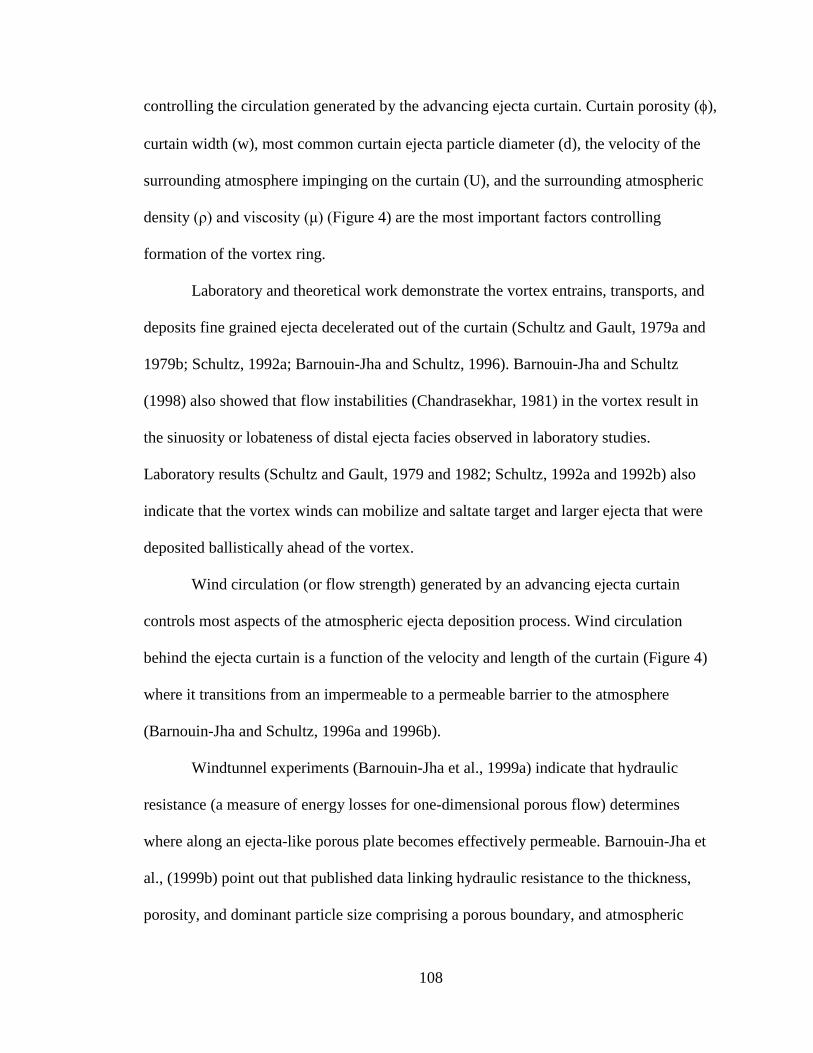
108
controlling the circulation generated by the advancing ejecta curtain. Curtain porosity (φ),
curtain width (w), most common curtain ejecta particle diameter (d), the velocity of the
surrounding atmosphere impinging on the curtain (U), and the surrounding atmospheric
density (ρ) and viscosity (μ) (Figure 4) are the most important factors controlling
formation of the vortex ring.
Laboratory and theoretical work demonstrate the vortex entrains, transports, and
deposits fine grained ejecta decelerated out of the curtain (Schultz and Gault, 1979a and
1979b; Schultz, 1992a; Barnouin-Jha and Schultz, 1996). Barnouin-Jha and Schultz
(1998) also showed that flow instabilities (Chandrasekhar, 1981) in the vortex result in
the sinuosity or lobateness of distal ejecta facies observed in laboratory studies.
Laboratory results (Schultz and Gault, 1979 and 1982; Schultz, 1992a and 1992b) also
indicate that the vortex winds can mobilize and saltate target and larger ejecta that were
deposited ballistically ahead of the vortex.
Wind circulation (or flow strength) generated by an advancing ejecta curtain
controls most aspects of the atmospheric ejecta deposition process. Wind circulation
behind the ejecta curtain is a function of the velocity and length of the curtain (Figure 4)
where it transitions from an impermeable to a permeable barrier to the atmosphere
(Barnouin-Jha and Schultz, 1996a and 1996b).
Windtunnel experiments (Barnouin-Jha et al., 1999a) indicate that hydraulic
resistance (a measure of energy losses for one-dimensional porous flow) determines
where along an ejecta-like porous plate becomes effectively permeable. Barnouin-Jha et
al., (1999b) point out that published data linking hydraulic resistance to the thickness,
porosity, and dominant particle size comprising a porous boundary, and atmospheric
109
properties such as viscosity and density (Idelchik, 1994) and be combined with
atmosphere and cratering models (Maxwell, 1977a,1977b, and 1977c; Schultz and Gault,
1979; Orphal et al., 1980; Housen et al., 1983) to determine the length of the
impermeable portion of the curtain and the time when it transitions from impermeable to
permeable.
Wind tunnel (Barnouin-Jha et al., 1999a) and numerical (Barnouin-Jha, 1999b)
results show that first order circulation (Γ, m/s) is determined by flow separation.
Barnouin-Jha and Schultz (1996) showed that circulation controls the velocity and the
entrainment capacity of the vortex winds developed behind the advancing ejecta curtain.
The entrainment capacity, in turn, controls the ejecta deposition by the vortex. The
impermeable curtain length (L) can be estimated using the hydraulic resistance criteria ζcr
=10 given φ, w, d, ρ, and μ along the length of the ejecta curtain based on ejecta scaling
rules (Schultz and Gault, 1979; Housen et al., 1983), atmospheric conditions, and
assumptions on the ejecta size distribution (Barnouin-Jha et al., 1999a).
Circulation of the curtain-derived vortex is what ultimately controls nonballistic
ejecta deposition (Barnouin-Jha et al., 1999a ). The circulation of the curtain-derived
vortex is controlled by the permeability of the ejecta curtain. To estimate the initial
circulation of the vortex, the time when the curtain becomes fully permeable must be
known. Experiments conducted by Barnouin-Jha et al. (1999a), show that this transition
depends upon the dominant grain size of the target present in the ejecta. For experimental
impacts in coarse sand (Barnouin-Jha and Schultz, 1996 and 1998) this transition occurs
slowly. However, the transition occurs quickly for fine-grained pumice. For experiments
into fine-grained pumice, by the time crater growth ceases, significant sized holes are
110
observed through the curtain near the time when crater growth ceases (Barnouin-Jha and
Schultz, 1998). This rapid transition from impermeable to permeable ejecta curtain
suggests that two processes compete in determining when the curtain becomes permeable
(Barnouin-Jha and Schultz, 1999a): (1) uniform winnowing of ejecta by through flow, (2)
Raleigh-Taylor or Kelvin-Helmholtz instabilities (Chandrasekhar, 1981).
Barnouin-Jha and Schultz (1999a) concluded that, when the size of pore space in
the curtain is large (as in the case of the coarse-grained ejecta), uniform winnowing
dominates and slowly erodes the curtain from the top down. They found, however, that
when the size of pore space is small (as in the case of fine-grained ejecta), more pressure
is exerted on the interface where the atmosphere impinges on the advancing curtain
surface, leading to the growth of Raleigh-Taylor or Kelvin-Helmholtz instabilities that
would punch holes through the curtain.
According to Barnouin-Jha and Schultz (1999a), a third factor that could
influence when and where an ejecta curtain becomes permeable is the presence and
distribution of large rocks in the ejecta curtain. They explain that, when these large rocks
are located in regions of the curtain where their diameter exceeds the thickness of the
curtain, the atmosphere impinging on the advancing curtain will deflect locally around
these protruding rocks. This deflected atmosphere travels at a greater velocity relative to
the impinging atmosphere and may punch holes through the curtain around the protruding
rocks. Jets produced by this process most likely occur in the regions where the curtain is
thinnest. However, these jets could form anywhere such protruding rocks exist.
The continuous solid-like nature of the curtain could be broken up by protruding
rocks, possibly disrupting flow separation and vortex formation (Barnouin-Jha et al.,
111
1999a and 1999b). However, according to Gault et al. (1963), the most commonly cited
source for calculating ejecta block size (Barnouin-Jha et al., 1999b), block sizes formed
during cratering are unlikely to exceed the curtain thickness of most large craters. The
blocks located well within a curtain will not influence the flow generated by a curtain
thickness of most large craters. Therefore, these blocks will not influence the flow
generated by a curtain because the permeability of the curtain is primarily controlled by
the hydraulic resistance, which is defined in terms of the curtain’s most common particle
diameter d (Barnouin-Jha et al., 1999a and1999b). The large blocks will only create
jetting toward the top of the curtain where the curtain is thinner, or after enough time has
passed that larger amounts of curtain material are eroded away and thinning the width of
the curtain and exposing the large blocks. In the latter case (Barnouin-Jha et al., 1999b),
the vortex flow should be well established by the time the large blocks are exposed,
entraining the fine-grained material away from around the blocks that continue on
ballistic paths (Schultz and Gault, 1979a, 1979b, and 1982; Schultz, 1992a).
Subsurface Volatile Model
Kieffer and Simonds (1980) noted that impacts into volatile-rich targets result in
rapid volatile expansion which widely disperses impacts melts in thinner deposits when
compared to targets with little or no volatiles. They found that impacts into crystalline
rocks produce about a hundred times more impact melt than impacts into sedimentary
rocks. They attributed this difference to the effects of vaporization of volatiles in
sedimentary rocks causing subsequent acceleration of the ejecta by volatile expansion.
Wohletz and Sheridan (1983) suggested that target water explosively vaporizes
during impact resulting in an alteration in initial ballistic trajectories that ultimately
112
produce fluidized ejecta. They conducted a series of controlled steam explosion
experiments by combining water and thermite. These steam explosions are very similar to
hydrovolcanic eruptions in which hot magma comes in contact with liquid water and
produces tuff rings, tuff cones, and ground surge deposits (Moore, 1967; Waters and
Fisher, 1971; Wohletz and Sheridan, 1979). Results of their experiments indicate that the
degree of thermite melt fragmentation (i.e., ejecta particle size), energy of the explosion,
and style of the explosion are controlled by the mass ratio of water to thermite melt and
confining pressure. Wohletz and Sheridan (1979) found that larger fragments followed
parabolic paths while smaller ejecta particles experience significant aerodynamic drag
due to their interaction with the atmosphere and steam produced during the explosion.
This resulted in separation fine particles flowing as a ground surge from a ballistic plume
comprised of larger particles.
Wohletz and Sheridan (1983) concluded that small water-melt ratios (0 – 0.2)
produced ballistic style eruptions with and average ejecta size of 100 cm. Water-melt
ratios of 0.2 – 1.0 produced a fluidized superheated steam eruption with average ejecta
size of 10-4 cm. Average ejecta size increased to 10-2 cm with a water-melt ratio of 1.0 –
10.0; This water-melt ratio produced a combination of fluidized steam and ballistic
ejecta. Water-melt ratios above 10.0 produced 101 cm ejecta particles deposited in a fluid
flow. They attributed the increased particle size and decrease in transport energy (as
indicated by eruption style) with increased amounts of water (>1.0 water-melt ratio) to
quenching caused by the high heat capacity of water.
Stewart et al. (2001) conducted experiments and modeling of impacts onto ice-
rock mixtures to quantify the effects of subsurface H2O on ejecta distribution, rampart
113
and pedestal formation, and crater floor morphologies. They propose that various ejecta
morphologies (SLE, DLE, and MLE) are produced by increasing amounts of ice. They
found that the high volatility of H2O modifies the crater formation process producing
more vapor, higher ejection angles, fluidized ejecta blankets, and larger crater rim uplift.
Ice is much more compressible than rock. Therefore, about 4 times more energy is
deposited in ice than rock during typical shock pressures (Stewart et al., 2001). Ejection
angle increases as strength decreases (Melosh, 1984). Through their experiments, Stewart
et al, (2001) found that ice will melt completely upon release from shock pressures ≥2-3
GPa. These pressures correspond to about 7 projectile radii (Rp) for asteroidal impacts on
Mars (Stewart et al., 2001).
Stewart et al., (2001) modeled impacts into rock-ice mixture using the Eulerian
finite difference code, CTH (McGlaun and Thomson, 1990), and found that ejection
angles at the point of impact are high (70˚) and nearly constant in the zone of melted ice
and brecciated rock (7Rp) for a rock-ice mixture with 20% volume subsurface ice. In
contrast, pure rock targets had a peak ejection angle of about 60˚. In all experiments, the
ejection angles decrease to about 45˚ near the crater rim. Models with peak ejection
angles of 70˚ (consistent with 10-20% volume water ice) produced ejecta layers of
consistent thickness that were high in water content. Models with initial ejection angles
of about 80˚ corresponding to increased amounts of water produced an ejecta blanket that
was more pronounced with a large step in ejecta thickness about 0.6 crater radii (Rc) from
the rim.
O’Keefe et al. (2001) produced geologic strength models using shock wave
physics code CTH (McGlaun and Thomson, 1990). They found that since ice is more
114
compressible than rock, more work was done on the ice. Consequently, a larger volume
of ice was subjected to shock-induced phase transformations compared to the rocks. In
their numerical model, a small zone of rock (~1 impactor radius, a) was melted and very
little was vaporized (<1 a). Rock that was excavated did not undergo any major phase
transitions. However, ice was vaporized to about 1a and ice was melted within about 7a.
From 1a to 7a, the excavated material is a mixture of rock and water. Ejection angles are
also high (70°) within this region and decrease away from the impact point until they
reach a 45° angle near the crater rim. O’Keefe et al., (2001) note that there is a clear
separation in ejecta trajectories in their model at about 7a. They attribute this separation
to differences in strength between rock and water in the excavation cavity. They conclude
that the ejecta will contain a significant amount of water allowing for fluidized flow.
To understand the amount of liquid water that was present in Martian ejecta
blankets, Stewart et al. (2003) conducted simulations of impact cratering onto ice-rock
mixtures using the shock physics code CTH (McGlaun and Thomson, 1990). They used
the results of these simulations to calculate the volume of ground ice subject to shock-
induced melting and the amount of excavated liquid water. They assumed the ground ice
was distributed within pore spaces and cracks in the Martian regolith at average Martian
surface temperatures (200 K). The atmosphere was approximated at the present day mean
of 7 millibar. The surface porosity was varied from 0-20%. Regolith pore space volume
(φ) was modeled assuming a decrease in depth, z, as φoe-z/Kz, where φ0 is the surface
porosity and Kz is the decay constant (3 km). The dynamic strength of the Martian
surface was constrained to ~10 Mpa. Projectile diameter was varied from 100 to 2000 m.
115
At temperatures between 150 and 273 K, ice in the Martian crust will begin to
melt after experiencing shock pressures between 2.0 and 0.6 GPa, respectively (Stewart
et al., 2003). The ice will melt completely after being released from shock pressures
above 5.5 and 3.7 GPa.
Stewart et al. (2003) concluded that, in the present climate, about half the
excavated ice is melted by impact shock. About 60% of ground ice will completely melt
in equatorial zones while at the poles more that 20% will be melted. Their results indicate
that ejecta fluidization does not require pre-existing water near the surface because
shock-melting of ground ice will introduce large quantities of liquid water into the ejecta
blanket.
Conclusion
According to Barlow (2010), the relative role of subsurface volatiles versus the
atmosphere in the formation of layered ejecta blankets is one of the major questions
remaining concerning the geology of Mars. Barlow (2005) suggests that fluidized ejecta
are produced by some combination of the atmospheric and subsurface volatile models.
Building upon Schultz’s (1992a) idea that ejecta can flow without water if the particles
are small enough, this dissertation tests the hypothesis that the vaporization of water
during the excavation stage of impact cratering is the mechanism that decreases the size
of ejecta particles and facilitates its fluidized emplacement. It is proposed that this
interaction between water and rock during decompression may be the bridge between the
atmospheric and subsurface volatile models.
116
APPENDIX 3
PHASE EQUILIBRIA OF WATER AND CARBON DIOXIDE ONE- AND TWO-
COMPONENT SYSTEMS AND THEIR RELATION TO THE
MARTIAN SURFACE CONDITIONS AND
PROPOSED EXPERIMENTS
This appendix describes the one- and two-component phase diagrams for CO2 and
H2O, and how each relates to (1) atmospheric and regolith conditions on Mars, (2)
pressure and temperature conditions during impact cratering, and (3) experiments on the
effects of shock decompression of water on the degree of rock fragmentation conducted
using the University of Munich shock tube apparatus.
One-component Phase Diagram for H2O
The phase diagram of water (Figure 24a) shows three phases of water (liquid,
vapor, and solid ice) separated by equilibrium curves. Any phase changes with changing
pressure and/or temperature are governed by the Gibb’s Phase Rule:
P + F = C + I
Where
P = the number of phases (solid, liquid, or gas) in the system C = the minimum number of components necessary to define the system I = the number of intensive variables in the system. Intensive variables are properties of the system that are not dependent on the amount of material in the system. In the phase diagrams discussed below, the intensive variables are pressure and temperature. F = degrees of freedom of the system
Each field (solid, liquid, gas) is a divariant field where there are two degrees of
freedom (F = C+I-P=1+2-1=2). We can change temperature and/or pressure without any
phase changes and still maintain equilibrium. The three curves on the phase diagram
117
represent conditions under which two phases exist in equilibrium. Along these univariant
curves there is one degree of freedom (F=C+I-P=1+2-2=1). This means that, in order to
maintain equilibrium between the two phases, we can change pressure or temperature
independently, but not both. If we change pressure, temperature must change along the
univariant curve. If we change temperature, pressure can only change along the
univariant curve if the system is to maintain equilibrium between the two phases. The
system can only move off of these curves and maintain equilibrium if one of the phases is
consumed.
At the triple point, all three phases (solid, liquid, and vapor) exist in equilibrium.
At this point there are zero degrees of freedom (F=C+I-P=1+2-3=0). The system will not
move off this point until one or two phases are consumed.
The phase diagram for water shows that at low temperatures, ice (solid water) is
the stable phase. At moderate temperatures and high pressures, water (liquid) is the stable
phase, and at higher temperatures and lower pressures, water vapor (gas) is the stable
phase. The sublimation curve separating solid and gas phases represents the vapor
pressure of ice as a function of temperature. The vaporization curve separating the liquid
and gas phases is a plot of (equilibrium) vapor pressure P as a function of temperature T.
The triple point (273 K, 1kPa) represents the point at which vapor pressures for ice and
water are the same and all three phases (ice, water, and vapor) coexist. The temperature
and pressure are fixed at this point.
The critical point (674 K, ~8Pa) is a point beyond which water cannot be
liquefied. Because this super-critical fluid shares the properties of gas, no vapor pressure
118
beyond this temperature is measured. The temperature of 647 K is called the critical
temperature, and the vapor pressure at this temperature is called the critical pressure.
The melting curve or fusion curve separates the liquid and solid phases. Note that
the slope of this curve is negative for water. This is due to the unique property that solid
water is less dense than liquid water. Ice actually melts at lower temperature at higher
pressure.
The slope of any phase change curve can be described by the Claussius-Clapeyron
equation which relates the slope of a reaction line on a phase diagram to fundamental
thermodynamic properties. The form of the Clapeyron equation most often used is:
dP/dT = ∆S/∆V where:
P = pressure T = temperature S = entropy V = volume
This equations states that the slope (rise/run) of an univariant equilibrium curve
plotted on a P-T diagram is equal to the entropy change (∆S) of the reaction divided by
the volume change (∆V) of the reaction. So for a melting curve with a positive slope
(e.g., carbon dioxide system), entropy (or disorder) increases as volume increases.
Carbon dioxide molecules are more disordered in liquid form than solid form.
Liquid carbon dioxide is less dense than solid carbon dioxide and takes up more volume.
But water is unique in that ice, the more ordered (lower entropy) form, has a
larger volume than less ordered (higher entropy) liquid water. Entropy decreases and
volume increases and the melting curve between ice and water has a negative slope.
119
One-component Phase Diagram for CO2
The phase diagrams for CO2 has features in common with that of water:
sublimation curve, vaporization curve, triple point, critical temperature and pressure. The
triple point of carbon dioxide occurs at a pressure of 5.2 atm (3952 torr) and 216.6 K (-
56.4 °C). At temperature of 197.5 K (-78.5 °C), the vapor pressure of solid carbon
dioxide is 1 atm (760 torr). At this pressure, the liquid phase is not stable, the solid
simply sublimates. Solid carbon dioxide is called dry ice, because it does not go through
a liquid state in its phase transition at average surface pressures and temperatures on
Earth. The critical temperature for carbon dioxide is 31.1 °C, and the critical pressure is
73 atm. Above the critical temperature, the carbon dioxide is a super-critical fluid.
Figures 24a and 25a show the average surface conditions for Earth (E), Venus (V, Figure
24a only), and Mars (M). On Earth, water is most commonly found as a liquid while
carbon dioxide is a gas. The surface of Venus is within the stability field for gaseous
water and carbon dioxide. Water ice and carbon dioxide gas are most commonly found at
average surface temperatures and pressures on Mars, although some solid carbon dioxide
may be found at the poles.
Isobaric Heating Example: Water
Let’s look at example of isobaric (holding pressure fixed) heating of water ice.
Our sample of ice at point A (~180 K [~ -93.15 °C], 1 bar) is in the solid field with two
degrees of freedom. As we add heat to the system while keeping pressure fixed, the
system will evolve to the right toward the melting curve at point B (~280 K [~ 6.85 °C],
1 bar). Once it hits the melting curve, the system will have one degree of freedom and
must stay along this curve until one of the phases disappears. Because we are holding
120
pressure fixed while adding heat, the system will stay at this point until all the ice is
melted into water. Even though the ice is melting as heat is being added, temperature of
the system will remain the same because the heat is being used to break the bonds of the
crystalline ice structure. Once all the ice has melted, the system will continue to move to
the right (increasing temperature while maintaining the same pressure) toward point C
(~300 K [~ 26.85 °C], 1 bar). The rate at which the ice melts is controlled by the heating
rate. Because we have lost a phase (ice) we are once again in a divarant field, this time
for liquid water.
Isothermal Decompression Example: Carbon Dioxide
Now let’s look at what happens when we hold temperature constant and change
pressure. In this example we will consider isothermic decompression of solid carbon
dioxide. We’ll start with sample X (~210 K [~ -63.15 °C], 1 bar). This sample is in the
divariant solid field for CO2. As we reduce the pressure, the system evolves down toward
the sublimation curve at point Y (~210 K [~ -63.15 °C], 0.3 bar). Along this curve solid
and gas coexist in equilibrium and there is one degree of freedom. Any change in
pressure must be followed by a change in temperature that is restricted to the sublimation
curve if the system is to remain in equilibrium. However, we are holding temperature
fixed. Therefore, the system sits at point Y while the change in pressure converts the
solid CO2 to gas. The rate at which the solid sublimates depends on the decompression
rate. The more quickly the system is decompressed, the more explosive the transition
from solid to gas will be. Once we have lost the solid phase, isobaric decompression will
continue to push the sample down toward point Z (~210 K [~ -63.15 °C], 0.8 bar).
121
Two-component Phase Diagram for H2O-CO2
Figure 26, shows the phase diagram for the H2O-CO2 two-component system.
This figure includes the stability fields for clathrate hydrate assembled by Longhi (2006)
from experimental work and thermodynamic calculations. Clathrate hydrates are solids in
which hydrogen-bonded water molecules form cage-like structures that enclose low-
molecular-weight gases (i.e., O2, N2, CO2, CH4, H2S, Ar, Kr, and Xe). In this example,
clathrate hydrate encloses CO2 molecules. Clathrate hydrates are stable under particular
pressure and temperature conditions (depending on the gas molecule enclosed). If
pressure and temperature conditions stray outside this range, the enclosed gas molecule
will escape the cage and the cage will collapse into a conventional ice structure (Longhi
2006).
Martian Surface and Subsurface Conditions
The average surface pressure and temperature conditions are shown for Earth
(blue dot) and Mars (red dot) in Figure 27. The Martian geothermal gradient for a closed
regolith is shown as a red line (Longhi 2006). Under closed regolith conditions, near the
surface, water ice and CO2 gas can exist. With increased depth (pressure), clathrate
hydrate forms. At even greater pressures, solid water ice may exist with solid and/or
liquid CO2. At depths between about 1 and 4 km, water ice exists with liquid CO2. At
depths of about 4 to 5 km, liquid CO2 may exist with liquid water.
122
Longhi (2006) showed that the regolith gas thermal gradient is the intersection of
isobars from the atmospheric gradient projected within the regolith with isotherms from
the lithostatic gradient (Figure 27). Regolith pores are most likely to be open to the
atmosphere closer to the poles because ice near the poles seals the regolith off from the
atmosphere.
Pressure Temperature Conditions Reached During Impact
During the contact/compression stage of impact cratering, target materials can
experience temperatures up to 10,000 °C near the impact point and from 500 to 3000 °C
in the surrounding rock (de Pater and Lissauer 2001, French 1998, and Melosh 1989).
Rocks near the point of impact are shocked to over 100 GPa of pressure (French 1998,
Melosh 1989). Pressures decrease away from the point of impact to about 10 - 30 GPa
about one-crater radii from impact (French 1998, Melosh 1989). These high pressures are
rapidly released within less than a second. At this point, the excavation stage begins,
during which rocks are fragmented and typically are ballistically emplaced as ejecta
(French 1998, Melosh 1989).
Figure 26 shows the peak temperatures and pressures reached during the
contact/compression stage of impact cratering plotted against a phase diagram for water.
No matter what the starting phase of water is in the Martian regolith, water will be forced
into a complex solid, liquid, or supercritical fluid phase. During the excavation stage,
these high pressures will be released to essentially zero, and water will flash to a vapor.
123
Application of water and CO2 Phase Diagrams to
Rock Fragmentation Experiments
These phase diagrams have important implications for this research and are used
to plan the temperature and pressure conditions of the experiments. In this section, I’ll
describe the experiments and how the phase diagrams were used to determine
experimental conditions.
The University of Munich has an experimental facility for the investigation of
rock fragmentation by rapid decompression (Figure 5, Alidibirov and Dingwell 1996a,
Küppers et al. 2006). This facility was used to test effect of rapid decompression of
water on the fragmentation of rock. The experimental apparatus consists of a high-
pressure, high-temperature section separated by a diaphragm from a low-pressure, low-
temperature section (Alidibirov and Dingwell 1996a, Küppers et al. 2006). The high-
pressure section can reach pressures of 500 bars (50 MPa) and temperatures of 950 °C
(Spieler 2007, pers. comm.). When the diaphragm separating the two sections is broken,
the pressure in the lower chamber rapidly drops to ~1 atm. A release wave propagates
through the sample at the speed of sound (Figures 5, Alidibirov and Dingwell 1996b,
Küppers et al. 2006), generating dynamic tensile stresses in the sample. If the dynamic
tensile strength of the sample is exceeded by the release wave, fracturing and
fragmentation will occur. Compressed gas contained in the pore spaces of the sample will
expand and accelerate the fragments. Temperatures and pressures experienced by rocks
during impact far exceed those of the experimental facility. However, this study is not
intended to simulate the exact conditions during impacts. Rather, the purpose of this

124
study is to investigate whether the rapid decompression of water increases the degree of
rock fragmentation.
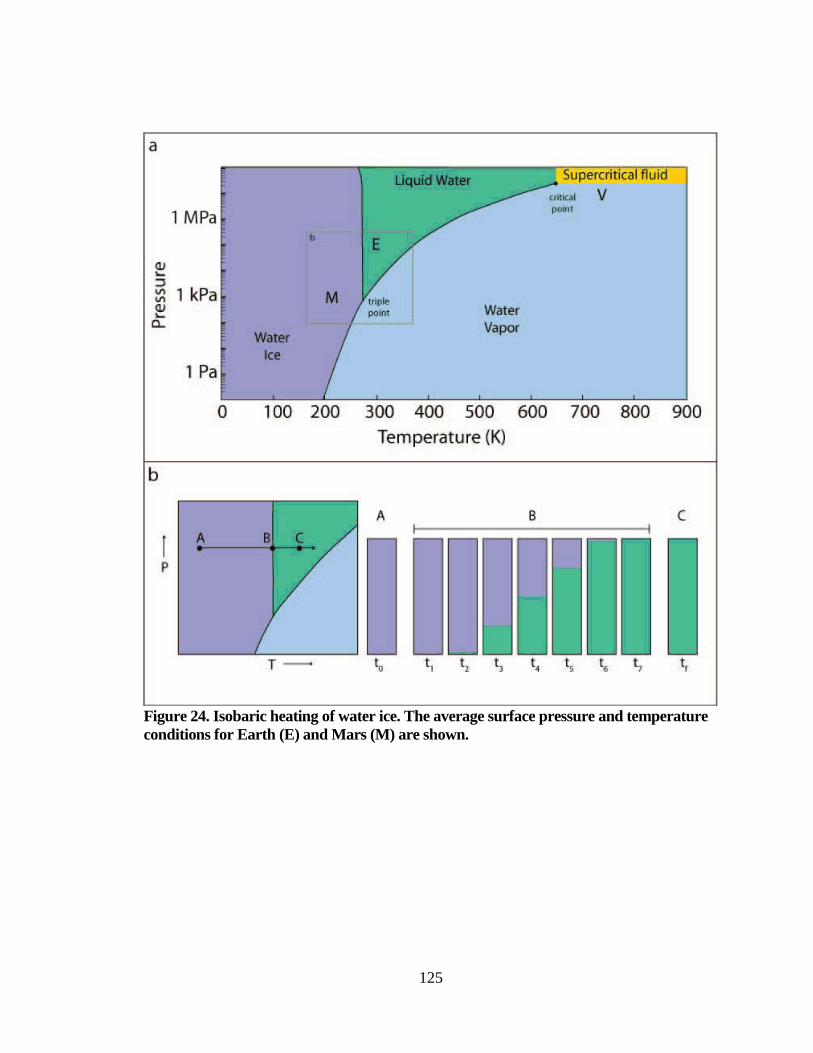
125
Figure 24. Isobaric heating of water ice. The average surface pressure and temperature conditions for Earth (E) and Mars (M) are shown.
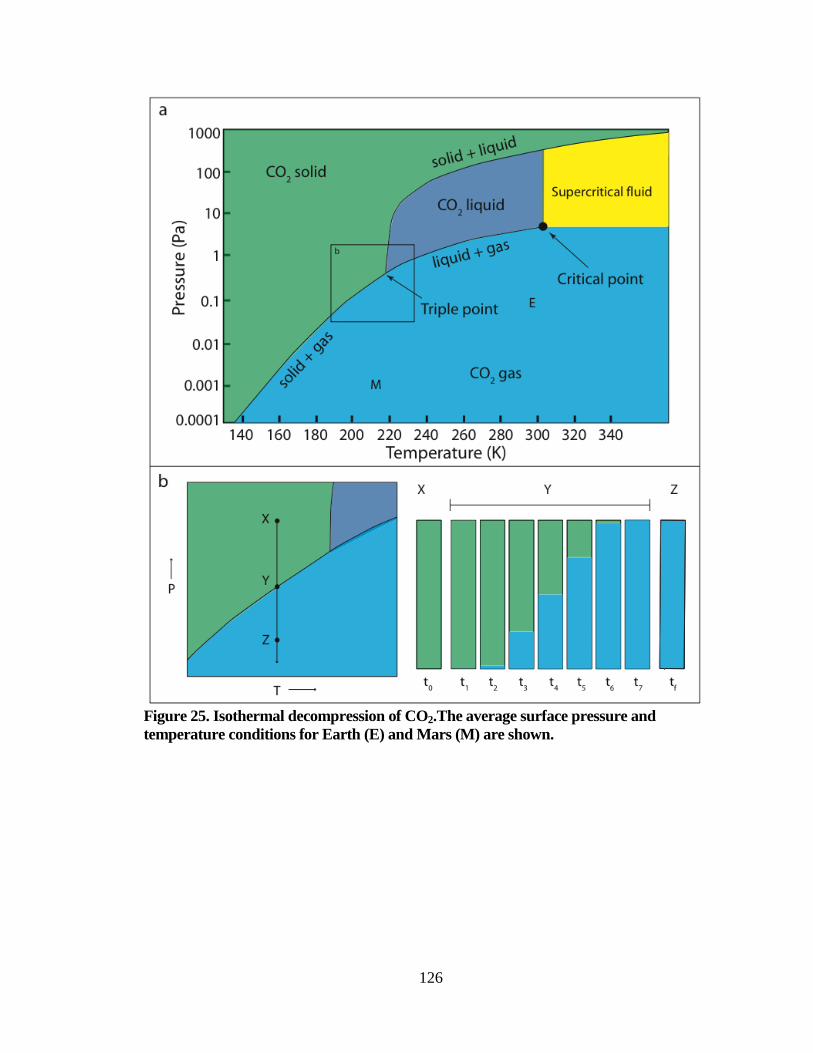
126
Figure 25. Isothermal decompression of CO2.The average surface pressure and temperature conditions for Earth (E) and Mars (M) are shown.
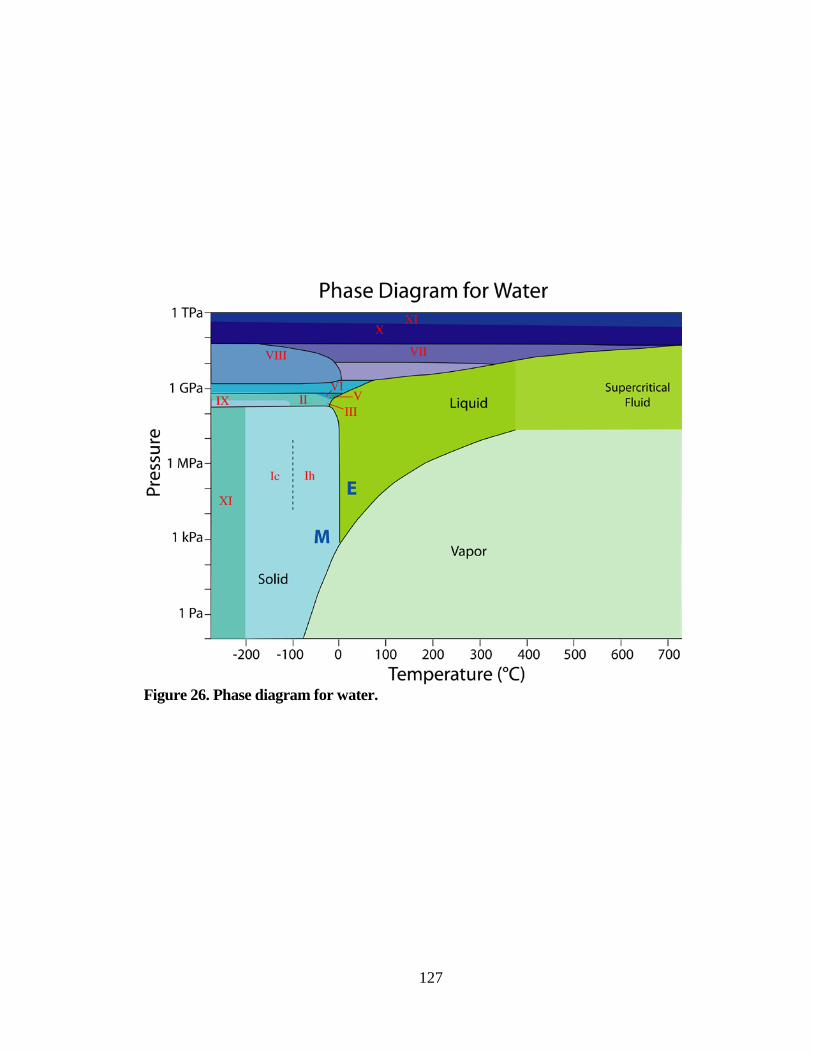
127
Figure 26. Phase diagram for water.
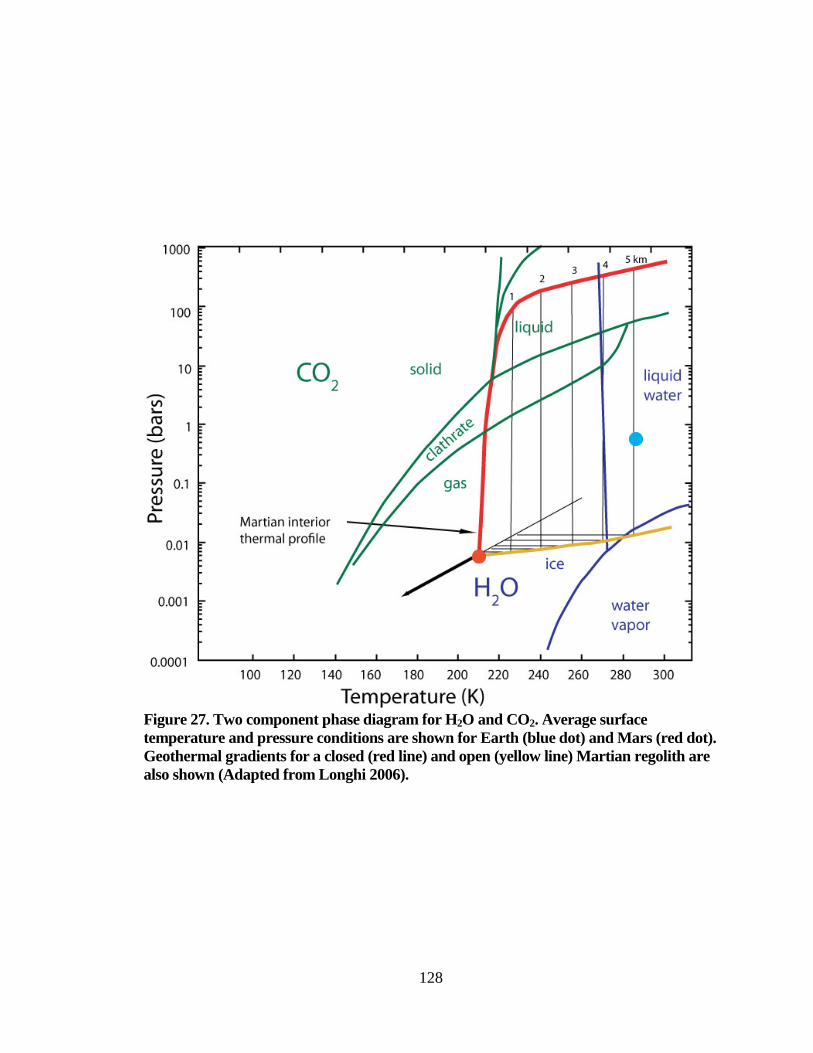
128
Figure 27. Two component phase diagram for H2O and CO2. Average surface temperature and pressure conditions are shown for Earth (blue dot) and Mars (red dot). Geothermal gradients for a closed (red line) and open (yellow line) Martian regolith are also shown (Adapted from Longhi 2006).
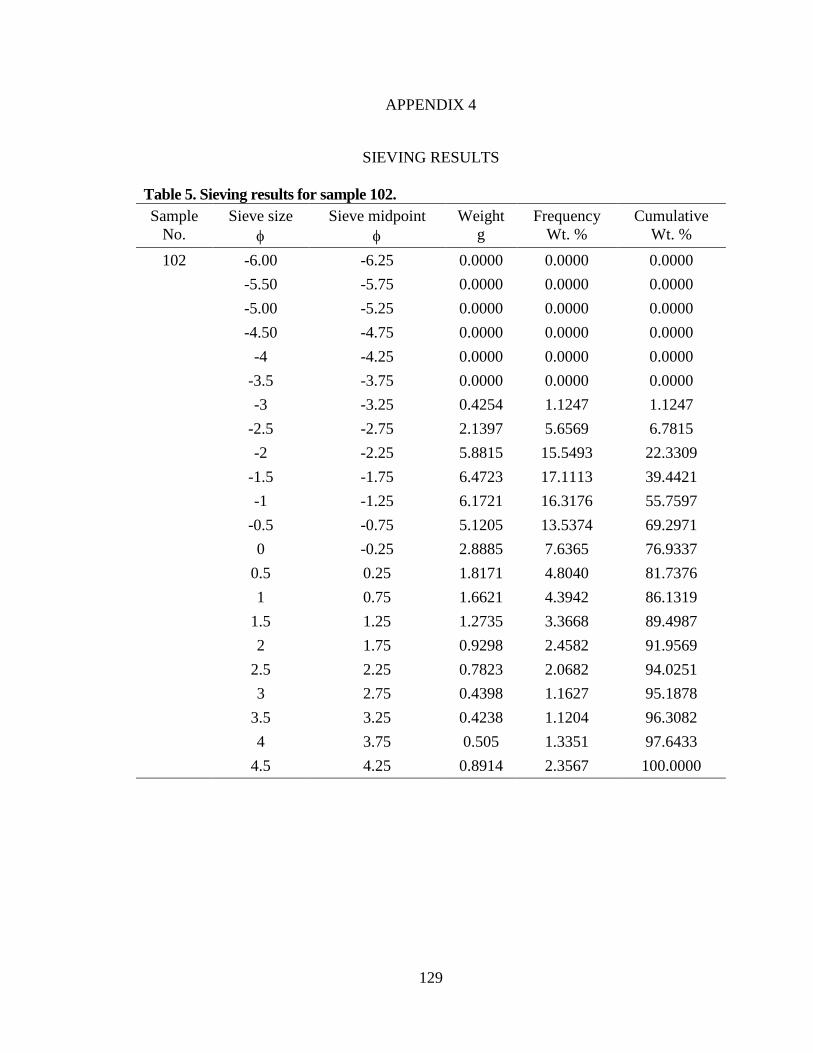
129
APPENDIX 4
SIEVING RESULTS
Table 5. Sieving results for sample 102. Sample
No. Sieve size
φ Sieve midpoint
φ Weight
g Frequency
Wt. % Cumulative
Wt. %
102 -6.00 -6.25 0.0000 0.0000 0.0000
-5.50 -5.75 0.0000 0.0000 0.0000
-5.00 -5.25 0.0000 0.0000 0.0000
-4.50 -4.75 0.0000 0.0000 0.0000
-4 -4.25 0.0000 0.0000 0.0000
-3.5 -3.75 0.0000 0.0000 0.0000
-3 -3.25 0.4254 1.1247 1.1247
-2.5 -2.75 2.1397 5.6569 6.7815
-2 -2.25 5.8815 15.5493 22.3309
-1.5 -1.75 6.4723 17.1113 39.4421
-1 -1.25 6.1721 16.3176 55.7597
-0.5 -0.75 5.1205 13.5374 69.2971
0 -0.25 2.8885 7.6365 76.9337
0.5 0.25 1.8171 4.8040 81.7376
1 0.75 1.6621 4.3942 86.1319
1.5 1.25 1.2735 3.3668 89.4987
2 1.75 0.9298 2.4582 91.9569
2.5 2.25 0.7823 2.0682 94.0251
3 2.75 0.4398 1.1627 95.1878
3.5 3.25 0.4238 1.1204 96.3082
4 3.75 0.505 1.3351 97.6433
4.5 4.25 0.8914 2.3567 100.0000
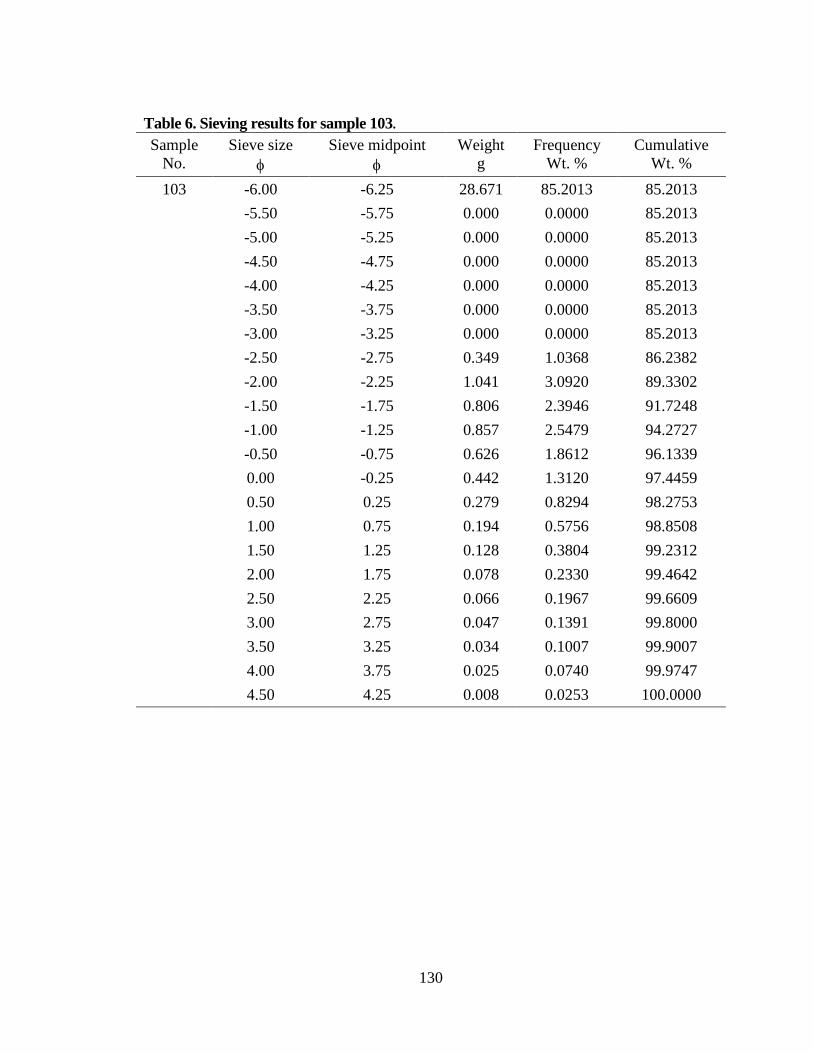
130
Table 6. Sieving results for sample 103. Sample
No. Sieve size
φ Sieve midpoint
φ Weight
g Frequency
Wt. % Cumulative
Wt. %
103 -6.00 -6.25 28.671 85.2013 85.2013
-5.50 -5.75 0.000 0.0000 85.2013
-5.00 -5.25 0.000 0.0000 85.2013
-4.50 -4.75 0.000 0.0000 85.2013
-4.00 -4.25 0.000 0.0000 85.2013
-3.50 -3.75 0.000 0.0000 85.2013
-3.00 -3.25 0.000 0.0000 85.2013
-2.50 -2.75 0.349 1.0368 86.2382
-2.00 -2.25 1.041 3.0920 89.3302
-1.50 -1.75 0.806 2.3946 91.7248
-1.00 -1.25 0.857 2.5479 94.2727
-0.50 -0.75 0.626 1.8612 96.1339
0.00 -0.25 0.442 1.3120 97.4459
0.50 0.25 0.279 0.8294 98.2753
1.00 0.75 0.194 0.5756 98.8508
1.50 1.25 0.128 0.3804 99.2312
2.00 1.75 0.078 0.2330 99.4642
2.50 2.25 0.066 0.1967 99.6609
3.00 2.75 0.047 0.1391 99.8000
3.50 3.25 0.034 0.1007 99.9007
4.00 3.75 0.025 0.0740 99.9747
4.50 4.25 0.008 0.0253 100.0000
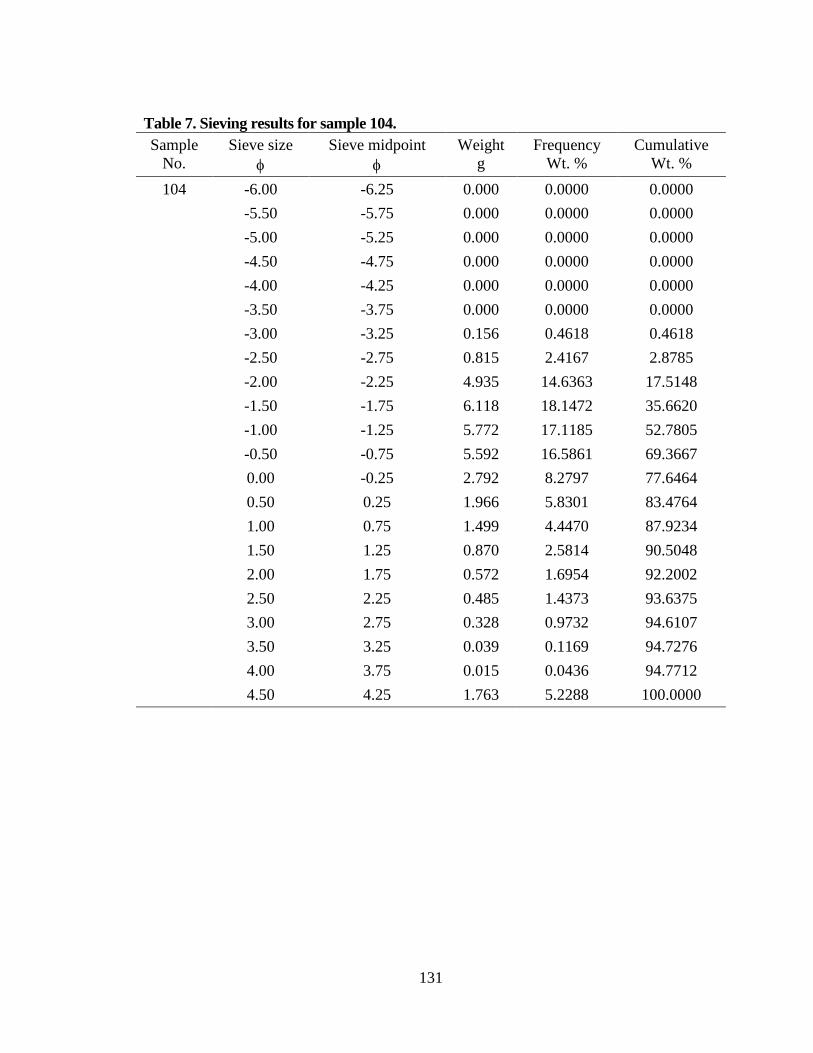
131
Table 7. Sieving results for sample 104. Sample
No. Sieve size
φ Sieve midpoint
φ Weight
g Frequency
Wt. % Cumulative
Wt. %
104 -6.00 -6.25 0.000 0.0000 0.0000
-5.50 -5.75 0.000 0.0000 0.0000
-5.00 -5.25 0.000 0.0000 0.0000
-4.50 -4.75 0.000 0.0000 0.0000
-4.00 -4.25 0.000 0.0000 0.0000
-3.50 -3.75 0.000 0.0000 0.0000
-3.00 -3.25 0.156 0.4618 0.4618
-2.50 -2.75 0.815 2.4167 2.8785
-2.00 -2.25 4.935 14.6363 17.5148
-1.50 -1.75 6.118 18.1472 35.6620
-1.00 -1.25 5.772 17.1185 52.7805
-0.50 -0.75 5.592 16.5861 69.3667
0.00 -0.25 2.792 8.2797 77.6464
0.50 0.25 1.966 5.8301 83.4764
1.00 0.75 1.499 4.4470 87.9234
1.50 1.25 0.870 2.5814 90.5048
2.00 1.75 0.572 1.6954 92.2002
2.50 2.25 0.485 1.4373 93.6375
3.00 2.75 0.328 0.9732 94.6107
3.50 3.25 0.039 0.1169 94.7276
4.00 3.75 0.015 0.0436 94.7712
4.50 4.25 1.763 5.2288 100.0000
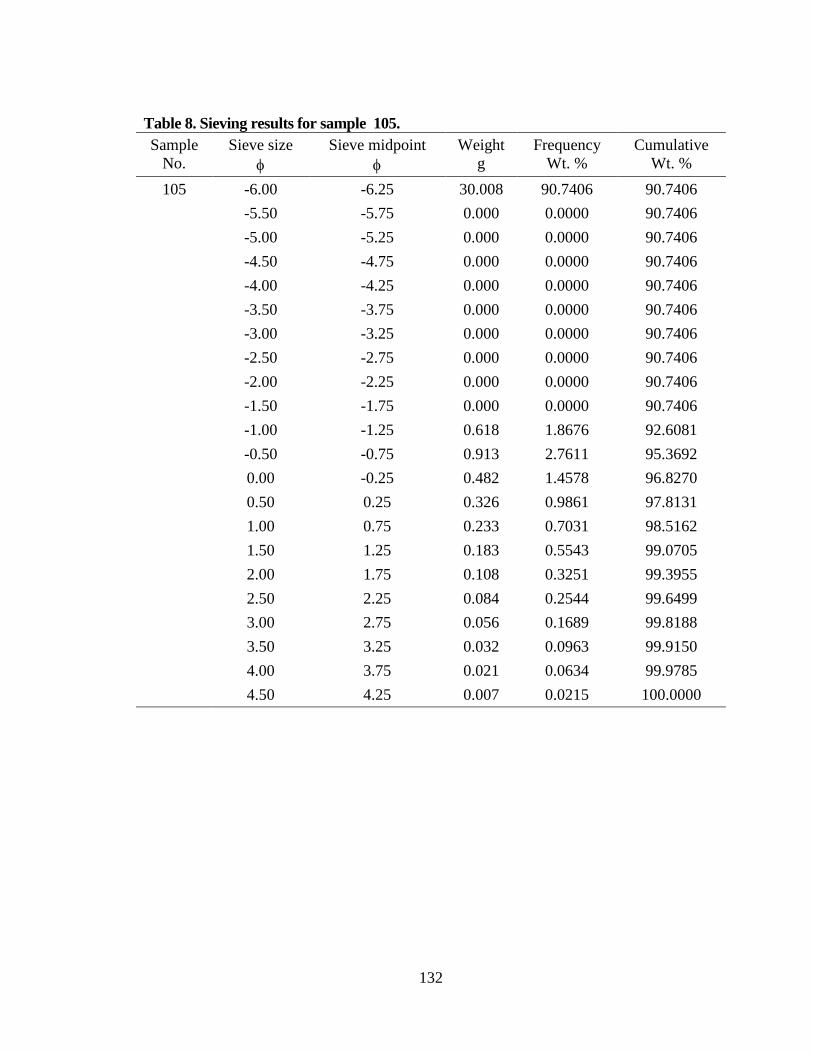
132
Table 8. Sieving results for sample 105. Sample
No. Sieve size
φ Sieve midpoint
φ Weight
g Frequency
Wt. % Cumulative
Wt. %
105 -6.00 -6.25 30.008 90.7406 90.7406
-5.50 -5.75 0.000 0.0000 90.7406
-5.00 -5.25 0.000 0.0000 90.7406
-4.50 -4.75 0.000 0.0000 90.7406
-4.00 -4.25 0.000 0.0000 90.7406
-3.50 -3.75 0.000 0.0000 90.7406
-3.00 -3.25 0.000 0.0000 90.7406
-2.50 -2.75 0.000 0.0000 90.7406
-2.00 -2.25 0.000 0.0000 90.7406
-1.50 -1.75 0.000 0.0000 90.7406
-1.00 -1.25 0.618 1.8676 92.6081
-0.50 -0.75 0.913 2.7611 95.3692
0.00 -0.25 0.482 1.4578 96.8270
0.50 0.25 0.326 0.9861 97.8131
1.00 0.75 0.233 0.7031 98.5162
1.50 1.25 0.183 0.5543 99.0705
2.00 1.75 0.108 0.3251 99.3955
2.50 2.25 0.084 0.2544 99.6499
3.00 2.75 0.056 0.1689 99.8188
3.50 3.25 0.032 0.0963 99.9150
4.00 3.75 0.021 0.0634 99.9785
4.50 4.25 0.007 0.0215 100.0000
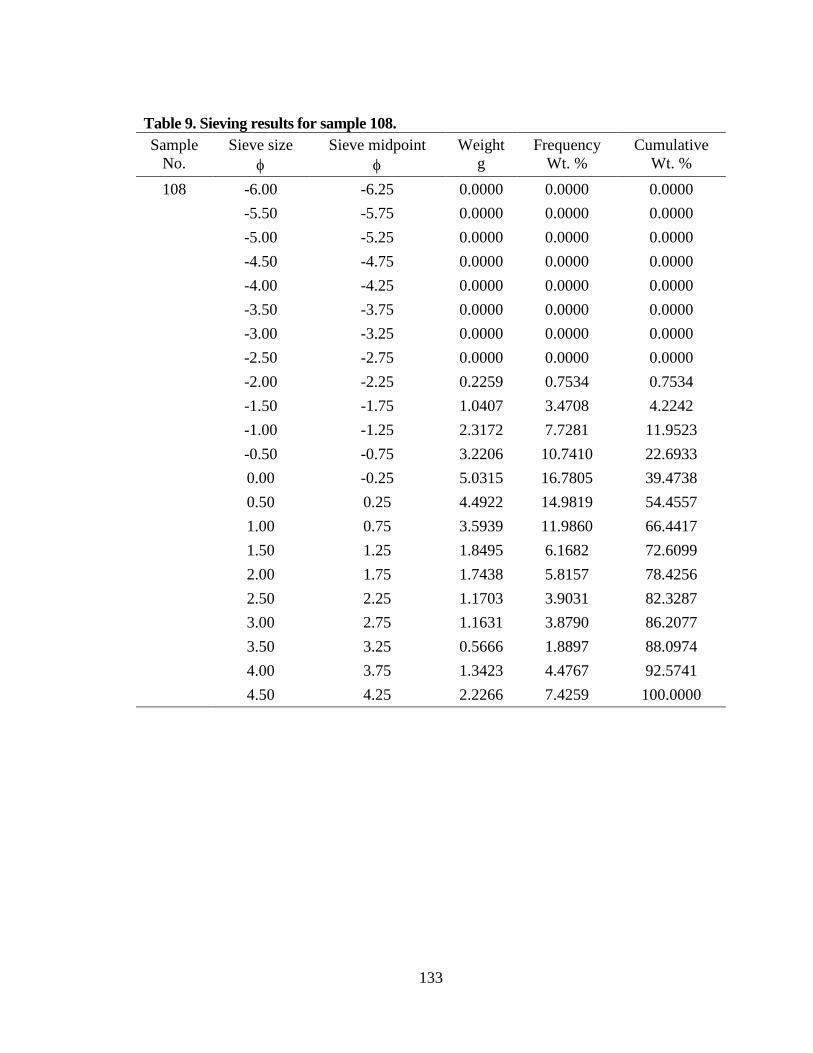
133
Table 9. Sieving results for sample 108. Sample
No. Sieve size
φ Sieve midpoint
φ Weight
g Frequency
Wt. % Cumulative
Wt. %
108 -6.00 -6.25 0.0000 0.0000 0.0000
-5.50 -5.75 0.0000 0.0000 0.0000
-5.00 -5.25 0.0000 0.0000 0.0000
-4.50 -4.75 0.0000 0.0000 0.0000
-4.00 -4.25 0.0000 0.0000 0.0000
-3.50 -3.75 0.0000 0.0000 0.0000
-3.00 -3.25 0.0000 0.0000 0.0000
-2.50 -2.75 0.0000 0.0000 0.0000
-2.00 -2.25 0.2259 0.7534 0.7534
-1.50 -1.75 1.0407 3.4708 4.2242
-1.00 -1.25 2.3172 7.7281 11.9523
-0.50 -0.75 3.2206 10.7410 22.6933
0.00 -0.25 5.0315 16.7805 39.4738
0.50 0.25 4.4922 14.9819 54.4557
1.00 0.75 3.5939 11.9860 66.4417
1.50 1.25 1.8495 6.1682 72.6099
2.00 1.75 1.7438 5.8157 78.4256
2.50 2.25 1.1703 3.9031 82.3287
3.00 2.75 1.1631 3.8790 86.2077
3.50 3.25 0.5666 1.8897 88.0974
4.00 3.75 1.3423 4.4767 92.5741
4.50 4.25 2.2266 7.4259 100.0000

134
Table 10. Sieving results for sample 109. Sample
No. Sieve size
φ Sieve midpoint
φ Weight
g Frequency
Wt. % Cumulative
Wt. %
109 -6.00 -6.25 0.000 0.0000 0.0000
-5.50 -5.75 0.000 0.0000 0.0000
-5.00 -5.25 0.000 0.0000 0.0000
-4.50 -4.75 0.000 0.0000 0.0000
-4.00 -4.25 0.000 0.0000 0.0000
-3.50 -3.75 0.000 0.0000 0.0000
-3.00 -3.25 0.000 0.0000 0.0000
-2.50 -2.75 0.000 0.0000 0.0000
-2.00 -2.25 0.344 1.0394 1.0394
-1.50 -1.75 1.521 4.5959 5.6353
-1.00 -1.25 3.106 9.3852 15.0205
-0.50 -0.75 5.880 17.7678 32.7883
0.00 -0.25 5.679 17.1601 49.9485
0.50 0.25 4.322 13.0604 63.0089
1.00 0.75 3.438 10.3884 73.3973
1.50 1.25 1.914 5.7828 79.1800
2.00 1.75 1.186 3.5849 82.7649
2.50 2.25 0.928 2.8032 85.5681
3.00 2.75 0.704 2.1263 87.6944
3.50 3.25 0.504 1.5235 89.2179
4.00 3.75 0.489 1.4776 90.6955
4.50 4.25 3.079 9.3045 100.0000

135
Table 11. Sieving results for sample 110. Sample
No. Sieve size
φ Sieve midpoint
φ Weight
g Frequency
Wt. % Cumulative
Wt. %
110 -6.00 -6.25 0.000 0.0000 0.0000
-5.50 -5.75 0.000 0.0000 0.0000
-5.00 -5.25 0.000 0.0000 0.0000
-4.50 -4.75 0.000 0.0000 0.0000
-4.00 -4.25 0.000 0.0000 0.0000
-3.50 -3.75 0.000 0.0000 0.0000
-3.00 -3.25 0.000 0.0000 0.0000
-2.50 -2.75 0.1878 0.5714 0.5714
-2.00 -2.25 1.9723 6.0009 6.5722
-1.50 -1.75 3.5268 10.7305 17.3028
-1.00 -1.25 4.0713 12.3872 29.6900
-0.50 -0.75 4.574 13.9167 43.6067
0.00 -0.25 4.3756 13.3130 56.9197
0.50 0.25 3.5637 10.8428 67.7625
1.00 0.75 2.8431 8.6503 76.4128
1.50 1.25 1.5787 4.8033 81.2161
2.00 1.75 0.9699 2.9510 84.1671
2.50 2.25 0.7652 2.3282 86.4953
3.00 2.75 0.5792 1.7623 88.2575
3.50 3.25 0.3971 1.2082 89.4657
4.00 3.75 0.3424 1.0418 90.5075
4.50 4.25 3.1199 9.4925 100.0000

136
Table 12. Sieving results for sample 112. Sample
No. Sieve size
φ Sieve midpoint
φ Weight
g Frequency
Wt. % Cumulative
Wt. %
112 -6.00 -6.25 0.000 0.0000 0.0000
-5.50 -5.75 0.000 0.0000 0.0000
-5.00 -5.25 0.000 0.0000 0.0000
-4.50 -4.75 0.000 0.0000 0.0000
-4.00 -4.25 0.000 0.0000 0.0000
-3.50 -3.75 1.6882 5.3182 5.3182
-3.00 -3.25 3.5903 11.3102 16.6283
-2.50 -2.75 2.863 9.0190 25.6474
-2.00 -2.25 1.9044 5.9992 31.6466
-1.50 -1.75 2.7549 8.6785 40.3251
-1.00 -1.25 2.6557 8.3660 48.6911
-0.50 -0.75 2.5988 8.1867 56.8778
0.00 -0.25 3.1926 10.0573 66.9352
0.50 0.25 2.1219 6.6844 73.6196
1.00 0.75 1.8324 5.7724 79.3920
1.50 1.25 0.9765 3.0762 82.4682
2.00 1.75 0.9509 2.9955 85.4637
2.50 2.25 1.0823 3.4095 88.8732
3.00 2.75 0.7259 2.2867 91.1599
3.50 3.25 0.6468 2.0376 93.1975
4.00 3.75 0.9441 2.9741 96.1716
4.50 4.25 1.2153 3.8284 100.0000

137
Table 13. Sieving results for sample 113. Sample
No. Sieve size
φ Sieve midpoint
φ Weight
g Frequency
Wt. % Cumulative
Wt. %
113 -6.00 -6.25 0.000 0.0000 0.0000
-5.50 -5.75 0.000 0.0000 0.0000
-5.00 -5.25 0.000 0.0000 0.0000
-4.50 -4.75 0.000 0.0000 0.0000
-4.00 -4.25 0.000 0.0000 0.0000
-3.50 -3.75 4.2342 13.2430 13.2430
-3.00 -3.25 2.8611 8.9485 22.1915
-2.50 -2.75 5.7943 18.1224 40.3139
-2.00 -2.25 3.7942 11.8669 52.1807
-1.50 -1.75 3.8768 12.1252 64.3059
-1.00 -1.25 2.7372 8.5609 72.8669
-0.50 -0.75 2.0717 6.4795 79.3464
0.00 -0.25 1.7566 5.4940 84.8404
0.50 0.25 1.0515 3.2887 88.1291
1.00 0.75 0.921 2.8805 91.0096
1.50 1.25 0.4435 1.3871 92.3967
2.00 1.75 0.3564 1.1147 93.5114
2.50 2.25 0.1565 0.4895 94.0009
3.00 2.75 0.3877 1.2126 95.2135
3.50 3.25 0.2133 0.6671 95.8806
4.00 3.75 0.589 1.8422 97.7228
4.50 4.25 0.7281 2.2772 100.0000
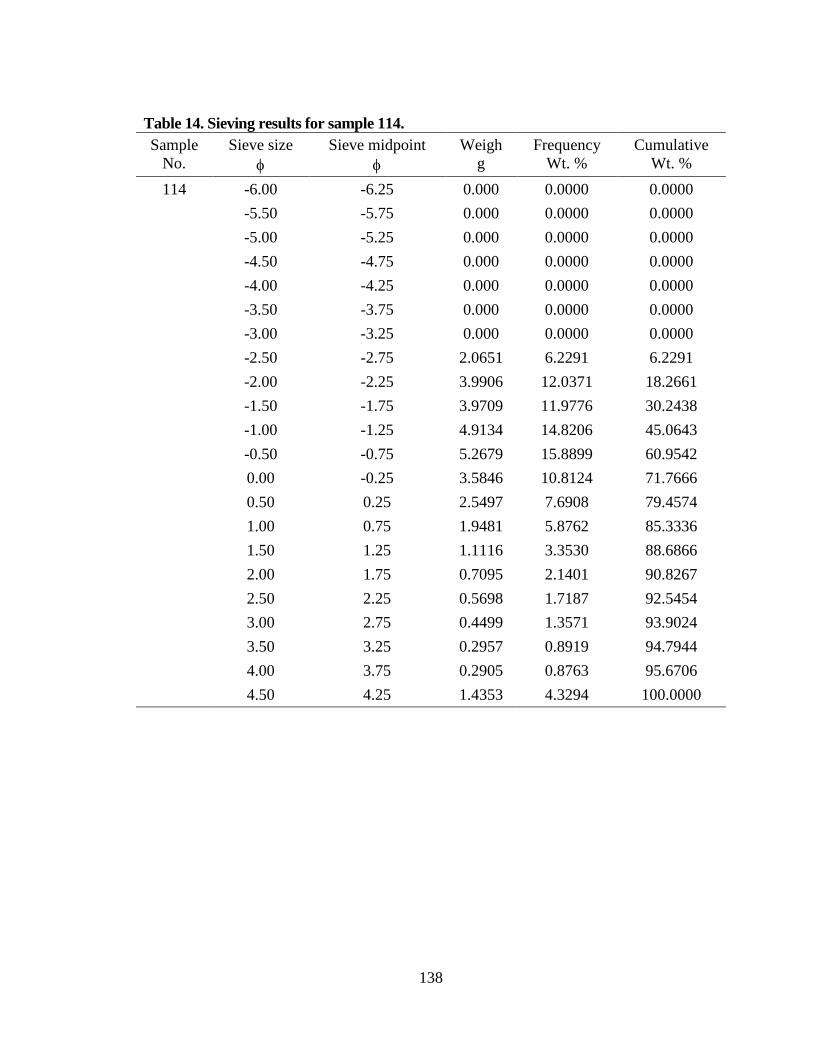
138
Table 14. Sieving results for sample 114. Sample
No. Sieve size
φ Sieve midpoint
φ Weigh
g Frequency
Wt. % Cumulative
Wt. %
114 -6.00 -6.25 0.000 0.0000 0.0000
-5.50 -5.75 0.000 0.0000 0.0000
-5.00 -5.25 0.000 0.0000 0.0000
-4.50 -4.75 0.000 0.0000 0.0000
-4.00 -4.25 0.000 0.0000 0.0000
-3.50 -3.75 0.000 0.0000 0.0000
-3.00 -3.25 0.000 0.0000 0.0000
-2.50 -2.75 2.0651 6.2291 6.2291
-2.00 -2.25 3.9906 12.0371 18.2661
-1.50 -1.75 3.9709 11.9776 30.2438
-1.00 -1.25 4.9134 14.8206 45.0643
-0.50 -0.75 5.2679 15.8899 60.9542
0.00 -0.25 3.5846 10.8124 71.7666
0.50 0.25 2.5497 7.6908 79.4574
1.00 0.75 1.9481 5.8762 85.3336
1.50 1.25 1.1116 3.3530 88.6866
2.00 1.75 0.7095 2.1401 90.8267
2.50 2.25 0.5698 1.7187 92.5454
3.00 2.75 0.4499 1.3571 93.9024
3.50 3.25 0.2957 0.8919 94.7944
4.00 3.75 0.2905 0.8763 95.6706
4.50 4.25 1.4353 4.3294 100.0000

139
Table 15. Sieving results for sample 416. Sample
No. Sieve size
φ Sieve midpoint
φ Weight
g Frequency
Wt. % Cumulative
Wt. %
416 -6.00 -6.25 0.000 0.0000 0.0000
-5.50 -5.75 0.000 0.0000 0.0000
-5.00 -5.25 0.000 0.0000 0.0000
-4.50 -4.75 0.000 0.0000 0.0000
-4.00 -4.25 0.000 0.0000 0.0000
-3.50 -3.75 0.000 0.0000 0.0000
-3.00 -3.25 0.000 0.0000 0.0000
-2.50 -2.75 0.102 0.2905 0.2905
-2.00 -2.25 1.964 5.5716 5.8621
-1.50 -1.75 3.298 9.3573 15.2194
-1.00 -1.25 4.243 12.0365 27.2559
-0.50 -0.75 5.498 15.5973 42.8532
0.00 -0.25 4.544 12.8919 55.7451
0.50 0.25 4.125 11.7038 67.4488
1.00 0.75 3.591 10.1880 77.6368
1.50 1.25 2.781 7.8891 85.5259
2.00 1.75 1.641 4.6558 90.1817
2.50 2.25 0.867 2.4597 92.6414
3.00 2.75 0.563 1.5967 94.2381
3.50 3.25 0.650 1.8435 96.0815
4.00 3.75 0.787 2.2339 98.3154
4.50 4.25 0.594 1.6846 100.0000

140
Table 16. Sieving results for sample 417. Sample
No. Sieve size
φ Sieve midpoint
φ Weight
g Frequency
Wt. % Cumulative
Wt. %
417 -6.00 -6.25 0.0000 0.0000 0.0000
-5.50 -5.75 0.0000 0.0000 0.0000
-5.00 -5.25 0.0000 0.0000 0.0000
-4.50 -4.75 0.0000 0.0000 0.0000
-4.00 -4.25 0.0000 0.0000 0.0000
-3.50 -3.75 0.0000 0.0000 0.0000
-3.00 -3.25 0.0000 0.0000 0.0000
-2.50 -2.75 0.0000 0.0000 0.0000
-2.00 -2.25 5.8815 16.6805 16.6805
-1.50 -1.75 6.4723 18.3561 35.0366
-1.00 -1.25 6.1721 17.5047 52.5413
-0.50 -0.75 5.1205 14.5222 67.0635
0.00 -0.25 2.8885 8.1921 75.2556
0.50 0.25 1.8171 5.1535 80.4091
1.00 0.75 1.6621 4.7139 85.1230
1.50 1.25 1.2735 3.6118 88.7347
2.00 1.75 0.9298 2.6370 91.3717
2.50 2.25 0.7823 2.2187 93.5904
3.00 2.75 0.4398 1.2473 94.8377
3.50 3.25 0.4238 1.2019 96.0397
4.00 3.75 0.5050 1.4322 97.4719
4.50 4.25 0.8914 2.5281 100.0000

141
Table 17. Sieving results for sample 422. Sample
No. Sieve size
φ Sieve midpoint
φ Weight
g Frequency
Wt. % Cumulative
Wt. %
422 -6.00 -6.25 0.0000 0.0000 0.0000
-5.50 -5.75 0.0000 0.0000 0.0000
-5.00 -5.25 0.0000 0.0000 0.0000
-4.50 -4.75 0.0000 0.0000 0.0000
-4.00 -4.25 0.0000 0.0000 0.0000
-3.50 -3.75 0.0000 0.0000 0.0000
-3.00 -3.25 0.0000 0.0000 0.0000
-2.50 -2.75 1.8991 5.6873 5.6873
-2.00 -2.25 4.5516 13.6309 19.3182
-1.50 -1.75 5.2949 15.8568 35.1750
-1.00 -1.25 5.5972 16.7621 51.9371
-0.50 -0.75 3.667 10.9817 62.9189
0.00 -0.25 3.3759 10.1099 73.0288
0.50 0.25 2.1837 6.5396 79.5684
1.00 0.75 2.4821 7.4332 87.0016
1.50 1.25 1.3443 4.0258 91.0275
2.00 1.75 0.9061 2.7135 93.7410
2.50 2.25 0.6628 1.9849 95.7259
3.00 2.75 0.3638 1.0895 96.8154
3.50 3.25 0.16 0.4792 97.2946
4.00 3.75 0.211 0.6319 97.9264
4.50 4.25 0.6924 2.0736 100.0000
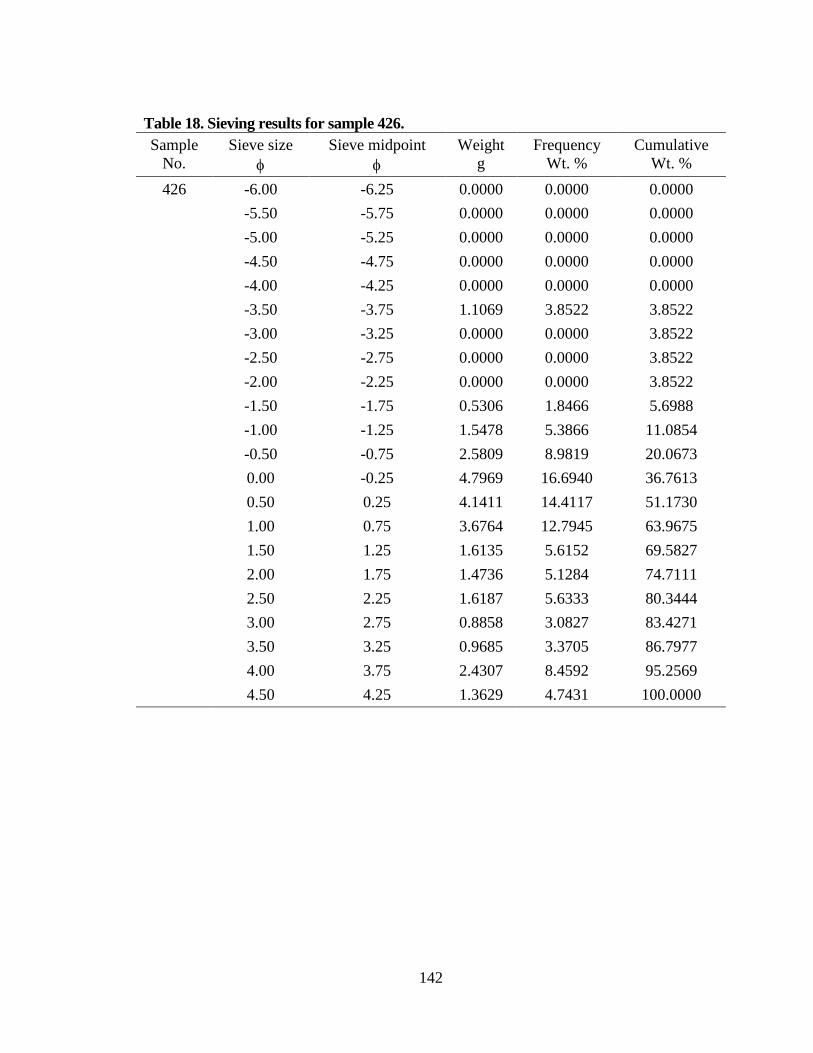
142
Table 18. Sieving results for sample 426. Sample
No. Sieve size
φ Sieve midpoint
φ Weight
g Frequency
Wt. % Cumulative
Wt. %
426 -6.00 -6.25 0.0000 0.0000 0.0000
-5.50 -5.75 0.0000 0.0000 0.0000
-5.00 -5.25 0.0000 0.0000 0.0000
-4.50 -4.75 0.0000 0.0000 0.0000
-4.00 -4.25 0.0000 0.0000 0.0000
-3.50 -3.75 1.1069 3.8522 3.8522
-3.00 -3.25 0.0000 0.0000 3.8522
-2.50 -2.75 0.0000 0.0000 3.8522
-2.00 -2.25 0.0000 0.0000 3.8522
-1.50 -1.75 0.5306 1.8466 5.6988
-1.00 -1.25 1.5478 5.3866 11.0854
-0.50 -0.75 2.5809 8.9819 20.0673
0.00 -0.25 4.7969 16.6940 36.7613
0.50 0.25 4.1411 14.4117 51.1730
1.00 0.75 3.6764 12.7945 63.9675
1.50 1.25 1.6135 5.6152 69.5827
2.00 1.75 1.4736 5.1284 74.7111
2.50 2.25 1.6187 5.6333 80.3444
3.00 2.75 0.8858 3.0827 83.4271
3.50 3.25 0.9685 3.3705 86.7977
4.00 3.75 2.4307 8.4592 95.2569
4.50 4.25 1.3629 4.7431 100.0000
143
VITA
Graduate College University of Nevada, Las Vegas
Audrey Hughes Rager
Degrees
Bachelor of Arts, Anthropology, 1989 University of Colorado, Boulder Master of Science, Earth Science, 2003 Emporia State University
Special Honors and Awards
Nevada Space Grant Fellowship Fall 2004, Spring 2005, Fall 2005, Spring 2006, Spring 2007, Fall 2008
Bernarda E. French Scholarship Barton Family Scholarship UNLV Graduate and Professional Student Association Grant Desert Space Grant JPL/NASA Planetary Science Summer School, 2005
Publications Rager, A. H., Scheu, B.E., Smith, E.I., and Dingwell, D.B, (Submitted), The effects of
water vaporization on rock fragmentation during rapid decompression: Implications for the formation of fluidized ejecta on Mars, *Submitted to GSA Bulletin, December 2010.
Rager, A. H., Scheu, B.E., Smith, E.I., and Dingwell, D.B, (Submitted), How water in open pore space affects the fragmentation threshold of rocks: Implications for double layer ejecta formation, *Submitted to Journal of Geophysical Research Planets (E), December 2010.
Rager, A. H., Scheu, B.E., Smith, E.I., and Dingwell, D.B., 2009, The effect of water content on rock fragmentation during rapid decompression: Preliminary results and possible implications for the formation of fluidized ejecta, in Geological Society of America, Portland, OR.
Rager, A., and Smith, E., 2009, The effect of rapid decompression of volatiles on grain-size distribution: Implications for the morphology of Martian impact craters and water content of the target in UNLV Graduate and Professional Student Research Forum, March 28, 2009.
Rager, A., Smith, E., and Scheu, B., 2009, The effect of water content on rock fragmentation during rapid decompression: Implications for subsurface water content and fluidized ejecta on Mars in Fourth Annual Geosymposium, UNLV
144
Department of Geoscience, April 17, 2009. Rager, A., 2008, Grain-size distribution studies on Martian blueberries: A
reinterpretation of the geology of Meridiani Planum in UNLV Graduate and Professional Student Research Forum, March 29, 2008.
Rager, A., 2008, Grain-size distribution studies on Martian blueberries: A reinterpretation of the geology of Meridiani Planum and a model for the formation of fluidized ejecta in Third Annual Geosymposium, UNLV Department of Geoscience, April 18, 2008.
Rager, A. H., 2008, Proposed experiments on the effect of rapid decompression on the fragmentation of basalt with implications for the formation of Martian rampart craters in 11th Mars Craters Consortium, October 2008, Flagstaff, Arizona, U.S.A.
Rager, A., Hanley, T.R., Calvin, C., Balint, T., Santiago, D., Anderson, J., Cassidy, T., Chavez-Clemente, D., Corbett, B.M., Hammerstein, H., Letcher, A., McGowan, E.M., McMenamin, D.S., Murphy, N., Obland, M.D., Parker, J.S., Perron, T., Petro, N., Pulupa, M., Schofield, R., and Sizemore, H.G., 2006, Endurance: The rewards and challenges of landing a spacecraft on Europa, 4th International Planetary Probe Workshop, Pasadena, California.
Calvin, C., Rager, A., Balint, T., Santiago, D., Anderson, J., Cassidy, T., Chavez- Clemente, D., Corbett, B., Hanley, T., Letcher, A., McGowan, E., McMenamin, D., Murphy, N., Obland, M., Parker, J., Perron, T., Petro, N., Pulupa, M., Schofield, R., and Sizemore, H., 2005, Endurance: The rewards and challenges of landing a spacecraft on Europa, in Eos Trans. AGU,, San Francisco, CA, p. Abstract P11B-0113.
Mehaffey, M. H., Nash, M. S., Wade, T. G., Ebert, D. W., Jones, K. B., and Rager, A., 2005, Linking Land Cover and Water Quality in New York City's Water Supply Watersheds: Environmental Monitoring and Assessment, v. 107, p. 29-44.
Drushke, P., Honn, D., McKelvey, M., Nastanski, N., Rager, A., Smith, E. I., and Belliveau, R., 2004, Volcanology of the Northern Eldorado Mountains, Nevada: New evidence for the source of the Tuff of Bridge Spring?, in Geologic Society of America, Denver, CO.
Rager, A. H., 2003, Thin section analysis of temper in Patayan ceramics from Willow Beach, Arizona [M.S. thesis]: Emporia, KS, Emporia State University, 87 p.
Mehaffey, M. H., Nash, M. S., Wade, T. G., Edmonds, C. M., Ebert, D. W., Jones, K. B., and Rager, A., 2002, A landscape assessment of the Catskill/Delaware Watersheds 1975-1998: New York City's Water Supply Watersheds: U.S. Environmental Protection Agency, EPA/600/R-01/075.
Rager, A. H., Rager, H. B., and Seymour, G. R., 2002, Using Remote Sensing and GIS to identify potential clay sources for Topoc Buff Ware, Willow Beach, Arizona, in Geologic Society of America, Denver, CO.
Rager, A. H., Tinney, L., and Bice, L., 2001, Some considerations for operational remote sensing programs, in Above and Beyond 2001: EPA Remote Sensing Conference, Las Vegas, NV.
Pitchford, A. M., Rager, A. H., and Van Remortel, R., 2000, Using NEXRAD precipitation data in GIS for environmental modeling, in ESRI User's Conference, San Diego, CA.
145
Rager, A. H., 2000, Geologic and Natural Resources Applications in Remote Sensing, in Nevada Geologic Society, Southern Nevada Chapter Meeting, Las Vegas, NV.
Rautenstrauch, K. R., Rager, A. L. H., and Rakestraw, D., 1998, Winter Behavior of Desert Tortoises in Southcentral, Nevada: Journal of Wildlife Management, v. 62, no. 1, p. 98-104.
Dissertation Title:
The Interaction of Rock and Water during Shock Decompression: A Hybrid Model for Fluidized Ejecta Formation
Dissertation Examination Committee:
Chairperson, Eugene Smith, Ph.D. Committee Member, Elisabeth Hausrath, Ph.D. Committee Member, Rosaly Lopes, Ph.D. Committee Member, Adam Simon, Ph.D. Graduate Faculty Representative, Stephen Lepp, Ph.D.