Embed Size (px)
Citation preview

The International Journal of Economic Policy Studies
Volume 6 2011 Article 1
PROLIFERATION OF ANTI-DUMPING INITIATIONS AGAINST
CHINA, ITS ECONOMIC GROWTH AND SUBSIDIZED INDUSTRIES*
Kalibinuer KEYIMU
Graduate School of Economics, Nagoya University
Furo-cho, Chikusa-ku, Nagoya, Japan 464-8601
E-mail: [email protected]
ABSTRACT
This paper discusses and analyzes the proliferation of AD measures against China as protection
against its exports in relation to its rapid economic development. In order to clarify and
emphasize the rapid growth of China’s economy and its influence on the world economy, the
paper first divides the global economy into two components; world without China and China
itself by using a weighted-sum analysis approach. Then based on these two components, the
proliferation of AD measures is analyzed along with the economic growth and downturns
respectively. Chinese GDP growth rate has been rising rapidly despite growing AD measures
against its exports, and their correlation is positive, whereas the world without China case
shows a negative correlation. Based on this point, the paper focuses on the special case of China
in combination with China’s government subsidy policy as its research objective. China’s top
ten industries, which are chosen on the basis of frequency of AD measures against them, are
examined based on their domestic output and exports. The hypothesis of a strong correlation
between domestically subsidized industries and the top ten industries that faced AD measures is
examined. An approach, that involves sophisticated examination of products, industries, firms
and regions faced with AD measures, and government subsidies they received, will be adopted
respectively.
Key words: Economic growth; Anti-dumping measures; Protectionism
JEL Classification: 12
* The author would like to express her sincere appreciation to her supervisor Professor ARAYAMA,
Yuko for his guidance and insightful thoughts on the research. The author also thanks the anonymous
IJEPS reviewers for their valuable suggestions and comments that helped to improve the structure of the
paper.

Vol.6 2011
2
PROLIFERATION OF ANTI-DUMPING INITIATIONS AGAINST CHINA,
ITS ECONOMIC GROWTH AND SUBSIDIZED INDUSTRIES
1. INTRODUCTION AND BACKGROUND
In times of economic turbulence and global growth slow downs, some have advocated globalization
and more trade liberalism (Friedman, 1979; Ben-David, 1993; Bhagwati, 1999), while others have
suggested more protectionism (Corden, 1974; Helpman and Krugman, 1989; Vousden, 1990; Stiglitz,
2005). Multilateral trade liberalization is mainly about reducing tariffs so as to globalize the world
economy. Meanwhile there are exemptions for utilizing contingency measures, such as AD duties1,
countervailing duties (CVD) and Safeguards as protection mechanisms in the WTO regulations.2
Imposition of AD measures is country-specific and case-specific, namely, its application is selective.
Unlike Safeguard measures, the implementation of AD measures does not require the government to
provide offsetting concessions or consent to countermeasures taken by the trading partner. An AD
measure can be applied on a country-selective basis, and its application is discriminatory and
flexible. Whereas Safeguards can be applied on a non-discriminative3 basis called the global Most-
Favored-Nation (MFN) basis. Furthermore, the “serious injury” standard for safeguard measures is
higher than the “material injury” standard for AD measures. Therefore its investigation and
application are very costly, and easily arouse criticism. These are the main reasons for the declining
use of Safeguard measures and proliferation of AD measures. The latter is the main concern of this
paper. As for economic downturns, experience show that restrictive trade policies such as
contingency measures function as a form of insurance for external circumstances, or as an
instrument of economic adjustment. Economic adversity has been testing the policy ingenuity of
governments both at the global and domestic level.
This paper has identified the circumstances when there is an economic rationale to implement
contingency measures, such as AD and CVD measures on unfair imports based on statistical analysis
of WTO data. The paper mainly investigates the empirical evidence of real conditions both in case
1 GATT Article VI and the Agreement on Antidumping (formally the Agreement on Implementation of
Article VI of GATT 1994) provide internationally agreed rules on the conduct of antidumping
investigations and the application of antidumping measures. 2 Article XVI of GATT 1994 and Article VI of GATT 1994 deal with Subsidy and Countervailing Duty.
The countervailing duty is a “special duty levied for the purpose of offsetting any subsidy bestowed
directly or indirectly upon the manufacture, production or exports of any merchandise.” (GATT Article
VI.3). 3 Section 201 “Global Safeguard” is a good example for its non-discriminatory nature. Section 201 of
Tariff Act 1974 (Escape Clause/Safeguard). Following is a well-known example: Steel 201
safeguards were established by the USA and applied to its imports globally, not to a specific country.
http://www.stewartlaw.com/stewartandstewart/PracticesServices/TradeRemediesPractice/Section201of
theTradeActof1974/tabid/72/language/en-US/Default.aspx
http://www.usitc.gov/ext_relations/about_itc/us201.htm (visited at October 2007). As of November 2008
there are 67 AD cases, 34 Safeguard cases, and 17 Subsidy cases among 383 WTO cases in dispute.

International Journal of Economic Policy Studies
3
studies and statistical data. The frequency of protectionism during economic prosperity and
downturns is illustrated and analyzed both at the global level and with respect to China. The analysis
implies that even though there has been a substantial reduction of traditional tariffs within the
framework of WTO commitments and negotiations, the proliferation of flexible AD duties
demonstrates that they have become a substitute for traditional tariffs. Protectionism is as vital as it
has ever been. This study treated the AD duty as an incentive for changing economic behavior of
firms, and also implied that discriminative monopolists exist only in imperfect competition.
Chinese economic growth is examined and explained by employing a weighed-sum analysis
approach. This methodology helps to separate GDP growth rates and AD protectionism into two
components, and to analyze the main themes of a global case versus China’s case. Previous studies
by Corden (1971) have focused on general aspects of economics and protectionism. This paper
presents an alternative and supplementary hypothesis that subsidy, as an endogenous protection, is a
main source of the proliferation of dumping activities of China’s major export industries. Then the
hypothesis is empirically evaluated via industry-based consistent data. China’s top ten major
industries are analyzed in terms of both AD measures they face and the government subsidy
they receive. The nature and scale of the subsidy are assessed by incorporating U.S.A.
Countervailing Duty (CVD) cases against China in a comprehensive statistical framework. The
subsidies are analyzed as a factor market distortion. Industry-based specialization and
organization are used based on the international benchmark Harmonized-System4 (H-S) of tariff
classification of the World Customs Organization (WCO) associated with its specific Chapters
and Sectors for the specific products which are subject to AD duty protectionism.
2. FREQUENCY OF AD-INITIATIONS AND GDP GROWTH RATE: GLOBAL CASE
VS. CHINA’S CASE
2.1. Global business cycle and AD measure protectionism
Empirical studies show that China has become a leading dumping country and an object of anti-
dumping duties (see table1, page 7). The priority of the argument here is given to why dumping
activities are subject to AD duty protectionism. Briefly, dumping occurs if a foreign firm sells
its products at a price below what it charges in its domestic market or third countries (price
4 United States International Trade Commission (2010) By Chapter, Harmonized Tariff Schedule of the
United States, http://www.usitc.gov/tata/hts/bychapter/_1000.htm [Accessed 7.3.2010] The WTO
Agreements have also followed the H-S benchmark in their tariff and product regulations on global export
industries. The H-S is used by WTO members to classify thousands of traded products on a common
basis. The System is organized into 97 Chapters and 21 Sections plus a special one. The 21 Sections
represent major sectors of the world economy. Anti-dumping initiations and other WTO trade measures
are reported with their HS number, making them easily categorized by economic sector.

Vol.6 2011
4
discrimination), or below the cost of production. Dumping is considered as monopolistic price
discrimination, or as an oligopolistic tactic to eliminate competition, or to enforce a cartel
between international, national and regional markets. The consequences of dumping have
resulted in market segregations and distortions, income disparities and unemployment due to
unfair competition and monopolistic powers. There is no doubt that the final results of dumping
activities are economic expansion, and it requires both economists and lawyers to solve these
problems. As Joan Robinson said (Robinson 1969) “Price discrimination could not exist under
conditions of perfect competition, even if the market could be easily divided into separate parts”.
The goal of the AD agreement is to protect domestic industries from unfair competition and
monopoly.
This section analyzes World GDP growth rates without China in comparison with the total
number of AD measures among nations without China.
Figure-1: World GDP Growth Rate & WTO AD Initiations (World without China)
-2.0
-1.0
0.0
1.0
2.0
3.0
4.0
5.0
0
50
100
150
200
250
300
350
19
95
19
96
19
97
19
98
19
99
20
00
20
01
20
02
20
03
20
04
20
05
20
06
20
07
20
08
Gro
wth
Rat
e (
%)
Year
Nu
mb
er
of
AD
In
itia
tio
ns
Figure 1. World GDP Growth Rate & WTO AD Initiations(World without China)
# AD Initiations GDP Growth
Sources of data: UN Data for global GDP growth rate, WTO summary database
Figure 1 shows the frequency of AD initiations and global GDP growth rate, where both
data sources exclude China (see section c below for growth rate methodology). The AD
initiations are by all WTO members against their trading partners, except China, and the Global
GDP Growth rate also excludes China’s contribution. The figure implies that the level of macro-
economic activity has been associated with how frequently AD duties are imposed. The case of
China is shown separately below. The relationship between these two variables, global growth
rate without China and AD initiations against China, can be subjectively analyzed as a negative

International Journal of Economic Policy Studies
5
correlation, and it can also be tested by using a regression model in an objective statistical
analysis.
Figure-2: GDP Growth vs. AD Initiations (World without China)
0
50
100
150
200
250
300
350
0.0 1.0 2.0 3.0 4.0 5.0
Nu
mb
er o
f A
D In
itia
tio
ns
Real GDP Growth Rate (%)
Figure 2. GDP Growth vs. AD Initiations(World without China)
GDP Growth Linear (GDP Growth )
The simple correlation coefficient of these 2 variables is: r = -0.5. This simple correlation
coefficient between global real GDP growth rate and global AD initiations excluded 2009,
because this was an extreme case of global slowdown in GDP growth rate. By using this
correlation coefficient, the illustration shows that global GDP growth rate has been negatively
correlated with protective tariffs such as AD initiations and measures. The severe downturns of
the past 15 years are: 1997-98 (Asian financial crisis); 2001-02 (bursting of the dotcom bubble,
and terrorist attacks on the World Trade Center on 11 September 2001), and the beginning of
the current extreme global economic crisis. The use of AD initiations has risen during the global
economic downturns. The initiations can also act as a threat, and may affect firm’s “unfair”
behavior, and thus market outcomes such as “market disruption” occur, even if the relevant
legal instruments are not actually used. In this sense, protectionism policy can be treated as
something which is exogenously determined. The interpretation of this correlation data could be
that utilization of AD measures demonstrates countries’ propensities to protectionism during
economic downturns.
2.2. China’s economic growth and proliferation of AD measures against it
This section analyzes China’s relatively stable GDP growth rate in light of the AD initiations
against its exports.
Vol.6 2011
6
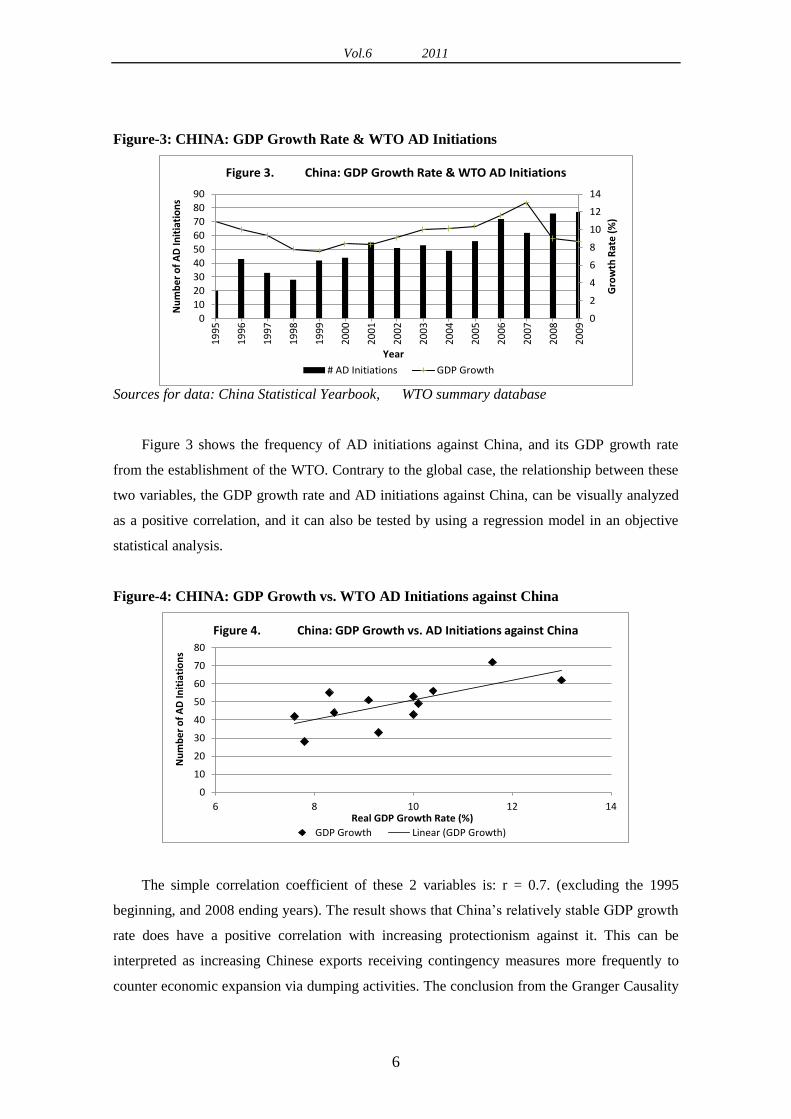
Figure-3: CHINA: GDP Growth Rate & WTO AD Initiations
0
2
4
6
8
10
12
14
0
10
20
30
40
50
60
70
80
90
1995
1996
1997
1998
1999
2000
2001
2002
2003
2004
2005
2006
2007
2008
2009
Gro
wth
Rat
e (%
)
Year
Nu
mb
er o
f A
D In
itia
tio
ns
Figure 3. China: GDP Growth Rate & WTO AD Initiations
# AD Initiations GDP Growth
Sources for data: China Statistical Yearbook, WTO summary database
Figure 3 shows the frequency of AD initiations against China, and its GDP growth rate
from the establishment of the WTO. Contrary to the global case, the relationship between these
two variables, the GDP growth rate and AD initiations against China, can be visually analyzed
as a positive correlation, and it can also be tested by using a regression model in an objective
statistical analysis.
Figure-4: CHINA: GDP Growth vs. WTO AD Initiations against China
0
10
20
30
40
50
60
70
80
6 8 10 12 14
Nu
mb
er o
f A
D In
itia
tio
ns
Real GDP Growth Rate (%)
Figure 4. China: GDP Growth vs. AD Initiations against China
GDP Growth Linear (GDP Growth)
The simple correlation coefficient of these 2 variables is: r = 0.7. (excluding the 1995
beginning, and 2008 ending years). The result shows that China’s relatively stable GDP growth
rate does have a positive correlation with increasing protectionism against it. This can be
interpreted as increasing Chinese exports receiving contingency measures more frequently to
counter economic expansion via dumping activities. The conclusion from the Granger Causality
International Journal of Economic Policy Studies
7
test for the world without China case is that the correlation values are not high enough to
indicate predictive skill. This is consistent with the evidence presented in the WTO Trade
Report (2009).
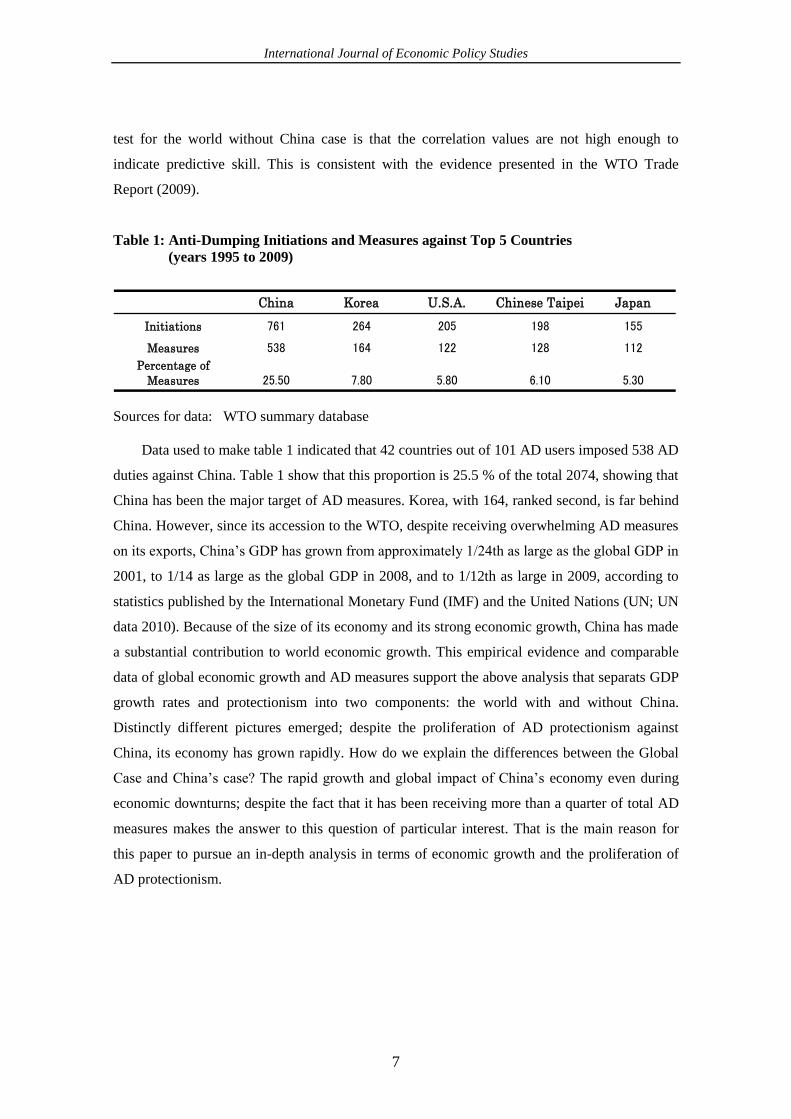
Table 1: Anti-Dumping Initiations and Measures against Top 5 Countries
(years 1995 to 2009)
China Korea U.S.A. Chinese Taipei Japan
Initiations 761 264 205 198 155
Measures 538 164 122 128 112
Percentage of
Measures 25.50 7.80 5.80 6.10 5.30
Sources for data: WTO summary database
Data used to make table 1 indicated that 42 countries out of 101 AD users imposed 538 AD
duties against China. Table 1 show that this proportion is 25.5 % of the total 2074, showing that
China has been the major target of AD measures. Korea, with 164, ranked second, is far behind
China. However, since its accession to the WTO, despite receiving overwhelming AD measures
on its exports, China’s GDP has grown from approximately 1/24th as large as the global GDP in
2001, to 1/14 as large as the global GDP in 2008, and to 1/12th as large in 2009, according to
statistics published by the International Monetary Fund (IMF) and the United Nations (UN; UN
data 2010). Because of the size of its economy and its strong economic growth, China has made
a substantial contribution to world economic growth. This empirical evidence and comparable
data of global economic growth and AD measures support the above analysis that separats GDP
growth rates and protectionism into two components: the world with and without China.
Distinctly different pictures emerged; despite the proliferation of AD protectionism against
China, its economy has grown rapidly. How do we explain the differences between the Global
Case and China’s case? The rapid growth and global impact of China’s economy even during
economic downturns; despite the fact that it has been receiving more than a quarter of total AD
measures makes the answer to this question of particular interest. That is the main reason for
this paper to pursue an in-depth analysis in terms of economic growth and the proliferation of
AD protectionism.

Vol.6 2011
8
2.3. Methodology used to separate GDP growth rates: Weighted-sum analysis approach
An estimate of Global GDP Growth Rate, excluding China was made as follows:
Basic assumption: World Real GDP growth rate can be approximated as a weighted sum of China’s
contribution and the contribution of the “World without China.”
(1)
Solve for
(2)
is the World Real GDP growth rate with China.
(weighting factor) is the ratio of China’s GDP to World GDP (China’s share of World GDP)
is China’s Real GDP growth rate.
is the “World without China” Real GDP growth rate.
Table 2: World and China’s real GDP growth rates
Symbol
China’s
share of
world real
GDP
China’s real
GDP growth
rate (%)
World real
GDP growth
rate with
China (%)
World real GDP
growth rate
without China
(%)
China’s
“ascendancy”
in world GDP
growth rate
(%)2001 1/24 8.30 1.50 1.20 0.30
2008 1/14 9.00 2.00 1.46 0.542009 1/12 8.70 -0.80 -1.68 0.88
Sources: IMF and UN data (2010)
The empirical data in table 2 provides quantitative evidence of China’s emergence as a
global economic power, and its growing to dominance in the international market. Abundant
materials have indicated that there is no precedent for economic ascendancy as rapid as that of
China, whether measured by its speed or value. Such an extraordinary transformation was
probably unimaginable in the earlier days of China’s reform and its WTO accession. Optimistic
views by economists (Lin, Cai and Li, 1995) explicitly demonstrated that the “China Miracle” is
mainly due to its comparative advantage-oriented development strategy, which improves
efficiency and raises output. Garnaut (2006) and Lin (2002) estimated that China would likely
overtake the USA to become the world’s largest economy by 2020. Cooperation with the
Chinese government is important for the USA to arrest the downward spiral resulting from its
financial crisis. And the USA and China are pursuing coordinated approaches toward global
issues though formal and informal “G-2” mechanisms (Bergsten et al., 2008; Zoellick and Lin,

International Journal of Economic Policy Studies
9
2009). At the other extreme, pessimists began to assume and believe that problems such as
income inequality, bad financial assets, lack of intellectual property rights, environmental
degradation, and corruption will result in an imminent collapse of China (Chang, 2001; Pei,
2006). Uneven growth as a macroeconomic aspect may undermine the sustainability of China’s
economic growth in the near future (Chaudhuri and Ravallion, 2006). China exported its
potential unemployment by practicing predatory pricing and dumping activities based on low-
labor costs and state subsidies (Sarma and Lich, JEPA Nov, 2010). In general, the sustainability
of the breakneck ascendancy and growth of China have become an interesting and difficult topic
of major international debate.
Trade openness and accession to the WTO contributed to rapid economic growth in China
in terms of its total value of goods and services. Because of the Chinese special political status,
this spectacular growth has been achieved by its centralized form of government and low labor
costs. Just as Keynes pointed out in his foreword to the German translation of the General
Theory: “the theory of aggregated production, which is the point of the General Theory,…can
be much easier adapted to the conditions of a totalitarian state [eines totalen Staates] than the
theory of production and distribution of a given production put forth under conditions of free
competition and a large degree of laissez-faire.” By “aggregated production,” he seems to have
meant private plus government production, the latter being particularly important in a
depression to take up the slack created by the drop in private demand for goods and services.
The centralized form minimizes redundancy, maximizes top-down control, and is optimal for
relatively simple, mature production processes that do not require constant innovation and
flexible adaptation to a rapidly changing economic environment. Opposite to centralized forms,
representative democracies are designed to diffuse rather than concentrate political power. The
decentralized form of management accepts redundancy and loss of tight control as the price for
fostering innovation and adaptation by granting a considerable measure of autonomy to its
industries. In this sense, autocracy is more conducive than democracy to economic growth at
least in the short-run. In this sense, centralized forms would have less social costs in their
administrative systems than decentralized forms. Low social cost will be supportive to gain
economic ascendancy.
3. CHINA’S INDUSTRIES AND AD MEASURES
In order to explain and document domestic economic structures in which China’s dumping
activities are formulated, it is necessary to analyze its specific industries statistically. The
priority is given to all China’s industries which are subject to AD measure protectionism in

Vol.6 2011
10
international trade. China’s export industries are categorized by international WCO H-S Sectors
of tariff classification for products as a global benchmark. In addition, the China Statistical
Yearbook reports domestic and export economic activity for the H-S economic sectors. These
factors were used in this study to analyze patterns of economic and anti-dumping activities
within China’s industries.
Table 3: AD Measures Against China; All Industries; year-by-year and totals;
2000-to-2009
Industry Name
WT
O.H
S
Ch
ap
ters
WT
O H
S-
Secto
r
20
00
20
01
20
02
20
03
20
04
20
05
20
06
20
07
20
08
20
09 Tota
l
Animal 1-5 I 1 1
Vegetable 6-14 II 1 2 1 1 5
Oil/Fat 15 III 0
Foodstuff 16-24 IV 1 2 1 2 1 7
Mineral 25-27 V 1 1 2 4
Chemical 28-38 VI 7 6 7 10 12 9 3 6 16 5 81
Plastic/Rubber 39-40 VII 2 6 3 4 3 4 5 1 28
Leather 41-43 VIII 1 1
Wood 44-46 IX 1 1 2 1 1 6
Wood pulp 47-49 X 2 1 2 2 2 9
Textiles 50-63 XI 1 3 1 1 8 6 3 3 7 33
Footwear 64-67 XII 2 2 1 1 6
Stone/Cement 68-70 XIII 1 2 2 1 2 1 3 2 2 16
Precious Metals 71 XIV 0
Base Metals 72-83 XV 4 6 6 14 7 6 2 3 8 18 74
Machinery 84-85 XVI 2 3 3 3 2 3 2 3 4 9 34
Vehicles 86-89 XVII 1 3 2 1 7
Instruments 90-92 XVIII 1 1 1 1 1 5
Arms 93 XIX 0
Furniture/Toys 94-96 XX 3 1 7 2 6 2 2 23
Art 97 XXI 0
Special 98-99 … 0
Total 23 23 32 42 39 39 25 27 44 46 340

International Journal of Economic Policy Studies
11
Table 3 shows the number of AD measures received by all sectors (all industries), as
defined by the WTO H-S benchmark associated with its Chapters and Sectors for the specific
products. Sources for tables 3, 4 and 5 are the Global Antidumping Database (Bown, 2010) and
WTO summary database (2010). This information is shown by year and by number of AD
measures. The evidence shows that the AD measures are concentrated in certain sectors:
chemicals, base metals and machinery, etc. Based on these sectors, it is convenient to sellect the
top ten industries which are frequently subject to AD measures.
Table 4: AD Measures Against China: Top Ten Industries; year-by-year and totals;
2000-to-2009
Industry Name
WT
O.H
S
Ch
ap
ters
WT
O H
S-
Sect
or
20
00
20
01
20
02
20
03
20
04
20
05
20
06
20
07
20
08
20
09 Tota
l
Chemical 28-38 VI 7 6 7 10 12 9 3 6 16 5 81
Base Metals 72-83 XV 4 6 6 14 7 6 2 3 8 18 74
Machinery 84-85 XVI 2 3 3 3 2 3 2 3 4 9 34
Textiles 50-63 XI 1 3 1 1 8 6 3 3 7 33
Plastic/Rubber 39-40 XI 2 6 3 4 3 4 5 1 28
Furniture/Toys 94-96 XX 3 1 7 2 6 2 2 23
Stone/Cement 68-70 XIII 1 2 2 1 2 1 3 2 2 16
Wood Pulp 47-49 X 2 1 2 2 2 9
Foodstuff 16-24 IV 1 2 1 2 1 7
Vehicles 86-89 XVII 1 3 2 1 7
Total 18 19 32 41 35 36 21 24 41 45 312
Table 4 shows 312 measures for the top ten sectors, whereas table 3 showed 340 measures
for all 22 sectors. The top ten sectors’ share of all industries’ AD duties is 91.8 %, although they
represent only 45% of the total 22 sectors. The analysis is next extended in terms of the average
tariff rates for each sector, their export and output values, and the ratio of exports to output
values.

Vol.6 2011
12
Table 5: Average AD Duty Rates (%) Against Top Ten * Chinese Industries; 2000-to-2009
Industry Name
WT
O.H
S
Ch
ap
ters
WT
O H
S-
Sect
or
20
00
20
01
20
02
20
03
20
04
20
05
20
06
20
07
20
08
20
09 Tota
l
Chemical 28-38 VI 142 25 147 115 155 35 116 103 115 106
Base Metals 72-83 XV 50 176 23 80 81 38 47 8 119 95 72
Machinery 84-85 XVI 29 66 94 25 64 131 144 79
Textiles 50-63 XI 87 70 50 264 44 65 10 84
Plastic/Rubber 39-40 XI 46 50 32 18 38 107 48
Furniture/Toys 94-96 XX 69 304 198 86 164
Stone/Cement 68-70 XIII
Wood Pulp 47-49 X 165 190 258 53 166
Foodstuff 16-24 IV 52 184 118
Vehicles 86-89 XVII 384 30 207
Average% 68 128 71 91 187 108 108 50 96 90 100
Table 5 lists average AD duties that were calculated for several products in several
chapters of specific sectors. In Sector XIII, Stone/Cement industries’ cases there were 16 price
undertakings5 other than AD duties for Chinese export firms. Even though the average AD
duties rates are highly variable for each year, they are rather significant.
Table 6: Gross Industrial Output Value (USD 100 million) of China; Top Ten Industries;
2000-to-2008
Industry Name
WT
O.H
S
Ch
ap
ters
WT
O H
S-
Sect
or
20
00
20
01
20
02
20
03
20
04
20
05
20
06
20
07
20
08 Tota
l
Chemical 28-38 VI 1769 1686 1873 2394 3441 4283 5523 7561 9428 37958
Base Metals 72-83 XV 1266 1320 1496 2106 3614 4374 5908 8665 11120 39869
Machinery 84-85 XVI 2443 2544 3059 4147 6339 7179 9408 12942 16014 64075
Textiles 50-63 XI 1177 1183 1339 1622 2351 2567 3230 4318 5057 22844
Plastic/Rubber 39-40 XI 363 366 429 529 882 883 1149 1589 1946 8136
Furniture/Toys 94-96 XX 132 135 158 204 353 354 459 620 768 3183
Stone/Cement 68-70 XIII 495 486 551 683 1202 1118 1477 2134 2886 11032
Wood Pulp 47-49 X 301 308 351 425 722 728 941 1350 1747 6873
Foodstuff 16-24 IV 1121 1117 1302 1560 2195 2472 3126 4447 5838 23177
Vehicles 86-89 XVII 719 782 1010 1355 1757 1911 2569 3723 4601 18427
Total 9786 9927 11568 15025 22856 25868 33789 47350 59405 235574
Sources: China Statistical Year Book (2001 to 2008)
5 Price undertakings function as AD duties.

International Journal of Economic Policy Studies
13
Table 6 shows that the industrial output of machinery and equipment is the biggest among
the industries which are subject to AD protectionism. In 2008, these top ten industries
accounted for 85% of all domestic industrial output.6
Table 7: Export Value (USD 100 million) of China; Top Ten Industries; 2000-to-2008
Industry Name
WT
O.H
S
Ch
ap
ters
WT
O H
S-
Sect
or
20
00
20
01
20
02
20
03
20
04
20
05
20
06
20
07
20
08 Tota
l
Chemical 28-38 VI 116 128 146 185 246 319 378 511 689 2718
Base Metals 72-83 XV 166 161 189 251 437 571 853 1155 1440 5223
Machinery 84-85 XVI 729 849 1159 1723 2478 3221 4140 5288 6108 25695
Textiles 50-63 XI 494 498 578 733 888 1076 1381 1658 1797 9103
Plastic/Rubber 39-40 XI 79 83 100 125 169 233 296 365 414 1864
Furniture/Toys 94-96 XX 182 189 240 295 367 470 576 690 833 3842
Stone/Cement 68-70 XIII 40 42 55 69 93 123 155 183 226 986
Wood Pulp 47-49 X 19 20 23 30 38 51 69 92 104 446
Foodstuff 16-24 IV 52 58 67 77 94 112 138 165 182 945
Vehicles 86-89 XVII 93 94 105 156 210 284 384 550 707 2583
Total 1971 2122 2664 3646 5020 6459 8371 10657 12499 53409
Sources: China Statistical Year Book (2001 to 2008)
Data in table 7 shows that machinery, textiles and base metals are the leading three
industries among exports which are subject to AD protectionism. Based on the same
methodology used in table 4, in 2008, these top ten industries accounted for 87% of all Chinese
exports.7 After combining the information from all seven tables above, the top ten industries
defined in terms of AD protectionism are also important in terms of the values of domestic
output and exports. Therefore, there is no doubt that these industries are the main pillars for
China’s economic development, and their proportions in its GDP are rather substantial.
6 Total industrial output values in 2008 were 69917.6 US dollar (100 million). China Statistical Year
Book (2001 to 2009) 7 Total industrial export values in 2008 were 14306.9 US dollar (100 million). China Statistical Year
Book (2001 to 2009)

Vol.6 2011
14
Figure-5: Growth Rates of Domestic Output and Exports: China’s Top 10 Industries
(Based on AD Measures)
0
5
10
15
20
25
30
35
40
4520
00
2001
2002
2003
2004
2005
2006
2007
2008
2009
Gro
wth
Rat
e (%
)
Year
Figure 5. Growth Rates of Domestic Output and ExportsChina's Top 10 Industries (Based on AD Measures)
exports
output
Sources: China Statistical Year Book (2001 to 2009)
Figure 5 clearly highlights the nature of China’s growth rate pattern of its domestic output
in terms of the identical industries whose exports faced AD measures. At the beginning of the
period of its WTO accession, the export growth rate of the top ten industries was higher than
their domestic output growth rate. This is consistent with and crucial to China’s “opening”
policy process as an economy with a high proportion of exports with “export-led-growth” of its
GDP. In pursuit of this objective, China’s top ten industries were designed mainly as export-
oriented industries and they have been engaged in predation in their exports. Moreover, table 4
mentioned above also demonstrates that the top ten sectors’ share, in the total 22 China’s
industries’ AD measures they received, is 91.8%, although they represent only 45% of the total
22 sectors.
Reforms over the period of 1992-2005 were an attempt to quicken the pace of economic
growth, capital accumulation and creation of employment. In this period the priority of
economic policy was mainly focused on accumulation of foreign capital. One of the obvious
examples of export incentives was the 9% export reimbursement or refund for firms’ exports.
Under this incentive policy, firms only pursued their efficiency in productivity and engaged in
“price competition” rather than “quality competition” of their exports. In this period, the
economic growth was gained by quantitative accumulation, and this development pattern can be
considered as an “exogenous development pattern”. Nevertheless, this price competition policy
resulted in cheap prices and abundant low-quality exports so as to disrupt the international
market. This was one of the main reasons for China’s exports to become very cheap in
international markets and vulnerable to AD measures.

International Journal of Economic Policy Studies
15
Figure 5 clearly shows that the growth rates of domestic output and exports of the top ten
industries have reversed after 2005 when the domestic output growth rate began to exceed the
export growth rate. Based on tables 6 and 7, in 2005, exports were 25% as large as domestic
output. In 2008, this ratio had decreased to 21 % due to increased emphasis on domestic output.
Comparing this phenomenon to the relatively stable Chinese GDP growth rate shown in figure 3,
the interpretation could be that Chinese export sectors have been increasing more slowly. After
2005, it can be considered as a transformation point for China’s exports not only competing
with price, but also competing with quality by its standardized product regulations under WTO
consistency. Economic growth was initially achieved by qualitative accumulation. The
prediction from this figure could be that China’s top ten industries’ dumping frequencies will
have a shrinking tendency in the future. The figure also implies that expanding domestic
demand by increasing domestic output, investment and income has become the main feature of
Chinese GDP growth after 2005. This development pattern can be considered as an
“endogenous development pattern” based on investment and industry-led growth in the scenario
of China’s current economic policy. The question addressed next is why China’s main export
industries engage in sales below cost so as to be vulnerable to AD measures? China has a series
of interconnected and mutually reinforcing policies, esp. in its government subsidized sector
which is considered as a main focus of domestic investment. That is the question the paper
considers next.
4. CHINA’S INDUSTRIES RECEIVE GOVERNMENT SUBSIDIES
This section takes USA CVD duties against China’s subsidized exports as empirical evidence to
reflect and assess the nature and scale of China’s government subsidies8 policy, which is
performing as a main tool in establishing state-monopoly. These subsidies have provided
China’s state-owned-enterprises (SOEs) with a significant competitive advantage vis-à-vis both
international and national markets. This section attributes the proliferation of Chinese export
firm’s dumping activities to the extensive government regime. The CVD is a special duty levied
for the purpose of offsetting any subsidy bestowed directly or indirectly upon the manufacture,
production or exports of any merchandise. In addition, an efficient government subsidy also
8 United States-China Economic and Security Review Commission reported on China’s government
subsidies to strategic industries known as “absolute control” and “heavyweight” industries. These
industries were specified in a “guiding opinion” issued by China’s State Council and State-Owned Assets
Supervision and Administration Commission (SASAC) in December 2006. The State Council is the
highest executive organ of state power, as well as the highest organ of state administration. The SASAC
manages the Chinese Communist Party’s efforts to control state-owned enterprises (SOE), while
increasing their “economic return and maintaining political returns to the government”.
Vol.6 2011
16
could correct and mitigate a market failure arising from monopoly. The CVD duties the paper is
concerned with were imposed by the USA on China’s exports from 2007 to 2010 after the
export subsidies were proven by the WTO rules. This phenomenon can be explained that China
has been using government subsidies more in the last three years than it did before. The paper
only takes the three highest subsidy rates as examples to explain and classify the types of
government subsidies.
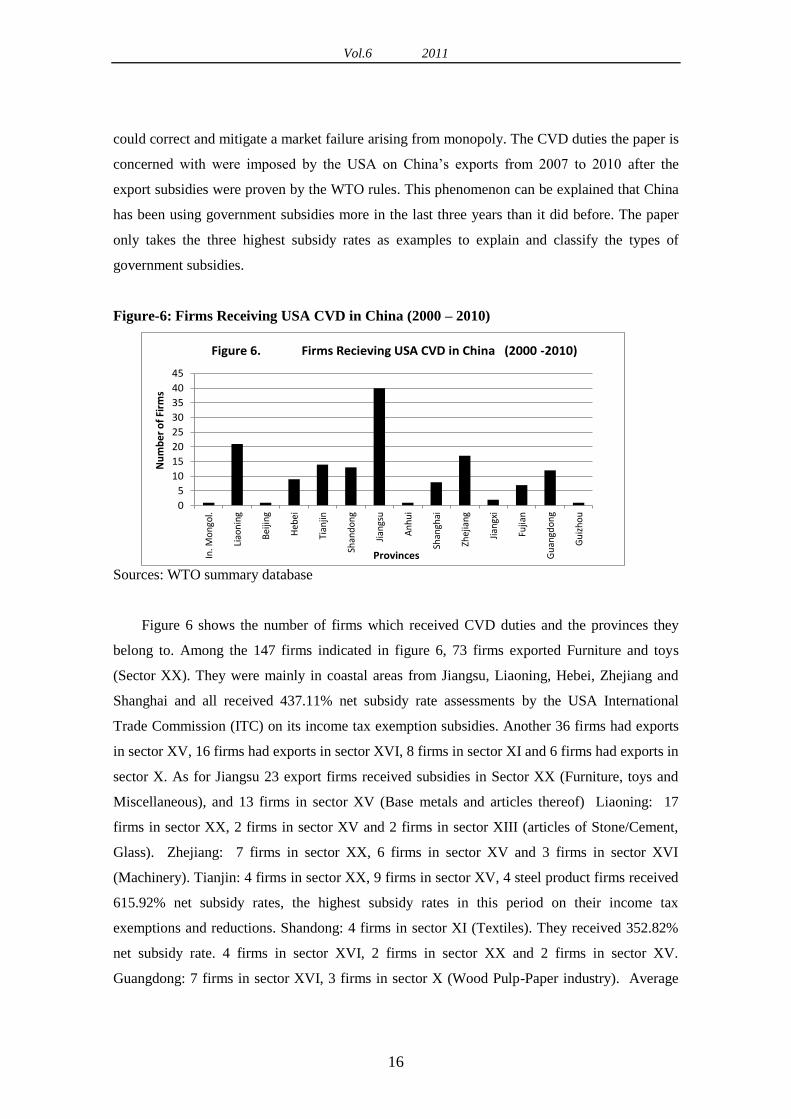
Figure-6: Firms Receiving USA CVD in China (2000 – 2010)
0
5
10
15
20
25
30
35
40
45
In. M
on
gol.
Liao
nin
g
Bei
jing
Heb
ei
Tian
jin
Shan
do
ng
Jian
gsu
An
hu
i
Shan
ghai
Zhej
ian
g
Jian
gxi
Fujia
n
Gu
angd
on
g
Gu
izh
ou
Nu
mb
er o
f Fi
rms
Provinces
Figure 6. Firms Recieving USA CVD in China (2000 -2010)
Sources: WTO summary database
Figure 6 shows the number of firms which received CVD duties and the provinces they
belong to. Among the 147 firms indicated in figure 6, 73 firms exported Furniture and toys
(Sector XX). They were mainly in coastal areas from Jiangsu, Liaoning, Hebei, Zhejiang and
Shanghai and all received 437.11% net subsidy rate assessments by the USA International
Trade Commission (ITC) on its income tax exemption subsidies. Another 36 firms had exports
in sector XV, 16 firms had exports in sector XVI, 8 firms in sector XI and 6 firms had exports in
sector X. As for Jiangsu 23 export firms received subsidies in Sector XX (Furniture, toys and
Miscellaneous), and 13 firms in sector XV (Base metals and articles thereof) Liaoning: 17
firms in sector XX, 2 firms in sector XV and 2 firms in sector XIII (articles of Stone/Cement,
Glass). Zhejiang: 7 firms in sector XX, 6 firms in sector XV and 3 firms in sector XVI
(Machinery). Tianjin: 4 firms in sector XX, 9 firms in sector XV, 4 steel product firms received
615.92% net subsidy rates, the highest subsidy rates in this period on their income tax
exemptions and reductions. Shandong: 4 firms in sector XI (Textiles). They received 352.82%
net subsidy rate. 4 firms in sector XVI, 2 firms in sector XX and 2 firms in sector XV.
Guangdong: 7 firms in sector XVI, 3 firms in sector X (Wood Pulp-Paper industry). Average

International Journal of Economic Policy Studies
17
net subsidy rates for those exports items are 239.38% based on their income tax exemption and
reduction rates9.
Table 8: Number of firms and net subsidy rates by industry
(U.S.A.CVD against China; 2000 to 2010).
Industry
Ch
em
ica
ls
Pla
sti
c
Ru
bb
er
Wood
Pu
lp
Texti
les
Sto
ne
Cem
en
t
Ba
se
Meta
ls
Ma
chin
ery
Fu
rnit
ure
Toys
Total
Location\Sector VI VII X XI XII XV XVI XX
1 In. Mongolia 1 1
2 Liaoning 2 2 17 21
3 Beijing 1 1
4 Hebei 1 8 9
5 Tianjin 1 9 4 14
6 Shandong 1 4 2 4 2 13
7 Jiangsu 1 1 1 13 1 23 40
8 Anhui 1 1
9 Shanghai 1 1 6 8
10 Zhejiang 1 6 3 7 17
11 Jiangxi 2 2
12 Fujian 1 2 4 7
13 Guangdong 3 1 7 1 12
14 Gui zhou 1 1
Total 3 3 6 8 2 36 16 73 147
Average Net
subsidy rates (%) 35.84 7.23 59.84 183.50 100.78 83.08 131.47 414.69
Sources: USA International Trade Commission (ITC)
Table 8 shows specific industries that received subsidies and the provinces they belong to.
The empirical evidence demonstrates that government subsidies have implicitly focused on
certain industries, like machinery, base metals and textiles etc. which are frequently subject to
AD duties, mentioned above in table 4. In addition to certain industries, the table also
demonstrates a regional bias character of the China’s government subsidies. In this way, the
table strongly implies that China’s “export-led growth” policy has geographical discrimination
in its domestic economic structure. This geographically polarized development pattern of China
will be a future concern of this research. The most important point here is that there is a strong
9 In addition to these subsidy cases, there is a special provincial program for Guangdong and Zhejiang to
Rebate Antidumping Fees.

Vol.6 2011
18
correlation between domestically subsidized industries and the industries which are subject to
AD measures. This correlation supports the hypothesis that subsidy, as an endogenous
protection, is a major source of the proliferation of dumping activities by China’s major
industries. And the subsidies for the top ten industries are strategic, namely, they have
facilitated predation to gain market entry. Subsidy for labor income discussed in the cases is a
factor market distortion, and results from strategic government policies. Cost reductions for
production and investment by factor market distortions are an effective way to boost production
so as to promote GDP growth, at least in the short term. Namely, this is a macroeconomic
consequence of cost distortion. It is the main cause of China’s products being so cheap in the
international market and vulnerable to AD duties. This is consistent with what Ethier (1982)
said about new dumping theory. “The modern theory considers dumping as an integral part of
the relationship between domestic factor markets and international commodity markets in a
world of uncertainty, changes in technological conditions and sluggish adjustment”. This
modern dumping theory criticizes the traditional one as excluding fundamental contemporary
problems, namely, imperfectly adjusting factor markets by changing conditions of product
demand, and completely ignoring the fundamental relationships of factor-market equilibrium.
Factor-market equilibrium analysis requires more detailed data and more sophisticated
methodologies. Low factor prices resulted in a distorted industrial structure, such as a bias
towards heavy industries, such as chemicals, base metals and machinery, as a result of cheap
capital. Another main reason for the overwhelming dumping activities of Chinese firms is that
the centralized status of China has also opened an effective way for state-owned and relation-
based private enterprises to execute their dominant and monopolistic power over domestic and
international groups, by receiving special and strategic government subsidies10
. Even though
China introduced an anti-trust law on August 1, 2008, its establishment came so late and its
enforcement has been rather random, as the government gave priority to economic growth. As
Deng Xiaoping proclaimed, “White cat, black cat, the one which can catch the mouse is the best
cat.” This philosophy became a national guideline for business entrepreneurs, and provided
them formidable encouragement and incentives, and enabled them to compete with one another
without market regulations. One of Deng’s quotes is “Let some people and some areas get rich
first, and help other people and other areas get rich together”. This regionally biased open policy
associated with government subsidies resulted in very rapid export-based economic growth in
coastal regions. In the meantime, the rapid growth also resulted in political problems such as
10
An Assessment of China’s Subsidies to Strategic and Heavyweight Industries Submitted to the
U.S.-China Economic and Security Review Commission, By Capital Trade Incorporated 1200 18th St.,
NW, Suite 601

International Journal of Economic Policy Studies
19
large income and wealth disparities which are considered as domestic distortions between
regions. Therefore, China’s economic ascendancy and unbalanced economic structure have been
subject to criticism and skepticism regarding its economic and political sustainability. To some
extent, these industries have a cyclical character and economically they are sensitive to
economic downturns. Ethier (1982) also shows that dumping can be the response of firms even
in perfectly competitive markets during economic downturns, because firms face sudden
uncertainty in terms of demand for their output, and are unable to adjust their production
processes quickly. His explanation also suggests that dumping may be more frequent in a
cyclical industry that experiences regular fluctuations in demand, and in industries where it is
difficult to adjust capacity.11
Therefore, cyclical industries such as chemicals, base metals,
machinery and wood pulp are sometimes subject to protective tariffs. This phenomenon may be
part of the reason why China’s exports are the target of AD duties. During the reform period,
the Chinese government focused on reform of product markets, including abandoning policy
intervention in domestic markets and liberalizing trade in goods and services. Although almost
all product prices are determined in free markets now, in contrast, factor markets, including
markets for labor, capital, land, energy, and the environment remain highly distorted. In
addition, outside the property sector, land prices are artificially determined by government.
These distortions generally push factor prices, and, therefore, production costs below levels that
they otherwise would be if determined by the market environment. In other words, these cost
distortions are equivalent to production and investment subsidies, and they artificially increase
production profits, raise investment returns, and strengthen the international competitiveness of
Chinese products. One more applicable reason is that the overwhelming dumping activities can
be a way for Chinese firms to gain valuable experience to increase their technological
knowledge, learning by doing, thereby increasing economic efficiency. Technical know-how
can only be acquired from engaging in production. If world demand is high enough, export
firms with technical know-how can push down the world price below the opportunity cost of
production, with the result that firms take part in dumping easily.
11
A type of industry that is sensitive to the business cycle, such that revenues are generally higher in
periods of economic prosperity and expansion, and lower in periods of economic downturn and
contraction. Many cyclical industries produce durable, commodity-like goods such as raw materials, cars,
chemicals, construction, paper, steel, and heavy equipment.
Vol.6 2011
20
5. CONCLUSION
The paper showed empirically that China’s GDP growth rate and the frequency of protectionism
against China have a positive correlation, whereas the world economy without China shows a
negative correlation. It also disclosed that, in contrast to world GDP growth, China’s GDP
growth has been rising despite the proliferation of AD measures as protectionism against China.
The global experience of economic growth and the frequency of global AD measures indicate a
policy reaction and propensity to protectionism, which is an increase in the utilization of AD
measures during economic downtowns. The objective is to protect domestic industry from
unfair competition while being consistent with WTO regulations. The paper also shed light on
USA CVD duties on China’s exports as clear examples of the government’s intricate policy, and
it demonstrated the formation of the advantages and benefits that come from government
subsidies. The top ten industries of China were chosen in terms of the number of AD measures
they received. Using data analysis from China’s top ten industries that faced AD measures and
its domestically subsidized firms respectively, the paper evaluated the hypothesis that there is a
strong correlation between domestically subsidized major industries and the top ten industries
that face AD measures. This is the main reason for the proliferation of AD measures against
China. It was found that the top ten industries were subsidized by government, and they have
been engaging in significant dumping activities during periods of economic growth and
downturns.
International Journal of Economic Policy Studies
21
REFERENCES
Arayama, Y. 2006. Economic Growth and Regional Development: Reconsideration of
Economic Effects of New Technology on Export-Led Economic Growth. Proceedings,
Korean Economic Development Association International Conference
Bhagwati, J., and V. K. Ramaswami. 1963. “Domestic Distortions, Tariffs, and Theory of
Optimum Subsidy,” Journal of Political Economy 71(1). 44-50.
Bagwell, K. and R. Staiger. 2003. “Protection and the Business Cycle,” Advances in
Economic Analysis and Policy 3(1). 1-43.
Barro, R. J. 2008. Macroeconomics: A Modern Approach. Thomson South-Western, Mason,
Ohio, U.S.A.
Bergsten, C.F., Freeman, C., Lardy, N. and Mitchell, D. J. 2008. China’s Rise: challenges
and opportunities. Peterson University of International Economics, Washington, DC.
Bown, C. P. 2010. "Global Antidumping Database,” http://econ.worldbank.org/ttbd/gad/
[Accessed 8.14.2010]
Capital Trade Incorporated. 2009. An Assessment of China’s Subsidies to Strategic and
Heavyweight Industries. Submitted to the U.S.-China Economic and Security Review
Commission.
http://www.uscc.gov/researchpapers/2009/CAP%20TRADE%20China%27s%20Subsidie
s%20to%20Strategic%20%20Heavyweight%20Industries%20--
%20FINAL%20Report%2023March2009.pdf, [Accessed 6.21.2010]
Chacholiades, M. 1973. The Pure Theory of International Trade. Aldine Transaction, New
Brunswick (U.S.A.) and London (U.K.).
Chang, G.G. 2001. The Coming Collapse of China, Random House, New York
Chang, Y.-M. and P.G. Gayle. 2006. “The Continued Dumping and Subsidy Offset Act: An
Economic Analysis.” Southern Economics Journal 73(2). 530-545.
Chaudhuri, Sh. and Ravallion, M. 2006. Partially Awakened Giants: Uneven Growth in
China and India. World Bank Policy Research Working Paper No. 4069.
Corden, W. M. 1971. The Theory of Protection. Oxford University Press, Oxford.
Corden, W. M. 1974. Trade Policy and Economic Welfare. Clarendon Press, Oxford.
Ethier, W. J. 1982. “Dumping.” Journal of Political Economy 90(3). 487-506.
Friedman, M. and Rose Friedman. 1979. Free to Choose. Harcourt Brace Jovanovich New
York and London.
Gordon, R. J. 1987. Macroeconomics: Fourth Edition. Scott Foresman and Company,
Glenview, Illinois, Boston, London.
Johnson, H. G. 1972. Aspects of the Theory of Tariffs. Harvard University Press, Cambridge,
Massachusetts.
Heplman, E. and P. R. Krugman. 1989. Trade Policy and Market Structure. The MIT Press
Cambridge, Massachusetts London, England.
Robinson, J. 1969. The Economics of Imperfect Competition. Great Britain, Antony Rowe Ltd,
Chippenham, Wilts.
Keyimu, K. 2008. “The Anti-Dumping Agreement of the World Trade Organization: Use and
Abuse.” Annual Report on Research and Education, Nagoya University Graduate School
of Law, pp. 27-51.
Keynes, J.M., 1936: The General Theory of Employment, Interest and Money. Macmillan and
Co., Limited, London.
Lin, J.Y., Cai, F. and Li, Z. 1995. The China Miracle: development strategy and economic
reform. Chinese University of Hong Kong Press, Hong Kong.
Pei, M. 2006. China’s Trapped Transition: the limits of development autocracy, Harvard
University Press, Cambridge.

Vol.6 2011
22
Spence, M. 2007. “Engines of Growth.” Hoover Digest, No. 3.
http://www.hoover.org/publications/hoover-digest/article/5928 [Accessed 8.14.2010]
Stiglitz, J.E. and A. Charlton. 2005. Fair Trade for All: How Trade Can Promote
Development. Oxford University Press, Oxford.
UN data. 2010. A World of Information. World Development Indicators, GDP(current US$).
http://data.un.org/ [Accessed 8.14.2010]
United States International Trade Commission. 2010. By Chapter, Harmonized Tariff
Schedule of the United States, http://www.usitc.gov/tata/hts/bychapter/_1000.htm
[Accessed 7.3.2010]
Vousden, N. 1990. The Economics of Trade Protection. Cambridge University Press,
Cambridge.
World Trade Organization. 2001. Protocols on Accession for the People’s Republic of China.
http://www.wto.org/english/thewto_e/acc_e/protocols_acc_membership_e.htm#china
[Accessed 7.3.2010]
World Trade Organization. 2001. Report of the Working Party on the Accession of China.
http://www.wto.org/english/thewto_e/acc_e/wp_acc_china_e.doc [Accessed 7.5.2010]
World Trade Organization. 2010. World Trade Report 2009: Trade Policy Commitments and
Contingency Measures, http://www.wto.org/english/res_e/publications_e/wtr09_e.htm,
[Accessed 7.3.2010]
Zoellick, R.B. and Lin, J.Y. 2009. Recovery Rides on the “G-2”, Washington Post, 6 March.