Embed Size (px)
Citation preview
January 30, 1996
The International Transmission of Financial Shocks:The Case of Japan
Joe Peek* and Eric S. Rosengren**
Abstract
One of the more dramatic financial events of the late 1980sand early 1990s was the surge in Japanese stock prices that wasimmediately followed by a very sharp decline of more than 50percent. While the unprecedented fluctuations in Japanese stockprices were domestic financial shocks, the unique institutionalcharacteristics of the Japanese economy produce a framework thatis particularly suited to transmit such shocks to other countriesthrough the behavior of the Japanese banking system.
The large size of Japanese bank lending operations in theUnited States enables us to use U.S. banking data to investigatethe extent to which this domestic Japanese financial shock wastransmitted to the United States, as well as to identify a supplyshock to U.S. bank lending that is independent of U.S. loandemand. We find that binding risk-based capital requirementsassociated with the decline in the Japanese stock market resultedin a decline in commercial lending by Japanese banks in theUnited States that was both economically and statisticallysignificant. This finding has added importance given the severereal estate loan problems currently faced by Japanese banks. HowJapanese bank regulators decide to resolve these problems willhave significant implications for credit availability in theUnited States as well as in other countries with a significantJapanese bank presence.
*Professor of Economics, Boston College, and Visiting Economist,Federal Reserve Bank of Boston.**Vice President and Economist, Federal Reserve Bank of Boston.
The authors thank Masao Ohkawa for providing data on Japanesebanks and insights into the Japanese banking system. Valuableresearch assistance was provided by Faith Kasirye-Nsereko. Theviews expressed are those of the authors, and do not necessarilyreflect official positions of the Federal Reserve Bank of Bostonor the Federal Reserve System.
1
The International Transmission of Financial Shocks:
The Case of Japan
The increasing globalization of banking and financial
markets provides important advantages in terms of gains in
efficiency and diversification, but it also offers potential
pitfalls. One such pitfall is associated with the risks that
would emanate from any group of globally active financial
institutions collectively suffering financial difficulties.
Given the size and global penetration of Japanese banking
organizations, the significant problems at large Japanese banks
following the dramatic decline in the Japanese stock market at
the beginning of this decade may have created just such an event.
Despite the dramatic decline in stock prices, slumping real
estate prices, and unusually weak economic growth, domestic
Japanese bank lending continued to increase, albeit at a much
slower rate than in the late 1980s. In contrast, overseas
lending by Japanese banks declined substantially in the early
1990s, and by an amount sufficient to make the total worldwide
assets and loans of Japanese banks decline.
Several factors contribute to the potential for Japanese
banks to be particularly effective transmitters of domestic
financial shocks overseas. First, large cross-holdings of
Japanese corporate stocks by Japanese banks make these banks
susceptible to downturns in the stock market. Second, bank
regulatory changes in Japan in the late 1980s both enhanced
2
enforcement of capital requirements and allowed changes in the
value of bank stock holdings to directly affect bank capital,
setting the stage for the banking sector to transmit an adverse
stock price shock through reductions in credit availability.
Third, bank-firm lending relationships are particularly strong
and important in Japan, making banks reluctant to reduce credit
to their long-term customers. Fourth, the large international
presence of Japanese banking organizations allowed them to shift
much of the asset and loan shrinkage overseas, insulating
domestic firms from much of the shock.
We examine the hypothesis that Japanese banking problems
caused by the decline in Japanese stock values were transmitted
internationally by investigating the lending behavior of Japanese
bank subsidiaries, agencies, and branches in the United States
during this period. Since Japanese banks have made significant
penetrations into markets in the United States, and because their
U.S. activity is a significant proportion of their overseas
operations, the United States is an ideal location for
determining whether Japanese financial shocks were transmitted
overseas. In particular, we find that Japanese branches in the
United States reduced lending at the time of declines in their
parents' capital positions. 1
This event enables us to identify and isolate an external
supply shock to U.S. lending. By focusing on the transmission of
the effects of Japanese stock market losses via the actions of
Japanese bank branches and subsidiaries in the United States, we
3
are able to overcome a major problem of previous studies
investigating the linkage between bank capital ratios and bank
loan growth in the United States: the inability to completely
isolate bank loan supply shocks from demand effects. The recent
unprecedented movements in the Japanese stock market, being
independent of domestic economic conditions in the United States,
provide a loan supply shock that is independent of U.S. demand
conditions.
The next section of the paper provides an overview of the
influence of capital regulations on Japanese bank activities, the
importance of lending relationships in Japan, and the increasing
importance of Japanese banks in world financial markets,
especially their penetration of the banking sector in the United
States. The second section describes the panel data for Japanese
banks and methodological issues. The third section provides the
empirical results, which show that Japanese lending in the United
States was affected by the parent banks' capital positions. The
final section offers some conclusions regarding the need for
policymakers to consider global events more broadly. In
particular, the international transmission issue is likely to be
revisited soon, as the Japanese address their real estate loan
problems. How this problem is resolved will have potentially
significant implications for any country with a large Japanese
banking presence.
4
I. Background
One of the more dramatic financial events of the second half
of the 1980s was the asset inflation in Japan. The subsequent
deflation was, perhaps, even more striking. Figure 1 shows the
extent of the surge in the Nikkei stock index. Even using
monthly average data that miss the precise peak in the Nikkei,
the figure reflects a tripling of the index between January 1986
and December 1989, before experiencing an equally sharp decline.
Urban land prices also rose and then fell dramatically, although
they tended to peak after the Nikkei. Such rapid rises and
declines in stock prices and other asset values were
unprecedented in Japan.
A unique combination of institutional characteristics of the
Japanese economy produce a framework that is particularly suited
to transmit such a domestic financial shock to other countries
through the behavior of the Japanese banking system. Bank
regulatory changes in the late 1980s made Japanese banks take
satisfying capital requirements more seriously, while at the same
time codifying the direct impact of fluctuations of stock market
values on the level of a bank's capital. Because Japanese banks
are allowed to hold large equity stakes in firms, the dramatic
decline in stock prices reduced bank capital substantially. As a
consequence, banks downsized their activities in an attempt to
raise capital-to-asset ratios. The particularly strong
relationships that Japanese banks have with their loan customers
provide them with a strong incentive to insulate their long-term
5
customers from a reduction in credit availability. Finally, the
large overseas presence of Japanese banking organizations
provided an escape valve for the pressure to shrink. By
concentrating the shrinkage of operations on overseas rather than
domestic lending, Japanese banks both mitigated the adverse
effects on their domestic customers and transmitted
internationally what was originally a domestic shock.
Transmission of the Shock
A substantial body of evidence indicates that banks in the
United States respond to adverse capital shocks by growing more
slowly and, in many instances, shrinking (Bernanke and Lown 1991,
Hall 1993, Hancock and Wilcox 1995, Peek and Rosengren 1995a,
1995b, 1995c). While investigators have found a positive
relationship between bank capital and either asset growth
(Frankel and Morgan 1992) or bank lending (Kim and Moreno 1994)
for Japanese banks after the mid 1980s, prior to that time the
relationship was much weaker or nonexistent. This is consistent
with a change in the regulatory environment in Japan in the mid
and late 1980s, including the adoption of the Basle Accord, that
placed greater emphasis on the role of bank capital.
Essentially, Japanese banks were not subject to explicit capital
ratio requirements until the mid 1980s. (See Kim and Moreno 1994
for a more detailed discussion.) Rather, the Bank of Japan often
controlled bank lending through "window guidance" (Hoshi,
Scharfstein, and Singleton 1993).
6
The introduction in 1988 of the Basle Accord, an
international agreement that set common standards by which to
evaluate capital adequacy, set the stage for the dramatic
fluctuations in Japanese stock prices to have a substantial
impact on Japanese bank capital. The Basle Accord contains a2
provision that allows up to 45 percent of unrealized gains on
equity security holdings (revaluation reserves, also referred to
as hidden reserves) to be included in bank capital. The rapid 3
growth of Japanese banks was relatively unaffected initially by
the adoption of the Basle Accord because of the boost in their
tier 2 capital that came from the substantial accrued capital
gains on their shareholdings associated with the dramatic rise in
Japanese stock prices. Furthermore, higher stock prices enabled
Japanese banks to increase tier 1 capital by issuing new equity
shares and debt securities at favorable prices, as well as by
selling some of their stock holdings in other companies that had
substantial unrealized gains. 4
The subsequent decline in Japanese stock prices, with the
Nikkei index losing more than half its value in just the late
1989 to early 1992 period, caused a dramatic decline in tier 2
capital, given that Japanese banks hold approximately 20 percent
of Japanese common stock (French and Poterba 1991; Prowse 1990).
The tier 2 risk-based capital ratio of many major Japanese banks,
including 7 of the 10 largest banks in the world, in the early
1990s temporarily fell below the 8 percent minimum required under
the Basle Accord. As a result of the widespread decline in
7
Japanese bank capital, the total assets of Japanese banking
organizations declined steadily after 1990, an outcome
unprecedented in the postwar period. The slowing in loan growth5
and the eventual shrinkage of overall banking operations of
Japanese banks appears to be consistent with earlier evidence on
the response of U.S. banks to adverse capital shocks. Thus, it
appears that the sharp rise in Japanese stock prices in the 1980s
and the subsequent decline in the 1990s, by impacting bank
capital, strongly affected both the ability and desire of
Japanese banks to expand lending.
The effect on bank lending of the decline in Japanese stock
prices was exacerbated by the deteriorating quality of bank
assets, especially real estate loans. While the problem is
widely acknowledged to be serious, the well-known lack of
transparency of the Japanese banking system make it difficult to
quantify the bad loan problem. By one estimate (Huh and Kim
1994), bad loans represented about 7 percent of total loans in
1992, an amount very close to recent estimates by private
analysts in the range of 6 percent. However, unlike the
treatment of the sharp declines in unrealized gains on stock
market holdings, which are observable and thus not easily
manipulated to avoid substantial declines in reported bank
capital ratios, the timing of both the write-down of the bad
loans and the associated additions to loan loss reserves can be
managed by banks and by regulators, as was done in many countries
during the Third World debt crisis. To date, Japanese banks have
8
been slow to address the problem by writing down loans and adding
to loan loss reserves, resulting in reported capital ratios that
overstate their financial health.
Importance of Lending Relationships
Information asymmetries make open market credit instruments
imperfect substitutes for bank loans as a source of credit for
many firms, especially smaller firms where most information is
private, and make long-term bank lending relationships valuable.
Banks acquire much of this private information through financial
relationships and, in particular, through repeated banking and
lending transactions. In this way, over time, a bank can
overcome many of the asymmetric information problems such as
adverse selection and moral hazard emphasized by, for example,
Stiglitz and Weiss (1981).
Thus, imperfect information can give rise to a special role
for bank loans. Even though the United States has large, liquid
capital markets, lending relationships have been found to be
important. While such relationships are (not surprisingly) most
important for small firms (for example, Petersen and Rajan 1994),
banking relationships have been shown to be valuable even for
larger firms that do have access to national credit markets (see,
for example, Slovin, Sushka, and Polonchek 1993; James 1987).
One might expect lending relationships to be even more
important in a bank-oriented country such as Japan compared to a
more market-oriented country such as the United States. Much of
9
the industrial organization of Japan is built around the "main
bank" system that serves as the core of keiretsus, groups of
firms that are closely tied together through product-market
relationships, as well as through cross-holdings of each other's
equity. Bank lending relationships take on added importance
because restrictions on the corporate bond market in Japan (which
have recently been eased) caused most of the financing needs of
Japanese firms to have been met historically by bank loans. For
firms in a keiretsu, most of that bank credit comes from the
bank(s) in its group.
An important characteristic of Japanese economic structure
is that the main bank plays a much larger and more crucial role
than simply serving as a source of credit. Often current or
former bank employees are placed in key management positions or
on the board of directors at other firms in the bank's keiretsu,
enabling the bank to more easily monitor the firms to which it
lends. Perhaps even more important is the role of the main bank
when one of its group members becomes financially distressed.
The main bank essentially has an implicit contract to aid the
firm, as well as an incentive to do so to protect its reputation,
perhaps by renegotiating the troubled firm's debt or by
overseeing the restructuring of the firm (see, for example,
Hoshi, Kashyap, and Scharfstein 1990). Furthermore, because
Japanese banks tend to take large equity stakes in those firms to
which they lend (Prowse 1990), main banks have an added financial
interest in assisting troubled firms in which they have both a
10
debt and an equity exposure.
Research on lending relationships in Japan has provided
evidence that supports the importance of such relationships.
First, a firm's investment is affected by the health of its main
bank (Gibson 1995). Second, keiretsu members and nongroup
members with a strong main bank relationship are affected less by
financial distress or tight credit conditions than other nongroup
members (Hoshi, Kashyap, and Scharfstein 1990, 1991; Hoshi,
Scharfstein, and Singleton 1993). In fact, city banks responded
to the binding capital constraints caused by the sharp decline in
Japanese stock prices by reducing both lending to and stock
holdings of firms with which they did not anticipate having a
continuing long-term relationship (Frankel and Morgan 1992).
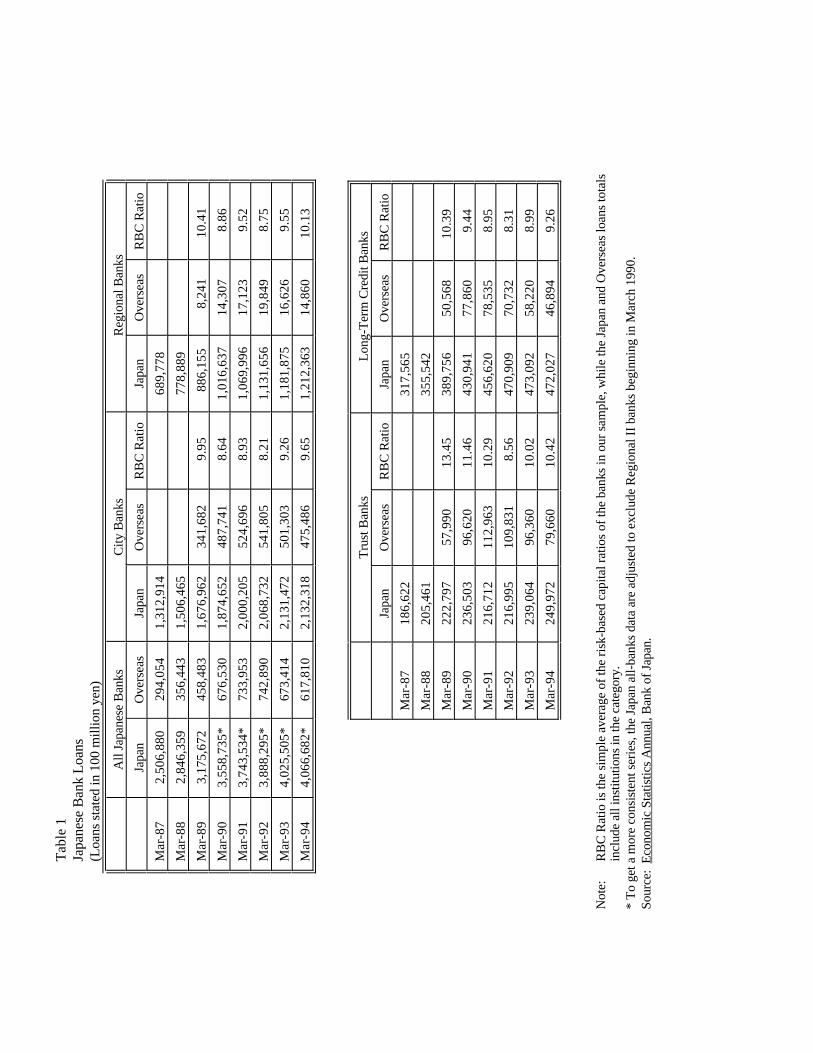
The evidence in Table 1 supports the view that close lending
relationships in Japan made it difficult for banks to reduce
credit availability to their customers. Table 1 shows the
overall loan growth, both for domestic operations and at overseas
branches, for all Japanese banks, as well as separately for the
city banks, trust banks, long-term credit banks, and regional
banks. In addition, beginning in 1989 (when such data became6
available), we have included the associated average risk-based
capital ratios by bank type, based on our set of major Japanese
banks with a presence in the United States (see below).
Even though Japan was suffering from its worst post World
War II recession, domestic loan growth at these banks continued
throughout the period (except for a brief decline at trust
11
banks), albeit at a much slower rate in the last three years. In
contrast, overseas lending by branches of Japanese banks
exhibited a much sharper reversal. Over the March 1987 to March
1991 period, overseas loans grew on average twice as fast as
domestic lending. The growth in overseas loans then slowed
sharply, reaching a peak in 1992 for all banks, city banks, and
regional banks, and in 1991 for long-term credit banks and trust
banks, roughly coinciding with a decline in their risk-based
capital ratios. The subsequent decline in overseas loans
occurred even though the economies in many of the foreign markets
most important for Japanese banks were doing well, with the
United States recovering from its recession and GDP growth quite
strong in Asia.
The fact that the declines in lending were concentrated in
their overseas rather than their domestic operations is
consistent with Japanese banks valuing historical lending
relationships at home more than those in more recently
established foreign markets. While some of the decline in
overseas loans in yen terms can be accounted for by the
appreciation of the yen, the extent of the decline suggests that
Japanese banks improved their capital ratios in part by shrinking
their large overseas presence.
If Japanese banks had not had international operations, the
loan shrinkage would have to have been accomplished domestically.
Instead, the large overseas operations of Japanese banking
organizations allowed Japanese banks to insulate domestic
12
customers from much of the shrinkage that was required to restore
capital ratios. On the other hand, any country with a large
Japanese banking presence could be adversely affected by the
shrinkage of external lending by Japanese banks. The United
States is just such an example, being one of the countries where
Japanese banks have their largest overseas presence.
Implications for the United States
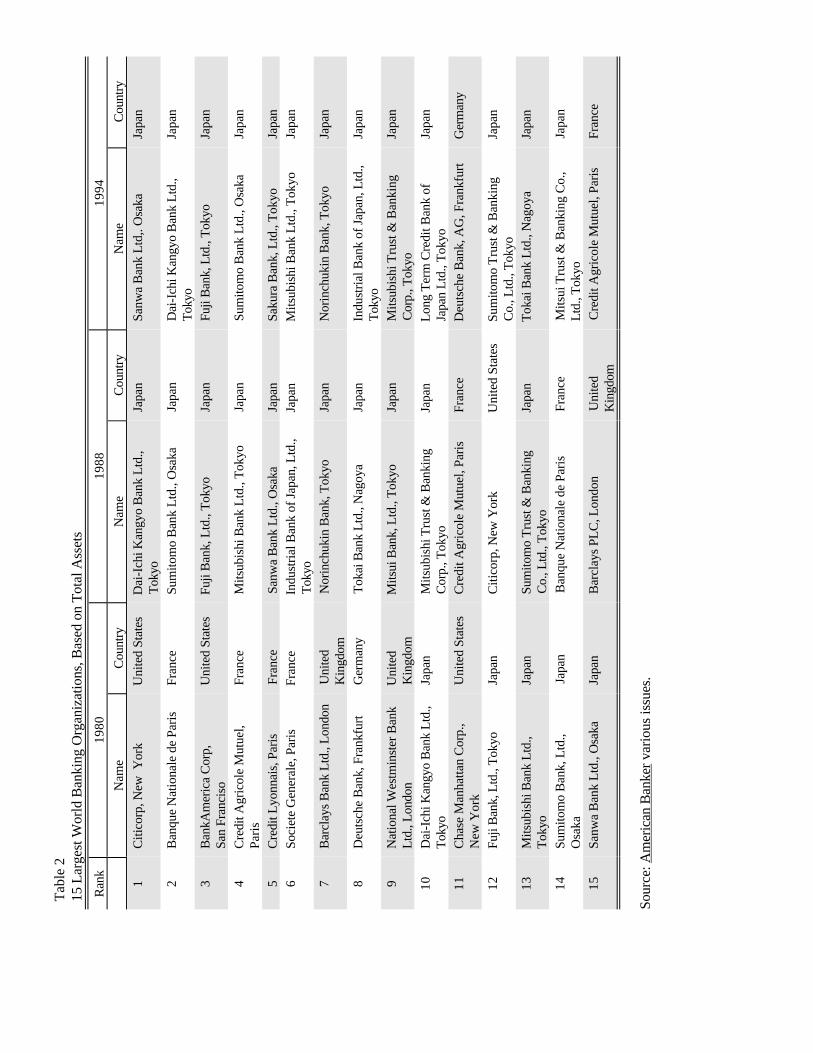
While the Japanese banking sector historically has had many
large banks, it is only in the past decade that they have come to
dominate the list of the largest banks on a global scale. As
recently as 1980, only one Japanese bank, Dai-Ichi Kangyo Bank
Ltd., was among the world's 10 largest banking organizations
(Table 2). However, with a booming stock market, low domestic
interest rates, and a strong yen, Japanese banks expanded
aggressively during the late 1980s. By 1988, all of the world's
10 largest banking organizations were headquartered in Japan.
And despite the sharp decline in the Nikkei and asset shrinkage
at many Japanese banks in the early 1990s, the 10 largest banking
organizations in the world, and 13 of the 15 largest, were still
headquartered in Japan as of the end of 1994.
The aggressive expansion of Japanese banks in the late 1980s
has included greater penetration of foreign markets, in part
because of the opportunities provided by these markets and in
part because of Japanese regulatory actions that encouraged the
internationalization of Japanese finance (Frankel and Morgan
13
1992). In particular, Japanese banking organizations made7
significant inroads into U.S. banking markets. By 1990, Japanese
branches and subsidiaries accounted for approximately 8 percent
of all U.S. banking assets and 18 percent of all commercial and
industrial (C&I) loans to borrowers located in the United States
(Figure 2). While Japanese banks initially may have expanded
U.S. operations in order to serve their Japanese customers
opening or expanding operations in the United States, by the late
1980s they were actively expanding their business with U.S.-based
customers (Seth and Quijano 1991; Nolle and Seth 1995), with
their business lending in the United States growing much more
rapidly than Japanese external trade (Terrell 1993). However, 8
with the retrenchment that followed the fall in the Nikkei,
Japanese banking organizations saw their U.S. market share of
both assets and C&I loans decline.
This decline in the Japanese share of the U.S. market was
not generally experienced by other foreign banking organizations.
The Japanese share of foreign banking activity in the United
States peaked in 1990, when Japanese banks accounted for over 60
percent of U.S. commercial and industrial loans and 45 percent of
U.S. banking assets held by foreign banking organizations (Figure
3). The subsequent decline reflects a combination of the
Japanese decline and an increase in the market share of U.S.
banking assets by non-Japanese foreign banking organizations. 9
Figure 4 shows that even in dollar terms, loans by Japanese
banking organizations in the United States declined after 1990
14
and have only recently begun to increase. Stated in yen, the
decline begins earlier and is proportionately much greater.
Thus, the reduction in the yen value of assets and loans at
overseas branches accomplished through the appreciation of the
yen may have lessened the need for Japanese banking organizations
to reduce overseas operations in order to strengthen the parent
bank's capital ratio.
II. Data and Methodology
The panel data include semiannual observations from
September 1988 until September 1994 of the branch and subsidiary
activity of 11 city banks, 3 long-term credit banks, 5 trust
banks, and the 10 largest regional banks. The data begin in10
1988, the first time that risk-based capital measures were
reported for Japanese parent banks. We use semiannual
observations because Japanese banks report capital and assets
semiannually. While the Japanese branch and subsidiary data are
available quarterly from U.S. call report data, we use only the
March and September reports to match the reporting dates
available for the Japanese parent banks.
For our panel of data, we have consolidated the branches of
each parent company. Thus, we have one branch observation per
period for each parent bank, which includes all branch activities
in the United States by that parent bank. We have aggregated the
data in this way for two reasons. First, all aggregated branches
are capitalized by the same parent. Second, branch openings and
15
closings can result in large changes in individual branch data
associated with the transfer of assets between branches of the
parent bank, even if no significant change in overall branch
activity has occurred. In addition, we include agencies in our
branch totals. Agencies operate like branches in terms of their
assets but, unlike branches, are prohibited from accepting
deposits. Because the capital of a subsidiary, rather than the
capital of the parent bank, is relevant for meeting capital
requirements, subsidiaries of each bank remain as independent
observations, and separate regressions are estimated for the set
of subsidiaries.
The distinction between Japanese subsidiaries and branches
(plus agencies) is potentially important. Japanese subsidiaries
are likely to have a much larger retail operation, are separately
capitalized, and are not included in the capital or assets of
their Japanese parent. Thus, one might expect their behavior to
be sensitive to local market conditions but to be less sensitive
to capital problems of their parent. On the other hand, Japanese
branches (and agencies) are not separately capitalized, relying
on the capital of their parent. Branch activity should be more
sensitive to capital problems of the parent, since their size and
portfolio composition affect the risk-based capital ratio of the
parent. Still, even though Japanese subsidiaries tended to
maintain relatively high risk-based capital ratios, the overall
percentage contraction by the well-capitalized subsidiaries was,
on average, of the same magnitude as that for the branches, which
)loans i
assets i , t &1
' " % $1PRBCi , t &1 % $2LANDi , t &1 % (XTSt &1 % 2XBSi , t &1 % ,i , t
16
rely on relatively poorly capitalized parents.
The bulk of Japanese bank lending here occurs at branches,
accounting for roughly three-fourths of all U.S. loans by
Japanese banking organizations. City banks are by far the most
important bank type, accounting for two-thirds of the assets and
loans made by all Japanese branches and subsidiaries in the
United States. Next in importance are the long-term credit
banks, followed by trust banks. The regional banks have the
smallest presence, accounting for little more than 3 percent of
assets and only slightly more than 1 percent of the domestic
commercial and industrial loans made by Japanese branches and
subsidiaries in the United States. 11
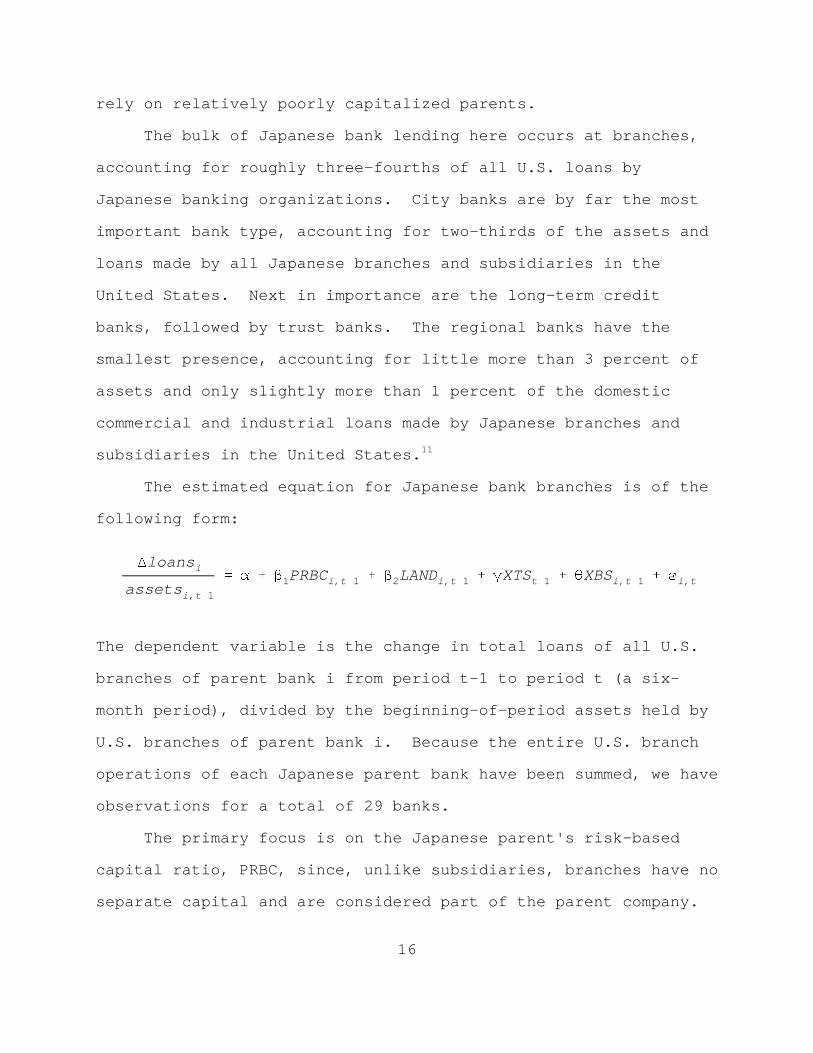
The estimated equation for Japanese bank branches is of the
following form:
The dependent variable is the change in total loans of all U.S.
branches of parent bank i from period t-1 to period t (a six-
month period), divided by the beginning-of-period assets held by
U.S. branches of parent bank i. Because the entire U.S. branch
operations of each Japanese parent bank have been summed, we have
observations for a total of 29 banks.
The primary focus is on the Japanese parent's risk-based
capital ratio, PRBC, since, unlike subsidiaries, branches have no
separate capital and are considered part of the parent company.
17
Capital is measured as of the beginning of the period. If the
parent company has a low risk-based capital ratio and is unable
or unwilling to raise additional capital, it may choose to
satisfy its capital requirement by shrinking its assets and
liabilities, including those in its overseas branches. If
Japanese banks do respond by shrinking their overseas branches,
then the coefficient on PRBC should be positive.
Because Japanese banks have been slow to reserve for their
serious bad loan problems, their capital ratios do not accurately
reflect their financial health, being overstated to the extent
that the banks have underreserved for problem loans. To control
for this misstatement of capital ratios, we have included an
additional variable, LAND, in an attempt to capture the effect of
the bad loan problem on bank behavior. Even though the problems
are not fully reflected in the official capital ratios, the banks
are aware of the extent of their problems and may be reacting to
that knowledge and the probable need to eventually reserve for
and charge off those loans. LAND is measured as the percentage
reduction in the commercial land index for all urban districts
(constructed by The Japan Real Estate Institute) relative to its
peak in September 1991. The series has a value of zero until the
September 1991 observation and then takes on a negative value,
reflecting the cumulative decline since that time. The land
price index is chosen as our proxy because much of the bank bad
loan problem is related to loans collateralized by commercial
real estate. We anticipate a positive estimated coefficient,
18
with loan growth slowing as collateral values decline and the
(unreserved for) loan problems become more severe.
The other independent time series variables (XTS) include
the percentage change in foreign direct investment by Japanese
companies in the United States (FDI) and U.S. payroll employment
growth (Emp Growth), each measured over the prior six-month
period. Because Japanese companies frequently utilize Japanese
banks, increases in foreign direct investment should be
positively related to lending by Japanese branches. Because the
FDI data are available only as annual observations, we calculate
the March observation as the average of the current and previous
years' values. We use the current-year value for the September
observation. We then calculate the percentage change over the
prior (six-month) period. We anticipate a positive coefficient.
Payroll employment growth is included to control for loan demand.
To the extent changes in branch loans reflect changes in loan
demand, the coefficient should be positive.
The final set of explanatory variables (XBS) controls for
bank-specific effects. This set includes the beginning-of-period
logarithm of assets of the U.S. branches of the parent Japanese
bank to control for the size of the U.S. presence of each bank.
We also include nonperforming loans (loans 90 or more days past
due plus nonaccruing loans) divided by total loans at the
parent's U.S. branches (NPL) in the total loans equation, and use
the same calculation, replacing total loans with C&I loans as an
argument in the C&I loan equation. Branch holdings of commercial
19
and industrial loans (CI/A) and of real estate loans (RE/A), each
divided by the parent's total U.S. branch assets, are also
included. Each of these variables is measured as of the
beginning of the period. These measures control for perceived
lending risks, as well as for U.S. demand shocks that might
disproportionately affect a segment of the portfolio. Finally, we
include a set of dummy variables indicating whether the parent is
a trust bank (Trust), a long-term credit bank (Long-term), or a
regional bank (Regional).
In a further attempt to control for loan demand, we consider
an alternative specification of the dependent variable, the
change in loans at the branches of bank i divided by beginning-
of-period assets, minus the change in total loans at all non-
Japanese banks in the United States divided by beginning-of-
period assets of all non-Japanese banks in the United States.
This measures the growth in loans relative to the average for all
non-Japanese banks in the United States. If the Japanese bank12
capital supply shock was unimportant, Japanese branches would
have a pattern of changes in loans similar to that of other banks
in the United States, reflecting changes in loan demand
associated with changes in general economic activity, and we
would expect an insignificant coefficient on the parent risk-
based capital ratio.
A similar set of regressions is estimated for Japanese
subsidiaries. Because Japanese subsidiaries are independently
capitalized, we must include the subsidiary's risk-based capital
20
ratio, as well as the parent's risk-based capital ratio. We
would expect the subsidiary's capital to be important, while the
parent's capital ratio might play only a secondary role, perhaps
reflecting the extent to which the parent could inject additional
capital into the subsidiary if needed. Thus, we would expect the
parent's capital ratio to be less important for subsidiaries than
for branches. Because no regional bank owns a U.S. subsidiary,
the regional bank dummy variable is not included in the
subsidiary equations. All the other independent variables are
the same as in the branch equation.
Several adjustments were made to the data set. For the
branch data, we required that commercial and industrial loans
account for at least 5 percent of assets. Some Japanese branch
operations are primarily bond trading units with no implications
for the availability of domestic U.S. bank loans. We eliminated
the first two years that a Japanese parent had branch operations
in the United States, because de novo entry usually results in a
very rapid initial expansion of loans unrelated to the capital
position of the parent. In addition, we had to exclude a few
branches that did not provide data on nonperforming loans.
Subsidiary observations were deleted for the same reasons--
if they did not have at least 5 percent of their assets in
commercial and industrial loans, if the data were for the first
two years of a subsidiary's operations, or if nonperforming loan
data were not reported. In addition, we deleted any quarter in
which a subsidiary acquired another bank, since this would result
21
in a jump in the loan series reflecting the acquisition rather
than ongoing operations. We also deleted two subsidiaries with
risk-based capital ratios exceeding 100 percent, each with
substantial capital and few loans and a portfolio dominated by
government securities, which have a zero weight in risk-based
capital calculations.
All equations were estimated using ordinary least squares,
fixed effects, and random effects specifications. Hausman
specification tests indicated that the variance components model,
which allows for bank-specific effects, was the most appropriate
specification for the branch data, while the fixed-effects
specification was most appropriate for the subsidiary data.
Because the first observation was lost owing to the need to
lag the parent's risk-based capital ratio, all regressions are
estimated over the 1989:1 to 1994:2 period, providing a maximum
of 12 semiannual observations per bank. However, the panels are
unbalanced, since not all banks operated branches over the entire
period and some subsidiaries had not operated for a full two
years prior to the beginning of our sample or were closed before
1994:2. The branch panel has 29 banks and a total of 315
observations. The subsidiary panel has 19 banks and a total of
209 observations.
III. Empirical Results
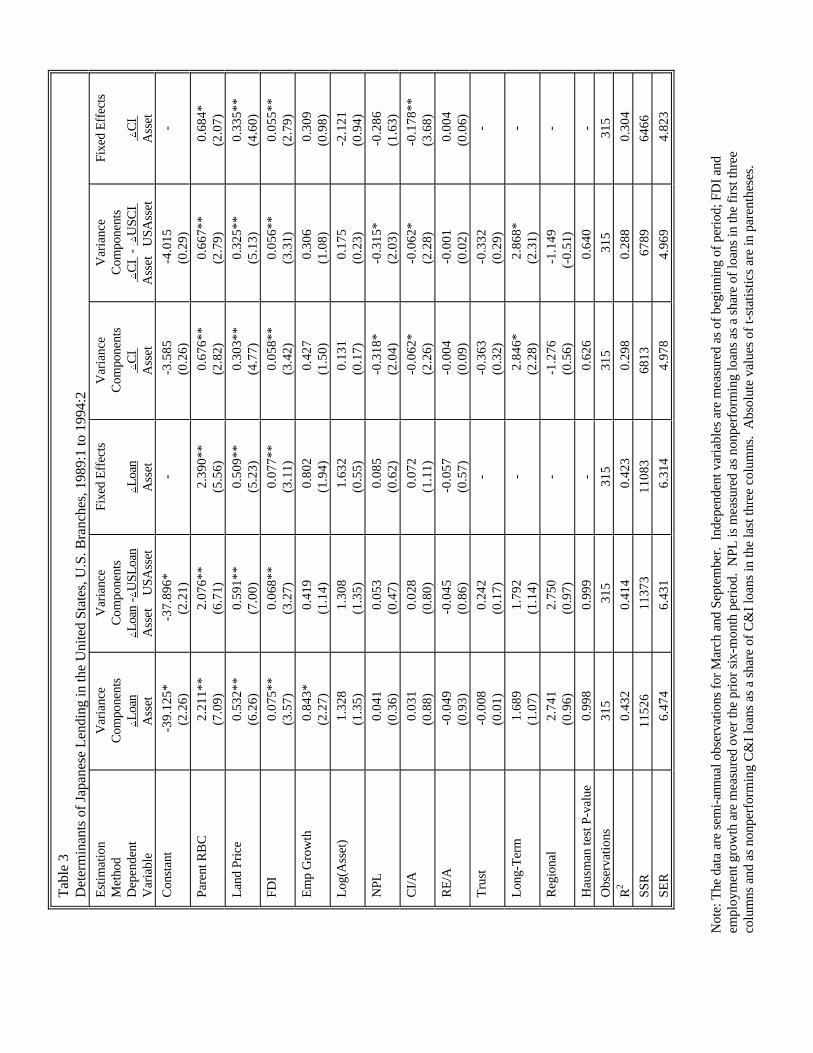
Table 3 presents the results for the Japanese branch
equations for the change in both total loans (columns 1-3) and
22
commercial and industrial loans (columns 4-6), each measured
relative to beginning-of-period assets. Column 1 contains the
variance components specification of the total loans equation.
The estimated coefficients both on parent risk-based capital and
on the decline in urban commercial land prices are positive (as
predicted) and significant at the 1 percent level. The estimated
coefficient on the parent risk-based capital ratio implies that a
1 percentage point reduction in the risk-based capital ratio of
the parent would result in loan growth relative to assets at that
bank's U.S. branches being reduced by 2.2 percent per six-month
period. Because loans comprise roughly 60 percent of Japanese
branch assets, this number substantially understates the
percentage reduction in loans. Thus, our estimate would roughly
correspond to a decline of 7.5 percent of loans at an annual rate
(in current dollars). This finding of a coefficient that is both
economically and statistically significant indicates a
substantial loan supply effect transmitted from Japanese parent
banks through their U.S. branches.
Both of the time series variables have statistically
significant effects that are of the predicted sign. FDI has a
positive coefficient that is significant at the 1 percent level.
Employment growth has a positive estimated effect that is
significant at the 5 percent level. Thus, both of these
variables appear to be controlling for loan demand influences at
Japanese branches as intended.
Among the bank-specific variables, none is statistically
23
significant. While the share of C&I loans has the predicted
sign, the nonperforming loans variable and the share of real
estate loans each have positive rather than the predicted
negative signs. The dummy variables for bank type indicate no
systematic differences among types of parent bank.
When the dependent variable is adjusted to reflect the
change in loans at Japanese branches relative to the average
change occurring at all other U.S. banks (column 2), we obtain
very similar results. The primary differences are that the
estimated coefficient on employment growth is now half as large
and no longer statistically significant, and that the estimated
coefficient on the trust bank dummy variable is of the opposite
sign (but still insignificant). The difference in the employment
growth coefficient is as expected. Thus, the results do not
appear to be sensitive to which specification we use to control
for loan demand effects. This is consistent with the parent-
bank-capital-induced loan supply response of Japanese branches
being independent of U.S. loan demand shocks.
The corresponding equations for the change in C&I loans
relative to assets (columns 4 and 5) indicate smaller responses
to both parent risk-based capital ratios and the decline in land
prices, in part because C&I loans comprise a smaller share of
Japanese branch assets (roughly 40 percent). Other differences
are that employment growth is no longer significant and both the
nonperforming loans variable and the share of C&I loans have
estimated coefficients that are significant at the 5 percent
24
level and have the predicted negative signs. In addition, the
dummy variable for long-term credit banks has significant
positive coefficients.
To ensure that the results for the significant negative
response to parent capital ratios were robust, we considered a
number of alternative specifications. First, we reestimated the
equations with three alternative land price series: the index
for the average of commercial, residential, and industrial land
prices in all urban districts; the index for the average of
commercial, residential, and industrial land prices for the six
largest cities; and the index for commercial land prices in the
six largest cities. The results in each case were quite similar
to those reported in Table 3. Second, we reestimated the
equations with a smaller data set that excluded the largest and
smallest values of the dependent variables, using only changes in
loans that were between -10 and 15 percent of assets. However,
even with the removal of the outliers, the results were robust.
Third, we reestimated columns 2 and 5 with dependent
variables that measured loan growth relative to the average for
the banks in the same state(s) as the branch(es) instead of
relative to the U.S. average. At the same time, we also used
state rather than national employment growth rates as an
explanatory variable. If a parent bank had branches in more than
one state, we used a weighted (by branch loans) average of the
states in which branches were operating for both the state loan
growth and employment growth variables. Again, we obtained
25
results quite similar to those reported in Table 3. Finally, we
reestimated the equations with parent risk-based capital ratios
as the only explanatory variable to see if the results were
sensitive to the inclusion or exclusion of the other independent
variables. The estimated coefficient on parent risk-based
capital in the total loans equation was 2.427, with a t-statistic
of 8.75, and in the C&I loans equation, the coefficient estimate
was 1.089 with a t-statistic of 4.97.
Table 3 also contains estimates of the fixed-effects
specifications in columns 3 and 6. The results are very similar
to the variance components estimates. Even though Hausman tests
indicate that the variance components specification is preferred,
we present the fixed-effects results to show that our results are
not specific to the use of the variance components specification
and to permit comparisons with the estimates for Japanese bank
subsidiaries, where Hausman tests indicate that fixed effects is
the preferred specification.
Table 4 presents the results for Japanese subsidiaries. The
fact that the fixed-effects specification is the preferred
specification suggests that idiosyncratic factors are relatively
more important at subsidiaries. While the estimated coefficients
on the subsidiary risk-based capital ratio are positive, the
effect is significant (at the 1 percent level) only for the
change in C&I loans. The parent risk-based capital ratio also
has positive estimated coefficients, but they are never
significant even at the 5 percent level. This finding could be a
26
result of the diversity in subsidiary activity. However, when we
estimated the same set of regressions either excluding small
subsidiaries (those with total assets less than $500 million) or
excluding extreme values of the dependent variables, we obtained
qualitatively similar results to those presented in Table 4.
This is consistent with our expectation that subsidiary capital
ratios would be the more relevant, with parent capital serving
primarily as a backup for the subsidiary if a capital infusion
became necessary.
The decline in urban commercial land prices in Japan again
has significant positive estimated coefficients, although one
might expect this variable to be less relevant to subsidiary
activity given the evidence on parent versus subsidiary capital
ratios. For subsidiaries, neither FDI nor employment growth is
significant. Among the bank-specific variables, only the
logarithm of subsidiary assets has a significant estimated
coefficient.
Because, on average, Japanese subsidiaries in the United
States are quite well capitalized, one might expect the t-
statistics of the subsidiary capital ratio coefficients to be
relatively weak. Because they tend not to be near the margin of
the risk-based capital requirements, an increase (or decrease) in
their capital ratio may have little effect on their behavior. In
fact, that is the case for the change in total loans equation,
although the subsidiary capital effect is significant at the 1
percent level in the C&I loan equation. Alternatively, since
27
U.S. regulators enforce a leverage ratio requirement as well as
the risk-based requirement, it may be that it is the (unweighted)
leverage ratio rather than the risk-based capital ratio that is
most relevant for U.S. subsidiaries. However, when the
subsidiary risk-based capital ratio is replaced with the
subsidiary leverage ratio, we obtain results with even weaker
subsidiary capital ratio effects.
Tables 3 and 4 indicated that the shock to Japanese parent
bank capital resulted in substantial loan shrinkage at their U.S.
branches, with the estimated coefficient on the parent risk-based
capital ratio significant at the 1 percent level. On the other
hand, as expected, the evidence was much weaker for Japanese
subsidiaries, with the parent risk-based capital ratio never
having an estimated coefficient significant even at the 5 percent
level. One concern might be that part of the reduction in branch
loans reflected a shifting of assets by Japanese banks from their
branches to their much better capitalized subsidiaries.
To be sure that the net effect of the parent bank capital
shock was to reduce total Japanese lending in the United States,
we reestimated our equations with a new dependent variable.
Table 5 presents the results for total U.S. operations of
Japanese banks, with the dependent variable calculated from the
combined balance sheets of all U.S. branches and subsidiaries of
each Japanese parent bank. Columns 1 and 2 show results for the
full sample. The results indicate that the parent risk-based
capital ratio again has a positive estimated coefficient that is
28
significant at the 1 percent level. Overall, the results are
similar to those for branches and suggest that loan shifting was
not a factor.
Consistent with this evidence, an analysis of the largest
negative changes in total loans and in C&I loans finds little
evidence of loan shifting from branches to subsidiaries. Of the
25 largest decreases in total loans relative to assets at
branches, none have unusually large corresponding increases at
subsidiaries. For C&I loans, only one observation has an
unusually large increase at a corresponding subsidiary.
Because many Japanese banks have only a branch presence in
the United States and thus do not have the opportunity to shift
loans to their U.S. subsidiaries, we also examined a subsample of
Japanese banks that have both subsidiary and branch operations in
the United States. The results are quite similar to those of the
full sample and to the branch results, with the parent risk-based
capital ratio having an economically large coefficient that is
statistically significant at the 1 percent level. Given the size
of branch operations relative to those of subsidiaries, it is
doubtful that the significant shrinkage found in the branches
could be explained by shifting between branches and subsidiaries.
Nonetheless, when we combine the branch and subsidiary data for
those institutions where this possibility exists (columns 3 and
4), we still find a strong relation between parent bank capital
ratios and lending in the United States.
29
IV. Conclusion
One unanticipated effect of the Basle Accord may be that
lending outside of Japan has become sensitive to Japan-specific
shocks, given the importance of Japanese banks worldwide. In
particular, declines in the Nikkei that may be uncorrelated with
movements in stock markets elsewhere, or declines in Japanese
real estate values uncorrelated with real estate values
elsewhere, may nonetheless be transmitted to other countries via
the lending responses of Japanese banks. Because Japanese banks
account for nearly one-fifth of commercial and industrial loans
to U.S. addresses by banks in the United States, the
international transmission of Japanese banking problems has
potentially large effects on U.S. bank lending. In fact, we find
that the Japanese parent's risk-based capital ratio has an
economically and statistically significant impact on Japanese
branch lending in the United States.
The Japanese banking experience enables us to identify a
shock to bank capital not related to demand conditions in the
United States, thus avoiding a major criticism of studies
examining the relationship between U.S. bank capital ratios and
bank lending, the difficulty in finding a good proxy for supply
shocks that are uncorrelated with changes in U.S. loan demand.
The substantial increase in Japanese stock values significantly
increased Japanese bank capital ratios in the 1980s. And, the
substantial decrease in Japanese stock values beginning in 1990
substantially decreased Japanese bank capital ratios. Thus, the
30
effects of the "bubble economy" in Japan could be transmitted to
the credit markets in the United States through the U.S. branches
and subsidiaries of Japanese banks in a way unrelated to the
demand for loans in the United States.
This international transmission of shocks that were
primarily Japanese in nature should cause some revaluation of
public policy, as financial markets and financial intermediaries
become more global. Shocks that in the past may have been
localized and easily contained within a single country now have
the potential to be spread internationally. Just how easily
these shocks can be transmitted is likely to be a function of the
national regulatory framework adopted, a factor that to date may
have received inadequate attention. While this paper focuses on
capital problems stemming from the decline in Japanese stocks,
the decline in Japanese real estate values, yet to be fully
addressed by Japanese banking regulators, represents an even
larger potential problem. Unlike the sharp decline in unrealized
gains on stock market holdings, which were observable and not
easily manipulated to avoid substantial declines in bank capital
ratios, the timing of both the write-downs of the real estate
loans and the associated additions to loan loss reserves can be
managed by banks and by regulators, as was done in many countries
during the Third World debt crisis.
The way in which Japanese regulators finally resolve the
large volume of problem real estate loans on Japanese banks'
balance sheets could have potentially serious ramifications for
31
many of their banks and, as a consequence, important implications
for credit availability in the United States and other countries
with a significant Japanese banking presence. Such issues
highlight the need for macroeconomic and regulatory policymakers
to shift to a global focus, as has already occurred in many
banking and financial markets.
This paper addresses only changes in bank loans, not the
effects of disruptions of bank credit on borrowers. However,
several previous studies have documented that even large
customers at large banks in both the United States and Japan can
be adversely affected if their banking relationship is disrupted
(Gibson 1995; Slovin, Sushka, and Polonchek 1993). This evidence
highlights the fact that the globalization of banking will
require policymakers to monitor more carefully both banking
conditions and policy responses to shocks abroad, which now may
be more easily transmitted internationally.
32
References
Bernanke, Ben S. and Cara S. Lown. 1991. "The Credit Crunch." Brookings Papers on Economic Activity , No. 2, pp. 205-
48.
Frankel, Allen B., and Paul B. Morgan. 1992 . "Deregulation and Competition in Japanese Banking." Federal Reserve Bulletin ,August, pp. 579-93.
French, Kenneth R., and James M. Poterba. 1991. "Were Japanese Stock Prices too High?" Journal of Financial Economics , October, pp. 337-63.
Gibson, Michael S. 1995. "Can Bank Health Affect Investment? Evidence from Japan." Journal of Business , vol. 68, no. 3, pp. 281-308.
Hall, Brian J. 1993. "How Has the Basle Accord Affected Bank Portfolios?" Journal of the Japanese and International
Economies , vol. 7, pp. 408-40.
Hancock, Diana and James A. Wilcox. 1995. "Bank Balance Sheet Shocks: Their Dynamic Effects on Bank Capital and Lending." Journal of Banking and Finance , vol. 19(1), pp. 661-78.
Hoshi, Takeo, Anil Kashyap, and David Scharfstein. 1991. "Corporate Structure, Liquidity, and Investment: Evidence FromJapanese Industrial Groups." Quarterly Journal of Economics ,February, pp. 33-60.
Hoshi, Takeo, Anil Kashyap, and David Scharfstein. 1990. "The Role of Banks in Reducing the Costs of Financial Distress inJapan." Journal of Financial Economics , September, pp. 67-88.
Hoshi, Takeo, David Scharfstein, and Kenneth J. Singleton. 1993. "Japanese Corporate Investment and Bank of Japan Guidance ofCommercial Bank Lending." In Kenneth J. Singleton, ed., Japanese Monetary Policy , University of Chicago Press.
Huh, Chan, and Sun Bae Kim. 1994. "How Bad Is the 'Bad Loan Problem' in Japan?" Federal Reserve Bank of San Francisco Weekly Letter , September 23.
James, Christopher. 1987. "Some Evidence on the Uniqueness of Bank Loans." Journal of Financial Economics , vol. 19, pp. 217-35.
Kim, Sun Bae, and Ramon Moreno. 1994. "Stock Prices and Bank Lending Behavior in Japan." Federal Reserve Bank of San Francisco Economic Review , no. 1, pp. 31-42.
33
McCauley, Robert N. and Rama Seth. 1992. "Foreign Bank Credit to U.S. Corporations: The Implications of Offshore Loans." Federal Reserve Bank of New York Quarterly Review , Spring, pp. 52-65.
Nolle, Daniel E. and Rama Seth. 1995. "Do Banks Follow Their Customers Abroad?" Manuscript presented at Financial
Management Association Meetings, October.
Peek, Joe and Eric S. Rosengren. 1995a. "The Capital Crunch: Neither a Borrower Nor a Lender Be." Journal of Money, Credit, and Banking , vol. 27 (3), pp. 625-38.
Peek, Joe and Eric S. Rosengren. 1995b. "Bank Regulation and the Credit Crunch." Journal of Banking and Finance , vol. 19(1), pp. 679-92.
Peek, Joe and Eric S. Rosengren. 1995c. "Banks and the Availability of Small Business Loans." Federal Reserve Bank
of Boston Working Paper No. 95-1, January.
Petersen, Mitchell A. and Raghuram G. Rajan. 1994. "The Benefits of Lending Relationships: Evidence from Small Business Data." Journal of Finance , vol. 49(1), pp. 247-67.
Prowse, Stephen D. 1990. "Institutional Investment Patterns and Corporate Financial Behavior in the United States and
Japan." Journal of Financial Economics , September, pp. 43- 66.
Seth, Rama and Alicia Quijano. 1991. "Japanese Banks' Customers in the United States." Federal Reserve Bank of New York Quarterly Review , Spring, pp. 79-82.
Scott, Hal S. and Shinsaku Iwahara. 1994. "In Search of a Level Playing Field: The Implementation of the Basle Capital Accord in Japan and the United States." Occasional Paper 46, Group of Thirty, Washington, D.C.
Slovin, Myron B., Marie E. Sushka, and John A. Polonchek. 1993. "The Value of Bank Durability: Borrowers as Bank
Stakeholders." Journal of Finance , vol. 48(1), pp. 247-67.
Stiglitz, Joseph and Andrew Weiss. 1981. "Credit Rationing in Markets with Imperfect Information." The American Economic Review , vol. 71(2), pp. 393-410.
Sugahara, Masaharu. 1994. "The Response of Japanese Banks to RiskBased Capital Regulations." In Charles A. Stone and Anne Zissu, eds., Global Risk Based Capital Regulations, Volume 1: Capital Adequacy , Irwin Professional Publishing, pp. 164-83.

34
Terrell, Henry S. 1993. "U.S. Branches and Agencies of Foreign Banks: A New Look." Federal Reserve Bulletin , October, pp. 913-25.

35
1. The term branches will be used to refer to both branches andagencies. The important distinction for us is whether the entityis included in the balance sheet of the parent bank (agencies andbranches) or not (subsidiaries).
2. The Basle Accord tried to create a "level playing field" byproviding standardized capital regulations so that allinternationally active banks would satisfy the same two minimumrisk-based capital ratios. The new regulations require tier 1(core) capital to equal at least 4 percent of risk-weightedassets. The broader measure, tier 2 capital, which includes tier1 capital as well as subordinated debt and revaluation reserves,must be equal to at least 8 percent of risk-weighted assets.
Despite the greater uniformity in regulation brought aboutby the Basle Accord, national differences remain that could havesubstantial effects on the extent to which the capitalconstraints are binding. In particular, differences acrossregulators from different nations remain in the designation ofthe set of assets allowable for tier 1 and tier 2 capital. Furthermore, regulators in different nations have alloweddifferences in the categorizations of assets placed in particularrisk classifications. For a more detailed description of thesedifferences, see Scott and Iwahara (1994). In addition,differences in reserving procedures for possible loan losses canhave a significant impact on reported capital across countries. Failure to fully reserve for expected loan losses can reduce thecomparability of capital ratios when nonperforming loans areincreasing and collateral values are decreasing.
3. The unrealized capital gains can be included in tier 2capital, as long as tier 1 capital accounts for at least 50percent of total capital. Thus, unrealized gains on stock marketholdings can only be utilized to the extent the bank hassufficient tier 1 capital to maintain the required tier 1 shareof total capital. Note that current U.S. banking restrictions onholding shares in other U.S. firms make this provision of littlerelevance to U.S. banks.
4. If a bank has substantial unrealized gains that have not beenincluded in its tier 2 capital because of the binding tier 1share constraint, an increase in tier 1 capital will increasetier 2 capital in a ratio of two to one. Thus, Japanese bankshad a strong incentive in the late 1980s to increase tier 1capital by issuing new equity or realizing gains on appreciatedassets.
5. Frankel and Morgan (1992) report that the first yearly assetdecline (5 percent) in Japanese city banks since World War IIoccurred in 1991. Our sample of banks is not limited to citybanks, but the data are limited by the availability of risk-based
Footnotes
36
capital ratios only back to September 1988. Because the data inTable 2 (below) are limited to only domestic operations andoverseas branches, they do not indicate the extent to whichoverall operations (that also include foreign subsidiaries)declined.
6. Note that the overseas data do not reflect total overseasoperations, only that of branches. While branch operations doaccount for the majority of overseas operations, subsidiaries arealso important components.
7. One intent of those developing international regulations forbanks was to limit any competition among regulators of differentnations that could result in a lowering of capital standards, inan attempt to provide competitive advantages for their owninternationally active banks. In fact, a key motivation for manyinvolved in establishing the Basle Accord was to slow theaggressive expansion of Japanese banks that included substantialpenetration of foreign markets (see, for example, Frankel andMorgan 1992; Sugahara 1994).
8. Seth and Quijano (1991) show that in the early 1980s as muchas three-fourths of Japanese branch lending in the United Stateswas to Japanese firms, but by 1989 Japanese firms accounted forno more than two-fifths of Japanese branch lending in the UnitedStates.
9. The extent of foreign bank asset growth during this period isoverstated, reflecting as it does the shift from offshore toonshore banking activity after the December 1990 elimination ofthe reserve requirement for large time deposits and Eurocurrencyborrowings for their banking offices located in the United States(Terrell 1993). However, the assets of Japanese banks operatingin the Cayman Islands declined much more than those of other non-U.S. banks, with the market share of Japanese assets in theCayman Islands declining substantially by the end of 1992. Thus,the data in Figure 2 also would understate the decline in U.S.operations of Japanese banks to the extent that Japanese banksshifted some offshore U.S. activity onshore.
McCauley and Seth (1992) and Terrell (1993) provide a morecomplete discussion of offshore banking activity. In general,Japanese banks booked relatively few C&I loans at offshorelocations, with only 4 percent of C&I loans to U.S. addressesbooked by Japanese branches located at offshore locations in1993. In contrast, non-Japanese foreign banks booked significantC&I loans offshore. For example, 57 percent of French, 81percent of German, and 42 percent of Canadian C&I loans to U.S.addresses were booked at offshore rather than onshore branches. Terrell (1993) reports that 90 percent of offshore branch assetsand liabilities were booked in the Cayman Islands. Reports fromthe Cayman Islands indicate that from year-end 1991 to year-end1992 the Japanese bank share of assets in the Cayman Islands
37
decreased from 20.6 percent to 13.1 percent.
10. This includes all Japanese banks with significant U.S.operations but excludes approximately 20 Japanese banks that havevery small operations in the United States and for which we haveno parent capital data. The total C&I loans of these omittedbanks together represent less than 3 percent of Japanese C&Ilending in the United States. The data on parent banks includeall city banks and long-term credit banks. While seven trustbanks operate in Japan, we have not included the two smallest,which have no significant presence in the United States. Forexample, Chuo, the larger of the two omitted trust banks, doesnot operate a branch or subsidiary in the United States, althoughit does have one small agency. We also have included the 10largest regional banks, each of which has at least one branch(but none a subsidiary) in the United States.
11. Japanese city banks are prohibited from engaging in trust-related business or holding long-term bank debt or deposits. Long-term credit banks are restricted in Japan to acceptingdeposits from their borrowers and from governments; they also areallowed to issue long-term debt. Trust banks are intended toengage primarily in trust business in Japan.
12. We also constructed alternative loan growth series measuredrelative to the average loan growth in the state (or states) inwhich the branches or subsidiaries operated. However, theresults with these alternative dependent variables and with stateemployment growth substituted for U.S. employment growth werevery similar to those for the United States, and thus are notreported in the tables.
Tab
le 1
Japa
nese
Ban
k Lo
ans
(Loa
ns s
tate
d in
100
mill
ion
yen)
All
Japa
nese
Ban
ksC
ity B
anks
Reg
iona
l Ban
ks
Japa
nO
vers
eas
Japa
nO
vers
eas
RB
C R
atio
Japa
nO
vers
eas
RB
C R
atio
Ma
r-8
72
,50
6,8
80
29
4,0
54
1,3
12
,91
46
89
,77
8
Ma
r-8
82
,84
6,3
59
35
6,4
43
1,5
06
,46
57
78
,88
9
Ma
r-8
93
,17
5,6
72
45
8,4
83
1,6
76
,96
23
41
,68
29
.95
8
86
,15
5
8,2
41
10
.41
Ma
r-9
03
,55
8,7
35
*6
76
,53
01
,87
4,6
52
48
7,7
41
8.6
41
,01
6,6
37
14
,30
78
.86
Ma
r-9
13
,74
3,5
34
*7
33
,95
32
,00
0,2
05
52
4,6
96
8.9
31
,06
9,9
96
17
,12
39
.52
Ma
r-9
23
,88
8,2
95
*7
42
,89
02
,06
8,7
32
54
1,8
05
8.2
11
,13
1,6
56
19
,84
98
.75
Ma
r-9
34
,02
5,5
05
*6
73
,41
42
,13
1,4
72
50
1,3
03
9.2
61
,18
1,8
75
16
,62
69
.55
Ma
r-9
44
,06
6,6
82
*6
17
,81
02
,13
2,3
18
47
5,4
86
9.6
51
,21
2,3
63
14
,86
01
0.1
3
Tru
st B
anks
Long
-Ter
m C
redi
t Ban
ks
Japa
nO
vers
eas
RB
C R
atio
Japa
nO
vers
eas
RB
C R
atio
Ma
r-8
71
86
,62
23
17
,56
5
Ma
r-8
82
05
,46
13
55
,54
2
Ma
r-8
92
22
,79
75
7,9
90
13
.45
38
9,7
56
50
,56
81
0.3
9
Ma
r-9
02
36
,50
39
6,6
20
11
.46
43
0,9
41
77
,86
09
.44
Ma
r-9
12
16
,71
21
12
,96
31
0.2
94
56
,62
07
8,5
35
8.9
5
Ma
r-9
22
16
,99
51
09
,83
18
.56
47
0,9
09
70
,73
28
.31
Ma
r-9
32
39
,06
49
6,3
60
10
.02
47
3,0
92
58
,22
08
.99
Ma
r-9
42
49
,97
27
9,6
60
10
.42
47
2,0
27
46
,89
49
.26
Not
e:R
BC
Rat
io is
the
sim
ple
aver
age
of th
e ris
k-ba
sed
capi
tal r
atio
s of
the
bank
s in
our
sam
ple,
whi
le th
e Ja
pan
and
Ove
rsea
s lo
ans
tota
ls
incl
ude
all i
nstit
utio
ns in
the
cate
gory
.*
To
get a
mor
e co
nsis
tent
ser
ies,
the
Japa
n al
l-ban
ks d
ata
are
adju
sted
to e
xclu
de R
egio
nal I
I ban
ks b
egin
ning
in M
arch
199
0.S
ourc
e: E
cono
mic
Sta
tistic
s A
nnua
l, B
ank
of J
apan
.
Tab
le 2
15 L
arge
st W
orld
Ban
king
Org
aniz
atio
ns, B
ased
on
Tot
al A
sset
s
Ran
k1
98
01
98
81
99
4
Nam
eC
ount
ryN
ame
Cou
ntry
Nam
eC
ount
ry
1C
itico
rp, N
ew Y
ork
Uni
ted
Sta
tes
Dai
-Ich
i Kan
gyo
Ban
k Lt
d.,
Japa
nS
anw
a B
ank
Ltd,
. Osa
kaJa
pan
Tok
yo2
Ban
que
Nat
iona
le d
e P
aris
Fra
nce
Sum
itom
o B
ank
Ltd.
, Osa
kaJa
pan
Dai
-Ich
i Kan
gyo
Ban
k Lt
d.,
Japa
nT
okyo
3B
ankA
mer
ica
Cor
p,U
nite
d S
tate
sF
uji B
ank,
Ltd
., T
okyo
Japa
nF
uji B
ank,
Ltd
., T
okyo
Japa
nS
an F
ranc
iso
4C
redi
t Agr
icol
e M
utue
l,F
ranc
eM
itsub
ishi
Ban
k Lt
d., T
okyo
Japa
nS
umito
mo
Ban
k Lt
d., O
saka
Japa
nP
aris
5C
redi
t Lyo
nnai
s, P
aris
Fra
nce
San
wa
Ban
k Lt
d., O
saka
Japa
nS
akur
a B
ank,
Ltd
., T
okyo
Japa
n6
Soc
iete
Gen
eral
e, P
aris
Fra
nce
Indu
stria
l Ban
k of
Jap
an, L
td.,
Japa
nM
itsub
ishi
Ban
k Lt
d., T
okyo
Japa
nT
okyo
7B
arcl
ays
Ban
k Lt
d., L
ondo
nU
nite
dN
orin
chuk
in B
ank,
Tok
yoJa
pan
Nor
inch
ukin
Ban
k, T
okyo
Japa
nK
ingd
om8
Deu
tsch
e B
ank,
Fra
nkfu
rtG
erm
any
Tok
ai B
ank
Ltd.
, Nag
oya
Japa
nIn
dust
rial B
ank
of J
apan
, Ltd
.,Ja
pan
Tok
yo9
Nat
iona
l Wes
tmin
ster
Ban
kU
nite
dM
itsui
Ban
k, L
td.,
Tok
yoJa
pan
Mits
ubis
hi T
rust
& B
anki
ngJa
pan
Ltd.
, Lon
don
Kin
gdom
Cor
p., T
okyo
10
Dai
-Ich
i Kan
gyo
Ban
k Lt
d.,
Japa
nM
itsub
ishi
Tru
st &
Ban
king
Japa
nLo
ng T
erm
Cre
dit B
ank
ofJa
pan
Tok
yoC
orp.
, Tok
yoJa
pan
Ltd.
, Tok
yo1
1C
hase
Man
hatta
n C
orp.
,U
nite
d S
tate
sC
redi
t Agr
icol
e M
utue
l, P
aris
Fra
nce
Deu
tsch
e B
ank,
AG
, Fra
nkfu
rtG
erm
any
New
Yor
k1
2F
uji B
ank,
Ltd
., T
okyo
Japa
nC
itico
rp, N
ew Y
ork
Uni
ted
Sta
tes
Sum
itom
o T
rust
& B
anki
ngJa
pan
Co.
, Ltd
., T
okyo
13
Mits
ubis
hi B
ank
Ltd.
,Ja
pan
Sum
itom
o T
rust
& B
anki
ngJa
pan
Tok
ai B
ank
Ltd.
, Nag
oya
Japa
nT
okyo
Co.
, Ltd
., T
okyo
14
Sum
itom
o B
ank,
Ltd
.,Ja
pan
Ban
que
Nat
iona
le d
e P
aris
Fra
nce
Mits
ui T
rust
& B
anki
ng C
o.,
Japa
nO
saka
Ltd.
, Tok
yo1
5S
anw
a B
ank
Ltd.
, Osa
kaJa
pan
Bar
clay
s P
LC, L
ondo
nU
nite
dC
redi
t Agr
icol
e M
utue
l, P
aris
Fra
nce
Kin
gdom
Sou
rce:
Am
eric
an B
anke
r v
ario
us is
sues
.
Tab
le 3
Det
erm
inan
ts o
f Jap
anes
e Le
ndin
g in
the
Uni
ted
Sta
tes,
U.S
. Bra
nche
s, 1
989:
1 to
199
4:2
Est
imat
ion
Var
ianc
eV
aria
nce
Fix
ed E
ffect
sV
aria
nce
Var
ianc
eF
ixed
Effe
cts
Met
hod
Com
pone
nts
Com
pone
nts
Com
pone
nts
Com
pone
nts
Dep
ende
ntªLo
anªLo
an -ªU
SLo
anªLo
an ª
CI
ªC
I -
ªU
SC
I ª
CI
Var
iabl
eA
sset
Ass
et
US
Ass
etA
sset
Ass
etA
sset
U
SA
sset
Ass
et
Con
stan
t-3
9.1
25
*-3
7.8
96
*-
-3.5
85
-4.0
15
-(2
.26
)(2
.21
)(0
.26
)(0
.29
)
Par
ent R
BC
2.2
11
**2
.07
6**
2.3
90
**0
.67
6**
0.6
67
**0
.68
4*
(7.0
9)
(6.7
1)
(5.5
6)
(2.8
2)
(2.7
9)
(2.0
7)
Land
Pric
e0
.53
2**
0.5
91
**0
.50
9**
0.3
03
**0
.32
5**
0.3
35
**(6
.26
)(7
.00
)(5
.23
)(4
.77
)(5
.13
)(4
.60
)
FD
I0
.07
5**
0.0
68
**0
.07
7**
0.0
58
**0
.05
6**
0.0
55
**(3
.57
)(3
.27
)(3
.11
)(3
.42
)(3
.31
)(2
.79
)
Em
p G
row
th0
.84
3*
0.4
19
0.8
02
0.4
27
0.3
06
0.3
09
(2.2
7)
(1.1
4)
(1.9
4)
(1.5
0)
(1.0
8)
(0.9
8)
Log(
Ass
et)
1.3
28
1.3
08
1.6
32
0.1
31
0.1
75
-2.1
21
(1.3
5)
(1.3
5)
(0.5
5)
(0.1
7)
(0.2
3)
(0.9
4)
NP
L0
.04
10
.05
30
.08
5-0
.31
8*
-0.3
15
*-0
.28
6(0
.36
)(0
.47
)(0
.62
)(2
.04
)(2
.03
)(1
.63
)
CI/A
0.0
31
0.0
28
0.0
72
-0.0
62
*-0
.06
2*
-0.1
78
**(0
.88
)(0
.80
)(1
.11
)(2
.26
)(2
.28
)(3
.68
)
RE
/A-0
.04
9-0
.04
5-0
.05
7-0
.00
4-0
.00
10
.00
4(0
.93
)(0
.86
)(0
.57
)(0
.09
)(0
.02
)(0
.06
)
Tru
st-0
.00
80
.24
2-
-0.3
63
-0.3
32
-(0
.01
)(0
.17
)(0
.32
)(0
.29
)
Long
-Ter
m1
.68
91
.79
2-
2.8
46
*2
.86
8*
-(1
.07
)(1
.14
)(2
.28
)(2
.31
)
Reg
iona
l2
.74
12
.75
0-
-1.2
76
-1.1
49
-(0
.96
)(0
.97
)(0
.56
)(-
0.5
1)
Hau
sman
test
P-v
alue
0.9
98
0.9
99
-0
.62
60
.64
0-
Obs
erva
tions
31
53
15
31
53
15
31
53
15
R0
.43
20
.41
40
.42
30
.29
80
.28
80
.30
42
SS
R1
15
26
11
37
31
10
83
68
13
67
89
64
66
SE
R6
.47
46
.43
16
.31
44
.97
84
.96
94
.82
3
Not
e: T
he d
ata
are
sem
i-ann
ual o
bser
vatio
ns fo
r M
arch
and
Sep
tem
ber.
Ind
epen
dent
var
iabl
es a
re m
easu
red
as o
f beg
inni
ng o
f per
iod;
FD
I and
empl
oym
ent g
row
th a
re m
easu
red
over
the
prio
r si
x-m
onth
per
iod.
NP
L is
mea
sure
d as
non
perf
orm
ing
loan
s as
a s
hare
of l
oans
in th
e fir
st th
ree
colu
mns
and
as
nonp
erfo
rmin
g C
&I l
oans
as
a sh
are
of C
&I l
oans
in th
e la
st th
ree
colu
mns
. A
bsol
ute
valu
es o
f t-s
tatis
tics
are
in p
aren
thes
es.

* S
igni
fican
t at t
he 5
per
cent
leve
l.**
Sig
nific
ant a
t the
1 p
erce
nt le
vel.
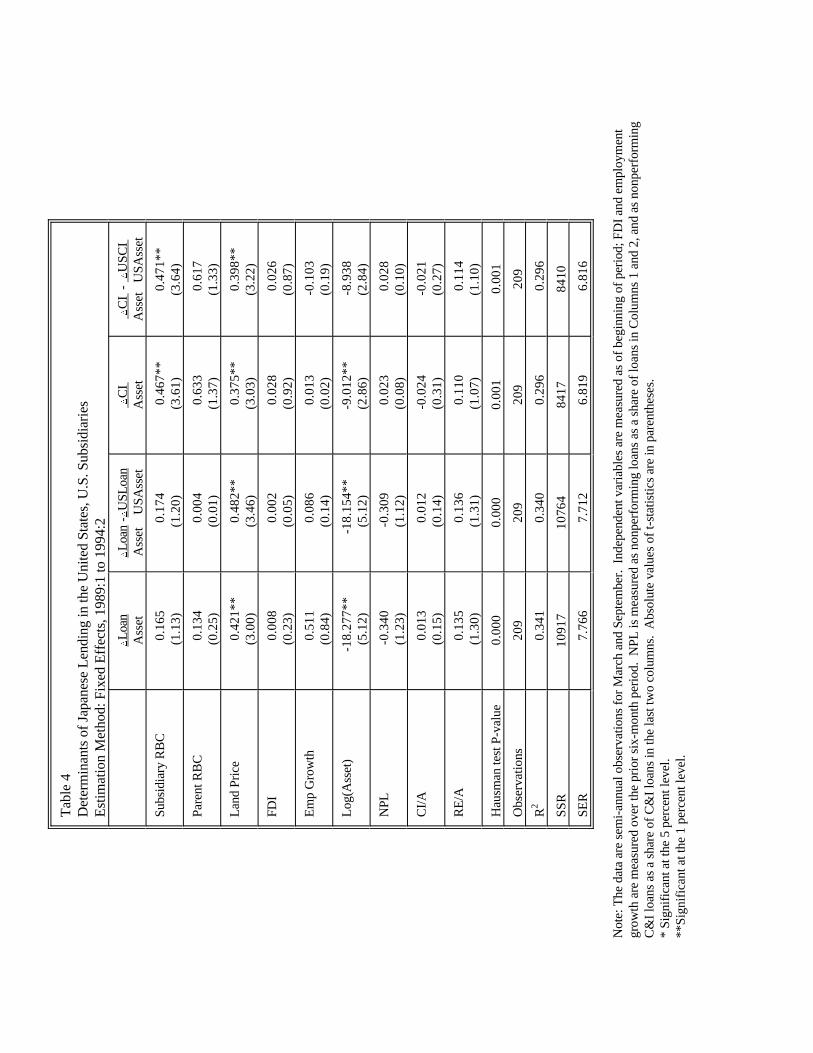
Tab
le 4
Det
erm
inan
ts o
f Jap
anes
e Le
ndin
g in
the
Uni
ted
Sta
tes,
U.S
. Sub
sidi
arie
sE
stim
atio
n M
etho
d: F
ixed
Effe
cts,
198
9:1
to 1
994:
2
ªLo
anªLo
an -ªU
SLo
an ª
CI
ªC
I -
ªU
SC
I A
sset
Ass
et
US
Ass
etA
sset
Ass
et
US
Ass
et
Sub
sidi
ary
RB
C0
.16
50
.17
40
.46
7**
0.4
71
**(1
.13
)(1
.20
)(3
.61
)(3
.64
)
Par
ent R
BC
0.1
34
0.0
04
0.6
33
0.6
17
(0.2
5)
(0.0
1)
(1.3
7)
(1.3
3)
Land
Pric
e0
.42
1**
0.4
82
**0
.37
5**
0.3
98
**(3
.00
)(3
.46
)(3
.03
)(3
.22
)
FD
I0
.00
80
.00
20
.02
80
.02
6(0
.23
)(0
.05
)(0
.92
)(0
.87
)
Em
p G
row
th0
.51
10
.08
60
.01
3-0
.10
3(0
.84
)(0
.14
)(0
.02
)(0
.19
)
Log(
Ass
et)
-18
.27
7**
-18
.15
4**
-9.0
12
**-8
.93
8(5
.12
)(5
.12
)(2
.86
)(2
.84
)
NP
L-0
.34
0-0
.30
90
.02
30
.02
8(1
.23
)(1
.12
)(0
.08
)(0
.10
)
CI/A
0.0
13
0.0
12
-0.0
24
-0.0
21
(0.1
5)
(0.1
4)
(0.3
1)
(0.2
7)
RE
/A0
.13
50
.13
60
.11
00
.11
4(1
.30
)(1
.31
)(1
.07
)(1
.10
)
Hau
sman
test
P-v
alue
0.0
00
0.0
00
0.0
01
0.0
01
Obs
erva
tions
20
92
09
20
92
09
R0
.34
10
.34
00
.29
60
.29
62
SS
R1
09
17
10
76
48
41
78
41
0
SE
R7
.76
67
.71
26
.81
96
.81
6
Not
e: T
he d
ata
are
sem
i-ann
ual o
bser
vatio
ns fo
r M
arch
and
Sep
tem
ber.
Ind
epen
dent
var
iabl
es a
re m
easu
red
as o
f beg
inni
ng o
f per
iod;
FD
I and
em
ploy
men
tgr
owth
are
mea
sure
d ov
er th
e pr
ior
six-
mon
th p
erio
d. N
PL
is m
easu
red
as n
onpe
rfor
min
g lo
ans
as a
sha
re o
f loa
ns in
Col
umns
1 a
nd 2
, and
as
nonp
erfo
rmin
gC
&I l
oans
as
a sh
are
of C
&I l
oans
in th
e la
st tw
o co
lum
ns.
Abs
olut
e va
lues
of t
-sta
tistic
s ar
e in
par
enth
eses
.*
Sig
nific
ant a
t the
5 p
erce
nt le
vel.
**S
igni
fican
t at t
he 1
per
cent
leve
l.
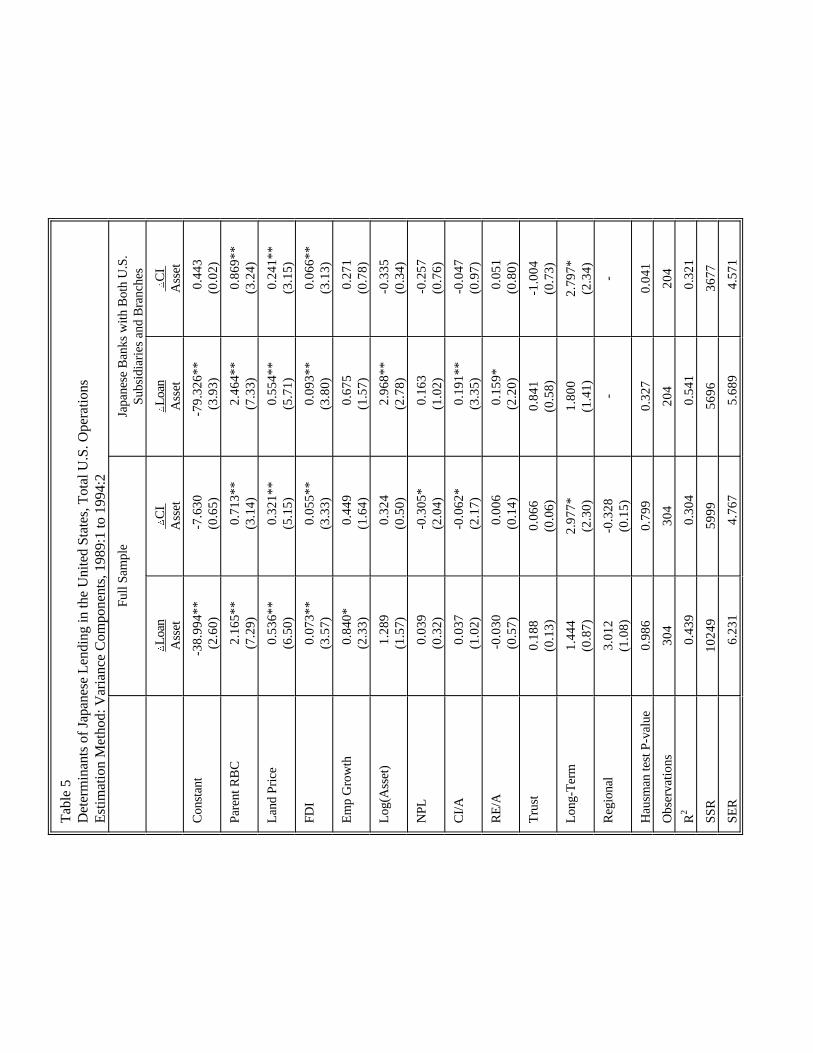
Tab
le 5
Det
erm
inan
ts o
f Jap
anes
e Le
ndin
g in
the
Uni
ted
Sta
tes,
Tot
al U
.S. O
pera
tions
Est
imat
ion
Met
hod:
Var
ianc
e C
ompo
nent
s, 1
989:
1 to
199
4:2
Ful
l Sam
ple
Japa
nese
Ban
ks w
ith B
oth
U.S
.S
ubsi
diar
ies
and
Bra
nche
s
ªLo
an ª
CI
ªLo
an ª
CI
Ass
etA
sset
Ass
etA
sset
Con
stan
t-3
8.9
94
**-7
.63
0-7
9.3
26
**0
.44
3(2
.60
)(0
.65
)(3
.93
)(0
.02
)
Par
ent R
BC
2.1
65
**0
.71
3**
2.4
64
**0
.86
9**
(7.2
9)
(3.1
4)
(7.3
3)
(3.2
4)
Land
Pric
e0
.53
6**
0.3
21
**0
.55
4**
0.2
41
**(6
.50
)(5
.15
)(5
.71
)(3
.15
)
FD
I0
.07
3**
0.0
55
**0
.09
3**
0.0
66
**(3
.57
)(3
.33
)(3
.80
)(3
.13
)
Em
p G
row
th0
.84
0*
0.4
49
0.6
75
0.2
71
(2.3
3)
(1.6
4)
(1.5
7)
(0.7
8)
Log(
Ass
et)
1.2
89
0.3
24
2.9
68
**-0
.33
5(1
.57
)(0
.50
)(2
.78
)(0
.34
)
NP
L0
.03
9-0
.30
5*
0.1
63
-0.2
57
(0.3
2)
(2.0
4)
(1.0
2)
(0.7
6)
CI/A
0.0
37
-0.0
62
*0
.19
1**
-0.0
47
(1.0
2)
(2.1
7)
(3.3
5)
(0.9
7)
RE
/A-0
.03
00
.00
60
.15
9*
0.0
51
(0.5
7)
(0.1
4)
(2.2
0)
(0.8
0)
Tru
st0
.18
80
.06
60
.84
1-1
.00
4(0
.13
)(0
.06
)(0
.58
)(0
.73
)
Long
-Ter
m1
.44
42
.97
7*
1.8
00
2.7
97
*(0
.87
)(2
.30
)(1
.41
)(2
.34
)
Reg
iona
l3
.01
2-0
.32
8-
-(1
.08
)(0
.15
)
Hau
sman
test
P-v
alue
0.9
86
0.7
99
0.3
27
0.0
41
Obs
erva
tions
30
43
04
20
42
04
R0
.43
90
.30
40
.54
10
.32
12
SS
R1
02
49
59
99
56
96
36
77
SE
R6
.23
14
.76
75
.68
94
.57
1
Not
e: T
he d
ata
are
sem
i-ann
ual o
bser
vatio
ns fo
r M
arch
and
Sep
tem
ber.
Ind
epen
dent
var
iabl
es a
re m
easu
red
as o
f beg
inni
ng o
f per
iod;
FD
I and
em
ploy
men
tgr
owth
are
mea
sure
d ov
er th
e pr
ior
six-
mon
th p
erio
d. N
PL
is m
easu
red
as n
onpe
rfor
min
g lo
ans
as a
sha
re o
f loa
ns in
col
umns
1 a
nd 3
, and
mea
sure
d as
nonp
erfo
rmin
g C
&I l
oans
as
a sh
are
of C
&I l
oans
in c
olum
ns 2
and
4.
Abs
olut
e va
lues
of t
-sta
tistic
s ar
e in
par
enth
eses
.*
Sig
nific
ant a
t the
5 p
erce
nt le
vel.
**S
igni
fican
t at t
he 1
per
cent
leve
l.
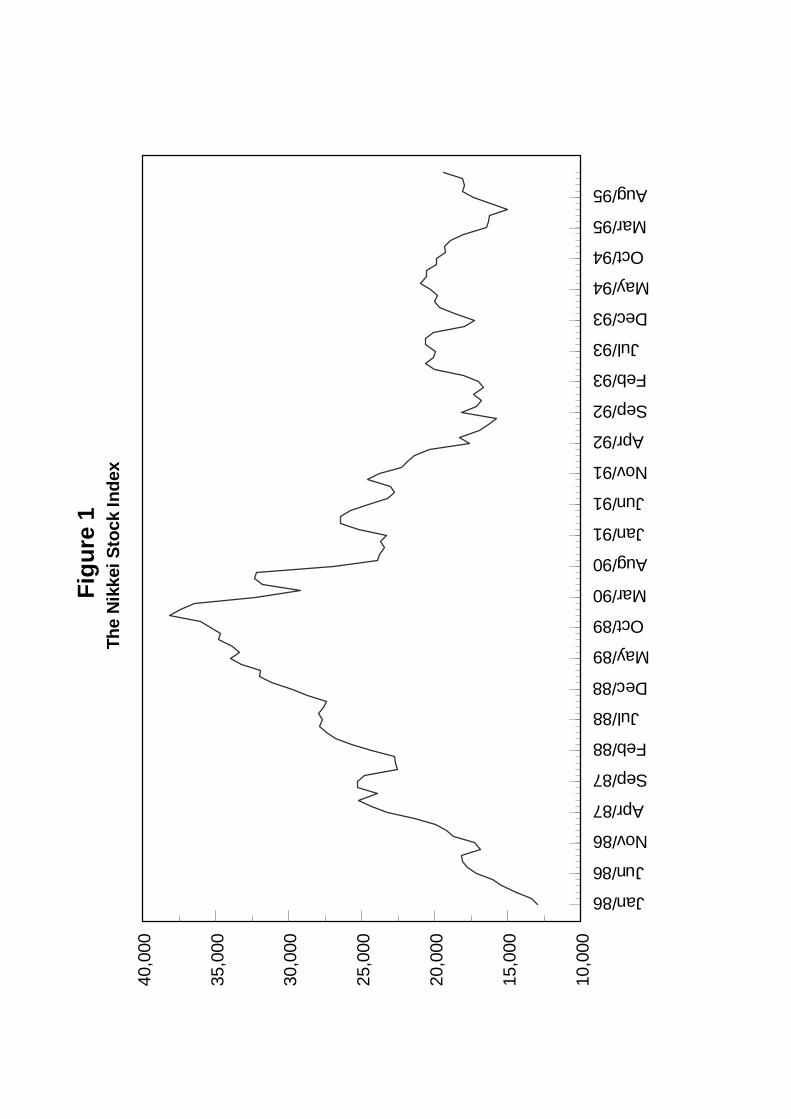
Fig
ure
1Th
e N
ikke
i Sto
ck In
dex
Jan/86
Jun/86
Nov/86
Apr/87
Sep/87
Feb/88
Jul/88
Dec/88
May/89
Oct/89
Mar/90
Aug/90
Jan/91
Jun/91
Nov/91
Apr/92
Sep/92
Feb/93
Jul/93
Dec/93
May/94
Oct/94
Mar/95
Aug/95
10,0
00
15,0
00
20,0
00
25,0
00
30,0
00
35,0
00
40,0
00
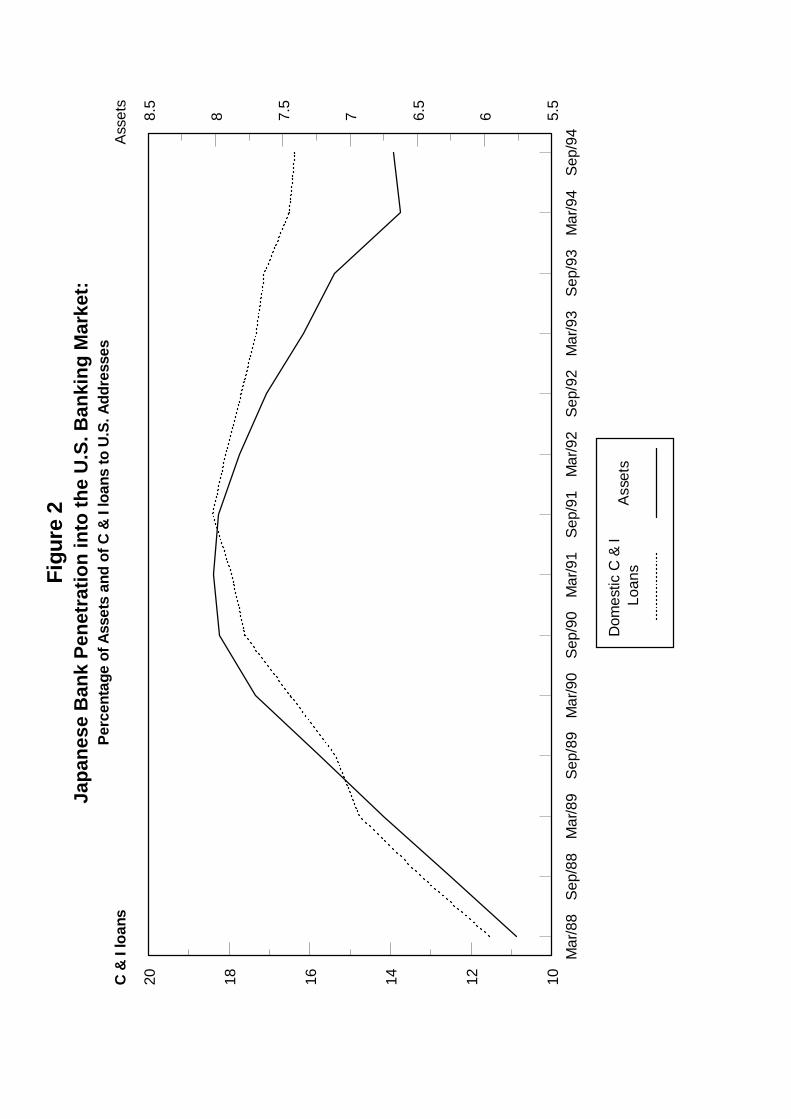
Fig
ure
2Ja
pane
se B
ank
Pen
etra
tion
into
the
U.S
. Ban
king
Mar
ket:
Per
cent
age
of A
sset
s an
d of
C &
I lo
ans
to U
.S. A
ddre
sses
Mar
/88
Sep
/88
Mar
/89
Sep
/89
Mar
/90
Sep
/90
Mar
/91
Sep
/91
Mar
/92
Sep
/92
Mar
/93
Sep
/93
Mar
/94
Sep
/94
101214161820
5.5
66.5
77.5
88.5
C &
I lo
ans
Ass
ets
Dom
estic
C &
I Lo
ans
Ass
ets
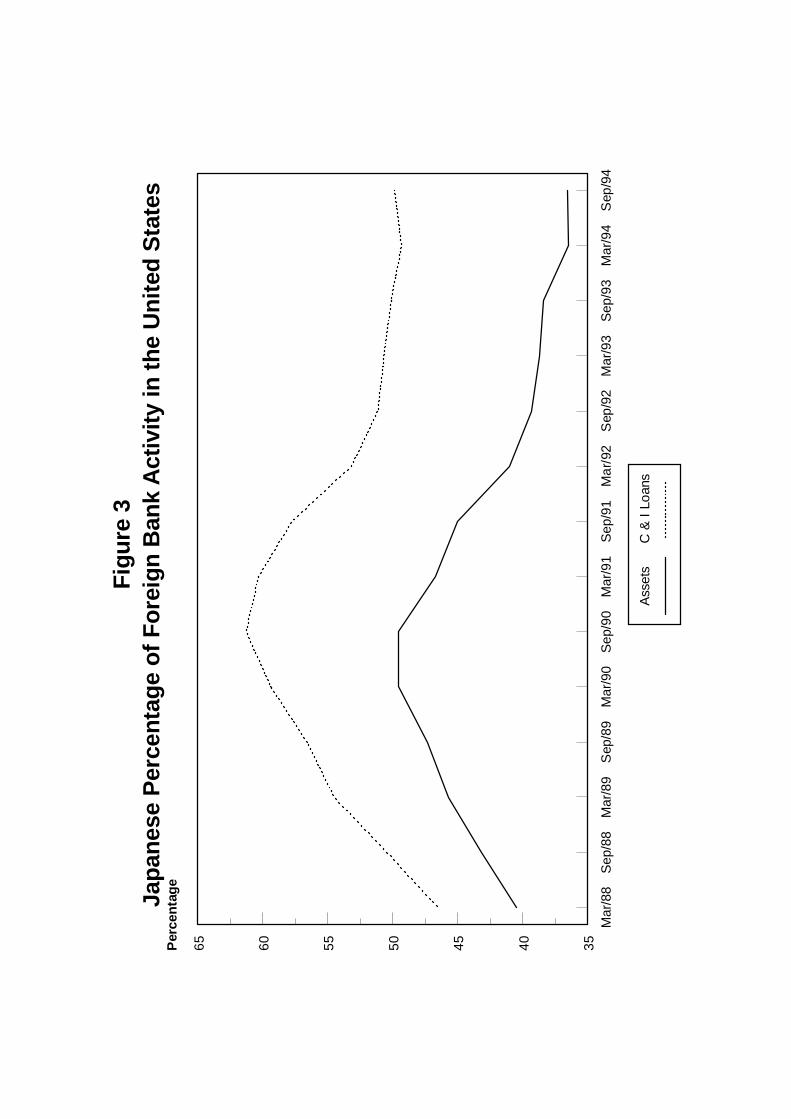
Fig
ure
3Ja
pane
se P
erce
ntag
e of
For
eign
Ban
k A
ctiv
ity in
the
Uni
ted
Sta
tes
Mar
/88
Sep
/88
Mar
/89
Sep
/89
Mar
/90
Sep
/90
Mar
/91
Sep
/91
Ma
r/92
Sep
/92
Mar
/93
Sep
/93
Mar
/94
Sep
/94
35404550556065Per
cent
age
Ass
ets
C &
I Lo
ans
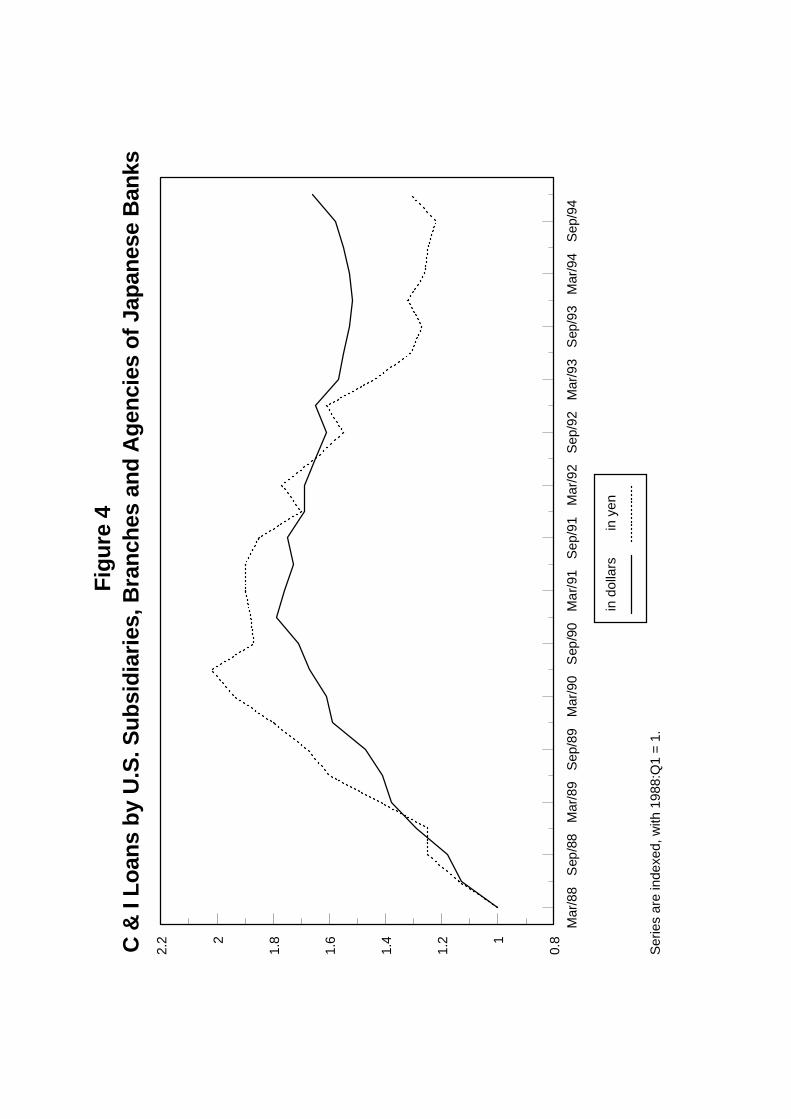
Fig
ure
4C
& I
Loan
s by
U.S
. Sub
sidi
arie
s, B
ranc
hes
and
Age
ncie
s of
Jap
anes
e B
anks
Ser
ies
are
inde
xed,
with
198
8:Q
1 =
1.
Mar
/88
Sep
/88
Mar
/89
Sep
/89
Mar
/90
Sep
/90
Ma
r/91
Sep
/91
Mar
/92
Sep
/92
Mar
/93
Sep
/93
Mar
/94
Sep
/94
0.81
1.2
1.4
1.6
1.82
2.2
in d
olla
rsin
yen