Embed Size (px)
Citation preview
AAMJAF, Vol. 8, No. 1, 1–23, 2012
©Asian Academy of Management and Penerbit Universiti Sains Malaysia 2012
THE INVESTMENT PERFORMANCE OF MESDAQ
MARKET INITIAL PUBLIC OFFERINGS (IPOs)
Nurwati A. Ahmad-Zaluki
1* and Lim Boon Kect
2
1Graduate School of Business, Universiti Utara Malaysia,
06010 UUM Sintok, Kedah, Malaysia 2Ecu-Line Singapore Pte Ltd, 237 Pandan Loop, #06-07,
Westech Building, Singapore 128424
*Corresponding author: [email protected]
ABSTRACT
This study provides evidence on both the short-run and long-run investment performance
of Malaysian initial public offering (IPO) companies that are listed on the MESDAQ
Market. The factors that influence the performance are also investigated. In line with past
Malaysian studies, the results of the raw and market-adjusted initial returns show that
IPO companies are significantly underpriced in the short-run. However, in the long-run,
both the CAR and the BHAR methods reveal that these companies underperform the
market. Our results concerning the long-run performance contrast with the results
observed by previous Malaysian studies using a sample of companies listed on the Main
Board and/or the Second Board. However, they are consistent with the results reported in
other countries. We find that companies in the technology sector, issued in a hot issue
period and underpriced IPO, perform less well in the long-run, which supports the fad
hypothesis of long-run underperformance. Our results suggest that investors who
purchase IPO shares on the MESDAQ Market gain high positive returns in the short-run
but do not fare well in the long-run. This study provides new information to investors
when choosing IPOs listed on Bursa Malaysia.
Keywords: IPO, Malaysia, underpricing, long-run performance, MESDAQ Market
INTRODUCTION
The study of initial public offering (IPO) companies' performance has attracted
great interest from global researchers and academic scholars. The global evidence
and associated results suggest that IPO companies generate positive short-run
(initial) returns, usually known as underpricing. For example, Kirkulak (2008)
reports that Japanese IPOs generate a statistically significant 49.93% return in the
short-run. The empirical evidence also shows that IPO companies underperform
the market in the long-run. Goergen, Khurshed and Mudambi (2007) reported
that in the three-year period following IPOs, the cumulative average abnormal
ASIAN ACADEMY of
MANAGEMENT JOURNAL
of ACCOUNTING
and FINANCE
Nurwati A. Ahmad-Zaluki and Lim Boon Kect
2
return (CAR) and the buy-and-hold abnormal return (BHAR) for U.K. IPOs are
–20.76% and –21.98%, respectively, and are significantly different from zero at
the 1% level.
IPOs are very important in most countries, particularly in developing
countries such as Malaysia. IPO pricing and performance should be monitored
via research to determine whether the financial market is efficient. In Malaysia,
IPO companies must be listed on the Kuala Lumpur Stock Exchange (KLSE),
currently known as Bursa Malaysia, to become publicly traded companies. There
are three boards available – the Main Board, the Second Board, and the
MESDAQ Market. Companies listed on the Main Board are typically (but not
always) larger than those listed on the Second Board. The MESDAQ Market is a
market for technology-based listing companies.1
Considerable research has been conducted on the performance of IPO
companies, both locally and overseas. Among non-Malaysian published studies,
Sahi and Lee (2001) examined the short-run performance of property company
IPOs in the U.K. In China, Li and Naughton (2007) examined board
characteristics, initial returns and long-run performance of IPO companies.
Malaysian published studies include, among others, Corhay, Teo and Tourani-
Rad (2002), and Ahmad-Zaluki, Campbell and Goodacre (2007), who
investigated the long-run share price performance of IPO companies listed on the
Main Board and the Second Board of Bursa Malaysia.
A recently published study by Ahmad-Zaluki et al. (2007) reported that
there have been limited studies relating to the Malaysian market. Most studies of
new equities issues in Malaysia examine only the short-run performance. They
argue that the results concerning the long-run performance of Malaysian IPOs
from the existing studies are inconclusive. Furthermore, all the prior studies that
have been conducted in Malaysia used a sample of IPO companies that were
listed either on the Main Board, the Second Board or both. To date, no research
has been carried out examining the long-run performance of IPO companies
listed on the MESDAQ Market. Therefore, there is a need to extend the existing
research and investigate MESDAQ Market IPOs to add to the existing knowledge
on the overall performance of the Malaysian IPO market. This paper is also
motivated by the inconsistent results in previous studies of IPOs in the Malaysian
market and uses an alternative market as well as more recent data. We have also
extended our analysis of what factors influence the level of short-run returns by
including two new variables: technology/non-technology company and hold/cold
issue period. The inclusion of these two variables in our regression model of
short-run performance and in our cross-sectional analysis of long-run
performance provides a strong contribution to the Malaysian IPO literature.
Investment Performance MESDAQ IPOs
3
Using a sample of 93 MESDAQ Market IPO companies, we find that our
sample is significantly underpriced in the short run. However, in the long run,
both the CAR and the BHAR methods that we employed reveal that these
companies underperform the market. Our results contrast with the results
observed in earlier Malaysian studies on companies listed on the Main Board
and/or the Second Board in Malaysia. However, they are consistent with the
results reported in other countries. We find that companies in the technology
sector, those issued in a hot issue period, and companies with higher initial
returns perform less well in the long run. Overall, our results support the fad
hypothesis of long-run underperformance.
LITERATURE REVIEW
Theoretical Explanation and Prior Evidence on Short-run and Long-run
Performance
The best-known pattern associated with IPO pricing is the occurrence of large
positive initial returns that are credited to investors. A number of explanations
have been advanced for positive short-run returns, including Winner's Curse
(Rock, 1986), Legal Liability (Tinic, 1988), Dynamic Information Acquisition
(Benveniste & Spindt, 1989), Signalling (Allen & Faulhaber, 1989),
Informational Cascades (Welch, 1992), and Ownership and Control (Brennan &
Franks, 1997).
Another pattern associated with IPOs is that IPOs generally
underperform in the long-run (Ritter, 2003). A number of theories have been
propounded to explain these phenomena, including Signalling (Allen &
Faulhaber, 1989), Divergence of Opinion (Miller, 1977), Fad Hypothesis
(Aggarwal & Rivoli, 1990); Window of Opportunity (Ritter, 1991) and
Measurement Problems (Eckbo, Masulis, & Norli, 2000).
There is another pattern associated with IPOs, namely 'hot issue' markets.
This refers to the time-series behaviour of first-day returns and the number of
companies coming to market, in which high initial returns tend to be followed by
rising IPO volumes (Ritter, 1984).
Several studies were undertaken in Malaysia to investigate the short-run
and the long-run share price performance of IPOs, including Paudyal, Saadouni
and Briston (1998), Jelic, Saadouni and Briston (2001), Corhay et al. (2002),
Ahmad-Zaluki et al. (2007) and How, Jelic, Saadouni and Verhoeven (2007).
Jelic et al. (2001) and Paudyal et al. (1998) examined the performance of
Malaysian IPOs using only Main Board sample companies. Jelic et al. (2001)
Nurwati A. Ahmad-Zaluki and Lim Boon Kect
4
used a sample of 182 IPOs for the period from January 1980 to December 1995,
while Paudyal et al. (1998) employed 95 IPOs for the period from January 1984
to September 1995, based on the availability of data. Both studies measured
initial return by calculating the raw return and the market-adjusted initial return.
Jelic et al. (2001) measured long-run performance by using both the BHAR and
the wealth-relative (WR) methods, while Paudyal et al. (1998) employed the
BHAR method to measure long-run performance.
Jelic et al. (2001) found that there is an extremely high and statistically
significant positive short-run performance and a statistically significant positive
long-run return up to three years after listing. However, Paudyal et al. (1998)
found that on average, Malaysian IPOs are underpriced and privatisation IPOs
(PIPOs) offer significantly higher short-run returns than other IPOs. In addition,
regression-based analysis reveals that over-subscription, market volatility,
proportion of shares sold, underwriter reputation, and ex ante risk explained the
variation in the excess returns offered by Malaysian PIPOs. However, the
Paudyal model can only explain 10% and 36% of other IPOs and the whole
sample, respectively, and neither PIPOs nor other IPOs significantly
outperformed the market over three years. Their analysis further revealed that the
IPOs with higher initial returns underperformed the market, while those with low
initial returns outperformed the market. Jelic et al. (2001) found that there is no
evidence that IPO offers underwritten by more prestigious underwriters are better
long-term investments compared to those underwritten by less prestigious
underwriters. Their results indicate a negative association of upward bias in
management earnings forecasts with IPO performance during the first twelve
months after the IPOs. However, Paudyal et al. (1998) found that IPOs
underwritten by reputable underwriters are significantly better long-term
investments compared to IPOs underwritten by less reputable underwriters.
Ahmad-Zaluki et al. (2007) used a sample of 454 Malaysian IPO
companies listed on the Main Board and the Second Board between 1990 and
2000, while Corhay et al. (2002) employed 258 samples for the period from 1992
to 1996. Ahmad-Zaluki et al. (2007) used both an event-time and a calendar-time
approach to analyse the long-run abnormal performance, while Corhay et al.
(2002) used an event-time approach to measure performance. Both obtained
similar results, finding that the cumulative average abnormal returns (CAR) and
the buy-and-hold returns (BHAR) significantly outperform the market. However,
Ahmad-Zaluki et al. (2007) found that under the calendar-time approach of the
Fama-French (1993) three-factor model, the significant abnormal performance
disappears. They also found no difference between the long-run performance of
Main Board and Second Board IPOs. However, they reported that listing year,
issue proceeds, and initial returns are performance-related. Corhay et al. (2002)
found that there is a positive relationship between CAR and book-to-market
Investment Performance MESDAQ IPOs
5
equity (B/M), earnings-to-price (E/P) and cash flows-to-price (C/P); IPO size is
inversely related to CAR.
How et al. (2007) examined Malaysian share allocation and IPO
performance by using a sample of 322 Second Board IPO companies from 1989
to 1992. They measured short-run performance by calculating the raw return and
the market-adjusted initial return. The CAR and BHAR methods were used to
determine long-run performance. Their study showed that Bumiputera investors
and the Malaysian public received almost an equal allocation and made similar
profits per issue. On average, Malaysian IPOs are underpriced, with a market-
adjusted initial return of 101.57%, and in the long run, irrespective of whether
equally weighted or value-weighted market adjusted returns are used, sample
IPOs do not perform poorly.
Studies on IPO performance are not limited to the Malaysian market, but
have also been performed in other countries such as the U.K. (e.g., Goergen et al.,
2007), Greece (e.g., Tsangarakis, 2004; Kenourgios, 2007), Sri Lanka (e.g.,
Peter, 2007), China (e.g., Li & Naughton, 2007), Japan (e.g., Kirkulak, 2008),
Spain (e.g., Alvarez & Gonzalez, 2005) and India (e.g., Marisetty &
Subrahmanyam, 2010). In general, most of the studies find a positive market-
adjusted initial return, ranging from 8.04% in Greece to 134.43% in China.
However, most of the studies find that IPO companies underperform the market
in the long-run.
Factors Influencing the Level of Initial Returns
This study has identified several factors that may influence the level of initial
returns, including sector (technology or non-technology) and issue period (hot or
cold). Prior studies suggest that the level of underpricing is higher in riskier IPOs.
Unfortunately, riskier IPOs will be more underpriced than less risky ones.
Because more than half of the IPOs listed on the MESDAQ Market are
technology-related companies, we segregated our sample into technology and
non-technology sectors. We expect that the substantial underpricing can be
attributed to a large number of technology companies going public. We
hypothesise that there should be a positive relationship between technology
sector and initial returns because technology companies are inherently riskier
investments than non-technology companies; therefore, they must provide
investors with a higher return to compensate for the increased risk.
The performance of IPOs, both in the short term and long term, can vary
according to the market conditions in which they are issued (dating back to
Ibbotson & Jaffe, 1975; Ritter, 1984). Loughran and Ritter (1995) defined years
with large numbers of IPOs as 'hot issue' periods, and they defined years with
Nurwati A. Ahmad-Zaluki and Lim Boon Kect
6
small numbers of IPO's as 'cold issue' periods. This IPO activity variable is also
used by Kooli and Suret (2004), Boubakri, Kooli and L'Her (2005), and
Jaskiewicsz, Gonzalez, Menendez and Schiereck (2005), among others. Ritter
(1984) shows that IPOs tend to cluster at certain hot issue periods. Ritter also
demonstrates that IPOs issued during a hot issue period experience higher initial
returns. Therefore, we expect that hot issue period IPOs have a positive
relationship with initial returns.
The age of the company, issue size and company size are used as control
variables to test the relationship between ex ante uncertainty and short-run
performance. It is expected that there will be a negative relationship between ex
ante uncertainty variables and short-run performance (i.e., the younger the
company or the smaller the issue/company size, the higher the short-run returns).
Beatty and Ritter (1986), Titman and Trueman (1986), and Carter and
Manaster (1990) suggested a negative relationship between underwriter prestige
and underpricing. They advocated that prestigious underwriters will reduce
agency costs experienced by companies related to the IPO. In addition, more
prestigious underwriters tend to underwrite less risky IPOs to protect their
reputations. Therefore, we expect a negative relationship between underwriter
prestige and underpricing.
SAMPLE SELECTION AND METHODS
Data
This study examines the initial return and long-run share price performance of
MESDAQ Market IPOs by using data for the period 2002 to 2005. The sample
period examined is up to 2005 because this study examines 1- to 3-year post-IPO
performance. It is also due to the need to study long-run post-IPO performance
for three years after the offer (up to 2008). Given that the study was undertaken
in early 2009, it was necessary to stop the sample period at 2005. The IPO
companies' closing price on the first day of listing and the subsequent 36 monthly
returns were collected from the DataStream database. The IPO companies' issue
prices were extracted from prospectuses downloaded from the Bursa Malaysia
website.
Following Ahmad-Zaluki et al. (2007), the monthly returns for each IPO
company were then compared with the monthly returns of the market index on a
rolling basis for each of the 36 months following the initial listing. Companies
are required to have a complete returns history over the 36-month window.
According to the FTSE index company website (http://www.ftse.com), the FTSE
Investment Performance MESDAQ IPOs
7
Bursa Malaysia MESDAQ Index was launched on 10 September 2007. The
information on base date and historical data is only available from 31 March
2006. As our performance analysis covers the period from 2002 to 2008, and
because of the data constraints on the MESDAQ Market Index, the KL
Composite Index (KLCI) was used as a market benchmark. To provide
robustness for our analysis and to improve the reliability of our results, we also
employed an alternative benchmark, the matching company technique, as used by
Ahmad-Zaluki et al. (2007).
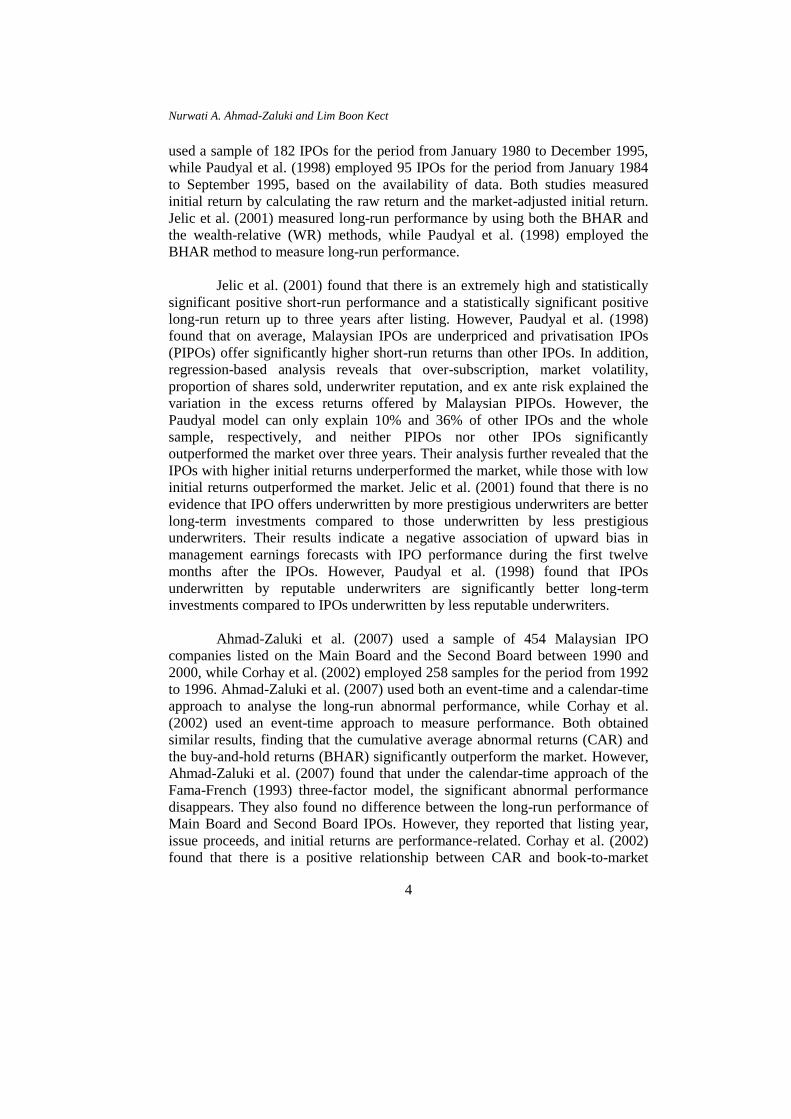
There were 104 companies listed on the MESDAQ Market during the
period from 2002 to 2005. We excluded 11 companies for various reasons:
missing company prospectus (2 companies), companies that had switched their
listing board from the MESDAQ Market to the Main Board within three years
after listing (1 company) and companies that were delisted within 3 years after
listing on the MESDAQ Market (8 companies). Therefore, our final sample
consisted of 93 companies, which comprised 89.72% of the whole IPO
population during the period 2002 to 2005.
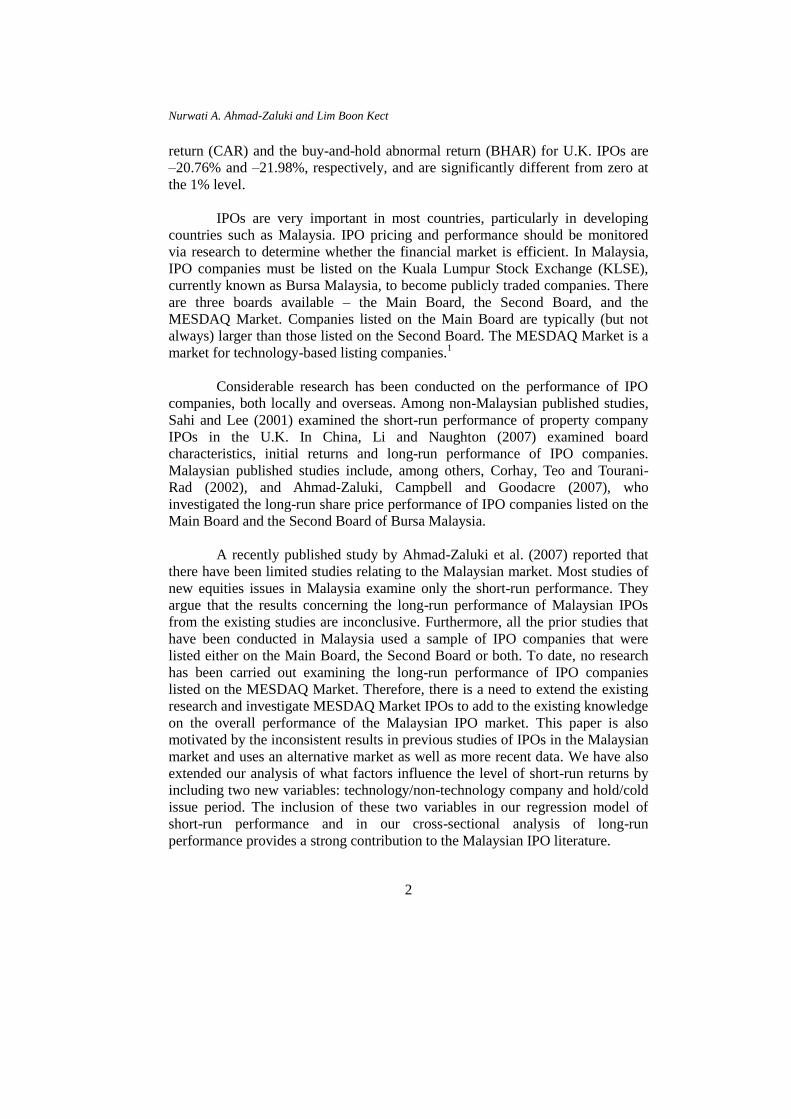
Figure 1. Distribution of IPO companies by year of listing
Figure 1 shows the distribution of these IPO companies by year of
listing. There are two bars for each year, labelled 'MESDAQ Market population'
and 'Sample used'. The figure shows that there is an increasing trend in the
number of IPOs from 2002 to 2005 for both bars. For the sample used, the
highest is 43 companies in 2005, which represents 46% of the sample, and the
lowest is 6 companies in 2002, which represents 6% of the sample.
The 93 IPO companies are distributed into four sectors – Finance,
Industrial Products, Technology and Trading/Services. The largest number of
Nurwati A. Ahmad-Zaluki and Lim Boon Kect
8
companies in the sample were in the Technology sector, which had 58 companies
(63%), followed by the Industrial Products sector (19%), the Trading/Services
sector (16%), and the Finance sector (2%).
Methods
Measure of short-run performance
We examined the raw and market-adjusted initial returns to measure the short-run
performance of IPOs. The raw initial return (RAW) on the first day of trading is
calculated as follows:
0,
0,1,
1,
)(
i
ii
iP
PPr (1)
where, 1,ir is the raw initial return for company i on the first day of trading,
1,iP is
the first day closing price of company i, and 0,iP is the issue price of the company
i. The market-adjusted initial return (MAIR) is calculated by adjusting the raw
return with the return of the market. It is calculated as follows:
imii rrMAIR ,1,1, (2)
where 1,iMAIR is the market-adjusted initial return of company i,
1,ir is the raw
initial return for the company i, and imr ,is the return on the market, calculated for
the period between company i's listing date and its prospectus closing date.
Factors influencing the level of initial returns
This study performs a multivariate analysis to identify factors that may influence
the short- run performance. A regression analysis is performed to examine the
level of IPO raw initial return in comparison to variables relating to the IPO
business sector (technology or non-technology) and issue period (hot or cold),
along with several additional control variables identified in the literature:
company age, underwriter reputation, issue size and company size. Our choice of
potential control variables is based on Malaysian evidence (Jelic et al., 2001;
Ahmad-Zaluki et al., 2011) and other studies on short-run performance. We
compute the significance levels as White's t-statistics to correct for
heteroskedasticity. The ordinary least squares (OLS) multiple regression model is
estimated as follows:
Investment Performance MESDAQ IPOs
9
RAWIRi = α0 + β1 TECHD + β2 HOTCOLD + β3 AGE + β4UNDWR +
β4lnPROCEEDS Β6 lnMV + ε
(3)
where:
RAWIR = initial return (%) measured by comparing the share price
(pt) at the end of the first day of trading with the offer
price (p0): (pt-p0)/p0;
TECHD = dummy variable = 1 for technology sector companies
and zero otherwise;
HOTCOLD = dummy variable = 1 for companies that went public in
the hot period (2004-2005) and zero otherwise;
AGE = company age in years;
UNDWR = dummy variable = 1 for prestigious underwriter as
defined in Jelic et al. (2001) and Ahmad-Zaluki et al.
(2011) and zero otherwise;
lnPROCEEDS = natural log of the gross proceeds raised from the IPOs;
lnMV = natural log of the market value at the time of the IPO
computed as the number of shares outstanding times the
closing price on the first trading day;
εi = error term
For hot and cold issue periods, we employed the definition used by
Loughran and Ritter (1995), Kooli and Suret (2004), Boubakri et al. (2005), and
Jaskiewicz et al. (2005). To be more precise, we follow the definition given by
Jaskiewicz et al., defining hot issue periods as periods that have IPOs above the
average number of IPOs during the period of study. However, we prefer to use
median rather than mean because it is not affected by outliers (Jain & Kini,
2004). Thus, the hot issue periods are redefined in this study as the years that
have numbers of IPOs above the median number of IPOs for the total period of
study. The total number of the MESDAQ Market IPO companies over the period
2002-2005 is 104 companies, with a median value of 26 companies. As a result,
the hot issue period dummy variable takes a value of '1' if the IPO for the
company is issued in a year that has a total number of IPOs greater than 26,
namely 2004 and 2005. The dummy variable takes a value of '0' if the IPO issued
in the year 2002 or 2003, each of which had fewer than 26 IPOs. Therefore, we
categorised both 2004 and 2005 as hot issue periods. However, companies listed
for the years 2002 and 2003 are categorised as cold issue.
Nurwati A. Ahmad-Zaluki and Lim Boon Kect
10
Measure of long-run share price performance
To measure the long-run share price performance, the cumulative average
abnormal return (CAR) method and the buy-and-hold return (BHAR) method
were used. The CAR from event month q to event month s is calculated by
cumulating the average market-adjusted (matching company-adjusted) returns on
a portfolio of n stock for the event time q to event time s and is calculated as
follows:
s
qt
tsq ARCAR ., (4)
where sqCAR , is the cumulative average abnormal return from event time q to
event time s and .tAR is the average market-adjusted (matching company-
adjusted) return on a portfolio of n stock for the event time t.
Under the buy-and-hold strategy, stock is purchased at the first closing
market price on the listing date and held for a specified time period. Following
prior studies (e.g., Ahmad-Zaluki et al., 2007), one-, two- and three-year buy-
and-hold abnormal returns are calculated to measure the long-run share price
performance. The buy-and-hold abnormal return for each company is calculated
as follows:
36
)
36
11(1)1(startt
mt
startt
itit rrBHAR (5)
where itBHAR is the buy-and-hold abnormal return of company i in event month
t , itr is the monthly raw return on company i in event month t , starting from its
first event listing month and continuing through the end of the three-year
window, and mtr is the monthly market return or matching company return. A
positive value for BHAR indicates that the IPO outperformed the market or the
matching company and a negative value indicates that the IPO underperformed
the market or the matching company.
Investment Performance MESDAQ IPOs
11
RESULTS
Short-run Performance
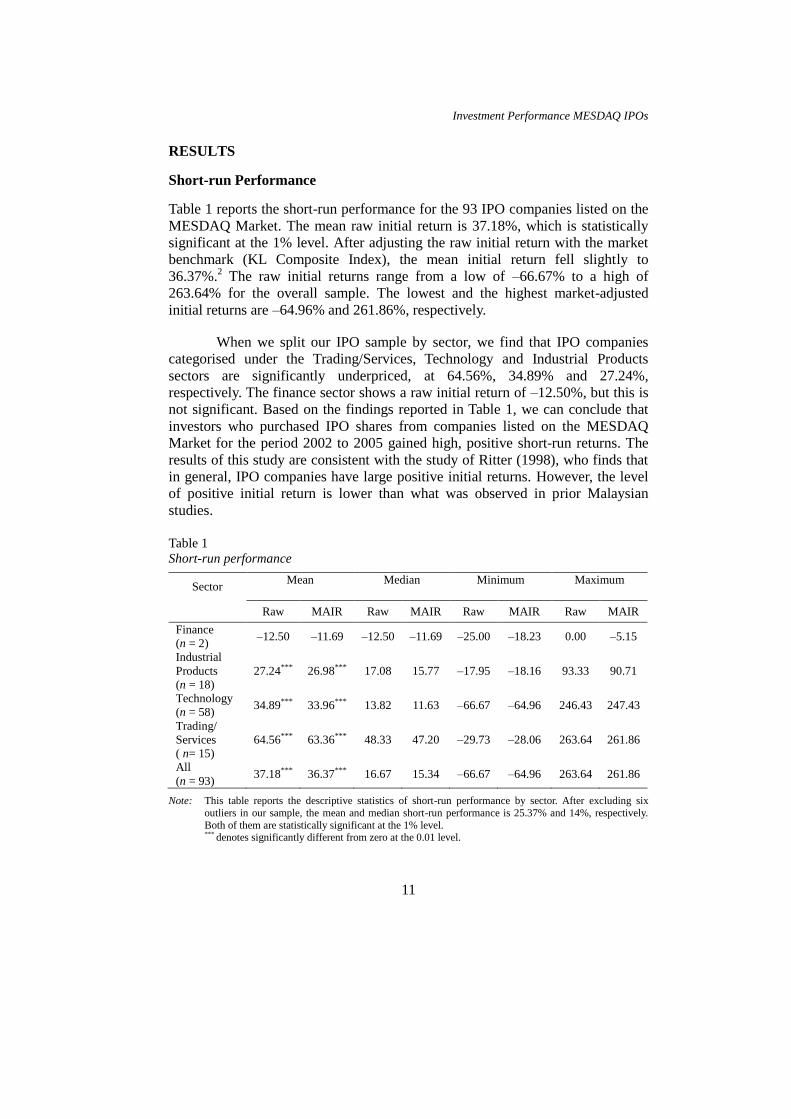
Table 1 reports the short-run performance for the 93 IPO companies listed on the
MESDAQ Market. The mean raw initial return is 37.18%, which is statistically
significant at the 1% level. After adjusting the raw initial return with the market
benchmark (KL Composite Index), the mean initial return fell slightly to
36.37%.2 The raw initial returns range from a low of –66.67% to a high of
263.64% for the overall sample. The lowest and the highest market-adjusted
initial returns are –64.96% and 261.86%, respectively.
When we split our IPO sample by sector, we find that IPO companies
categorised under the Trading/Services, Technology and Industrial Products
sectors are significantly underpriced, at 64.56%, 34.89% and 27.24%,
respectively. The finance sector shows a raw initial return of –12.50%, but this is
not significant. Based on the findings reported in Table 1, we can conclude that
investors who purchased IPO shares from companies listed on the MESDAQ
Market for the period 2002 to 2005 gained high, positive short-run returns. The
results of this study are consistent with the study of Ritter (1998), who finds that
in general, IPO companies have large positive initial returns. However, the level
of positive initial return is lower than what was observed in prior Malaysian
studies.
Table 1
Short-run performance
Sector Mean
Median
Minimum
Maximum
Raw MAIR Raw MAIR Raw MAIR Raw MAIR
Finance
(n = 2) –12.50 –11.69 –12.50 –11.69 –25.00 –18.23 0.00 –5.15
Industrial
Products
(n = 18)
27.24*** 26.98*** 17.08 15.77 –17.95 –18.16 93.33 90.71
Technology
(n = 58) 34.89*** 33.96*** 13.82 11.63 –66.67 –64.96 246.43 247.43
Trading/
Services
( n= 15)
64.56*** 63.36*** 48.33 47.20 –29.73 –28.06 263.64 261.86
All
(n = 93) 37.18*** 36.37*** 16.67 15.34 –66.67 –64.96 263.64 261.86
Note: This table reports the descriptive statistics of short-run performance by sector. After excluding six
outliers in our sample, the mean and median short-run performance is 25.37% and 14%, respectively.
Both of them are statistically significant at the 1% level. *** denotes significantly different from zero at the 0.01 level.
Nurwati A. Ahmad-Zaluki and Lim Boon Kect
12
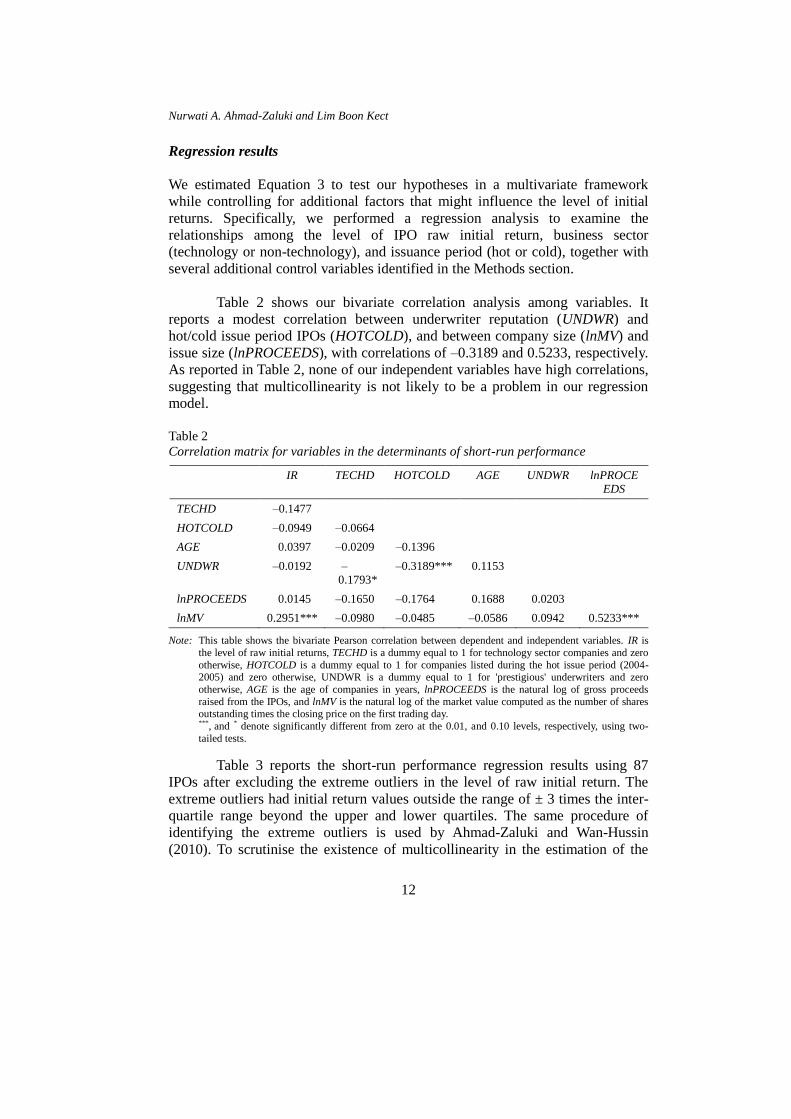
Regression results
We estimated Equation 3 to test our hypotheses in a multivariate framework
while controlling for additional factors that might influence the level of initial
returns. Specifically, we performed a regression analysis to examine the
relationships among the level of IPO raw initial return, business sector
(technology or non-technology), and issuance period (hot or cold), together with
several additional control variables identified in the Methods section.
Table 2 shows our bivariate correlation analysis among variables. It
reports a modest correlation between underwriter reputation (UNDWR) and
hot/cold issue period IPOs (HOTCOLD), and between company size (lnMV) and
issue size (lnPROCEEDS), with correlations of –0.3189 and 0.5233, respectively.
As reported in Table 2, none of our independent variables have high correlations,
suggesting that multicollinearity is not likely to be a problem in our regression
model.
Table 2
Correlation matrix for variables in the determinants of short-run performance
IR TECHD HOTCOLD AGE UNDWR lnPROCE
EDS
TECHD –0.1477
HOTCOLD –0.0949 –0.0664
AGE 0.0397 –0.0209 –0.1396
UNDWR –0.0192 –
0.1793*
–0.3189*** 0.1153
lnPROCEEDS 0.0145 –0.1650 –0.1764 0.1688 0.0203
lnMV 0.2951*** –0.0980 –0.0485 –0.0586 0.0942 0.5233***
Note: This table shows the bivariate Pearson correlation between dependent and independent variables. IR is
the level of raw initial returns, TECHD is a dummy equal to 1 for technology sector companies and zero
otherwise, HOTCOLD is a dummy equal to 1 for companies listed during the hot issue period (2004-2005) and zero otherwise, UNDWR is a dummy equal to 1 for 'prestigious' underwriters and zero
otherwise, AGE is the age of companies in years, lnPROCEEDS is the natural log of gross proceeds
raised from the IPOs, and lnMV is the natural log of the market value computed as the number of shares outstanding times the closing price on the first trading day.
***, and * denote significantly different from zero at the 0.01, and 0.10 levels, respectively, using two-
tailed tests.
Table 3 reports the short-run performance regression results using 87
IPOs after excluding the extreme outliers in the level of raw initial return. The
extreme outliers had initial return values outside the range of ± 3 times the inter-
quartile range beyond the upper and lower quartiles. The same procedure of
identifying the extreme outliers is used by Ahmad-Zaluki and Wan-Hussin
(2010). To scrutinise the existence of multicollinearity in the estimation of the
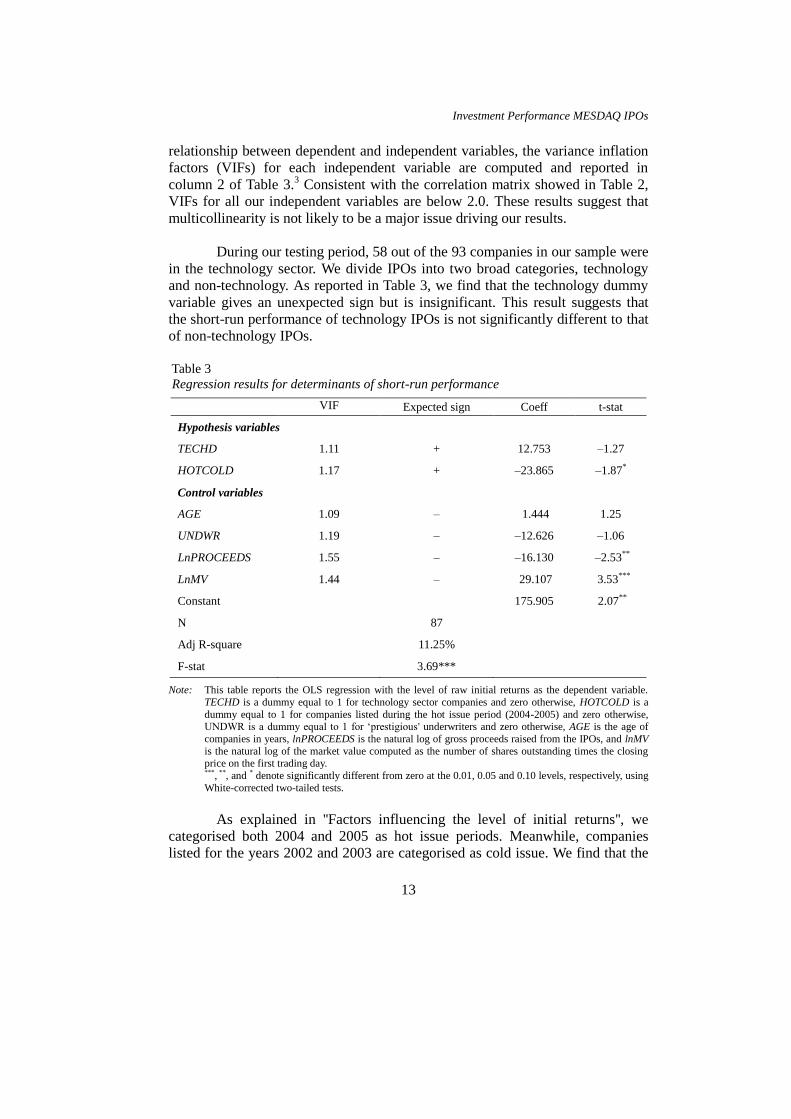
Investment Performance MESDAQ IPOs
13
relationship between dependent and independent variables, the variance inflation
factors (VIFs) for each independent variable are computed and reported in
column 2 of Table 3.3 Consistent with the correlation matrix showed in Table 2,
VIFs for all our independent variables are below 2.0. These results suggest that
multicollinearity is not likely to be a major issue driving our results.
During our testing period, 58 out of the 93 companies in our sample were
in the technology sector. We divide IPOs into two broad categories, technology
and non-technology. As reported in Table 3, we find that the technology dummy
variable gives an unexpected sign but is insignificant. This result suggests that
the short-run performance of technology IPOs is not significantly different to that
of non-technology IPOs.
Table 3
Regression results for determinants of short-run performance
VIF Expected sign Coeff t-stat
Hypothesis variables
TECHD 1.11 + 12.753 –1.27
HOTCOLD 1.17 + –23.865 –1.87*
Control variables
AGE 1.09 – 1.444 1.25
UNDWR 1.19 – –12.626 –1.06
LnPROCEEDS 1.55 – –16.130 –2.53**
LnMV 1.44 – 29.107 3.53***
Constant 175.905 2.07**
N 87
Adj R-square 11.25%
F-stat 3.69***
Note: This table reports the OLS regression with the level of raw initial returns as the dependent variable.
TECHD is a dummy equal to 1 for technology sector companies and zero otherwise, HOTCOLD is a
dummy equal to 1 for companies listed during the hot issue period (2004-2005) and zero otherwise, UNDWR is a dummy equal to 1 for ‘prestigious' underwriters and zero otherwise, AGE is the age of
companies in years, lnPROCEEDS is the natural log of gross proceeds raised from the IPOs, and lnMV
is the natural log of the market value computed as the number of shares outstanding times the closing price on the first trading day.
***, **, and * denote significantly different from zero at the 0.01, 0.05 and 0.10 levels, respectively, using
White-corrected two-tailed tests.
As explained in ''Factors influencing the level of initial returns'', we
categorised both 2004 and 2005 as hot issue periods. Meanwhile, companies
listed for the years 2002 and 2003 are categorised as cold issue. We find that the
Nurwati A. Ahmad-Zaluki and Lim Boon Kect
14
coefficient of the hot/cold issue period dummy is negative but weakly significant
(at the 10% level). Inconsistent with Ritter (1984), our results suggest that the
level of initial returns for companies listed during hot periods in Malaysia is
lower than for those listed during the cold periods. Similar results were also
observed by Cliff and Denis (2004), in that underpricing is lower when IPO
volume is high. Further inspection of the data reveals that the percentage of IPO
companies from the Technology sector is higher in cold issue periods (68%) than
in hot issue periods (61%). Because Technology companies are inherently riskier
investments than non-technology companies, they must provide investors with a
higher return to compensate for the increased risk. Therefore, higher initial return
is observed in the cold issue periods, which contained a higher percentage of
technology company IPOs, than in the hot issue periods, although the difference
is relatively small.
We find that the issue size variable is negatively and significantly related
to short-run performance, suggesting that small-size issues have high ex ante
uncertainty that produces a higher return to initial investors. Surprisingly, our
company size variable has a positive relationship with short-run performance,
suggesting that the larger the company size, the higher the initial returns. We find
no evidence that company age and underwriter reputation influence the level of
short-run performance.
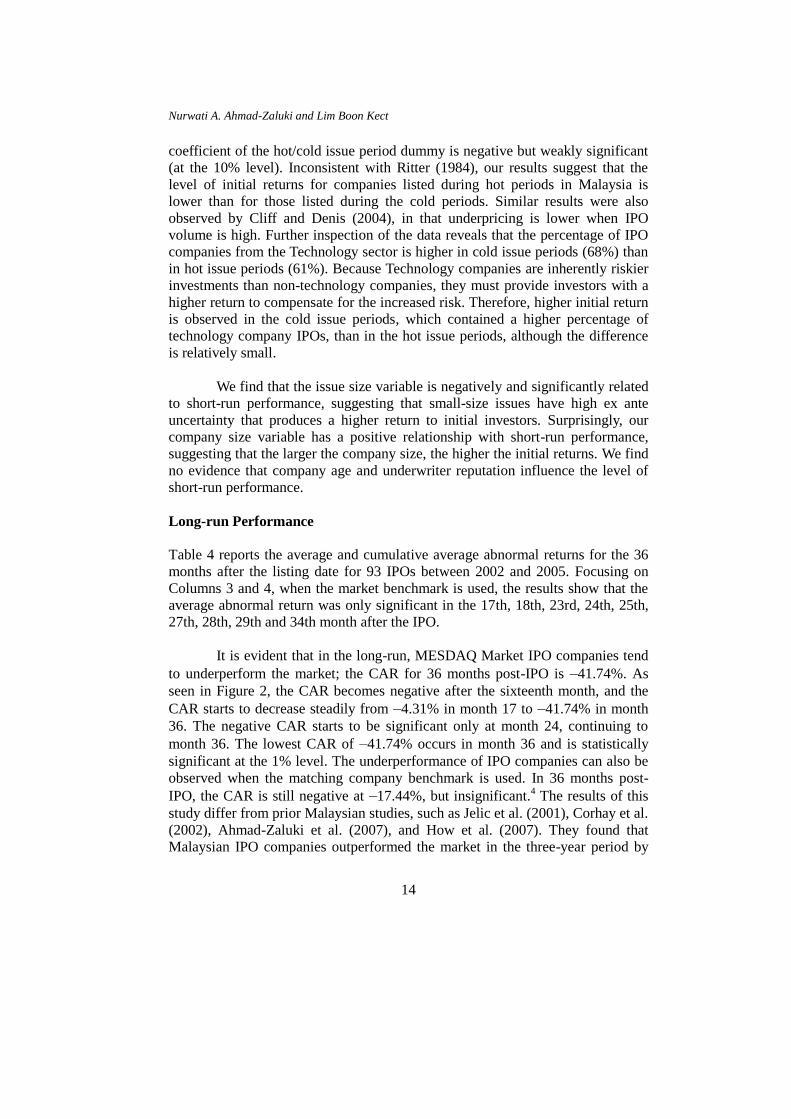
Long-run Performance
Table 4 reports the average and cumulative average abnormal returns for the 36
months after the listing date for 93 IPOs between 2002 and 2005. Focusing on
Columns 3 and 4, when the market benchmark is used, the results show that the
average abnormal return was only significant in the 17th, 18th, 23rd, 24th, 25th,
27th, 28th, 29th and 34th month after the IPO.
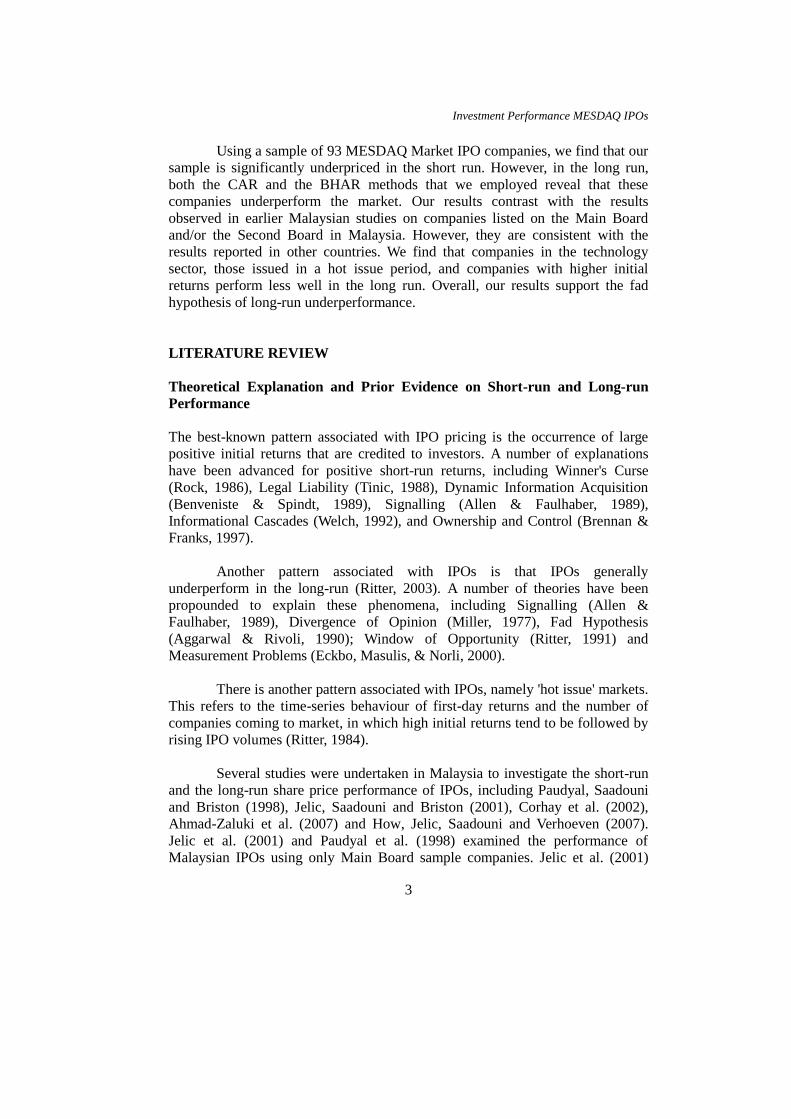
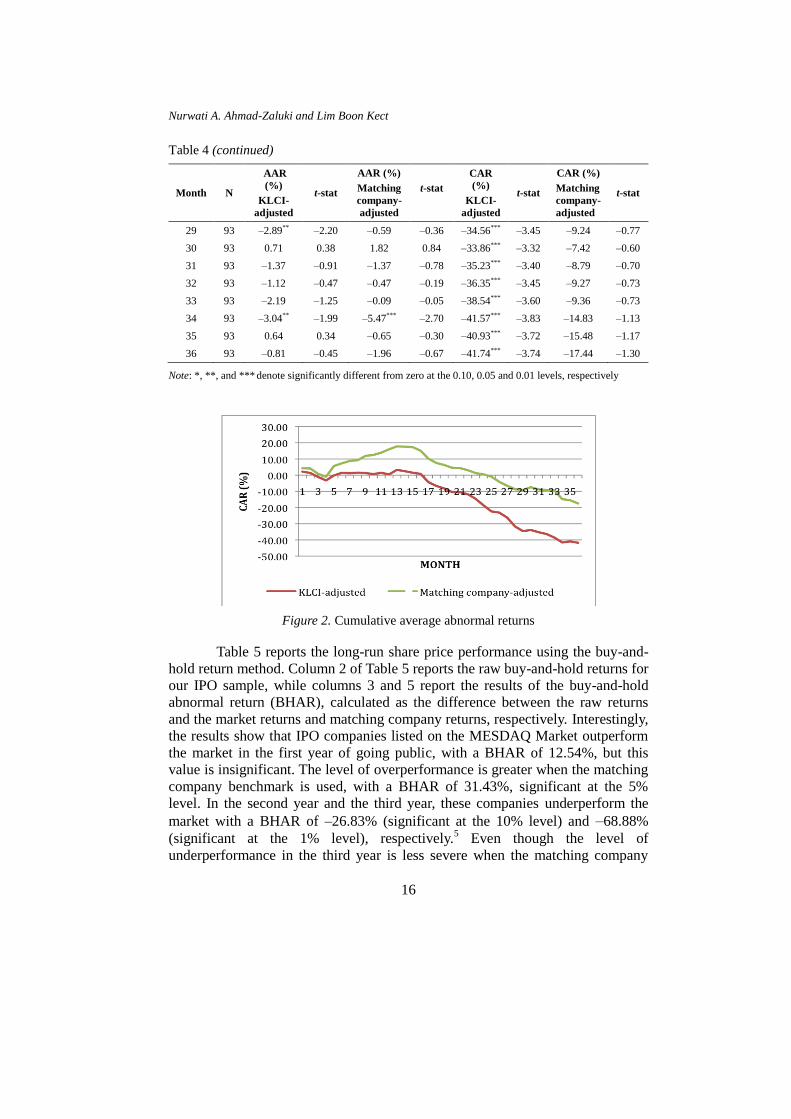
It is evident that in the long-run, MESDAQ Market IPO companies tend
to underperform the market; the CAR for 36 months post-IPO is –41.74%. As
seen in Figure 2, the CAR becomes negative after the sixteenth month, and the
CAR starts to decrease steadily from –4.31% in month 17 to –41.74% in month
36. The negative CAR starts to be significant only at month 24, continuing to
month 36. The lowest CAR of –41.74% occurs in month 36 and is statistically
significant at the 1% level. The underperformance of IPO companies can also be
observed when the matching company benchmark is used. In 36 months post-
IPO, the CAR is still negative at –17.44%, but insignificant.4 The results of this
study differ from prior Malaysian studies, such as Jelic et al. (2001), Corhay et al.
(2002), Ahmad-Zaluki et al. (2007), and How et al. (2007). They found that
Malaysian IPO companies outperformed the market in the three-year period by
Investment Performance MESDAQ IPOs
15
24.83%, 41.71%, 32.63%, and 41.00%, respectively. Following Ahmad-Zaluki et
al.'s (2007) argument, the difference in results may reflect the different sample
composition in terms of sample size, influence of MESDAQ Market companies
in the sample, and the different time period examined.
Table 4
Average and cumulative average abnormal returns
Month N
AAR (%)
KLCI-
adjusted
t-stat
AAR (%)
Matching
company-
adjusted
t-stat CAR (%)
KLCI-
adjusted
t-stat
CAR (%)
Matching
company-
adjusted
t-stat
1 93 2.18 0.54 4.28 1.05 2.18 1.17 4.28* 1.91
2 93 –0.83 –0.36 –0.15 –0.06 1.35 0.51 4.13 1.30
3 93 –2.49 –1.46 –3.35 –1.46 –1.14 –0.35 0.78 0.20
4 93 –2.12 –1.26 –1.71 –0.86 –3.27 –0.88 –0.94 –0.21
5 93 3.11 1.57 6.60*** 2.69 –0.16 –0.04 5.66 1.13
6 93 1.63 0.74 1.63 0.66 1.47 0.32 7.29 1.33
7 93 –0.25 –0.15 1.48 0.67 1.22 0.25 8.77 1.48
8 93 0.31 0.24 0.42 0.16 1.53 0.29 9.19 1.45
9 93 –0.17 –0.11 2.71 1.61 1.36 0.24 11.90* 1.77
10 93 –0.71 –0.61 0.56 0.35 0.65 0.11 12.46* 1.76
11 93 0.84 0.47 1.44 0.76 1.49 0.24 13.90* 1.87
12 93 –0.99 –0.65 2.06 1.07 0.50 0.08 15.96** 2.05
13 93 2.78 0.98 1.81 0.62 3.28 0.49 17.77** 2.20
14 93 –0.82 –0.41 –0.22 –0.09 2.46 0.35 17.55** 2.09
15 93 –0.94 –0.58 –0.24 –0.11 1.52 0.21 17.32** 1.99
16 93 –0.72 –0.36 –2.22 –0.77 0.80 0.11 15.10* 1.68
17 93 –5.11*** –3.13 –4.96** –2.63 –4.31 –0.56 10.14 1.10
18 93 –2.33* –1.81 –2.59 –1.34 –6.64 –0.84 7.55 0.79
19 93 –1.54 –0.76 –1.27 –0.60 –8.18 –1.01 6.27 0.64
20 93 –2.25 –1.57 –1.71 –0.91 –10.43 –1.25 4.56 0.46
21 93 –0.08 –0.05 –0.20 –0.09 –10.52 –1.23 4.37 0.42
22 93 –1.26 –0.69 –1.30 –0.63 –11.77 –1.35 3.07 0.29
23 93 –2.86* –1.92 –1.78 –1.03 –14.63 –1.64 1.29 0.12
24 93 –4.00*** –2.69 –0.79 –0.43 –18.63** –2.04 0.50 0.05
25 93 –3.77*** –2.77 –1.44 –0.75 –22.40** –2.41 –0.94 –0.08
26 93 –0.73 –0.47 –3.19 –1.60 –23.13** –2.44 –4.13 –0.36
27 93 –3.08* –1.89 –2.39 –1.06 –26.21*** –2.71 –6.52 –0.56
28 93 –5.47*** –4.45 –2.13 –1.33 –31.67*** –3.22 –8.65 –0.73
(continued on next page)
Nurwati A. Ahmad-Zaluki and Lim Boon Kect
16
Table 4 (continued)
Month N
AAR
(%)
KLCI-
adjusted
t-stat
AAR (%)
Matching
company-
adjusted
t-stat
CAR
(%)
KLCI-
adjusted
t-stat
CAR (%)
Matching
company-
adjusted
t-stat
29 93 –2.89** –2.20 –0.59 –0.36 –34.56*** –3.45 –9.24 –0.77
30 93 0.71 0.38 1.82 0.84 –33.86*** –3.32 –7.42 –0.60
31 93 –1.37 –0.91 –1.37 –0.78 –35.23*** –3.40 –8.79 –0.70
32 93 –1.12 –0.47 –0.47 –0.19 –36.35*** –3.45 –9.27 –0.73
33 93 –2.19 –1.25 –0.09 –0.05 –38.54*** –3.60 –9.36 –0.73
34 93 –3.04** –1.99 –5.47*** –2.70 –41.57*** –3.83 –14.83 –1.13
35 93 0.64 0.34 –0.65 –0.30 –40.93*** –3.72 –15.48 –1.17
36 93 –0.81 –0.45 –1.96 –0.67 –41.74*** –3.74 –17.44 –1.30
Note: *, **, and *** denote significantly different from zero at the 0.10, 0.05 and 0.01 levels, respectively
Figure 2. Cumulative average abnormal returns
Table 5 reports the long-run share price performance using the buy-and-
hold return method. Column 2 of Table 5 reports the raw buy-and-hold returns for
our IPO sample, while columns 3 and 5 report the results of the buy-and-hold
abnormal return (BHAR), calculated as the difference between the raw returns
and the market returns and matching company returns, respectively. Interestingly,
the results show that IPO companies listed on the MESDAQ Market outperform
the market in the first year of going public, with a BHAR of 12.54%, but this
value is insignificant. The level of overperformance is greater when the matching
company benchmark is used, with a BHAR of 31.43%, significant at the 5%
level. In the second year and the third year, these companies underperform the
market with a BHAR of –26.83% (significant at the 10% level) and –68.88%
(significant at the 1% level), respectively.5 Even though the level of
underperformance in the third year is less severe when the matching company
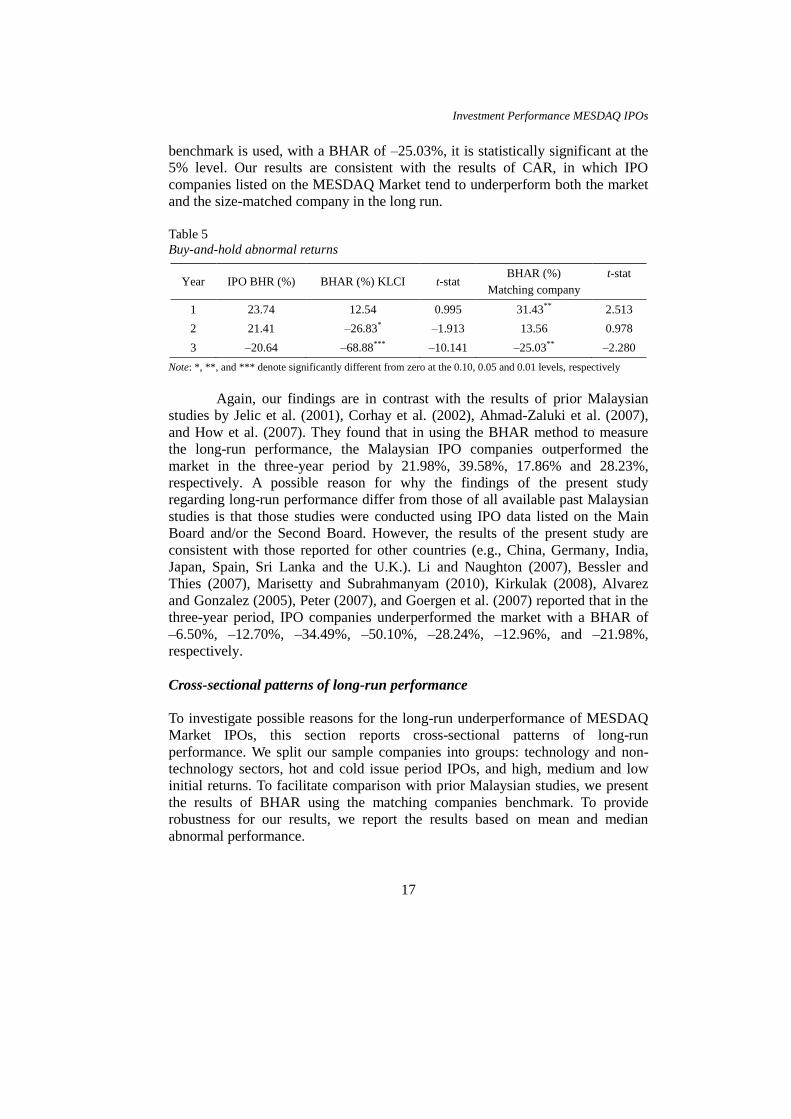
Investment Performance MESDAQ IPOs
17
benchmark is used, with a BHAR of –25.03%, it is statistically significant at the
5% level. Our results are consistent with the results of CAR, in which IPO
companies listed on the MESDAQ Market tend to underperform both the market
and the size-matched company in the long run.
Table 5
Buy-and-hold abnormal returns
Year IPO BHR (%) BHAR (%) KLCI t-stat BHAR (%)
Matching company
t-stat
1 23.74 12.54 0.995 31.43** 2.513
2 21.41 –26.83* –1.913 13.56 0.978
3 –20.64 –68.88*** –10.141 –25.03** –2.280
Note: *, **, and *** denote significantly different from zero at the 0.10, 0.05 and 0.01 levels, respectively
Again, our findings are in contrast with the results of prior Malaysian
studies by Jelic et al. (2001), Corhay et al. (2002), Ahmad-Zaluki et al. (2007),
and How et al. (2007). They found that in using the BHAR method to measure
the long-run performance, the Malaysian IPO companies outperformed the
market in the three-year period by 21.98%, 39.58%, 17.86% and 28.23%,
respectively. A possible reason for why the findings of the present study
regarding long-run performance differ from those of all available past Malaysian
studies is that those studies were conducted using IPO data listed on the Main
Board and/or the Second Board. However, the results of the present study are
consistent with those reported for other countries (e.g., China, Germany, India,
Japan, Spain, Sri Lanka and the U.K.). Li and Naughton (2007), Bessler and
Thies (2007), Marisetty and Subrahmanyam (2010), Kirkulak (2008), Alvarez
and Gonzalez (2005), Peter (2007), and Goergen et al. (2007) reported that in the
three-year period, IPO companies underperformed the market with a BHAR of
–6.50%, –12.70%, –34.49%, –50.10%, –28.24%, –12.96%, and –21.98%,
respectively.
Cross-sectional patterns of long-run performance
To investigate possible reasons for the long-run underperformance of MESDAQ
Market IPOs, this section reports cross-sectional patterns of long-run
performance. We split our sample companies into groups: technology and non-
technology sectors, hot and cold issue period IPOs, and high, medium and low
initial returns. To facilitate comparison with prior Malaysian studies, we present
the results of BHAR using the matching companies benchmark. To provide
robustness for our results, we report the results based on mean and median
abnormal performance.
Nurwati A. Ahmad-Zaluki and Lim Boon Kect
18
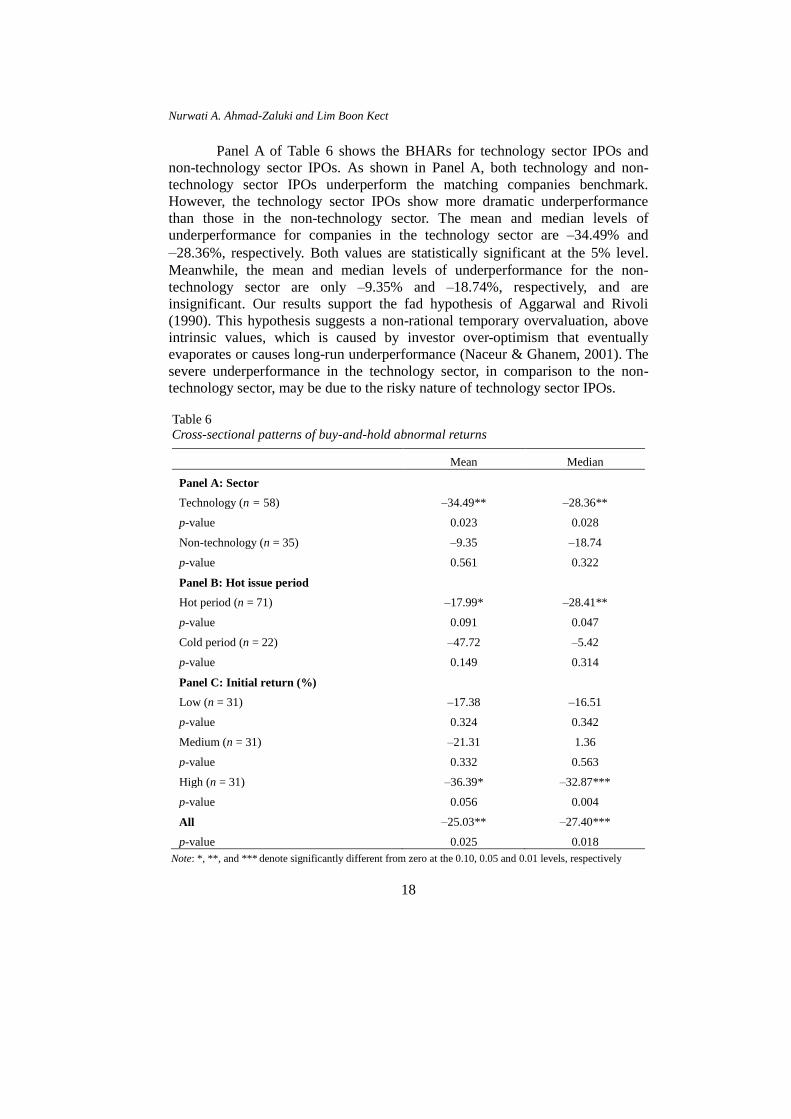
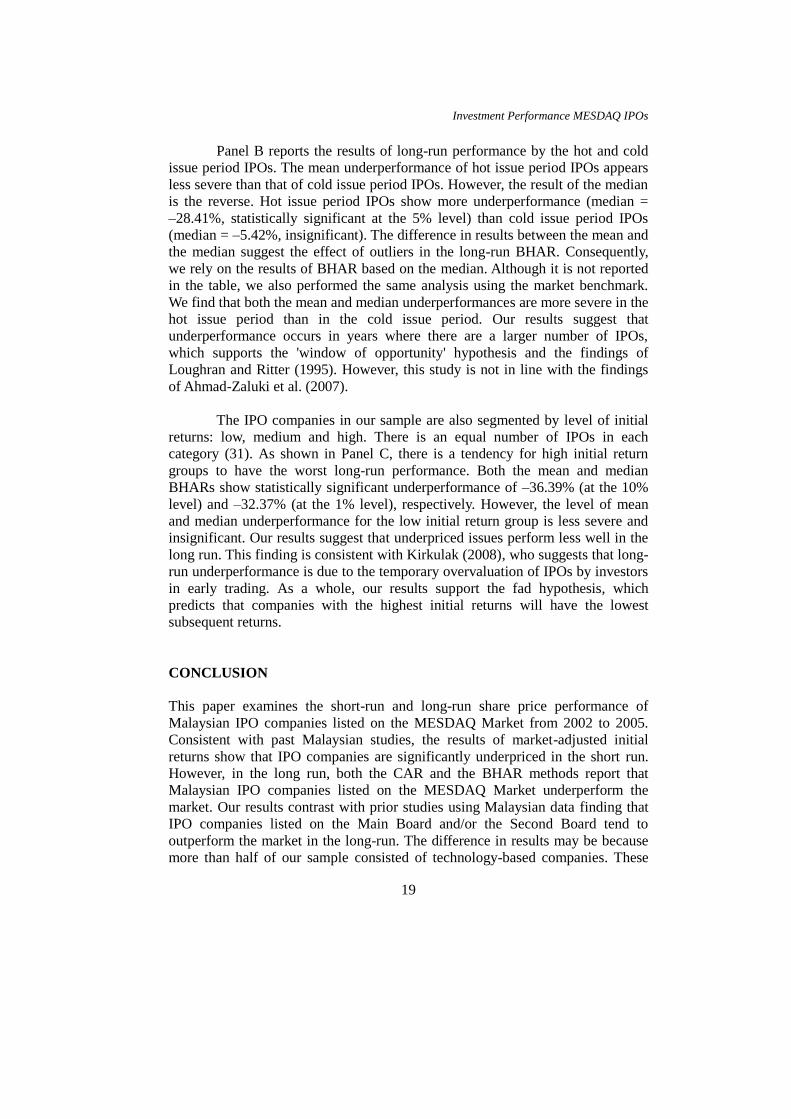
Panel A of Table 6 shows the BHARs for technology sector IPOs and
non-technology sector IPOs. As shown in Panel A, both technology and non-
technology sector IPOs underperform the matching companies benchmark.
However, the technology sector IPOs show more dramatic underperformance
than those in the non-technology sector. The mean and median levels of
underperformance for companies in the technology sector are –34.49% and
–28.36%, respectively. Both values are statistically significant at the 5% level.
Meanwhile, the mean and median levels of underperformance for the non-
technology sector are only –9.35% and –18.74%, respectively, and are
insignificant. Our results support the fad hypothesis of Aggarwal and Rivoli
(1990). This hypothesis suggests a non-rational temporary overvaluation, above
intrinsic values, which is caused by investor over-optimism that eventually
evaporates or causes long-run underperformance (Naceur & Ghanem, 2001). The
severe underperformance in the technology sector, in comparison to the non-
technology sector, may be due to the risky nature of technology sector IPOs.
Table 6
Cross-sectional patterns of buy-and-hold abnormal returns
Mean Median
Panel A: Sector
Technology (n = 58) –34.49** –28.36**
p-value 0.023 0.028
Non-technology (n = 35) –9.35 –18.74
p-value 0.561 0.322
Panel B: Hot issue period
Hot period (n = 71) –17.99* –28.41**
p-value 0.091 0.047
Cold period (n = 22) –47.72 –5.42
p-value 0.149 0.314
Panel C: Initial return (%)
Low (n = 31) –17.38 –16.51
p-value 0.324 0.342
Medium (n = 31) –21.31 1.36
p-value 0.332 0.563
High (n = 31) –36.39* –32.87***
p-value 0.056 0.004
All –25.03** –27.40***
p-value 0.025 0.018
Note: *, **, and *** denote significantly different from zero at the 0.10, 0.05 and 0.01 levels, respectively
Investment Performance MESDAQ IPOs
19
Panel B reports the results of long-run performance by the hot and cold
issue period IPOs. The mean underperformance of hot issue period IPOs appears
less severe than that of cold issue period IPOs. However, the result of the median
is the reverse. Hot issue period IPOs show more underperformance (median =
–28.41%, statistically significant at the 5% level) than cold issue period IPOs
(median = –5.42%, insignificant). The difference in results between the mean and
the median suggest the effect of outliers in the long-run BHAR. Consequently,
we rely on the results of BHAR based on the median. Although it is not reported
in the table, we also performed the same analysis using the market benchmark.
We find that both the mean and median underperformances are more severe in the
hot issue period than in the cold issue period. Our results suggest that
underperformance occurs in years where there are a larger number of IPOs,
which supports the 'window of opportunity' hypothesis and the findings of
Loughran and Ritter (1995). However, this study is not in line with the findings
of Ahmad-Zaluki et al. (2007).
The IPO companies in our sample are also segmented by level of initial
returns: low, medium and high. There is an equal number of IPOs in each
category (31). As shown in Panel C, there is a tendency for high initial return
groups to have the worst long-run performance. Both the mean and median
BHARs show statistically significant underperformance of –36.39% (at the 10%
level) and –32.37% (at the 1% level), respectively. However, the level of mean
and median underperformance for the low initial return group is less severe and
insignificant. Our results suggest that underpriced issues perform less well in the
long run. This finding is consistent with Kirkulak (2008), who suggests that long-
run underperformance is due to the temporary overvaluation of IPOs by investors
in early trading. As a whole, our results support the fad hypothesis, which
predicts that companies with the highest initial returns will have the lowest
subsequent returns.
CONCLUSION
This paper examines the short-run and long-run share price performance of
Malaysian IPO companies listed on the MESDAQ Market from 2002 to 2005.
Consistent with past Malaysian studies, the results of market-adjusted initial
returns show that IPO companies are significantly underpriced in the short run.
However, in the long run, both the CAR and the BHAR methods report that
Malaysian IPO companies listed on the MESDAQ Market underperform the
market. Our results contrast with prior studies using Malaysian data finding that
IPO companies listed on the Main Board and/or the Second Board tend to
outperform the market in the long-run. The difference in results may be because
more than half of our sample consisted of technology-based companies. These
Nurwati A. Ahmad-Zaluki and Lim Boon Kect
20
companies are found to have more severe underperformance than their
counterparts. In addition, companies that went public during hot issue periods
and companies with high initial returns perform less well in the long run. Our
long-run performance analysis supports the fad hypothesis of Aggarwal and
Rivoli (1990) in explaining underperformance. Overall, our results suggest that
investors who purchase IPO shares on the MESDAQ Market gain high positive
returns in the short run but do not fare well in the long run.
NOTES
1. As of 3 August 2009, the Main Board and the Second Board were merged and renamed
the MAIN MARKET. Meanwhile, the MESDAQ Market was revamped and renamed the
ACE MARKET.
2. We have spent considerable time collecting additional data for companies listed on the
Main Board and the Second Board to compare the initial returns with companies listed on
the MESDAQ Market. Using a sample of 145 IPO companies listed on the Main Board
and the Second Board, we find that the mean raw and market-adjusted initial returns for
both listing boards are slightly lower (20.36% and 19.37%, respectively) than the initial
returns given by companies listed on the MESDAQ Market. When we further split these
samples into the Main Board and the Second Board, we find that both the mean raw and
market-adjusted initial returns for the Main Board are lower than for the Second Board
(raw initial returns: Main Board = 15.08% vs. Second Board = 23.88%, market-adjusted
initial returns: Main Board = 14.50% vs. Second Board = 22.79%). All of these figures
are significant at the 1% level. Similar results are also observed by Rahim and Yong
(2010) in their study on initial returns of Malaysian IPOs using data from 1999–2007.
3. Neter et al. (1985) suggested that a multicollinearity problem can be indicated by having
the VIF = 10.
4. One might wonder whether the results using matching company benchmark are more
reliable than using KLCI as a benchmark. We suggest that the results are less reliable
when using KLCI as a benchmark because MESDAQ is not comparable to the companies
included in the KLCI. We used KLCI as a market benchmark due to data limitations, as
mentioned in our method section.
5. Additional analysis on data for IPO companies listed on the Main Board and the Second
Board shows that these companies underperformed the market in the three-year post-IPO
period with a BHAR of –48.36% (significant at the 1% level). After splitting the data into
Main Board and Second Board companies, we find that Main Board IPO companies
perform less well than Second Board IPO companies (–52.89% vs. –45.30%). Both
values are significant at the 1% level. However, the level of underperformance for both
Main Board and Second Board companies is lower than what was observed for the
companies listed on the MESDAQ Market
Investment Performance MESDAQ IPOs
21
REFERENCES
Aggarwal, R., & Rivoli, P. (1990). Fads in the Initial Public Offerings market?, Financial
Management, 19(4), 45–57.
Ahmad-Zaluki, N. A., Campbell, K., & Goodacre, A. (2007). The long run share price
performance of Malaysian Initial Public Offerings (IPOs), Journal of Business
Finance & Accounting, 34(1 & 2), 78–110.
Ahmad-Zaluki, N. A., Campbell, K., & Goodacre, A. (2011). Earnings management in
Malaysian IPOs: The East Asian crisis, ownership control and post-IPO
performance, International Journal of Accounting, 46(2), 111–137.
Ahmad-Zaluki, N. A., & Wan-Hussin, W. N. (2010). Corporate governance and earnings
forecast accuracy, Asian Review of Accounting, 18(1), 50–67.
Allen, F., & Faulhaber, G. R. (1989). Signaling by underpricing in the IPO market,
Journal of Financial Economics, 23(2), 303–323.
Alvarez, S., & Gonzalez, V. M. (2005). Signalling and the long run performance of
Spanish Initial Public Offerings (IPOs), Journal of Business Finance &
Accounting, 32(1 & 2), 325–350.
Benveniste, L. M., & Spindt, P. A. (1989). How investment bankers determine the offer
price and allocation of new issues, Journal of Financial Economics, 24(2), 343–
362.
Bessler, W., & Thies, S. (2007). The long run performance of Initial Public Offerings in
Germany, Managerial Finance, 33(6), 420–441.
Boubakri, N., Kooli, M., & L'Her, J. (2005). Is there any life after going public?
Evidence from Canadian market, Journal of Private Equity, 8(3), 30–40.
Brennan, M. J., & Franks, J. (1997). Underpricing, ownership and control in Initial Public
Offerings of equity securities in the UK, Journal of Financial Economics, 45(3),
391–413.
Cliff, M., & Denis, D. (2004). Do IPO firms purchase analyst coverage with
underpricing, Journal of Finance, 58(6), 2871–2901.
Corhay, A., Teo, S., & Tourani-Rad, A. (2002). The long run performance of Malaysian
Initial Public Offerings (IPOs): Value and growth effects, Managerial Finance,
28(2), 52–65.
Eckbo, B. E., Masulis, R. W., & Norli, O. (2000). Seasoned public offerings: Resolution
of the 'New Issue Puzzle', Journal of Financial Economics, 56(2), 251–291.
Goergen, M., Khurshed, A., & Mudambi, R. (2007). The long run performance of UK
IPOs: Can it be predicted?, Managerial Finance, 33(6), 401–419.
How, J., Jelic, R., Saadouni, B., & Verhoeven, P. (2007), Share allocations
and performance of KLSE second board IPOs, Pacific-Basin Finance Journal,
15, 292–314.
Ibbotson, R. G., & Jaffe, J. F. (1975). Hot issue' market, Journal of Finance, 30, 1027–
1042.
Jain, B., & Kini, O. (1994). The post-issue operating performance of IPO firms, Journal
of Finance, 49(5), 1699–1726.
Jaskiewicz, P., Gonzalez, V., Menendez, S., & Schiereck, D. (2005), Long run IPO
performance analysis of German and Spanish family-owned businesses, Family
Business Review, 18(3), 179–202.
Nurwati A. Ahmad-Zaluki and Lim Boon Kect
22
Jelic, R., Saadouni, B., & Briston, R. (2001). Performance of Malaysian IPOs:
Underwriters reputation and management earnings forecasts, Pacific-Basin
Finance Journal, 9(5), 457–86.
Kenourgios, D. F. (2007). Initial performance of Greek IPOs, underwriter's reputation and
oversubscription, Managerial Finance, 33(5), 332–343.
Kirkulak, B. (2008). The initial and long run returns of Japanese venture capital-backed
and non-venture capital-backed IPOs, Managerial Finance, 4(2), 112–135.
Kooli, M., & Suret, J. (2004). The aftermarket performance of Initial Public Offerings in
Canada, Journal of Multinational Financial Management, 14(1), 47–66.
Li, L., & Naughton, T. (2007). Going public with good governance: Evidence from
China, Corporate Governance: An International Review, 15(6), 1190–1202.
Loughran, T., & Ritter, J. R. (1995). The new issues puzzle, Journal of Finance, 50(1),
23–51. Marisetty, V. B., & Subrahmanyam, M. G. (2010). Group affiliation and
the performance of Initial Public Offerings in the Indian stock market, Journal of
Financial Markets, 13(1), 196–223.
Miller, E. M. (1977). Risk, uncertainty, and divergence of opinion, Journal of Finance,
32(4), 1151–1168.
Naceur, S. B., & Ghanem, H. (2001).The short- and long-run performance of new
listings in Tunisia, International Review of Finance, 2(4), 235–246.
Neter, J., Wasserman, W., & Kutner, M. (1985). Applied statistical models (2nd ed.).
Homewood, IL: Irwin.
Paudyal, K., Saadouni, B., & Briston, R. J. (1998). Privatisation Initial Public Offerings
in Malaysia: Initial premium and long-term performance, Pacific-Basin Finance
Journal, 6(5), 427–451.
Peter, S. (2007), Performance of Initial Public Offerings and privatized offers; Evidence
from a developing country, Managerial Finance, 33(10), 798–809.
Prasad, D., Vozikis, G. S., & Ariff, M. (2006). Government public policy, regulatory
intervention, and their impact on IPO underpricing: The case of Malaysian IPOs,
Small Business Management Journal, 44(1), 81–98.
Rahim, R. A., & Yong, O. (2010). Initial returns of Malaysian IPOs and shari'a-
compliant status, Journal of Islamic Accounting and Business
Research, 1(1), 60–74.
Ritter, J. R. (1984). The ‘hot issue' market of 1980, Journal of Business, 57(2), 215–240.
Ritter, J. R. (1991). The long run performance of Initial Public Offerings, Journal of
Finance, 46(1), 3–27.
Ritter, J. R. (1998). Initial Public Offerings. In D. Loque & J. Seward (Eds.), Warren
Gorham & Lamont Handbook of Modern Finance, reprinted (with
modifications) in Contemporary Finance Digest, 2(1), 5–30.
Ritter, J. R. (2003). Investment banking and securities issuance. In G. M. Constantinides,
M. Harris, & R. Stulz, (Eds.), Handbook of the Economics of Finance (pp. 253–
304). Amsterdam: Elsevier/North-Holland.
Sahi, W., & Lee, S. I. (2001), The initial return performance of UK property company
IPOs, Journal of Property Investment & Finance, 19(2), 127–138.
Tinic, S. M. (1988). Anatomy of Initial Public Offerings of common stock, Journal of
Finance, 43(4), 789–822.

Investment Performance MESDAQ IPOs
23
Tsangarakis, N. V. (2004). The price performance of Initial Public Offerings in Greece,
Managerial Finance, 30(10), 26–44.
Welch, I. (1992). Sequential sales, learning, and cascades, Journal of Finance, 47(2), 695–
732.
White, H. (1980). A heteroskedasticity-consistent covariance matrix estimator and a
direct test for heteroskedasticity, Econometrica, 48(4), 817–838.