Embed Size (px)
DESCRIPTION
The IPF Research Programme 2006-2009. Costing Energy Efficiency Improvements in Existing Commercial Buildings Richard Quartermaine SPR Research Briefing 1 st October 2009. Agenda. Background Objectives Why? Research approach Findings. Background. Commenced in May 2008 - PowerPoint PPT Presentation
Citation preview
The IPF Research Programme 2006-2009
Costing Energy Efficiency Improvements in Existing Commercial Buildings
Richard Quartermaine
SPR Research Briefing1st October 2009

Agenda
• Background• Objectives• Why?• Research approach• Findings
Background• Commenced in May
2008
• Summary report and full research findings published in January 2009

Objectives
• How can landlords improve the energy efficiency of their existing buildings?
• What improvements should be implemented first?
• How much CO2 can be saved and at what cost?

Why is this important?
• Energy Performance Certificates
• Reducing risk• Carbon Reduction
Commitment• Corporate social
responsibility

Research approach
• Building types• Key characteristics
• Baseline CO2 emissions
• Improvements• Occupied or vacant
buildings• Cost/benefit appraisal
SELECT BUILDING TYPES
THERMAL MODEL BUILDINGS
ENERGY EFFICIENCY
IMPROVEMENTS
BASELINE CO2
EMISSIONS
VACANT BUILDINGS
OCCUPIED BUILDINGS

What buildings?Plan Depth Age Glazing % Annual CO2
Emissions (kgCO2/m²)
Air conditioned
Office 1 Deep 1990s fabric & services 50 72.2
Office 2 Deep 1990s fabric & services 80 79.2
Office 3 Narrow 1990s fabric & services 50 68.3
Office 4 Narrow 1990s fabric & services 80 73.8
Office 5 Deep 2002 fabric & services 80 51.0
Supermarket Deep 1990s fabric & services 10 122.8
Non-air conditioned
Office 6 NarrowPre- 1940s fabric &
1990 services50 47.8
Warehouse Deep 1990s fabric & services 10 57.7
Mechanical ventilation only (no air conditioning)
Office 7 Narrow 1990s fabric & services 50 56.4

CO2 reduction through refurbishment – all offices
Cumulative % saving
Office 1 Office 2 Office 3 Office 4 Office 5 Office 6 Office 7
Market improvement 25% 26% 25% 25% - 30% 24%
£25/m² budget 37% 39% 35% 35% 14% 47% 39%
£50/m² budget 47% 46% 46% 42% 28% 51% 50%
£75/m² budget 49% 52% 48% 46% 29% 55% 51%
£150/m² budget 54% 58% 54% 54% 36% 63% 54%

CO2 reduction through refurbishment
-
50
100
150
200
250
300
0 5 10 15 20 25 30 35 40 45
Cumulative Savings KgCO2/m2/yr
Cu
mu
lati
ve C
apit
al C
ost
£
£50/
m²
budg
et
£75/
m²
budg
et
£150
/m²
budg
et
Mar
ket r
efur
bish
men
t
£25/
m²
budg
et

Upgrade Category
Description of upgrade Capital cost £/m²
(extra over)
kgCO2/m² saved
Marginal Cost £ per
kgCO2 /m²
Payback - current energy
costs (Year)
Internal Rate of Return
Heating Upgrade heating pumps to variable speed pumps
0.06 0.45 0.14 1 124%
Lighting Upgrade lamps within office luminaires to 10W/m² 0.81 2.04 0.40 3 47%
Cooling DC drive fan coil units3.13 6.29 0.50 3 38%
Heating Heat recovery through a thermal wheel5.14 6.85 0.75 8 11%
Heating Upgrade boiler to achieve efficiency of 95%5.37 6.11 0.88 10 7%
Power Upgrade power correction factor to 0.952.28 1.81 1.26 12 3%
Cooling Upgrade air conditioning pumps to variable speed pumps
0.51 0.21 2.45 No return -
Shading Internal blinds14.26 5.18 2.75 No return -
Cooling Upgrade chiller plant to achieve a CoP of 11
6.51 2.14 3.04 No return -
Renewable energy
Wind turbine 20kW16.06 4.76 3.37 No return -
Cooling Upgrade specific fan power to 1.5W/l/s3.61 0.61 5.92 No return -
Renewable energy
Solar water heating system 50m²9.64 1.13 8.53 No return -
Heating and power
Combined heat and power system80.31 8.62 9.32 No return -
Energy efficiency improvements – VACANT office refurbishment

Upgrade Category Description of upgrade Capital cost £/m²
(extra over)
kgCO2/m² saved
Marginal Cost £ per
kgCO2 /m²
Payback - current energy
costs (Year)
Internal Rate of Return
Normal working or
out of hours working
Heating Upgrade heating pumps to variable speed pumps 0.06 0.45 0.14 1 124% Normal
Lighting Upgrade lamps within office luminaires to 10W/m² 1.21 2.04 0.60 4 28% Out of hours
Heating Upgrade boiler to achieve efficiency of 95% 5.37 6.11 0.88 10 7% Normal
Heating Heat recovery through a thermal wheel 7.71 6.85 1.13 13 2% Out of hoursPower Upgrade power correction factor to 0.95 3.42 1.81 1.89 No return - Out of hours
CoolingUpgrade air conditioning pumps to variable speed pumps
0.51 0.21 2.45 No return - Normal
Renewable energy Wind turbine 20kW 16.06 4.76 3.37 No return - Normal
Shading Internal blinds 19.07 5.18 3.68 No return - Out of hours
Cooling Upgrade chiller plant to achieve a CoP of 11 9.76 2.14 4.56 No return - Out of hours
Renewable energy Solar water heating system 50m² 9.64 1.13 8.53 No return - Normal
Cooling Upgrade specific fan power to 1.5W/l/s 5.42 0.61 8.89 No return - Out of hours
Renewable energy Photovoltaics 100m² 24.09 1.04 23.17 No return - Normal
Energy efficiency improvements – an OCCUPIED office
Summary
• Low cost opportunities for reducing CO2 emissions in existing commercial buildings
• Biggest scope with older buildings
• Opportunities for both vacant possession refurbishments and tenant occupied buildings
• Improve EPC ratings and reduce liability under CRC
SPR
Sustainability as part of your recession strategy
October 2009
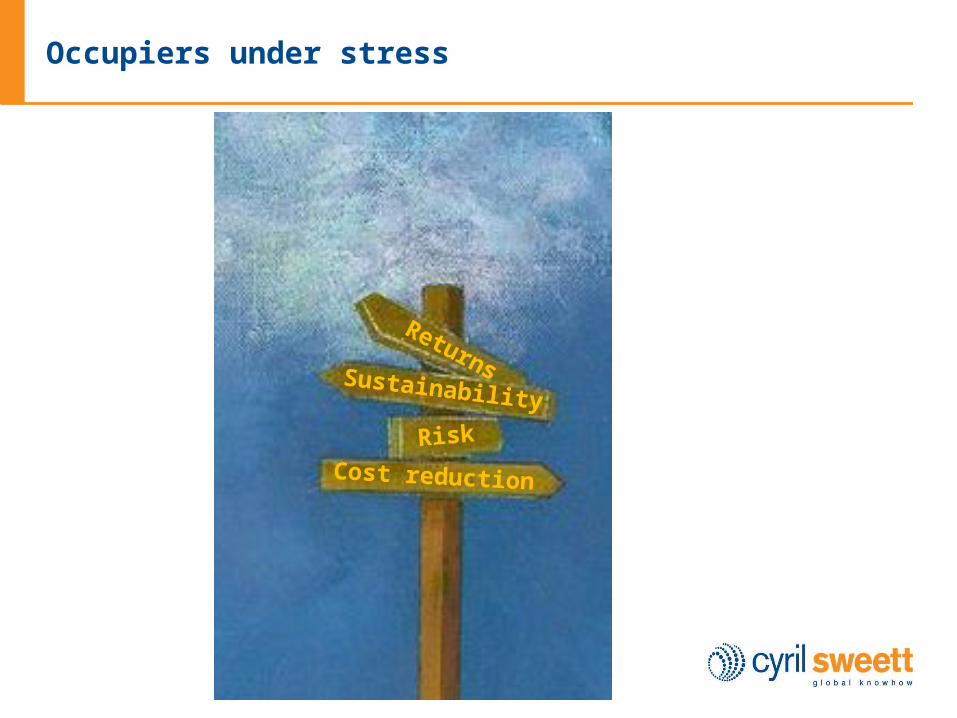
Cost reduction
Risk
Sustainability
Returns
Occupiers under stress
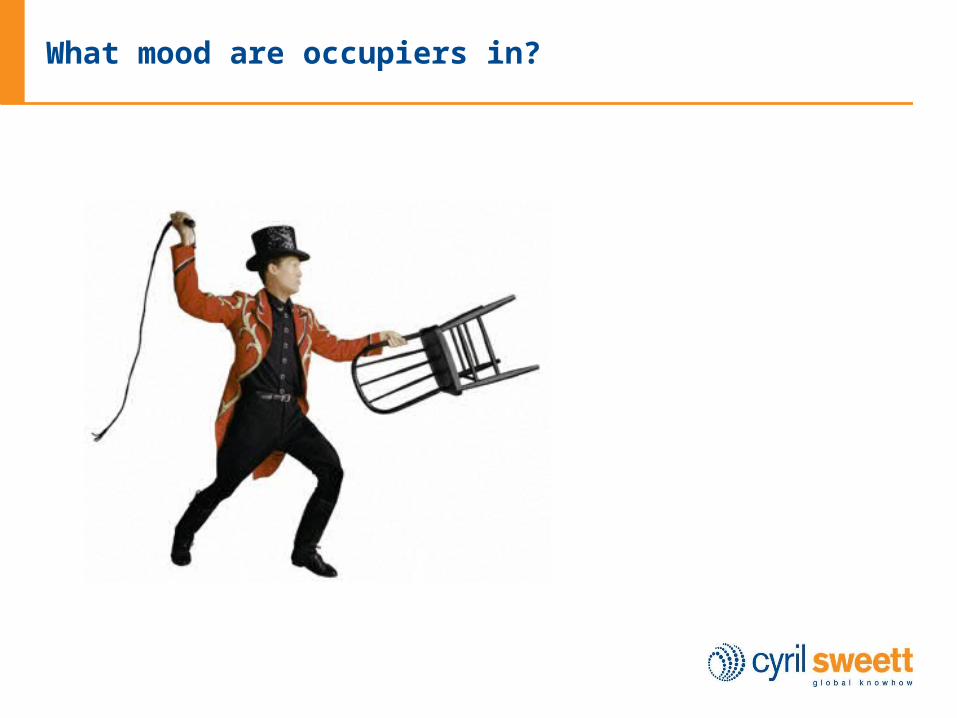
What mood are occupiers in?

What are they saying about the future?
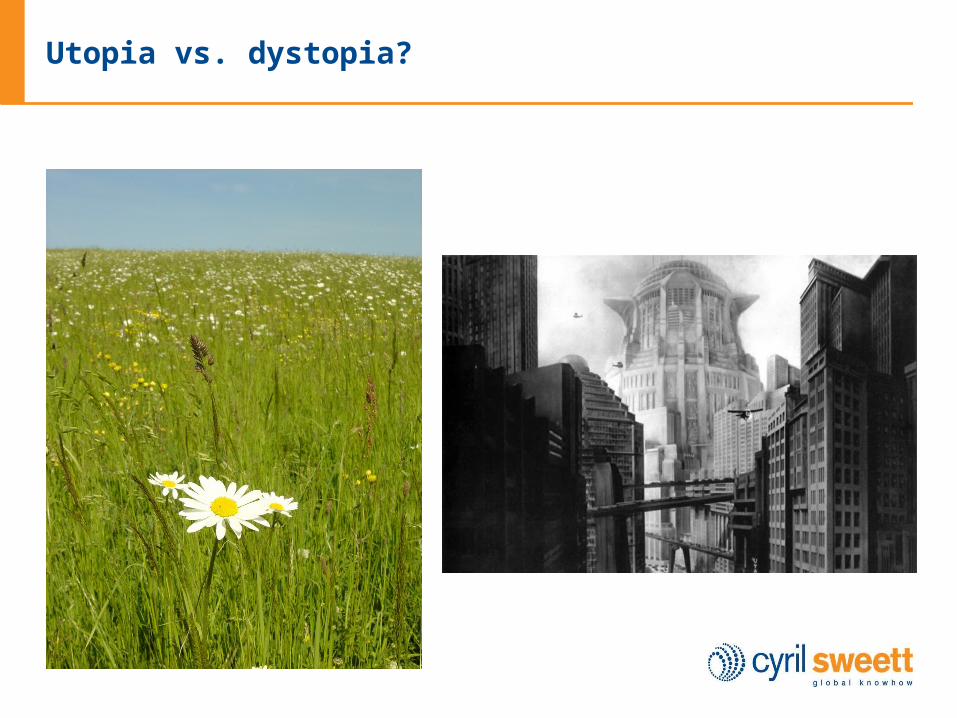
Utopia vs. dystopia?
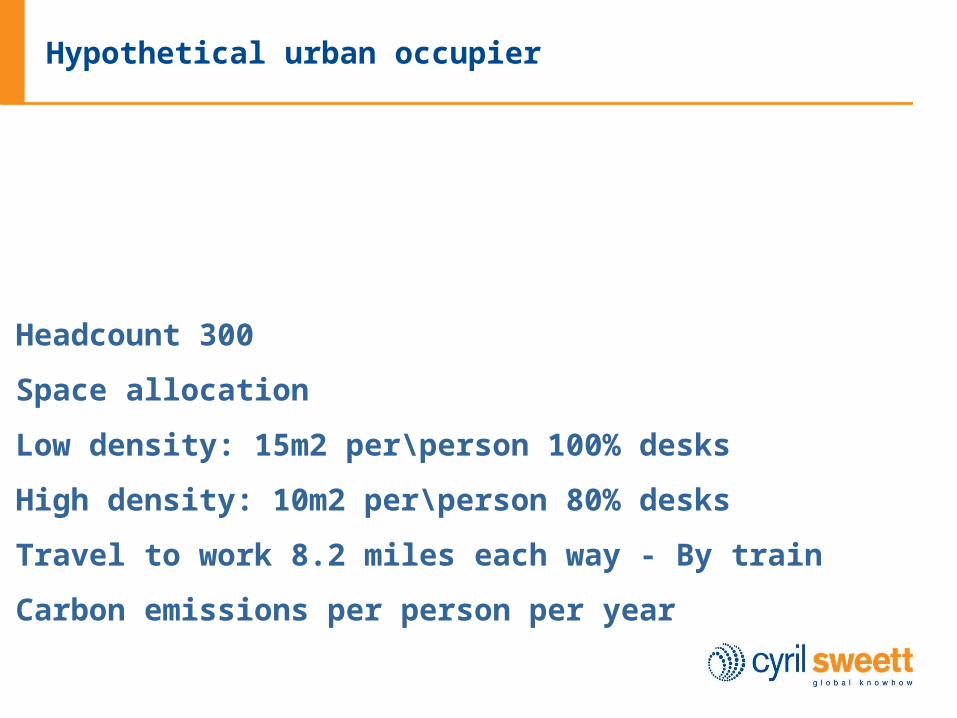
Hypothetical urban occupier
Headcount 300
Space allocation
Low density: 15m2 per\person 100% desks
High density: 10m2 per\person 80% desks
Travel to work 8.2 miles each way - By train
Carbon emissions per person per year
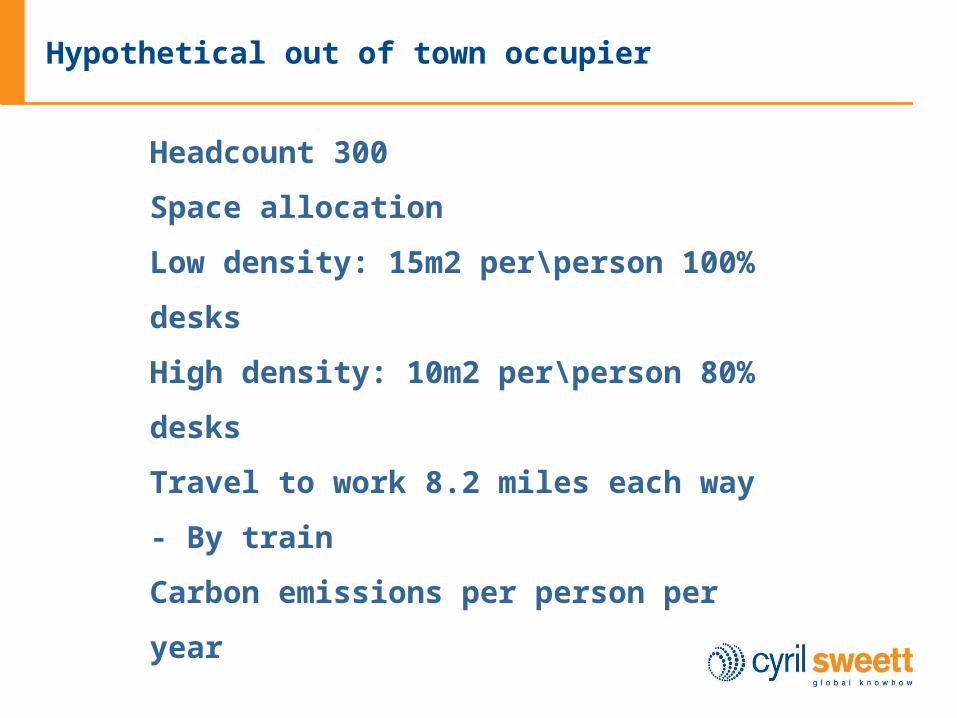
Hypothetical out of town occupier
Headcount 300
Space allocation
Low density: 15m2 per\person 100% desks
High density: 10m2 per\person 80% desks
Travel to work 8.2 miles each way - By
train
Carbon emissions per person per year
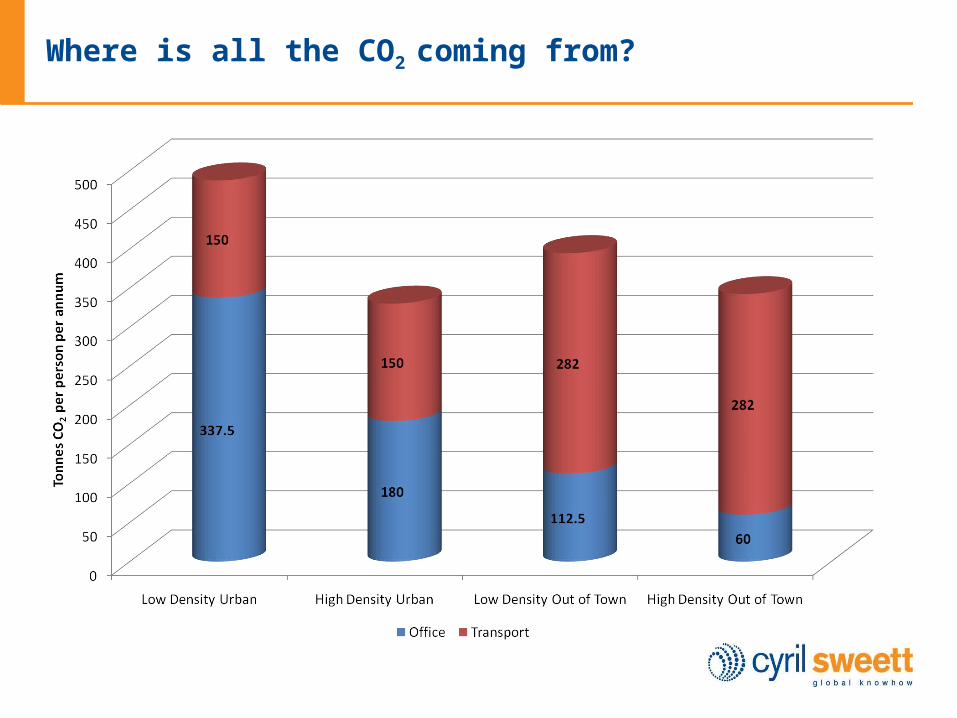
Where is all the CO2 coming from?

Could location become more important?
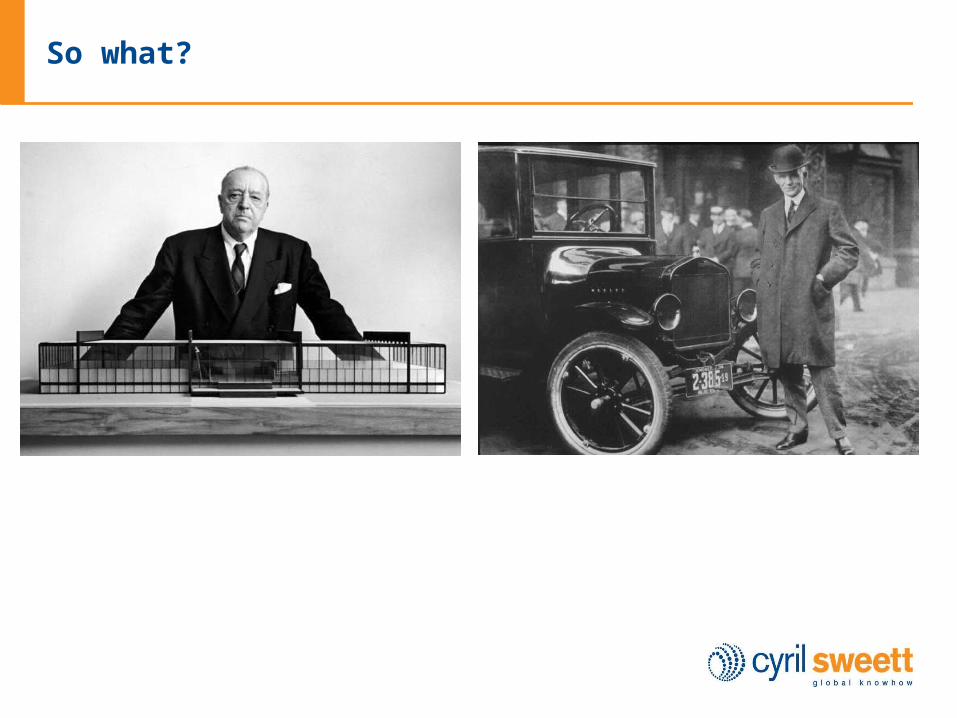
So what?
“Less is more”
Ludwig Mies van der Rohe
“There are no big problems, there are just a
lot of little problems”
Henry Ford