Embed Size (px)
Citation preview

The Islamic University-Gaza Deanery of Higher Studies Faculty of Science Department Of Biological Sciences / Medical Technology
SSiiggnniiffiiccaannccee ooff sseerruumm lleevveellss ooff ccooppppeerr aanndd zziinncc iinn TTyyppee IIII ddiiaabbeettiicc,, hhyyppeerrtteennssiivvee,, aanndd ddiiaabbeettiicc
hhyyppeerrtteennssiivvee ppaattiieennttss iinn GGaazzaa CCiittyy
ومرضى الضغط ى مرض،)2نوع ( في مصل مرضى السكري النحاس والخارصینأھمیة
غزة في مدینة ضغط الدم السكري
Prepared By
Ghada Anwar El-Zebda
Supervised by
Dr. Abdalla A. Abed Dr. Nizam M. El-Ashgar
Submitted in partial fulfillment of requirements for the degree of Master of Biological sciences /Medical Technology
Faculty of Science.
م2006 – ھـ1427

I
DECLARATION "I hereby declare that this manuscript is my own work and that , to the best of my knowledge and belief, it contains no material previously published, or written by another person , nor material which to a substantial extent has been accepted for the award of any other degree of the university or other institute , except where due a acknowledgement has been made in the text ". Signature: Ghada Name: Ghada A. EL Zebda Date: June 2006 Copy right ---------------------------------------------------------------------------------------------------------- All Rights Reserved: No parts of this work can be copied, translated or stored in any kind of a retrieval system, without prior permission of the authors.

II
Abstract
Significance of serum levels of copper and zinc in type II diabetic, hypertensive, and diabetic hypertensive patients
Objective: To evaluate copper and zinc serum levels in diabetic patients,
hypertensive patients and diabetic hypertensive patients and investigate
existing correlation between trace elements ( Zinc and copper) and serum
glucose, cholesterol, triglycerides , HDL, and LDL levels in these groups .
Research design and methods: Convenience sample of 52 type II diabetes
mellitus, 52 hypertensive patients, 52 diabetic hypertensive patients, and 52
normal subjects considered as apparently healthy by clinical examination and
with no history of any disease were included in the study. Fasting blood
samples were collected from all subjects and appropriately processed for
analysis of glucose, cholesterol, and triglycerides, HDL, LDL by using chemical
procedure, serum Cu and Zn were analyzed by atomic absorption
spectrophotometry .
Results: In diabetic patients the serum levels of glucose (Mean±SD =213±66.3),
serum levels of triglycerides (161±23.3), serum levels of LDL (95.3±36.3),
serum levels of Cu (68.8±37.9) were found to be higher than normal group
serum levels of glucose (Mean±SD=93.5±12.1), serum levels of triglycerides
(151±29.1), LDL levels(73.6±36.2), serum Cu levels (45.3±18.1).
In diabetic group there was no correlation between zinc and glucose,
triglycerides and HDL of study group (p > 0.05). While there was an inverse
correlation found with cholesterol (P<0.01) and LDL (P<0.01), there exists also
positive correlation with copper (p<0.001).
In diabetic group there was a strong positive correlation exists between copper
and glucose level (P<0.001), and triglycerides (P<0.05), while there was weak
negative correlation found with LDL (p<0.05). Copper also correlates well with
zinc (p<0.001). In diabetic group there was an inverse correlation exists
between zinc and Cholesterol level (P<0.01), and LDL level (P<0.01).
In hypertensive patients serum levels of glucose (99.5±21.1) ,serum levels of
cholesterol (183±36.6),serum levels of triglycerides (167±58) , serum LDL
levels (103±35.5), and HDL serum levels in hypertensive (45.6±9.2) were not
significantly different from serum control levels. Serum Cu level (52.4±23.5),

III
serum zinc level (25.3±8.25) were found to be higher than normal group serum
levels.
In hypertensive patients there was no correlation between copper and glucose
level, cholesterol, triglycerides, HDL, and LDL (p>0.05). Also there were no
correlation between zinc and glucose level, cholesterol ,triglycerides ,HDL, also
no correlation found with LDL(p>0.05).
In diabetic hypertensive patients serum levels of glucose (213±87.4), serum Cu
levels (61.1 ±28.6), and serum Zn level (23.4±9.99 were found to be higher than
normal group. However HDL serum levels (49.2±16.3) was found lower than
normal group (50.6±11.9).
In diabetic hypertensive group there was a positive correlation between serum
copper levels and serum HDL levels (p<0.05). Zinc also correlated positively
with LDL (p<0.05).
Conclusion: Throughout this study we have focused on the role of zinc and
copper in diabetes and hypertension. The levels of zinc and copper are
differentially changed in the studied groups. Each diseased group demonstrates
specific correlations with glucose and lipid profile parameters which implies
different mechanisms of etiology.
Key Words: Diabetes, Diabetic hypertensive patient, Hypertension, Copper,
Zinc, Lipid Profile

IV
مستخلص
ومرضى ضغط ، الضغطىمرض، )2نوع ( مصل مرضى السكري الخارصین في النحاس و أھمیة
الدم السكري
مرض ي ال سكري، و مرض ى ال ضغط و مرض ى ض غط الخارص ین ل دى تقی یم م ستویات م صل النح اس و :الھدف
ال ـدھون عالی ة الكثاف ة والت راي جلی سیراید و الكول سترول و الجلوك وز م ع م صل إیج اد علاق ات والدم ال سكري،
HDL والدھون قلیلة الكثافة ـ LDLفي ھذه المجموعات .
م ن 52 م ن مرض ي ال ضغط و 52، )2الن وع ( مرض ى ال سكري 52 من مختارةعینات :تصمیم البحث و طرقھ
و عدم و جود ت اریخ مرض ي لأي الإكلینیكیة شخص سلیم بناءا على الفحوصات 52مرضى ضغط الدم السكري،
ب شكل ملائ م لتحلی ل تمت معالجة ال دماء .و قد تم أخد عینات الدماء من جمیع الأشخاص و ھم صائمون . ضیمر
باس تخدام LDL والدھون قلیلة الكثافة HDLو الـدھون عالیة الكثافة التراي جلیسیراید الجلوكوز، و الكولسترول و
.از الامتصاص الذري الإشعاعي تم تحلیلھا غلي جھالخارصینالنحاس و أما الطرق الكیمیائیة
)213±66,3( = Mean±SD)(لدى مرضى السكري، ظھرت مستویات مصل الجلوكوز :النتائج
و) 95,3±36,3(LDLم ستوى ال دھون قلیل ة الكثافة ـ و )23,3 ±161 (الت راي جلی سیراید م ستوى م صل
) .15,2±28,3(الخارصین مستوى مصل و) 68,8 ±37,9(مستوى مصل النحاس
والت راي جلی سیراید والجلوك وز النت ائج الت ي ت م الح صول علیھ ا أوض حت أن الوس ط الح سابي لمع دل ج د أنن
م صل الجلوك وز أن ثحی الدراس ة عنھ ا ق ي العین ة ال ضابطة مجموع ة ف ي أكب ر كان ت ال دھون قلیل ة الكثاف ة
و ) 29,1±151(ید الت راي جلی سیرا مستوى م صل ) 35±156( مستوى مصل الكولسترول و ) 93,5±12,1(
تركی ز ال ـدھون عالی ة أم ا . )6,64±21,8(الخارص ینم ستوى م صل و) LDL 73,6±36,3 (م ستوى ال ـ
)11,9±50,6 ( العینة الضابطة أقل منكانت بكمیة )8,25±42,41 ( لدى مرضى السكريHDLالكثافة
و ال ـدھون التراي جلیسیراید ووزالجلوك و الخارصینلدى مجموعة مرضى السكري، لم تكن ھناك علاقة ما بین
(P<0.01) الكولسترول، بیمنا ھنالك علاقة عكسیة بین p>0.05)( للمجموعة الدراسیة HDLعالیة الكثافة
.(p<0.001)النحاس و ھناك علاقة قویة مع LDL (P<0.0)والدھون قلیلة الكثافة الـ
، ف ي HDL (p>0.05) و ال ـ الكول سترول اس و لدى مجموعة مرضى السكري، لم تكن ھناك علاقة م ا ب ین النح
، بیمن ا ھنال ك (P<0.05)الت راي جلی سیراید و(P<0.001) الجلوك وز م ا ب ین م ستوى قویةحین أن ھناك علاقة
. (p<0.001) الخارصین و النحاس الذي لھ علاقة قویة مع LDL (P<0.05) بین ة ضعیفعلاقة عكسیة
وم ستوى م صل الكول سترول )21,1 ±99,5 (جلوك وز ال ال دم وج د م ستوى م صل ض غطل دى مرض ى
LDL م ستوى وال دھون قلیل ة الكثاف ة ـ و ) 58±167 ( الت راي جلی سیراید و م ستوى م صل ) 183±36,6(
.)8,25±25,3(الخارصین مستوى مصل و ) 103±35,5(
وراي جلی سیرایدالت والجلوك وز النت ائج الت ي ت م الح صول علیھ ا أوض حت أن الوس ط الح سابي لمع دل نج د أن
تركی ز ال ـدھون عالی ة نجد أن ولكن الدراسة عنھا قي العینة الضابطة مجموعة في أكبر كانت الدھون قلیلة الكثافة
)11,9±50,6 ( العین ة ال ضابطة أق ل م ن كان ت بكمی ة )9,2±45,6( ل دى مرض ى ض غط ال دم HDL الكثاف ة

V
الت راي والكول سترول الجلوك وز ن م ستویي النح اس و لدى مجموع ة مرض ى ال ضغط، ل م تك ن ھن اك علاق ة م ا ب ی
LDL و ل م ی تم العث ور أی ضا عل ى علاق ة م ع وال دھون قلیل ة الكثاف ة HDLو ال ـدھون عالی ة الكثاف ة جلی سیراید
(p>0.05). و ال ـدھون الت راي جلی سیراید الكول سترول و و الجلوك وز و الخارص ین لا توجد علاقة بین مستویات
.LDL (p>0.05) و لم تیم العثور على علاقة مع الدھون قلیلة الكثافة HDLعالیة الكثافة
الخارصینو مستوى مصل ) 87,4±213(الجلوكوزلدى مرضى ضغط الدم السكري وجد مستوى مصل
.)36,2±73,6( و مستوى والدھون قلیلة الكثافة(28.6± 61.1)ومستوى مصل النحاس )45,3±18,1 (
والت راي جلی سیراید والجلوك وز الح صول علیھ ا أوض حت أن الوس ط الح سابي لمع دل النت ائج الت ي ت م نج د أن
تركی ز ال ـدھون عالی ة نج د أن ولك ن الدراسة عنھا قي العینة ال ضابطة مجموعة في أكبر كانت الدھون قلیلة الكثافة
ابطةالعینة الض أقل منكانت بكمیة و)16,3±49,2( لدى مرضى ضغط الدم السكري HDL الكثافة
) 50,6±11,9(.
HDL ال ـدھون عالی ة الكثاف ة ـ و النحاس ن بی علاقة طردیةإیجادلدى مجموعة مرضى ضغط الدم السكري، تم
)P<0.05 (، الخارص ین علاق ة م ا ب ین النح اس و أی ضا ھنال ك (p<0.05)ب ینعلاق ة طردی ة أی ضا وتوج د
.)P<0.05( و الكولسترول الخارصین
ف ي ك ل فئ ات الدراس ة وك ذلك ی دل عل ى أھمی ة ال ـدھون و المعادنأھمیة قیاساتؤكد على مدى ما وجدناه ی :أخیرا
م ستوى تغیرات قيحدوث وقد وجد السكري و مرض ضغط الدم قي مرض الخارصینالنحاس و حفظ مستویات
تف سر لت ي او ال ـدھون و م ع ال سكر تق ا ر علا مرض یة تظھ مجموع ھ ك ل .الدراس ة فئ ات في الخارصینالنحاس و
. المرضوت میكانیكیات مختلقة لأسباب حد
الـدھونو، الخارصینمرض السكري، مرض ضغط الدم السكري، مرض الضغط، النحاس، : كلمات مفتاحیھ

VI
DEDICATION
I dedicate my research to my loving parents

VII
ACKNOWLEDGEMENT
I thank Allah first for helping me every moment. Thanks To my supervisor Dr. Abdalla Abed, who had been a good source of
motivation, inspiration and challenge throughout this research.
Thanks to my second supervisor Dr. Nizam El -Ashgar for his help during my research and testing the samples in chemistry department in Islamic University. Thanks for Mr. Ahmad Jarad for helping me in performing statistical data analysis. Thanks to Dr. Ayoup El-Alem the chief field health in UNRWA for agreement
to collect the samples from Zaitoun and Rimal Health Center in UNRWA. Thanks to Dr. Ali El-Jeesh the supervisor of chronic disease in UNRWA for facilitating the sample and data collection .. Thanks to Mr. Omar El Amwassy the laboratory supervisor in UNRWA for facilitating our job in sample collection from Zaitoun and Rimal Health Center in UNRWA. Thanks to my parents for their emotional support and encouragement, brother
and sister for their help and understanding.
Thanks to my husband and his family. And finally, a very big thanks to my University which was our second home and
it will still have this value in my heart for ever.

VIII
TABLE OF CONTENTS
1.Introduction
1.1 Diabetes Mellitus ........................................................................................1
1.1.1 Association between diabetes mellitus and
alterations in metabolism of trace elements ……… ....................... 1
1.1.2 The Zinc and diabetes mellitus .........................................................2
1.1.3 Copper and diabetes ........................................................................2
1.2 Blood pressure …………………………………...…………………................3
1.2.1 The Hypertension….....…………………………………..........................3
1.2.2 Trace elements and hypertension ....................................................3
1.2.3 Zinc and hypertension ......................................................................4
1.2.4 Copper and hypertension .................................................................4
1.3 Aims of the study …………………………………………………….....……...4
2. Literature Review
2.1 Diabetes mellitus ........................................................................................5
2.2 Diabetes and trace elements ……………………….....................……….5 2.2.1 Oxidative stress and diabetes ..........................................................6
2.2.2 Oxidative Stress and the Chronic Complications of Type II ...............6
2.2.3 Association between diabetes mellitus and alterations in
metabolism of trace elements ...........................................................7
2.2.3.1. Zinc and diabetes……......………....…………………………..8
2.2.3.2 Copper and diabetes ............................................................9
2.3 Hypertension ............................................................................................10
2.3.1 Types of hypertension .....................................................................10
2.3.1.1 Essential hypertension ...........................................................10
2.3.1.2 Secondary hypertension ..........................................................11
2.3.2 Oxidative stress and mechanism of hypertension ............................11
2.3.3 Association between hypertension and alterations in
metabolism of several trace elements ............................................12
2.3.3.2 Zinc and hypertension ......................................................12
2.3.3.1 Copper and hypertension .................................................13

IX
3.Materials and Methods
3.1 Study design and selection of subjects...........................................16
3.2 Setting………………………………………………………………………17
3.3 Ethical considerations…………………………………………………......17
3.4 Materials……………………………………………………………………..17
3.4.1 Equipment……………………………………………………………...17
3.4.2 Kits ……………………………………………………………………..17
3.4.3 Reagent ………………………………………………………………..17
3.5 Methods .. ........................................................................................... 18
3.5.1 Sample preparation ....................................................................18
3.5.2 Glucose Test .................. .......................................................... 18
3.5.3 Cholesterol Test......................................................... …………..19
3.5.4 HDL Cholestrol Mesurement……… ….....................................21
3.5.5 Triglycerides Test…………..........................................................22
3.5.6 LDL levels calculation………………………………………………..23
3.5.7 Trace Elements Analysis by Atomic Absorption........................ 24
3.6 Statistical Analysis.............................................................................. 27
4. Results
4.1 Diabetes Group ............................................................................... .......28
4.2 Hypertensive Group ............................................................................. .35
4.3 Diabetic Hypertensive Group ........................................................... ......40
5. Discussion
5.1. Copper in diabetic patients………………………………....…………46
5.1.1 Relation between copper and lipid profile in diabetics….…..........47
5.2. Zinc levels in diabetics………......…….......………………………….49
5.2.1. Zinc and lipid profile in diabetics…………………………….……..49
5.3 Hypertension…………………………………………………....…….………50
5.3.1 Cu and Zn in hypertensive patients…………………………….......50
5.3.2 Oxidative stress and hypertension……. ……………....……..........51
5.3.3 Lipid profile in hypertensive patient …………................................51
5.3.4 Copper and cardiovascular disease…..…..………...…………........51
5.4 Diabetic hypertensive patients………………………………...……..............53
5.4.1 Cu and Zn in Diabetic hypertensive patients..................................53
5.4.2 Lipid profile in Diabetic hypertensive patients.................................54

X
6. Conclusions and Recommendations ............................................................55
6.1. Conclusion…………………………………………………………………..55
6.2. Recommendations………… ……………………….……………………56 .
References .
Appendices
Appendix 1: UNRWA agreement
Appendix 2: Consent form
Appendix 3: Questionnaire
XI
LIST OF TABLES
Table 4.1 Comparison between the age of diabetic group with the age of
control group .......................................................................... .......28
Table 4.2 Serum glucose and lipid profile levels in both diabetic
group and control group..................................................................29
Table 4.3 Serum trace elements levels in both diabetic group
and control group ........................................................................ 30
Table 4.4 Comparison between copper in diabetic group and age, glucose
and lipid profile and zinc……............................….………………….31
Table 4.5 Comparison between zinc in diabetic group and age, glucose and lipid
profile and copper...........................................................................33
Table 4.6 Comparison between the age of hypertensive group with the
age of control group ....................................................................... 35
Table 4.7 Comparison between glucose and lipid profile of hypertensive
group with control group ............................................................ …36
Table 4.8 Serum trace elements in both hypertensive group and control
group .............................................................................................. 37
Table 4.9 Comparison between copper in hypertensive group with glucose
age, lipid profile and zinc………………………………………………38
Table 4.10 Comparison between zinc in hypertensive group with age, glucose,
lipid profile and zinc..................................................................38
Table 4.11 Comparison between the age of diabetic hypertensive group with the
age of control group.... ................................................................ .....39
Table 4.12 Comparison between glucose and lipid profile of diabetic hypertensive
group with control group …………………………………………….41
Table 4.13 Comparison between serum trace elements of diabetic
hypertensive group with control group……………………............41
Table 4.14 Comparison between copper in diabetic hypertensive group with age,
glucose , lipid profile and zinc...................................... ………..42
Table 4.15 Comparison between zinc in diabetic hypertensive group with age,
glucose, lipid profile and zinc.............................……….................44

XII
LIST OF FIGURES
Figure 4.1 Correlation between copper levels and glucose levels in diabetics.31
Figure 4.2 Correlation between copper levels and LDL levels in diabetics .....32
Figure 4.3 Correlation between copper levels and triglyceride in diabetics.......32
Figure 4.4 Correlation between zinc and copper in diabetic group ..................33
Figure 4.5 Correlation between zinc and LDL in diabetic group ..................... 34
Figure 4.6 Correlation between zinc and cholesterol in diabetic group ............34
Figure 4.7 Correlation between zinc and copper in diabetic hypertensive
group …………………………………………………………………………………43
Figure 4.8 Correlation between copper and HDL in diabetic hypertensive
group ..........................................................................................................43
Figure 4.9 Correlation between zinc and cholesterol in diabetic hypertensive
group………………………………………………………………………………….45
XIII
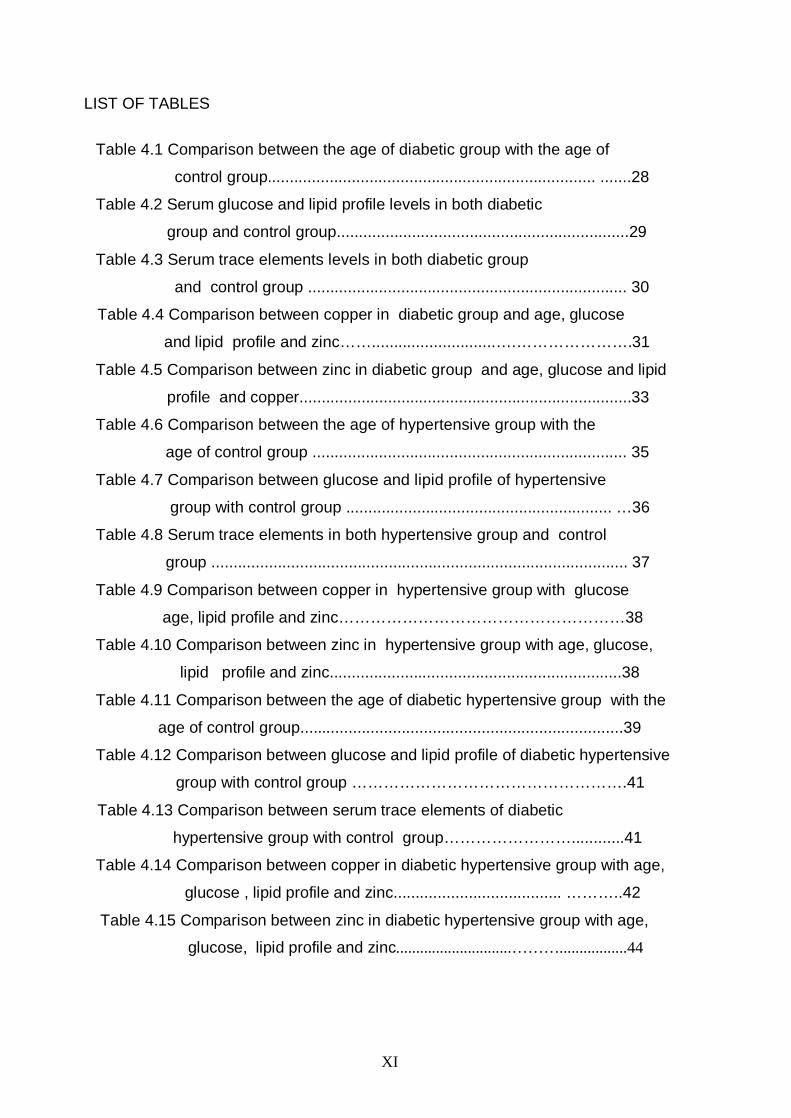
ABBREVIATIONS
Atomic absorption Spectrophotometry
Atrial Pressure
Coronary Artery Disease
Cholesterol
Copper
Diabetes Mellitus
extra cellular superoxide dismutase
Gram
High density lipoprotein
Insulin Dependent Diabetes Mellitus
Low Density Lipoprotein
Liter
Milligram
Millimeter
Non Insulin Dependent Diabetes Mellitus
Nanometer
Nitric Oxide
Probability
Pearson's correlation coefficients
Reactive Oxygen Species
Standard Deviation
Super Oxide Dismutase
Triglycerides
World Health Organization
Zinc
AAS
AP
CAD
Ch
Cu
DM
es SOD
g
HDL
IDDM
LDL
L
mg
ml
NIDDM
nm
NO
P-value
r
ROS
SD
SOD
TG
WHO
Zn

1
Chapter-1
Introduction 1.1 Diabetes Mellitus
Diabetes is an epidemic disease in most countries. World wide, an
estimated 150 million people are affected by diabetes, and this number is likely to
reach 300 million by the year 2025 if successful strategies are not implemented
for its prevention and control (1). There are three types of diabetes; type I, type II
and gestational diabetes.
Diabetes Type I result from pancreatic β-cell destruction. This type
constitutes only 10% of diabetic cases and commonly occurs in childhood and
adolescence (1).
Diabetes type II is characterized by insulin resistance with relative insulin
deficiency. This type accounts for 90% of all diabetic cases and commonly
appears in adults so its called adult- onset diabetes. In this type of diabetes,
insulin is present in little amounts. Fatty acids are incorporated into triglycerides
for release of very low –density lipoproteins. So they are at increased risk of
developing macro vascular and micro vascular complications (2).
Recently, some evidences suggested that oxidative stress may play an
important role in the etiology of diabetes and its complications such as
atherosclerosis, arteriosclerosis, hypertension and chronic renal failure (3).
Oxidative stress results from imbalance between free radical and anti-oxidants
enzymes such as super-oxide dismutase (4, 5).
Gestational diabetes occurs temporarily during pregnancy in women with an
inherited predisposition, over weight; family history of diabetes (6).
1.1.1 Association between diabetes mellitus and alterations in metabolism
of trace elements
A number of studies have reported correlation between diabetes and trace
elements such as zinc, copper. Scott and Fischer (1938) first recognized the
relationship between zinc and insulin (7). Zinc affects antigenic properties of
insulin which leads to hyperglycemia. Increase in the copper ion levels in patients
with diabetes mellitus (DM) may be attributed to hyperglycemia that may

2
stimulate glycation and release of copper ion and this accelerate the oxidative
stress (8).
1.1.2 Zinc and diabetes mellitus
Zinc serves an essential role as a cofactor for more than 200 metal
enzymes, many of which regulate the metabolism of carbohydrates, lipids and
proteins. Insulin itself is stored in an inactive form in the presence of zinc(9) .
Zinc ions in the secretary granules of β cells are known to glue insulin
molecules, creating somatically stable hexamers. When the secretary granules
open to the surface, the zinc ions pressure decreases rapidly and pH levels
change from acid to physiological level, which results in free insulin monomers
and zinc ions will be released from pancreas (10).
The increased levels of zinc in DM has been suggested also to be due to
either inability to transport appropriate amount of zinc in the crucial cell types that
require relatively higher amount of zinc than the other cell types, because there is
presence of genetic and environmental link between human zinc transporters
and their differential expressions in the islet beta cells, or may be due to low
degree of expressions of the critical zinc transporters in the beta cells (11) .
Zinc is considered as an integral component of Cu-Zn SOD which acts as
anti oxidant and protects from free radicals. Free radicals when accumulate, this
leads to oxidative stress which play important role in the etiology of diabetes and
diabetic complication (9).
1.1.3 Copper and diabetes
Copper is the third most abundant essential trace mineral in the body. In
fact, copper has an important role in the body, being component of two of our
most important anti-oxidant enzymes; Cu-Zn SOD and ceruloplasmin (12).
The intestine plays an important role in regulation of copper. Zinc competes
with copper for intestinal absorption, so increased intake of zinc leads to copper
deficiency (13).
Both increased and decreased Cu levels were found in diabetic patients
(14,15). A deficiency of copper has been shown to result in glucose intolerance,

3
decreased insulin response; increased glucose response, which lead to
depression the activity of Cu-Zn SOD. This leads to increase in the amount of
free radicals which result in the increase in the oxidative damage (14). In another
study however, in patients with diabetes mellitus it was found an increase in the
level of copper may stimulate glycation and release of copper ions and this
accelerates the oxidative stress (15).
1.2 Blood pressure
Blood pressure is the force of the blood pushing against the walls of the
arteries (1). There are two types of blood pressure; systolic and diastolic. Any
increase of blood pressure leads to hypertension which is the major risk factor of
atherosclerosis and renal failure (16).
1.2.1 Hypertension
There are two types of hypertension, essential (primary) and secondary
forms. Primary hypertension is the most common accounting for more than 95%
of all cases. This type of hypertension has no known cause, and could be due to
the interplay among many genetic and environmental factors. Secondary
hypertension have an identified source i.e. renal parenchyma disease, use of
oral corticosteroids and endocrinal disorders (17).
1.2.2 Trace elements and hypertension
Trace elements regulate blood pressure, any imbalance of dietary intake of
these elements such as (copper, zinc) will affect the blood pressure and lead to
the development of hypertension and vascular disease, including alternation in
serum cholesterol and triglyceride levels (18). The role of zinc and copper in
hypertension has been implicated in several studies. For example in one study
elevated levels of serum copper have been shown to be independent risk factor
for heart disease and hypertension, however decrease in the amount of zinc
leads to hypertension (19).

4
1.2.3 Zinc and hypertension
Zinc serves an essential role as cofactor for more than 200 metalloenzymes.
Zinc acts as integral components of Cu-Zn SOD, which is essential for the
strength and the integrity of the heart and blood vessels, so decrease the amount
of zinc will lead to decrease in the SOD activity which leads to impair heart
functions (20).
1.2.4 Copper and hypertension
Copper is bound to proteins such as Cu-Zn SOD and ceruloplasmin, which
are anti-oxidant enzymes. Insufficient dietary copper were found to elevate blood
lipids levels and impair heart function (18). Copper is essential both for its role in
anti oxidant enzyme, like Cu-Zn SOD, ceruloplasmin as well as its role lysyl
oxide, which is essential for the strength and the integrity of the heart and blood
vessels (21). Copper deficiency depress Cu-Zn SOD activity and prostacyclin in
the aorta, as well increases the susceptibility of lipoproteins and heart tissue to
peroxidation, Therefore it is thought that copper plays a vital role in the protection
of the cardiovascular disease from free radical damage (22).
1.3 Aims of the study
The overall aim of the present studies to investigate significance of serum levels
of copper and zinc in Type II diabetes, hypertensive, and diabetic hypertensive
patients in Gaza City with specific objectives :
1. Determination of serum Cu and Zn in three patient groups (diabetics,
hypertensive, diabetic hypertensive groups).
2. Measurement of both sugar and lipid profile (cholesterol, triglycerides,
HDL, and LDL) in the three groups.
3. Comparison between the levels of both trace elements (Copper and zinc)
and lipid profile in the studied groups.
4. Investigation of the existence of any correlations between the serum levels
of copper or zinc with the levels of glucose and lipid parameters in the
different studied groups.

5
Chapter 2
Literature Review 2.1 Diabetes mellitus
Diabetes mellitus is a syndrome characterized by raised glucose
concentration in the blood, due to destructions of beta cells of the islet of
langerhans (23). The disease is chronic and also affects the metabolism of fat
and proteins (6). There are many causes of diabetes hereditary, sometimes by
increasing the susceptibility of beta cells to viruses, or by autoimmune antibodies
against the beta cells (3).
2.2 Diabetes and trace elements 2.2.1 Oxidative stress and diabetes
Recently, some evidences suggest that oxidative stress may play an
important role in the etiology of diabetes and diabetes complications (24).
Oxidative stress is defined as excessive production of reactive oxygen species
(ROS) in the presence of diminished antioxidant substances. It has been shown
that oxidative stress has an adverse effect on glucose metabolism. Development
of the disabling chronic complications of diabetes mellitus (DM) has also been
attributed to oxidative stress (25). The body's defense against oxidative stress is
accomplished by interconnecting systems of antioxidant micronutrients (vitamins
and minerals) and enzymes (6). While the vitamins act as donors and acceptors
of ROS, minerals regulate activity of the enzymes (26).
In diabetic patients, the persistence of hyperglycemia has been reported as
a cause of increased production of oxygen free radicals through non enzymatic
glycation, which results in the formation of hydrogen peroxide which inactivate
SOD (27). The primary catalytic cellular defense that protects cells and tissues
against potentially destructive reactions of superoxide radicals and their
derivatives is Cu/ Zn -SOD (28).
Decreased activity of the antioxidant enzymes such as (Cu-Zn SOD) may
increase the susceptibility of diabetic patients to oxidative injury (29). Appropriate

6
support for enhancing antioxidant supplies may help to prevent clinical
complications of diabetes mellitus (30). In view of low activities of SOD in
diabetes it was concluded that supplementary trace elements such as copper
and zinc, the essential components of the enzyme structure may be useful in
preventing the development of diabetic complications (31)
2.2.2 Oxidative stress and the chronic complications of type II diabetes
Hyperglycemia causes oxidative stress, which increases glycosylation and
oxidation of proteins involved in the pathogenesis of the complications of
diabetes (32, 33).
Development of diabetic complications has been hypothesized to be
accelerated by generation of free radicals in cells and tissues (34,35). In
diabetes, oxidative stress is due in part to an increased production of plasma free
radical concentrations and a sharp reduction in antioxidant defenses (36). It has
been postulated that free radical production could result in hyperglycemia (37),
hyperinsulinemia and/or insulin resistance (38), and it was postulated that
oxidative stress represents the common pathway through which hyperglycemia
and insulin resistance induce depressed insulin action (38–39).
Oxidative stress in persons with diabetes is also related to decreased
antioxidant defenses. Oxidative stress contributes to impairment of islet function
(40,41,42), insulin resistance ,and micro vascular and macro vascular
disease(43,44). Diabetic patients with uncontrolled hyperglycemia are at risk for
oxidative stress and complications, and oxidative stress may increase their
requirement for vitamins with antioxidant effects (45, 34, 46). Damaged tissues
may have altered responses to vitamins and differing requirements. Reduction of
hyperglycemia and improvement of blood sugar control reduces oxidative stress,
and reduction of free radical levels should improve metabolic function of beta
cells, vascular endothelial cells, fat and muscle cells, and platelets (33, 34, 41,
46, 47). Decreased glycosylation and oxidation of proteins was found to reduce
atherosclerosis, retinopathy, nephropathy, and neuropathy attributable to these
processes (34)

7
2.2.3 Association between diabetes mellitus and alterations in metabolism
of trace elements
A number of studies have reported an association between diabetes
mellitus (DM) and alterations in the metabolism of several trace minerals (48).
Impaired insulin release, insulin resistance and glucose intolerance in
experimental animals and humans with DM have been linked to a compromised
status of copper and zinc (49). Although the emphasis is on macronutrients
intakes, there is strong evidence that there is an abnormal metabolism of several
micronutrients in diabetic individuals (50). Diabetes seems to be associated with
numerous abnormalities of plasma trace elements and magnesium (51), but the
mechanism of these abnormalities has not yet been elucidated. A decrease in
zinc and selenium concentrations and an increase in copper concentrations
might be additional factors of atherogenicity (52).
The amount of selenium, zinc, and copper in diabetic patients have led to
contradictory finding as possible relationship between the degree of diabetic
control and changes in mineral contents (53).
Zn and Cu serum levels in type 2 and type I DM patients were decreased.
The Zn/Cu ratio was higher in both groups of diabetic patients (54).
Copper and zinc are the major components of antioxidant enzyme SOD
(55 ). This enzyme inhibit oxidative stress which results from the accumulation of
free radicals oxidative stress and plays an important role in the pathological
processes ongoing in the diabetic patient (56). Excessive oxidative stress has
adverse effects on islet survival and function and accelerates complications in
target organs and tissues (55).
8
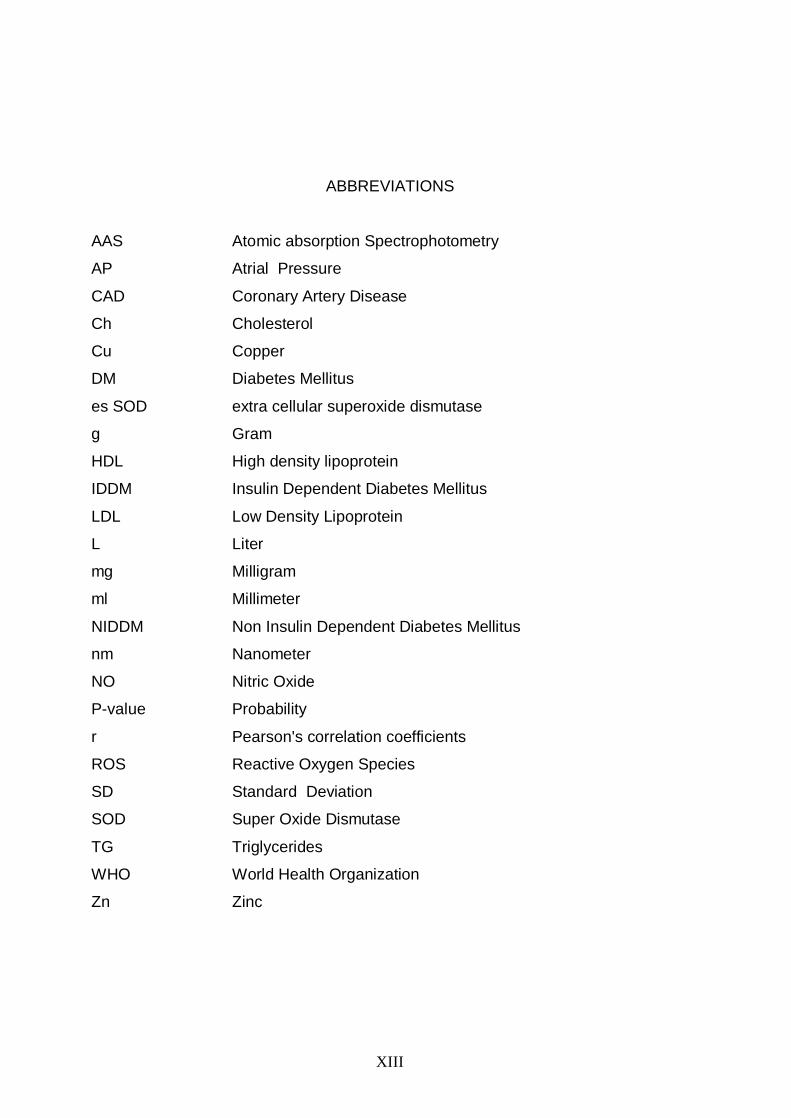
2.2.3.1 Zinc and diabetes
Zinc is an important essential mineral in human nutrition with a wide range
of biological functions. Zinc fulfills catalytic, structural, or regulatory roles in more
than 200 zinc-requiring metalloenzymes (57). The interaction of zinc with insulin
induces conformational changes and enhances binding to the insulin receptor
(58,59). With regard to glucose metabolism, zinc is a co-factor of several key
enzymes. Zinc is an activator of fructose-1-6-bisphosphate aldolase, and an
inhibitor of fructose-1-6-biphosphatase (59). Zinc can also exert antioxidant
activity (60), and is a cofactor in Cu-Zn SOD, a major antioxidant enzyme (61).
There is accumulating evidence that the metabolism of zinc is altered in
insulin-dependent diabetes mellitus and that zinc might have specific roles in the
pathogenesis and progress of this disease. Increased urinary loss of zinc is a
commonly encountered feature of diabetes (62).
Some studies have reported zinc deficiency along with alterations in zinc
metabolism in patients with diabetes (60, 61).
In another study it was found that diabetes can alter copper, zinc and lipid
peroxidation. Plasma copper was higher and plasma zinc and plasma peroxide
concentrations were lower in diabetic than in control subjects (52). Consequently,
considering the possible modulating effects of zinc on insulin sensitivity and its
antioxidant functions, it was postulated that a restored Zn status in individuals
with type 2 DM might counteract the deleterious effects of oxidative stress and
help to prevent complications associated with diabetes (63).
In patients with type II diabetes mellitus, these patients had decreased
serum zinc concentrations, because there presence of male absorption of zinc
which leads to hyperzincuria (64).
In diabetes, zinc is decreased ,copper execration increased and SOD
activity decreased (7). Therefore it was postulated that elevated levels of Cu-Zn
SOD, elicit a protective effect against diabetes (56).

9
Another study it was found that the amounts of copper was increased but
there were no significant alternation in levels of serum zinc in DM (65).
The amounts of Cu-Zn SOD activity was found reduced in diabetic
patient, the copper and zinc status of these diabetic patients was reduced,
providing further evidence of a role for these antioxidant trace elements in this
disease (66) .
Because zinc can exert a number of indirect antioxidant functions, a
hypothesis in humans that increased zinc intake will protect against oxidant
stress in persons with tendencies for both moderate zinc deficiency and high
oxidant stress (60).
2.2.3.2 Copper and diabetes
Copper is the third most abundant essential trace elements in the body.
Copper is present in the body combined with enzymes to form metalloenzymes
such as ceruloplasmin, SOD (65) .These enzymes play major role in redox
reactions, such as superoxide dismutase which plays key role in antioxidant
defense (2). It has been postulated that copper possesses insulin –like activity
and promotes lipogenesis; serum copper is elevated in adult onset diabetes (7).
Human studies demonstrate that diabetic patients have abnormal circulation of
copper (64).
In another study it was found that diabetes can alter copper. Plasma
copper was higher and plasma zinc was lower in diabetic than in control subjects
(66). However in one study which measured the SOD levels in erythrocytes there
were no significant differences between control and diabetic subjects (53).
Increase in the Cu ion levels in patients with diabetes might be attributed
to hyperglycemia that may stimulate glycation and release of copper ions and
this accelerate oxidative stress (7).

10
2.3 Hypertension
Blood pressure is determined by the amount of blood which heart pumps
and the amount of resistance to blood flow in the arteries (75).
2.3.1 Types of hypertension
2.3.1.1 Essential hypertension
Hypertension is the blood pressure that is consistently higher than normal
when no cause for the high blood pressure can be found. Most experts believe
that essential hypertension is caused by several undiscovered factors, which
may be why certain treatments lower blood pressure in some peoples but not
others (67).
Risk factors for essential hypertension
About 95 percent of people with high blood pressure have essential
hypertension. There are no identifiable causes of essential hypertension, but
there are several factors that can increase blood pressure, such as the amount of
blood pumped by the heart, size and condition of the arteries, water and salt
content of the body, condition of the kidneys, nervous system or blood vessels,
and hormone levels in the body. Other factors can include stress, being
overweight, smoking, alcohol use, a diet high in salt, heredity, gender, age and
race (62).
In recent years, considerable evidence has suggested that changes in
vascular endothelial function may cause the increase in vascular tone. For
example, in hypertensive patients, the vascular endothelium produces less nitric
oxide and the vascular smooth muscle is less sensitive to the actions of this
powerful vasodilator. There is also an increase in endothelin production, which
can enhance vasoconstrictor tone. There is compelling evidence that
hypoinsulinemia and hyperglycemia in type 2 diabetes (NIDD) causes endothelial
dysfunction by enhanced oxygen free radical mediated damage and decreased
nitric oxide bioavailability (68).

11
2.3.1.2 Secondary Hypertension
Secondary hypertension have an identified sources, accounts for
approximately 5-10% of all cases of hypertension, with the remaining being
primary hypertension. There are many known conditions that can cause
secondary hypertension (69). Regardless of the cause, arterial pressure
becomes elevated either due to an increase in cardiac output, an increase in
systemic vascular resistance, or both. When cardiac output is elevated, it is
generally due to either increased neurohumoral activation of the heart or
increased blood volume (68).
Causes of secondary hypertension include renal disease, used of certain
medication, including oral corticosteroids, Non steroidal Anti Inflammatory Agents
(NSAIDS). Also endocrine disordered such as pheochromocytoma and
acromegaly (67).
2.3.2 Oxidative stress and mechanism of hypertension
During the last decade, the terms ‘free radicals’, ‘oxidative stress’, and
‘antioxidants’ have become commonly used to discuss the cellular mechanisms
of hypertension (70). A free radical is any molecule that has an odd number of
electrons. Free radicals, which can occur in both organic (i.e., quinones) and
inorganic molecules (i.e., O(2)), are highly reactive(71).
Free radicals are formed from partial reduction of molecular oxygen which
also can generate reactive oxygen species (ROS). ROS are constantly formed in
the human body and removed by endogenous antioxidants which constitute a
primary means of detoxifying ROS and preventing ROS-induced cellular
damage. Most of the ROS formed within cells are highly reactive and they are
able to oxidize most of the biomolecules within the cell, leading to tissue injury.
Overproduction of free radicals is considered as a common feature of a large
broad of diseases and oxidative stress is generally thought to make a significant
contribution to hypertension (72).

12
Recent studies have provided irrefutable evidence that oxidative stress can
cause hypertension and hypertension can cause oxidative stress (71).
In mammalian cells, there are two different SODs. These enzymes are
metallo-proteins and their metal center is essential for their catalytic activity.
Manganese-centered SOD (Mn-SOD) is located in mitochondria, and copper-
zinc-centered SOD (Cu/Zn-SOD) in the cytosol. Hydrogen peroxide is a strong
oxidant which is able to interact slowly with most organic substrates. In presence
of transition metals such as iron or copper, hydrogen peroxide can oxidize
superoxide radical at rapid rates (Fenton reaction) to produce hydroxyl radical
°OH, the most highly reactive oxidant, which, unlike superoxide radical or
hydrogen peroxide, is reactive with most biological substrates (73).
This antioxidant enzyme is responsible for the dismutaion of super oxide
radical-free radical initiator .A fine balance between free radicals and a variety of
endogenous anti oxidant is believed to exist .Any disturbance in this equilibrium
leads to oxidative stress and initiates sub cellular changes leading to heart failure
and hypertension (74).
2.3.3 Association between hypertension and alterations in metabolism of several trace elements
Many studies have suggested the presence of correlation between zinc
and copper metabolism and increase the risk factor of hypertension (75). Inverse
correlations between blood pressures and serum Zn were observed, higher
levels of serum copper were associated with increased risk of hypertension (76).
2.3.3.1 Zinc and hypertension
Zinc deficiency severely impairs endothelial cell function, an effect
reversed by zinc supplementation. Tumor Necrosis Factor (TNF) signals a
cascade of events leading to the synthesis of proteins that regulate oxidative
stress and promote free radicals. Zinc supplementation reversed the activation
by TNF in these cells, zinc inhibited activation of oxidative stress transcription

13
factors and the synthesis of Interleukin 8 and promoted a return to homeostatic
balance (84).
High zinc intake was found to lower LDL and block the absorption of
copper, creating a copper deficiency. Copper deficiency in turn can increase
blood cholesterol and lower HDL, thus increasing the risk of cardiovascular
disease (85).
Arteries are vulnerable to ongoing oxidative stress due to exposure to
oxidizing agents such as drugs and free radicals, including superoxide and lipid
peroxyl radicals. Blood contains an elaborate array of antioxidants, including
ascorbic acid, uric acid and defensive serum proteins to limit this damage.
However, antioxidant defenses are not 100% efficient. Zinc participates in these
defenses by serving as a cofactor for the antioxidant enzyme, superoxide
dismutase (86).
Higher levels of serum copper were associated with increased risk of
hypertension. Inverse correlations between blood pressures and serum Zn were
observed. Furthermore, blood pressure was inversely related to lysyl oxidase
activity. These findings give further support to the hypothesis that an imbalance
of Zn and Cu bioavailability may be associated with hypertensive condition (87).
Another study have detected lower levels of copper and higher levels of
zinc in hypertensive patients (88).
2.3.3.2 Copper and hypertension
Copper can act as both an antioxidant and a pro-oxidant. As an
antioxidant, it scavenges damaging particles in the body known as free radicals.
Free radicals occur naturally in the body and can damage cell walls, interact with
genetic material, and possibly contribute to the aging process as well as the
development of a number of health conditions. Antioxidants can neutralize free
radicals and may reduce or even help to prevent some of the damage caused by
free radicals (77).

14
Because Copper is a cofactor for Cu-Zn SOD and ceruloplasmin, two
important antioxidant enzymes, and the possible antioxidant activity of copper
may be accounted for, at least in part, by its role in these enzymes (78). So any
decrease of copper and zinc leads to decrease the activity of Cu-Zn SOD which
leads to oxidative stress ,that causes hypertension (79).
Copper is an essential element necessary for optimal absorption and
metabolism of iron, normal erythropoiesis and bone collagen formation.
Numerous authors report increased serum copper levels in patients and animals
with arteriosclerosis, hypertension or myocardial infarction. Harman and his
colleagues have also found that experimental animals that have higher intakes of
copper have more arteriosclerosis. They have postulated that individuals prone
to coronary artery disease may be identified by a high serum copper level (57). It
has been hypothesized that an imbalance in zinc and copper metabolism may
play a role in coronary heart disease (80).
Studies in the microcirculation demonstrate that copper is important in
mechanisms of macromolecular leakage, and vascular smooth muscle reactivity.
Nitric oxide (NO)-mediated arteriole vasodilatation is also compromised in
copper-deficient rats. This functional deficit to NO can be reversed by the
addition of Cu-Zn SOD, suggesting that degradation of NO by superoxide anion
occurs during copper deprivation. These observations demonstrate that dietary
copper is necessary for several microvascular control mechanisms affecting
inflammation, microhemostasis and regulation of peripheral blood flow. So any
decrease in the amounts of copper leads to decreased NO concentration which
causes vasoconstriction that leads to hypertension (81).
Dietary copper is known to be essential for the normal functioning of the
cardiovascular system in both humans and experimental animals. The
cardiovascular defects in copper deficiency are often associated with impaired
activity of some of the ~30 copper-dependent enzyme systems in living
organisms. Structurally, weakened heart and blood vessel walls have been
attributed to reduced activity of the copper-dependent enzyme lysyl oxidase(82).

15
The development of hypertension in copper-deficient rats may be the result of
impaired vasoactive functions in the small resistance blood vessels, thus
suggesting a role for copper in microvascular control mechanisms (83).
Copper deficiency prolongs homeostasis, inhibits NO-dependent dilation and
increases mast cell-mediated macromolecular leakage. Thus, dietary copper is
involved in a variety of micro vascular functions involving many different stimuli
and responses. The responses studied involve the endothelial interface between
the blood and tissues, and suggest that the alterations that occur in the presence
of copper deficiency are pathway specific and do not involve any generalized
phenomenon such as a loss of endothelial function (75).

16
Chapter-3
Materials and Methods 3.1 Study design and selection of subjects
The present study included 208 individuals, categorized into 4 groups.
The first group: includes 52 normal subjects considered as apparently healthy
by clinical examination and with no history of any disease such as diabetes or
hypertension. Their age ranged between 40-60 years. Interviews were
performed with a protested and validated questionnaire (Appendix 3) by a
physician who obtained detailed information on family history of hypertension and
diabetes. In all subjects, blood pressures were recorded by the same physician
in the right arm after a 5-minute rest in a sitting position by a single mercury
sphygmomanometer.
The second group: includes 52 patients with type II diabetes. Their age
ranged between 40-60 years. The criteria for the diagnosis of diabetes were
based on World Health Organization. Diabetes mellitus was diagnosed by a
positive glucose tolerance test showing fasting blood glucose >110 mg/dl and
postprandial blood glucose >140 mg/dl, 2 hours after 75 g of oral glucose.
The third group: includes 52 patients with hypertension. Their age ranged
between 40-60 years. The criteria for the diagnosis of risk factors and
hypertension were based on World Health Organization. Hypertension was
diagnosed in presence of blood pressures >140/90 mmHg, patient has risk
factors such as smoker, obese and hypercholesterolemia.
The fourth group: includes 52 diabetic hypertensive patients. Their age range
is from 40-60 years. Patients selection was based on fasting glucose levels was
grater than 110 mg /dL ,and blood pressure greater than 140/90 mmHg, patient
has risk factors such as smoker ,obese and hypercholesterolemia .

17
3.2 Setting
All patients groups consecutively were admitted to UNRWA Zaitoun and Rimal
health centers.
3.3 Ethical considerations
An authorization to carry out this research was obtained from UNRWA (appendix
1), where our samples where collected. The research was also conducted after
obtaining a letter of agreement from the Islamic University of Gaza (appendix 1).
3.4 Materials 3.4.1 Equipment
Instrument Model
Centrifuge Labofuge 200 Heraeus SEPATECH
Atomic absorption spectroscopy Perkin Elmer, A Analyst 100-Germany
Spectrophotometer Unico 1100 RS spectrophotometer
3.4.2 Kits
Kit Company
Glucose kits Linear Chemicals, S.l
Cholesterol kits Human for biochemical and diagnostic test
Triglycerides kits Human for biochemical and diagnostic test
HDL kits Human for biochemical and diagnostic test
3.4.3 Reagent
- Nitric Acid (0.1N ) for serum dilution for measurement of trace elements.
- Concentrated Hydrochloric acid .

18
3.5 Methods
3.5.1 Sample Preparation
Venous blood samples (5ml) were obtained from all patients and controls.
Patients had fasted from 8 p.m to 8 a.m. Specimens were collected at
standardized time to minimize any effect of diurnal variation. Sterile disposable
plastic syringes were used. The sample left to clot and the serum was separated
by centrifugation. The serum was used for determination of copper and zinc by
using atomic absorption spectroscopy; also serum samples were used for
determination of serum glucose, cholesterol, triglycerides and HDL-cholesterol.
3.5.2 Glucose Test
Glucose was measured in the samples using commercially aviable kit (Linear
chemicals,s.l) according to Trinder method .
Reaction Principle
In the reaction, the glucose is oxidized to D-gluconate by the glucose oxidiase
with the formation of hydrogen peroxide. In the presence of peroxidase, a mixture
of phenol and 4-aminoantipyrine is oxidized by hydrogen peroxide to form a red
quinoneimine dye, which is proportional to the concentration of glucose in the
sample.
Content of the kit Buffer
Phosphate buffer 100 mmol/L pH7.5, glucose oxidase greater than
10ku/L, peroxidase greater than b 2 ku/L,
4-aminoantipyrine 0.5mmol/L, phenol 5mmolL Calibrators
The concentration of glucose standard 100mg/dL
Assay Procedure All reagents, samples and controls were brought to room temperature (20-
25°C) before starting the test.

19
Serum samples free of hemolysis were used because any hemolysis will give
false low result because the enzymes released will cause consumption of
glucose .Also catalase liberated from RBCs will compete with peroxidase for
Hydrogen peroxide, giving untrue results
The test was carried out as follows
1- Reagents and samples were brought to room temperature.
2- The monoreagent buffer(1.0 mL) was pipetted in each labeled tube
3- Serum was pipetted (0.01 mL) into sample labeled tube.
4- Standard was pipetted(0.01 mL) into standard labeled tube .
5- Tubes were incubated for exactly 10 minutes at room temperature
6-The absorbance (A) of the samples and the standard was read at 500nm
against the reagent blank by using spectrophotometer.
Glucose levels calculation
The concentration was calculated according to the following formula
A sample/ A standard × C standard=mg/dL
Normal range values
Adult 70-105 mg/dL
Children 60-110 mg/dL
Newborn 40-60 mg/dL
Quality Control
The use of standard to calculate results to obtain accuracy independent of
the system and instrument used. To ensure adequate quality control (QC), each
run included a set of controls.
3.5.3 Cholesterol Test
The cholesterol was determined after enzymatic hydrolysis and oxidation.
The indicator quinoneimine was formed from hydrogen peroxide and 4-
aminophenazone in the presence of phenol and peroxidase. According to
Friedewald method .

20
Reaction Principle
Cholesterol reacts with oxygen to form cholesterol-3-one and hydrogen peroxide
which react with 4-aminophenazone and phenol to form quinoneimine and water.
Content of the kit RGT Enzyme reagent
Phosphate buffer 100 m mole /L
4-aminophenazone 0.3 m mole /L
Phenol 5 m mole /L
Peroxidase > 5 K U / L
Cholesterol esterase >150 U / L
Cholesterl oxidase > 100 U /L
Sodium azide 0 .05 %
Calibrators: The concentration of Cholesterol 200 mg/dL
Assay Procedure It is important to bring all reagents, samples and controls to room temperature
(20-25°C) before starting the test
The test was carried out as follows
1- Reagents and samples were brought to room temperature.
2- Cholesterol reagent (1.0 mL) was pipetted in each labeled tubes
3- Serum(0.01mL) was pipetted into sample labeled tube.
4- Standard (0.01mL) was pipetted into standard labeled tube .
5-Tubes were incubated for exactly 10 minutes at room temperature
6-The absorbance (A) of the samples and the standard was read at 500 nm
against the reagent blank by using spectrophotometer.
Cholesterol Levels Calculation The concentration was calculated using the following formula
A sample/ A standard × C standard (200) =mg/dL
Quality Control
The use of standard to calculate results to obtain accuracy independent of the
system and instrument used. To ensure adequate quality control (QC), each run
included a set of controls.
21
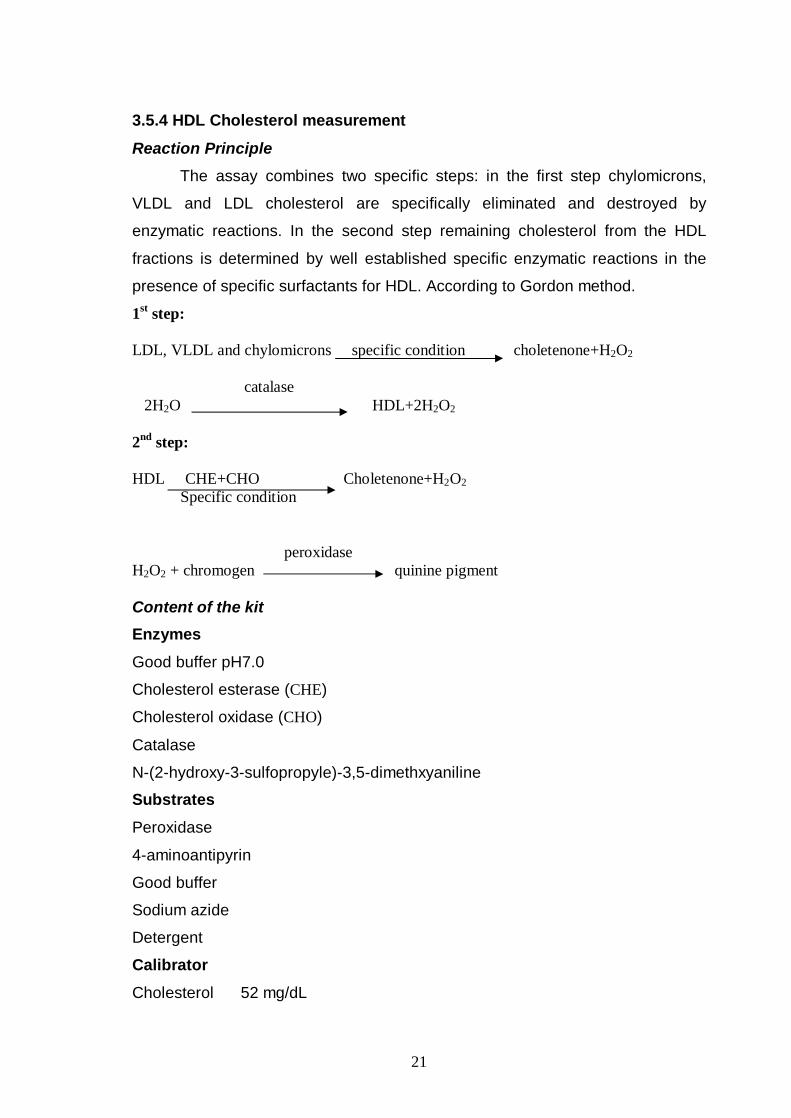
3.5.4 HDL Cholesterol measurement
Reaction Principle The assay combines two specific steps: in the first step chylomicrons,
VLDL and LDL cholesterol are specifically eliminated and destroyed by
enzymatic reactions. In the second step remaining cholesterol from the HDL
fractions is determined by well established specific enzymatic reactions in the
presence of specific surfactants for HDL. According to Gordon method.
1st step: LDL, VLDL and chylomicrons specific condition choletenone+H2O2 catalase 2H2O HDL+2H2O2 2nd step: HDL CHE+CHO Choletenone+H2O2 Specific condition peroxidase H2O2 + chromogen quinine pigment Content of the kit Enzymes
Good buffer pH7.0
Cholesterol esterase (CHE)
Cholesterol oxidase (CHO)
Catalase
N-(2-hydroxy-3-sulfopropyle)-3,5-dimethxyaniline
Substrates
Peroxidase
4-aminoantipyrin
Good buffer
Sodium azide
Detergent
Calibrator
Cholesterol 52 mg/dL

22
Assay Procedure
1- We brought reagents and the cuvette to 37°C.
2- Enzyme reagent (0.75 mL) was pipetted in each labeled tube .
3- Serum (0.01 mL) was pipetted in sample tube .
4- Standard (0.01 mL) was pipetted in standard tube .
5-The tubes were mixed gently and incubated for 5 minutes at 37° C .
6-After 5 minutes we added 0.25 mL of substrate and incubate it for 5 minutes at
37° C.
7- After incubation we read the absorbance of calibrator and samples against
reagent blank at 578 nm by using spectrophotometer.
HDL levels calculation The concentration was measured using the following formula
A sample /A standard × C standard (52mg/dL) = mg/dL
Normal range values 35-60 mg/dL
Quality Control All human serum based control sera with HDL values determined by this method
can be employed.
3.5.5 Triglycerides Test
Reaction Principle The test used is an enzymatic colorimetric test for triglyceride with Lipid Clearing
Factor (LCF). Triglycerides determination depends on the hydrolysis by lipase .
The indicator quinoneimine is formed from hydrogen peroxide, 4-aminoantipirina
and 4-chlorophenol. According to Szasz method .
Triglycerides lipase glycerol+ fatty acid Glycerol+ ATP GK Glycerol-3-phosphate+ADP Glycerol-3-phosphate + O2 GPO dihydroxyaceton phosphate + H2O2 H2O2 + 4-aminoantipirina POD quinoneimine + HCL+2H2O2 + 4-chlorophenol

23
Content of the kit
Tampon pipes pH 7.5 50 m mole /L
4-chlorophenol 5 m mole /L
4-aminoantipirina 0.25 m mole /L
Magnesium 4.5 m mole /L
ATP 2 m mole /L
Lipase ≥ 1.3 U /m L
Peroxidase (POD) ≥0.5 U / m L
Glycerol kinase (GK) ≥ 0.4 U / m L
Glycerol-3-phosphate oxidase (GPO) ≥ 1.5 U/mL
Standard
Triglycerides 200 mg/dL
3.9.3 Assay Procedure 1-Reagents and samples were brought to room temperature.
2- Triglyceride reagent (1.0 mL) was pipetted in each labeled tube.
3- Serum (0.01mL) was pipetted into sample labeled tube.
4-Standard (0.01mL) was pipetted into standard labeled tube.
5-Tubes were incubated for exactly 10 minutes at room temperature.
6-The absorbance (A) of the samples and the standard was read at 546 nm
against the reagent blank by using spectrophotometer.
Triglycerides levels calculation The concentration was calculated according to the following formula
A sample / A standard × C standard (200) =mg/dL
Quality Control The use of standard to calculate results to obtain accuracy independent of the
system and instrument used. To ensure adequate quality control (QC), each run
should include a set of controls
3.5.6 LDL levels calculation
The concentration was calculated according to the following formula
Cholesterol -Triglycerides/5 - HDL=mg/dL

24
3.5.7 Trace Elements Analysis by Atomic Absorption
To measure the serum levels for trace elements, serum samples were
thawed and directly diluted for the determination of the trace elements. For zinc
and copper, serum samples were diluted 50 times in 0.1N nitric acid. Levels
were determined by an atomic absorption spectrophotometry (Perkin Elmer, A
Analyst 100-Germany).
Atomic absorption spectrophotometry (AAS)
Atomic absorption spectrophotometry is commonly used in many
analytical laboratories for determination of trace elements in serum sample,
water samples and in acid digests of sediment or biological tissues. Zinc and
copper, were measured in serum samples.
Principle
While a sample is being aspirated into a flame, a light-beam is directed
through the flame into a monochromator and onto a detector that measures the
amount of light absorbed by the atomized element in the flame. A source lamp
composed of the element of interest is used because each element has its own
characteristic wavelength. This makes the method relatively free from spectral or
radiation interferences. The amount of energy at the characteristic wavelength
absorbed in the flame is proportional to the concentration of the element in the
sample over a limited concentration range. Most atomic absorption instruments
are also equipped for operation in an emission mode.
Reagents
Metal-free water was essentially used for the preparation of all reagents.
Hydrochloric acid and nitric acid, HNO3 , (analytical grade) was used for standard
preparation and for digestion methods.
Preparation of standards
Standard solutions of known metal concentrations were prepared in water
with a matrix similar to the tested samples. Standards were bracket the expected
sample concentration and fall within the method’s working range. Very dilute
standards having concentrations of at least 0.05 mg L-1 were prepared daily from
fresh standard stock solutions. If sample digestion is used, standards should be

25
carried through the same digestion procedures. The standard stock solutions
described below have a concentration of 1000 mg L-1 .
Zinc: 1.000 g zinc metal was dissolved in 20 ml 1:1 HCl and diluted up to 1,000
ml with water.
Copper: 0.100 g copper metal was dissolved in 2 ml concentrated HNO3, then10
ml of concentrated HNO3 was added and the solution mixture was diluted up to
1,000 ml with water.
Procedure
It is not possible to provide an operating procedure that would be correct
for all atomic absorption spectrophotometers because of differences between
models of instrument. The manufacturer’s operating manual should be followed.
A general procedure contains three components as described below.
Adjustment of the Instrument:
1. A hollow cathode lamp for the desired element was installed in the instrument
and the wavelength dial was set to the appropriate setting for the element.
2. The slit width was set according to the manufacturers suggested value for the
element being measured.
3. The instrument then turned on and the lamp current was adjusted to the level
suggested by the manufacturer.
4. The instrument then warmed up, 10 - 20 minutes, and current readjusted as
necessary.
5. The wavelength dial was adjusted until optimum energy gain is obtained.
6. The lamp was aligned in accordance with the directions in the operating
manual.
7. The suitable burner head was installed and its position was adjusted.
8. The air was then turned on and its flow was adjusted to the rate recommended
to give maximum sensitivity for the metal being measured.
9. Acetylene then turned on and its flow was adjusted to recommended rate, then
ignited and the flame was allowed a few minutes to stabilize.

26
10. A blank of deionized water that has been given the same treatment and acid
concentration as the standards and samples was aspirated and the reading
adjusted to zero.
11. A Standard solution was aspirated and the aspiration rate was adjusted to
obtain maximum sensitivity.
12. The burner was adjusted horizontally and vertically to obtain maximum
response.
Preparation of the calibration curve
1. At least five concentrations of each metal ion standard solutions were selected
to perform a calibration curve. There should be one concentration greater and
one less than that expected in the sample(s).
2. A blank was aspirated and adjusted to the zero value.
3. Each standard was aspirated in turn into the flame and the absorbance was
recorded.
4. A calibration curve was performed by plotting the absorbance of the standards
against their concentrations. This step is not necessary for instruments with
direct concentration readout.
Analysis of samples
1. The nebulizer was rinsed by aspirating with water containing 1.5 ml HNO3 per
liter. The blank was atomized and set to the zero value.
2. Samples were atomized and there absorbance were determined.
2. Lamps were changed and the procedure repeated for each element.
Calculations
Determination appropriate of the concentration of each metal ion, were
based on the calibration curves. Results for trace elements were calculated in
µg L-1 while, in mg L-1 for the more common metals. Concentrations may be read
directly from instruments with a direct readout capability. If a sample has been
diluted, appropriate dilution factor were applied. The recommended wavelengths
for the metal ions determined are given in the following table:
Metal Selected wavelength
Zinc 213.8 nm
Copper 324.8 nm

27
3.6 Statistical Analysis
All experimental data were expressed in mean and standard deviation and
data obtained in the study and control group were compared by two – tailed t-test
for unpaired data. Trace elements in the study group as a whole analyzed by
means of SPSS (Statistical Package for Social Science) version 8 for windows
software package for multiple comparisons and Pearson's coefficient (r)
calculated to determine associations between these parameters.
P (probability) < 0.05 was considered significant.
28
Chapter-4 Results
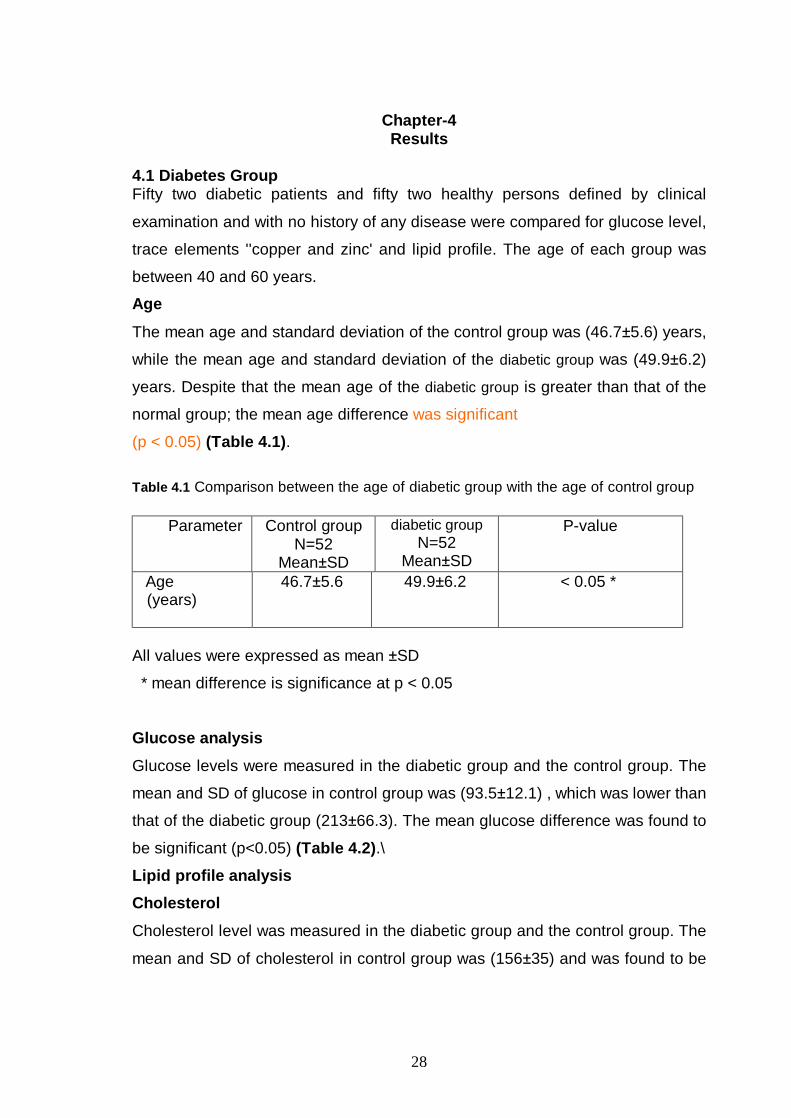
4.1 Diabetes Group Fifty two diabetic patients and fifty two healthy persons defined by clinical
examination and with no history of any disease were compared for glucose level,
trace elements ''copper and zinc' and lipid profile. The age of each group was
between 40 and 60 years.
Age
The mean age and standard deviation of the control group was (46.7±5.6) years,
while the mean age and standard deviation of the diabetic group was (49.9±6.2)
years. Despite that the mean age of the diabetic group is greater than that of the
normal group; the mean age difference was significant
(p < 0.05) (Table 4.1).
Table 4.1 Comparison between the age of diabetic group with the age of control group
All values were expressed as mean ±SD
* mean difference is significance at p < 0.05
Glucose analysis
Glucose levels were measured in the diabetic group and the control group. The
mean and SD of glucose in control group was (93.5±12.1) , which was lower than
that of the diabetic group (213±66.3). The mean glucose difference was found to
be significant (p<0.05) (Table 4.2).\ Lipid profile analysis Cholesterol
Cholesterol level was measured in the diabetic group and the control group. The
mean and SD of cholesterol in control group was (156±35) and was found to be
P-value diabetic group N=52
Mean±SD
Control group N=52
Mean±SD
Parameter
< 0.05 *
49.9±6.2
46.7±5.6
Age (years)

29
lower than that of the diabetic group (170±33.3) however the mean cholesterol
difference was significant (p < 0.05) ( Table 4.2). Triglycerides
Triglyceride levels were measured in the diabetic group and the control group.
The mean and SD of triglyceride in control group was (151±29.1) which was
lower than that of the diabetic group (161±23.3). The mean triglycerides
difference was significant (p<0.05) (Table 4.2) High Density Lipoprotein (HDL)
HDL level was measured in the diabetic study group and the control group. The
mean and SD of HDL in control group was (50.6±11.9) which was higher than
that of the diabetic group (42.41±8.25). The mean HDL difference was significant
(p<0.05) (Table 4.2). Low Density Lipoprotein LDL
LDL was measured in the diabetic group and the control group. The mean and
SD of LDL in normal group was (73.6±36.2) which was lower than that of the
diabetic group (95.3±36.3). The mean LDL difference was significant (p <0.05)
(Table 4.2). Table 4.2 Comparison between glucose and lipid profile of diabetic group with control group
All values were expressed as mean ±SD
* mean difference is significance at p < 0.05
P-value diabetic group N=52 Mean±SD
Control group N=52 Mean±SD
Parameter (mg/dl)
<0.05*
<0.05 *
<0.05*
<0.05 *
<0.05*
213±66.3
170±33.3
161±23.3
42.41±8.3
95.3±36.3
93.5±12.1
156±35
151±29.1
50.6±11.9
73.6±36.2
glucose Cholesterol
Triglycerides
HDL
LDL

30
Trace Eléments
Serum levels of the trace elements, copper and zinc, were measured in the
control group and diabetic group. Copper (Cu) mean concentration was
significantly higher than control group (P < 0.01), also zinc (Zn) mean
concentration was significantly higher than control group (P < 0.01)( Table 4.3). Table 4.3 Comparison between serum trace elements of diabetic group with control group
P-value N=52 diabetic
group Mean±SD
Control group N=52
Mean±SD
Parameter
<0.01**
<0.01**
68.8±37.9
28.3±15.2
45.3±18.1
21.8±6.6
Copper (µg/L)
Zinc (Mg/L)
All values were expressed as mean±SD
** Highly significance at P<0.01
Corrélation ِِAnalysis
Correlation analysis in the diabetic group was done between trace elements,
glucose and lipid profile. Copper Correlation
As shown in table 4.4, in diabetic group there was no correlation between copper
and cholesterol or HDL (p > 0.05), however a strong positive correlation exists with
glucose level (P < 0.001) (Figure 4.1) and triglycerides (P<0.05) (Figure 4.2), while there is a weak inverse correlation found with LDL (p < 0.05) (Figure 4.3). Copper correlates well with zinc (p<0.001) (Figure 4.4).

31
Table 4.4 Correlation between copper levels and glucose, lipid profile and zinc in diabetic
group .
Significance (2-tailed)
P value Pearson correlation
Diabetic group
>0.05 NS
<0.001**
>0.05 NS
<0.05*
>0.05 NS
<0.05*
<0.001**
0.339
0.001
0.069
0.014
0.782
0.038
0.000
0.135
0.435**
0.254-
0.339*
0.039
-0.289*
0.657**
Age year
Glucose( mg/dl)
Cholesterol( mg/dl)
Triglycerides( mg/dl)
HDL (mg/dl)
LDL( mg/dl)
Zinc ( mg/L)
Correlation is highly significant at P<0.001 level**
* Correlation is significant at P<0.05 level
copper diabetic
2001000-100
diab
etic
glu
cose
mg/
dl
400
300
200
100
Figure 4.1 Correlation between copper levels and glucose levels in diabetic

32
copper diabetic
2001000-100
trigl
ycer
ides
dia
betic
220
200
180
160
140
120
100
Figure 4.2 Correlation between copper levels and triglyceride levels in diabetics
copper diabetic
2001000-100
ldl d
iabe
tic
200
100
0
Figure 4.3 Correlation between copper levels and LDL levels in diabetics

33
Zinc Correlation
As shown in table 4.5 in diabetic group there was no correlation between zinc
and glucose, triglycerides and HDL of diabetic group (p > 0.05), while there was
an inverse correlation was found with cholesterol (P<0.01) (Fig 4.5 ) and LDL
(P<0.01) (Fig 4.6). There exists also good correlation with copper (p <0.001) (Fig
4.4) . Table 4.5 Correlation between zinc in diabetic group with age, glucose lipid profile and
copper .
Significance (2-tailed)
P value Pearson correlation
Diabetic group
>0.05 NS
>0.05 NS
<0.01
>0.05 NS
>0.05 NS
<0.01*
<0.001**
0.414
0.529
0.001
0.114
0.860
0.001
0.000
0.116
0.089
0.432**-
0.222
0.025
-0.443**
0.657**
Age (year)
Glucose (mg/dl)
Cholesterol (mg/dl)
Triglycerides( mg/dl)
HDL(mg/dl)
LDL( mg/dl)
Copper(µg/L)
copper diabetic
2001000-100
zinc
dia
betic
70
60
50
40
30
20
10
0
Figure 4.4 Correlation between zinc and copper in diabetic group

34
zinc diabetic
706050403020100
chol
este
rol d
iabe
tic
300
200
100
0
Figure 4.5 Correlation between zinc and cholesterol in diabetic group
zinc diabetic
706050403020100
ldl d
iabe
tic
200
100
0
Figure 4.6 Correlation between zinc and LDL in diabetic group

35
4.2 Hypertensive Group
Fifty two hypertension patients and fifty two healthy persons defined by clinical
examination and with no history of any disease were compared by glucose level,
trace elements ''copper, zinc' 'and lipid profile. The age of each group was
between 40 and 60 years.
Age
The mean age and standard deviation of the control group was (46.7±5.6) years,
and the mean age and standard deviation of the hypertensive group was
(49.9±6.2) years. However the mean age difference was significant (p < 0.05)
(Table 4.6).
Table 4.6 Comparison between the ages of hypertensive group with the age of control
group
All values were expressed as mean±SD * mean difference is significance at p < 0.05
Glucose Analysis
Glucose levels were measured in the hypertensive group and the control
group. The mean and SD of glucose in normal group was (93.5±12.1) which was
lower than hypertensive group (99.5±21.1). The mean glucose difference was not
significant (p > 0.05) (Table4.7). Lipid profile analysis Cholesterol
Cholesterol levels were measured in the hypertensive group and the control
group. The mean and SD of cholesterol in normal group was (156±35) which was
lower than hypertensive group (183±36.6). The mean cholesterol difference was
significant (p < 0.05) (Table 4.7).
P-value hypertensive group N=52 Mean±SD
Control group N=52
Mean±SD
Parameter
< 0.05 *
49.9±6.2
46.7±5.6
Age (years)

36
Triglycerides
Triglyceride levels were measured in the hypertensive group and the control
group. The mean and SD of triglyceride in normal group was (151±29.1) which
was lower than hypertensive group (167±58.2). The mean triglycerides difference
was not significant (p>0.05) (Table 4.7).
High Density Lipoprotein HDL
HDL level were measured in the hypertensive group and the control group. The
mean and SD of HDL in normal group was (50.6±11.9) which was higher than
hypertensive group (45.6±9.2). The mean HDL difference was significant
(p>0.05) (Table 4.7). Low Density Lipoprotein LDL
LDL level was measured in the hypertensive group and the control group. The
mean and SD of LDL in normal group was (73.6±36.2) which was lower than
study group (103±35.5). The mean LDL difference was significant (p < 0.05)
(Table 4.7) Table 4.7 Comparison between glucose and lipid profile of hypertensive group with
control group
All values were expressed as mean±S
* mean difference is significance at p < 0.05
P-value
hypertensive group N=52
Mean±SD
Control group N=52
Mean±SD
Parameter (mg/dl)
>0.05 NS
<0.05*
>0.05 NS
<0.05*
<0.05*
99.5±21.1
183±36.6
167±58.2
45.6±9.2
103±35.5
93.5±12.1
156±35
151±29.1
50.6±11.9
73.6±36.2
Glucose
Cholesterol
Triglycerides
HDL
LDL

37
Trace elements
Trace elements (copper and zinc) were measured in the serum of control group
and hypertensive group .The mean levels of copper and zinc in hypertensive
group was greater than normal group as shown in the table 4.8. Copper (Cu)
mean concentration was higher than control group and not significant, (P > 0.05).
Zinc (Zn) mean concentration was higher than control group and significant
(P< 0.05) .
Table 4.8 Comparison between serum trace elements of hypertensive group with control
group
P-value hypertensive group
N=52 Mean±SD
Control group N=52
Mean±SD
Parameter
> 0.05 NS
< 0.05 *
52.4±23.5
25.3±8.3
45.3±18.1
21.8±6.6
Copper(µg/L)
Zinc(mg/L)
All values were expressed as mean±SD NS (non significant) P > 0.05. * mean difference is significance at p < 0.05
Correlation Analysis Correlation analysis of hypertensive group done between trace elements, age,
glucose and lipid profile.
Copper Correlation As shown in Table 4.9 there was no correlation between copper in hypertensive
group and glucose level, cholesterol ,triglycerides ,HDL in hypertensive group ,
also no correlation found with LDL(p>0.05).There was no correlation with zinc(p
>0.05)

38
Table 4.9 Correlation between copper in hypertensive group with glucose , lipid profile
and zinc.
Significance (2-tailed)
P value Pearson correlation
hypertensive group
>0.05 NS
>0.05 NS
>0.05 NS
>0.05 NS
>0.05 NS
>0.05 NS
>0.05 NS
0.977
0.144
0.944
0.447
0.167
0.581
0.398
-0.004
0.207
0.010-
-0109
-0.196
0.079
0.121
Age (year)
Glucose( mg/dl)
Cholesterol( mg/dl)
Triglycerides (mg/dl)
HDL (mg/dl)
LDL (mg/dl)
Zinc(mg/L)
NS (non signifiant) P > 0.05. Zinc Correlation
As shown in table 4.10 there were no correlation between zinc in hypertensive group
and glucose level (P>0.05), no relation found with cholesterol (P <0.05), no relation
with triglycerides (P> 0.05),no relation with HDL, also no correlation found with
LDL(p>0.05). There was no correlation with copper (p >0.05) (Table 4.10). Table 4.10 Correlation between zinc in hypertensive group with age, glucose and lipid
profile and zinc. Significance
(2-tailed) P value Pearson
correlation Parameter
>.0.05 NS
>0.05 NS
>0.05 NS
>0.05 NS
>0.05 NS
>0.05 NS
>0.05 NS
0.260
0.424
0.773
0.893
0.280
0.952
0.398
0.162
0.114
0.041-
0.019
0.154-
-0.009
0.121
Age( year)
Glucose (mg/dl)
Cholesterol (mg/dl)
Triglycerides (mg/dl)
HDL( mg/dl)
LDL (mg/dl)
Copper(µg/L)

39
4.3 Diabetic Hypertensive Group Fifty two diabetic hypertensive patients and fifty two healthy people defined by
clinical examination and with no history of any disease were compared by
glucose level, trace elements (copper, zinc) and lipid profile .The age of each
group between 40 and 60 years.
Age
The mean age and standard deviation of the control group was (46.7±5.7) years.
The mean age and standard deviation of the diabetic hypertensive group
(52.6±6.3) years .The mean age of study group was higher than normal group,
the mean age difference was significant (p <0.05) (Table 4.11).
Table 4.11 Comparison between the age of diabetic hypertensive group with the age of
control group
All values were expressed as mean±
* mean difference is significance at p < 0.05
Glucose analysis
Glucose level was measured in the diabetic hypertensive group and the control
group. The mean and SD of glucose in control group was (93.5±12.1), which was
lower than study group (213±87.4). The mean glucose difference was found to
be significant (p<.05) (Table 4.12). Lipid profile analysis
Cholesterol
Cholesterol level was measured in the diabetic hypertensive group and the
control group .The mean and SD of cholesterol in control group (156±35) was
found to be lower than diabetic hypertensive group (225±75.5) and the mean
cholesterol difference was significant (p < 0.05) ( Table 4.12).
P-value diabetic hypertensive group
N=52 Mean±SD
Control group N=52
Mean±SD
Parameter
<0.05 *
52.6±6.3
46.7±5.6
Age (years)
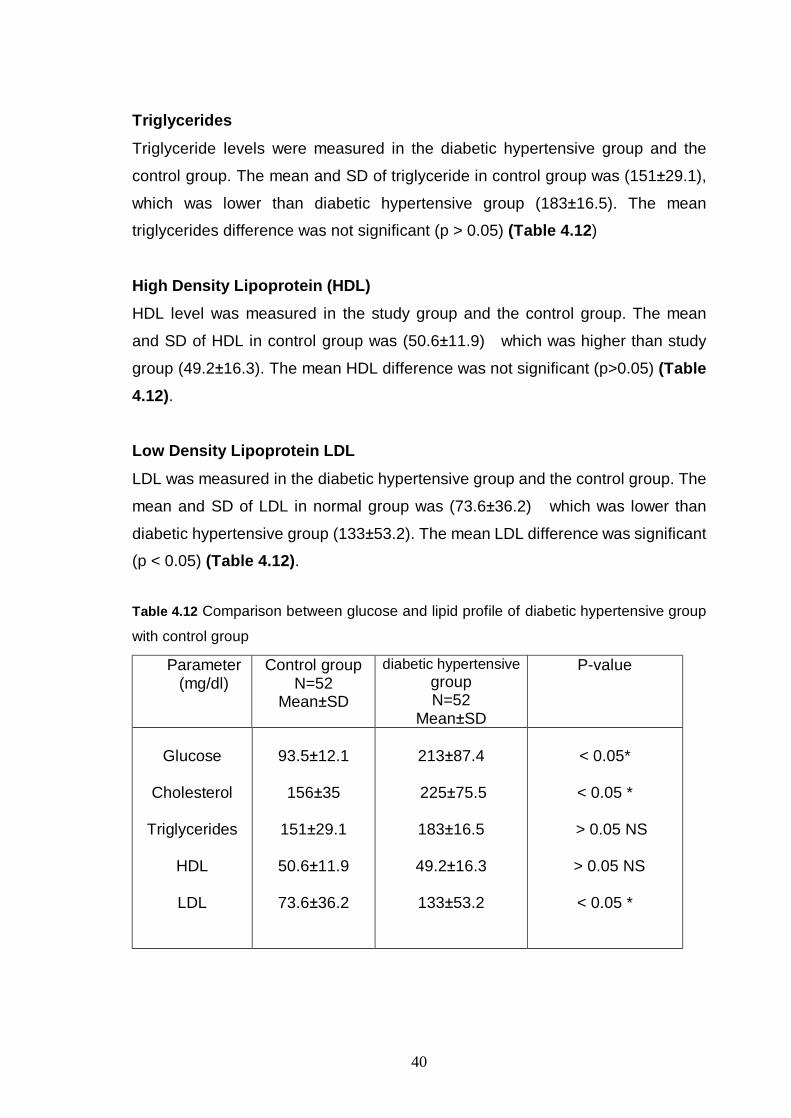
40
Triglycerides
Triglyceride levels were measured in the diabetic hypertensive group and the
control group. The mean and SD of triglyceride in control group was (151±29.1),
which was lower than diabetic hypertensive group (183±16.5). The mean
triglycerides difference was not significant (p > 0.05) (Table 4.12)
High Density Lipoprotein (HDL)
HDL level was measured in the study group and the control group. The mean
and SD of HDL in control group was (50.6±11.9) which was higher than study
group (49.2±16.3). The mean HDL difference was not significant (p>0.05) (Table 4.12).
Low Density Lipoprotein LDL
LDL was measured in the diabetic hypertensive group and the control group. The
mean and SD of LDL in normal group was (73.6±36.2) which was lower than
diabetic hypertensive group (133±53.2). The mean LDL difference was significant
(p < 0.05) (Table 4.12).
Table 4.12 Comparison between glucose and lipid profile of diabetic hypertensive group
with control group
P-value diabetic hypertensive group N=52
Mean±SD
Control group N=52
Mean±SD
Parameter (mg/dl)
< 0.05*
< 0.05 *
> 0.05 NS
> 0.05 NS
< 0.05 *
213±87.4
225±75.5
183±16.5
49.2±16.3
133±53.2
93.5±12.1
156±35
151±29.1
50.6±11.9
73.6±36.2
Glucose
Cholesterol
Triglycerides
HDL
LDL

41
Trace Elements
Serum levels of the trace elements, copper and zinc, were measured in the
control group and diabetic hypertensive group. Copper (Cu) mean concentration
was significantly higher than control group (P < 0.05) but zinc (Zn) mean
concentration was higher than control group. The mean Zn difference was not
significant (P > 0.05) (Table 4.13) (Figure 4.7).
Table 4.13 Comparison between serum trace elements of diabetic hypertensive group
with control group
P-value
diabetic hypertensivegroup
N=52 Mean±SD
Control group N=52
Mean±SD
Parameter
< 0.05*
>0.05 NS
61.1 ±28.6
23.4±10.0
45.3±18.1
21.8±6.64
Copper (µg/L)
Zinc
(mg/L)
All values were expressed as mean±SD
mean difference is significance at p < 0.05
NS (non signifiant) P > 0.05
Correlation Analysis
Correlation analysis of study group was done between trace elements, age, and
glucose and lipid profile.
Copper Correlation As shown in Table 4.14. In diabetic hypertensive group there was no correlation
between copper, glucose level, cholesterol, triglycerides and LDL (P > 0.05), but
presence of positive correlation with HDL (p<0.05) (Figure 4.8). Copper also
correlates well with zinc (p<0.05) (Figure 4.7).

42
Table 4.14 Correlation between copper in diabetic hypertensive with age, glucose, lipid
profile and zinc.
Significance (2-tailed)
P value Pearson correlation
Diabetic hypertensive group
>0.05 NS
>0.05 NS
>0.05 NS
>0.05 NS
<0.05 *
>0.05 NS
< 0.05 *
0.871
0.274
0.083
0.678
0.048
0.507
0.021
-0.023
0.154
0.243
-0.059
0.278*
-0.094
0.320*
Age ( year)
Glucose( mg/dl)
Cholesterol (mg/dl)
Triglycerides (mg/dl)
HDL (mg/dl)
LDL (mg/dl)
Zinc(mg/L)
copper hyper+diabetics
180160140120100806040200
zinc
hyp
er+d
iabe
tics
80
70
60
50
40
30
20
10
0
Figure 4.7 Correlation between zinc and copper in diabetic hypertensive group

43
copper hyper+diabetics
180160140120100806040200
HDL
hype
r+di
abet
ics
140
120
100
80
60
40
20
Figure 4.8 Correlation between copper and HDL in diabetic hypertensive group

44
Zinc Correlation
As shown in Table 4.15 In diabetic hypertensive group there was no correlation
between zinc and glucose of diabetic hypertensive group level, triglycerides ,HDL
and LDL, while there was positive correlation with cholesterol (P < 0.05) (Figure 4.9) . Also good correlation with copper (p < 0.05) was existed (Figure 4.7). Table 4.15 Comparison between zinc in diabetic hypertensive with age, glucose, lipid
profile and zinc.
Significance (2-tailed)
P value Pearson correlation
diabetic hypertensive group
>.05 NS
>0.05 NS
<0.01**
>0.05 NS
>.05 NS
Other >0.05 NS
<0.05*
0.574
0.377
0.007
0.431
0.200
0.719
0.021
-0.080
0.125
0.368**
0.111
0.181
-0.051
0.320*
Age (year)
Glucose (mg/dl)
Cholesterol (mg/dl)
Triglycerides (mg/dl)
HDL(mg/dl)
LDL (mg/dl)
Copper(µg/L)
All values were expressed as mean ±SD
NS (non significant) P>0.05.
**Correlation is good significant at P<0.01 level
• Correlation is significant at P<0.05 level

45
• hyper+diabetic cholesterol
600500400300200100
zinc
hyp
er+d
iabe
tics
80
70
60
50
40
30
20
10
0
Figure 4.9 Correlation between zinc and cholesterol in diabetic hypertensive group

46
Chapter-5 Discussion
In recent years, chronic diseases such as diabetes and hypertension have
been shown to be a major cause of death worldwide (1). The prevalence of these
diseases in developed countries has reached immense proportions which
represent a major problem. Both diabetes and hypertension are considered multi-
factorial and the physiological role of copper and zinc has been implicated in both
diabetes and hypertension (89,76).
The present study was designed to evaluate serum Cu and Zn in type II
diabetes, hypertension and diabetic hypertensive patients. Also correlations have
been made between the serum levels of copper and zinc in these groups and
serum cholesterol, triglycerides, HDL, LDL and glucose levels.
5.1 Copper in diabetic patients
The results have shown that copper levels are increased in diabetic
patients. The increased level of copper in the diabetic patients agrees with other
studies (52, 89,90).
The increase in glucose levels in diabetics (Hyperglycemia) was
suggested to enhance oxidative stress in cells and tissues. This is thought to
occur either by loss of anti-oxidant mechanisms or due to an increase in the
oxidants (such as free radicals) (60).
Oxidative stress is thought to impair the function of islet and could lead to
insulin resistance and vascular diseases (40,41,42). High levels of glucose in
diabetic patients could lead to increased levels of oxidative stress and cell
damage(44). Therefore oxidative stress increases the need for antioxidant co-
factors such as vitamins. The control of blood glucose and reduction of
hyperglycemia, therefore reduce the levels of oxidative stress and improve the

47
function of beta cells, vascular endothelial cells, fat and muscle cells, and
platelets (34,35).
The increase in the Cu ion levels in patients with DM might be attributed to
hyperglycemia that may stimulate glycation which result in the formation of
hydrogen peroxide. The formation of hydrogen peroxide could cause the
oxidation of the superoxide radical at higher rates to produce hydroxide radical.
This free radical is the most highly reactive oxidant, leading to tissue damage
(74).
The increase of hydrogen peroxide could also lead to decreased activity of
Cu-Zn SOD, and release of copper ions, therefore acceleration also of oxidative
stress. The SOD activity has not been studied in our research, however the SOD
activity has been found to consistently increase in diabetic patients (61).
5.1.1 Relation between copper and lipid profile in diabetics
Our results have shown that the levels of cholesterol, triglycerides and
LDL in diabetics are increased, while the levels of HDL decreased. These results
are typical diagnostic findings of type II diabetics (91). Copper also has been
reported to have insulin-like activity and promotes lipogenesis (86).
The results agreed with other studies that have shown total cholesterol
and triglyceride levels were moderately elevated and serum (HDL-Ch) levels
where lower than normal person and (LDL-Ch) were increased (92).
The increased cholesterol levels may be attributed partly to alternations in
the genetic characters; also high intakes of total fat have increased serum
cholesterol. Since most of cholesterol in the plasma is carried by LDL, an
increase in LDL level directly may lead to an increase in total cholesterol (93).
The increase of LDL seems to be atherogenic and may occur in the
absence of hyperlipidemia. In addition, a portion of the plasma LDL undergoes
glycosylation, which may increase susceptibility to oxidative stress (91).

48
Part of the correlations made in our study has focused on the relation
between the levels of trace elements (Cu and Zn) with the glucose and lipid
profile in the diabetics.
We have found a positive correlation between Cu and triglycerides and a
weak negative correlation with LDL; however no correlation exists with
cholesterol and HDL levels. This contradicts other finding which has shown
positive correlation between the levels of LDL and copper levels in diabetics (92).
This positive correlation has been attributed to the lipid peroxidation in the
presence of high levels of copper which results in the increase in the LDL and
triglycerides and decrease in the HDL (94) . Despite the finding in our study that
both copper and LDL are increased in diabetics, the presence of a negative
correlation between LDL and copper levels seems to be almost insignificant as p
value is 0.038.
The absence of any correlation between copper and LDL explains the
absence of any correlation with cholesterol.
In the present study strong correlation between glucose and Cu in
diabetes patient (p<0.001). Because glucose levels rise with the poor control of
diabetes mellitus, and increase levels of Cu supports the view that Cu is an
important marker for oxidative stress (7,93).
5.2 Zinc levels in diabetics
Zinc levels in diabetics in our study seem to be higher than control group.
It is worth mentioning that despite the finding in many studies that zinc is
decreased (57), also our result agree with other studies that shown increased Zn
in diabetes mellitus (94,95 ,96).
The increase in zinc levels in diabetics could be explained by the finding
that oxidative stress in diabetics could lead to destruction of ß-cells, therefore to

49
the release of high amounts of zinc from the cells into blood stream, therefore
increase in zinc levels in serum occurs (7, 57), the increase of plasma zinc can
also reflect a deficient storage or a chronic hyper secretion of insulin in
hyperglycemic patients (96).
Despite the increase in the zinc levels in diabetics, there was no
correlation between Zn and glucose. The absence of any correlations between
zinc and glucose is not restricted to studies which show an increase in the levels
of glucose (94), but also in studies which have shown a decrease in the levels of
glucose (37).
5.2.1 Zinc and lipid profile in diabetics
Correlations made between zinc and lipid profile in diabetics, indicated the
existence of a strong negative correlation between Zn and cholesterol and LDL
(p<0.01). Despite the absence of correlations made between zinc and lipid profile
in diabetics in some studies (94), in one study which have investigated the
correlation between zinc and lipid profile in acute myocardial infarction patients,
it was found that zinc correlates well with LDL and cholesterol (92).
Our results demonstrate the importance of correlation studies rather than
mean values to investigate the significance of trace elements in diabetes and
other diseases. The negative correlation between zinc and both cholesterol, and
LDL signifies the importance of zinc in oxidative stress in cases of diabetes. Zinc
is thought here to improve the antioxidant activities and therefore to reduce LDL
and cholesterol levels .
Therefore serum levels of zinc in diabetes are not of any value to evaluate
the oxidative stress in diabetics.
Despite the findings that copper and zinc antagonize each other, intestinal
absorption in diabetics it was found that Cu and Zn are correlated well with each

50
other. This implies that the physiological control of the levels of these elements
is not only occurs in the intestine (94).
5.3 Hypertension 5.3.1 Cu and Zn in hypertensive patients
Our results have shown that hypertensive patients have higher levels of
Cu and Zn than control group .The results are compatible with other results that
shown no significant difference between hypertensive and normotensives in the
mean levels of Zn and Cu as well as in Zn- or Cu-dependent enzymes, though
higher levels of serum copper were associated with increased risk of
hypertension (87). Inverse correlations between blood pressures and serum Zn
were observed. These findings give further support to the hypothesis that an
imbalance of Zn and Cu bioavailability may be associated to hypertensive
condition (91).
Our results therefore confirm the important of the trace elements I.e. Cu
and Zn and the etiology and prognosis of hypertension. Despite the great
evidence which supports this work, in many studies which have found that
essential hypertension patients had higher Zn concentrations (P < 0.001) and
Cu concentrations (P < 0.005) (97,98).
Copper deficiency depresses Cu-Zn SOD activity and prostacyclin
synthesis in the aorta (92), as well as increases the susceptibility of lipoproteins
and heart tissue to peroxidation, providing strong evidence that copper plays a
vital role in the protection of the cardiovascular system from free -radical
mediated damage and disease (99). Thus, it appears clear that adequate copper
is vital for optimal functioning of many antioxidant enzymes, both copper
dependent and otherwise, in varied organs and tissues (82).
5.3.2 Oxidative stress and hypertension
Recent studies have provided irrefutable evidence that oxidative stress
can cause hypertension and hypertension can cause oxidative stress. Essential
hypertension is associated with greater than normal lipo-peroxidation and an

51
imbalance in anti-oxidant status, suggesting that oxidative stress is important in
the pathogenesis of essential hypertension or in arterial damage related to
essential hypertension (87). Oxidative stress result from accumulation of free
radicals (79).These free radicals cause defect to the tissues so presence of
antioxidant enzyme such as SOD inhibit the effect of free radicals (74).
It is now well established that several trace elements are essential
because of their involvement in the catalytic activity and spatial conformation of
antioxidant enzymes. Copper is essential both for its role in antioxidant enzymes,
like Cu-Zn SOD and ceruloplasmin, as well as its role in lysyl oxidase, essential
for the strength and integrity of the heart and blood vessels (78).
5.3.3 Lipid profile in hypertensive patient
In our study the amount of cholesterol and the amount of triglyceride
increased, also LDL increased but the amount of HDL have decreased. These
results agree with many previous research studied that have implicated that
cholesterol, triglyceride and LDL- Ch were significantly higher than corresponding
values of control (22). When plasma conc. of LDL-Ch elevates this leads to
accumulation of cholesterol and therefore formation of atherosclerotic lesion take
place of the wall at the vessels (92).
5.3.4 Copper and cardiovascular disease
Many studies discuss the relationship between nutrition and
cardiovascular disease almost twenty years ago, it was postulated that there is a
direct relationship between the level of copper in the human diet and the
incidence of cardiovascular disease. Copper has been known to be associated
with lipid metabolism since 1973, and research in numerous animal models,
including humans, has shown that copper deficiency can significantly increase
the plasma cholesterol concentration. Additionally, this increase in cholesterol
results in an increase in LDL-Ch and a decrease in HDL -Ch, resulting in an
increase in cardiovascular disease risk (80,83.

52
It has also been demonstrated that copper deficiency significantly
increases the susceptibility of lipoproteins and cardiovascular tissues to lipid per-
oxidation, thus increasing the risk of cardiovascular disease (92).
Recent research has helped to explain this paradox. It has been
suggested, for instance, that an elevated serum copper level is an independent
risk factor for heart disease (80). Many researchers have considered this
elevation of serum copper to play a role in the pathogenesis of cardiovascular
disease, although other researchers have strongly disagreed with this
hypothesis(77).
A recent animal study, however, seems to have explained this relationship
between copper levels and cardiovascular disease. Administration of additional
copper resulted in a further increase in serum copper, a significant decrease in
serum cholesterol, and an increase and normalization in aorta and liver copper
levels. However, instead of increasing the incidence of atherosclerosis, additional
copper significantly decreased the incidence of atherosclerosis in the aorta and
coronary arteries. Further, it has been shown that excess dietary cholesterol
causes cardiovascular disease by lowering the absorption of copper, an effect
that is preventable by increasing the copper level in the diet (83).
5.4 Diabetic hypertensive patients
It is well believed that diabetic hypertensive cases could result from
hypertension and diabetes and vice versa. In both cases it is expected that
progressed cases of oxidative stress could cause damage of both vascular
system and the pancreas (100).

53
5.4.1 Cu and Zn in Diabetic hypertensive patient
Our results have shown higher levels of both Cu and Zn like hypertensive
cases but not like diabetes which showed increased levels of Cu but not Zn. This
could give us some hint about the prognosis of such cases. Our results also
indicate that ß-cell are more sensitive to changes in levels of Cu and Zn than
vascular cell and therefore to oxidative damage.
Despite the importance of Cu and Zn in protection of cells against
oxidative stress (76), it is likely that copper catalyses the production of ROS and
therefore initiates oxidative stress and cell damage (61). Increased in the
amounts of zinc as explained earlier is thought to result from the destruction of β-
cells in the pancreas, therefore release of zinc from its stores.
5.4.2 Lipid profile in Diabetic hypertensive patient
Serum copper levels were found to correlate with serum HDL levels. HDL
is known to lower the levels of cholesterol by transporting it back to the liver, also
HDL acts to lower the copper induced oxidation of LDL (97). No previous studies
has considered the correlation between copper and HDL in diabetic hypertensive
patients. No correlation was found between HDL and copper in hypertensive
acute myocardial patients (92). The absence of any agrees with the findings in
the diabetic group and the hypertensive group.
Serum cholesterol levels were also found to correlate positively with
serum zinc levels in this group. A previous study has postulated that increased
levels of zinc lowers the levels of HDL and increase the levels of LDL, and
therefore cholesterol (98). It has been assumed that high levels of zinc could
lower the absorption of copper, which increases the levels of HDL. However this
does not agree with our findings in our studied group, where we found a positive
correlation between the serum levels of copper and zinc but not an inverse one.
This however could be explained by the difference in the studied population,
which indicates that the correlation between trace elements and serum
parameters depends on the pathological state of the patient, which means on
other fact

54
Chapter-6
Conclusions and Recommendations
6.1 Conclusions
Throughout this research we focused on the changes in the levels of
serum levels of copper and zinc as well as sugar and lipid profile in three
different groups (diabetic, hypertensive, and diabetic hypertensive groups).
In diabetic group we have found that the serum levels of zinc and copper
are increased, in addition to LDL, triglycerides and cholesterol.
Correlation analysis has shown that increased levels of glucose are
accompanied by increased levels of copper but not zinc. Consistently there was
also a positive correlation between copper and triglycerides and inversely
correlated with LDL.
Zinc serum levels seem to correlate with both cholesterol and LDL. This
signifies the importance of zinc in diabetics as anti-oxidant in lowering the levels
of LDL and cholesterol.
In hypertensive group we found that the serum levels of both copper and
zinc are increased, also lipid profile was significantly different from control lipid
profile.
Unlike the diabetic group both zinc and copper did not show any
correlation with any of the lipid parameters, which signifies the difference in the
pathological changes in diabetes and hypertension.
In diabetic hypertensive group, like the hypertensive group and unlike the
diabetic group, there is a significant increase in the levels of both copper and
zinc.
In diabetic hypertensive group, while copper correlates positively with
HDL, zinc correlates also positively with cholesterol.
The presence of different correlations between the studied groups implies
different roles might copper and zinc play in diabetes and hypertension.

55
6.2 Recommendations
The suggestive role of zinc in type II diabetes assist in the importance of
using zinc as an antioxidant for protecting against type 2 diabetes. Therefore we
suggest the supplementation of patients of type 2 diabetes with zinc rich food
such as (ginger roots ,meat ,beef ,liver ,milk products ,whole grains ,nuts and
cabbage )or a vial of zinc, as explained by the finding that
1. Zinc decreases the amount of glucose in the blood, because zinc inhibits the
activity of fructose -1, 6- biphosphate which increases the break down of the
glucose (63).
2. Zinc was found to decrease the amount of LDL and cholesterol so this
decreases the complication of atherosclerosis.
3. Zinc acts as antioxidant for protection from oxidative stress (47).
Also we suggest to supplement hypertensive patients with zinc and copper
since:
1- Zinc inhibits oxidative stress transcription factors and synthesis of interleukin
(8).
2- Copper acts as components of Cu-Zn SOD and lysyle oxides which is
necessary for strength of blood vessels.
Finally we encourage the diabetic hypertensive patients to be supplemented
with copper or supplied their foods by copper such as ( chocolate , colas , coffee, tea ,
seeds ,nuts and soy products )because copper correlates well with HDL which carry
the cholesterol from the tissues to the liver so decrease the atherogenecity.
In fact , I wish that this study will be followed by further studies such as
measurements of Cu -Zn SOD and correlate it with Cu and Zn .
56
Chapter 7
References
[1] World Health Organization document, 04 July 2005 –Diabetes
(http://www.who.int/topics/diabetes_mellitus/en/index.html)
[2] Michael L., Bioship Edward P ., Fody larry Schoeff ., 1998-Clinical chemistry
principle ,procedures, correlations. Fifth edition, Chapter 6: 60-80
[3] Arther C., Guton M.D., 1990- human physiology and mechanism of disease
Fifth edition.chapter.7:65-73.
[4] Michiels C., Raes M., Toussaint O., Remacle J.,1994-" Importants of
Seglutathione , peroxidase, catalase and Cu/Zn SOD for cell survival against
oxidative stress". Free Radic Bio Med, 17:235-248.
[5] Domingues C., Ruiz E., Gussinye M., Carrascosa A.,1998-"Oxidative stress
at onset and in early stages of type I Diabetes in Children and adolesecents".
Diabetes Care, 21:1736-1742.
[6] Mooradian AD., Failla M., Hoogwerf B., Maryniuk M., Roset J., 1994-Selected
vitamins and minerals in diabetes. Diabetes Care 5:464 –478.
[7] Quilliot D., Dousset B., Guerci B., Dubois F., Drouin P., Ziegler O.,2001-
Evidence that diabetes mellitus favors impaired metabolism of zinc, copper, and
selenium in chronic pancreatitis. Pancreas Apr; 22(3): 299-306.
[8] Mosaad A., Abou-Seif., Abd-Allah Youssef.,2004- Evaluation of Some
Biochemical Changes in diabetic patients. Clinica Chimica Acta, 346: 161-170.
[9] Singh RB., Niaz MA., Rastogi SS., Bajaj S., Gaoli Z., Shoumin Z.,1998-
Current zinc intake and risk of diabetes and coronary artery disease and factors
associated with insulin resistance in rural and urban populations of North India. J
Am Coll Nutr , 17:564-570.

57
[10] Sondergaard G.,Stoltenberg M., Flyvbjerg A., Brock B. ,Schmitz O.,
Danscher G., Rungby J.,2003-Zinc ions in beta -cells of bese,insulin resistance
,and type II diabetic rats traced by autometaallography. J Trace Elem Med Bio,
11(12): 1147 (Abstract).
[11] Quraishi I., Collins S., Pestaner JP., Harris T., Bagasra O.,2005- Role of
zinc and zinc transporters in the molecular pathogenesis of diabetes mellitus.
Med Hypotheses, 65(5):887-92 (abstract)
[12] M. Vlad. , E. Bordas ., R. Tomus.,1993- Biol Trace Elem Res , 38: 47-54.
[13] Song YM., Chen MD., Sheu WH., 2000- Effect of acarbose administration
on plasma concentrations of zinc and copper in patients with NIDDM.
Kaohsiung J Med Sci, 16(4): 91-187.
[14] Institute of Medicine. Copper in: Food and Nutrition Board, ed. Dietary
reference intakes: vitamin A, vitamin K, arsenic, boron, chromium, copper, iodine,
iron, manganese, molybdenum, nickel, silicon, vanadium, and zinc. Washington,
DC: N .l Acad. Press, 2002:224–57.
[15] Isbir T. Tamer L., Taylor A., Isbir M., 1994- Zinc, copper and magnesium
status in insulin-dependent diabetes. Diabetes Res, 26(1): 41-51.
[16] Becker K.L., Bilezikian J .P. ,Humg W., Robertson G.L., Wartofasky L.,
(1990)-In principle of endocrinology &metabolism,publisher :J.B.lippincott
company.
[17] Alwan A.,(1996)-In prevention & management of hypertension ,publisher
:World Health Organization.
[18] Lehto S.,Palomaki P., and Miettinen H.,1993- Serum cholesterol and HDL-
cholesterol distributions in patient with AML . J Inter Med ,179:233.

58
[19] Tan LK., Chua KS ., Toh AK.,1992-Serum magnesium , copper and zinc
concentration in acute myocardial infarction .Circulation ,86 :803.
[20] Lucchesi BR., 1998- Free radicals and tissue injury. Dialogues Cardiovasc
Med, 3:3–22
[21] Bergomi M.,Rovesti S., Vinceti M., Vivoli R., Caselgrandi E.,1998-Zinc and
copper status and blood pressure. J Trace Elem Med Biol , 12(1):1. (Abstract)
[22] Klevay LM., 2003- Cardiovascular disease from copper deficiency - a history.
J Nutr, 130: 489S-492S.
[23] Baynes JW .,1991- Role of oxidative stress in development of complications
in diabetes. Diabetes, 40: 406 –412.
[24] Ozdemirler G., Mehmetcik G., Oztezcon S.,1995- Peroxidation potential and
antioxidant activity of serum in patients with diabetes mellitus and myocardial
infarction. Horm Metab Res, 27: 194-6.
[25] Bonnefont-Rousselot D., Bastard JP., Jaudon MC., Delattre J., 2000-
Consequences of the diabetic status on the oxidant/antioxidant balance.
Diabetes Metab, 26: 163 –17
[26] Ruiz C., Alegria A., Barbera R., Farré R., Lagarda MJ., 1998- Selenium,
zincand copper in plasma of patients with type 1 diabetes mellitus in different
metabolic control states. J Trace Elem Med Bio, 12:91 –95.
[27] Asayama K., Uchida N., Nakane T., 1993- Antioxidants in the serum of
children with insulin-dependent diabetes mellitus. Free Radic Biol Med, 15:597-
602.
[28] Cowell RC., Russell JW.,2004- Nirosaative injury and antioxidant therapy in
the management of diabetic neuropathy. J Invest Med, 52:33-44.

59
[29] Fajans S., Degroat L., saunders Co., 1995-Diabetes mellitus, definition,
classification, tests. In: Endocrinology, USA, Third edition .chapter 13 : 1411-
1422.
[30] Ceriello A., 2003 - New insights on oxidative stress and diabetic
complications may lead to a "causal" antioxidant therapy. Diabetes Care,
26:1589-1596.
[31] Opera EC. ,Abdel-Rahman E., Soliman,Kamel WA., Souka S .,Lowe JE
.,Abdel Aleom S.,1999- Depletion of total antioxidant capacity in type II diabetes
metabolism,48:1414-1414 .
[32] Kennedy AL., Lyons TJ., 1997- Glycation, oxidation, and lipoxidation in the
development of diabetic complications. Metabolism, 46: 14 –21.
[33] Bonnefont-Rousselot D., Bastard JP., Jaudon MC., Delattre J.,2000-
Consequences of the diabetic status on the oxidant/antioxidant balance.
Diabetes Metab,26: 163 –176 .
[34] Friedman A., 1999- Advanced glycosylated products and hyperglycemia in
the pathogenesis of diabetic complications. Diabetes Care, 22: B65 –B71.
[35] Paolisso G., D’Amore A., Volpe C.,1994- Evidence for a relationship
between oxidative stress and insulin action in non-insulin dependent type II
diabetic patients. Metabolism, 43: 1426 –1429.
[36] Wolf SP., Jiang ZY., Hunt JV., 1991- Protein glycation and oxidative stress in
diabetes mellitus and aging. Free Radical Biol Med, 10:339 –352.
[37] Hunt JV., Wolf SP., 1991- Oxidative glycation and free radical production: a
causal mechanism of diabetic complications. Free Rad Res Com, 12:115 –123.
[38] Haskins K., Kench J., Powers K., Bradley B., Pugazhenthi S., Reusch
J.,2004- Role for oxidative stress in the regeneration of islet beta cells? J Invest
Med, 52:45-49.

60
[39] Kaneto H., Kajimoto .Y, Fujitani Y., 1999- Oxidative stress induces p21
expression in pancreatic islet cells: possible implication in beta-cell dysfunction.
Diabetologia, 42:1093-1097.
[40] Ceriello A., 1999- Hyperglycaemia: the bridge between non-enzymatic
glycation and oxidative stress in the pathogenesis of diabetic complications.
Diabetes Nutr Metab, 12:42-46.
[41] Rema M., Mohan V., Bhaskar A., Shanmugasundaram KR., 1995- Does
oxidant stress play a role in diabetic retinopathy? Indian J Ophthalmol, 43:17-21.
[42] Food and Nutrition Board, IOM, and National Academy of Sciences. Vitamin
C, vitamin E, selenium, and b-carotene and other carotenoids: overview,
antioxidant definition, and relationship to chronic disease.In: Dietary Reference
Intakes for Vitamin C, Vitamin E, Selenium, and Carotenoids. Washington, DC:
The National Academies Press; 2000:35-57.
[43] Maxwell SR., Thomason H., Sandler D., 1997-Antioxidant status in patients
with uncomplicated insulin-dependent and non-insulin-dependent diabetes
mellitus. Eur J Clin Invest. 27:484-490.
[44] Dagenais GR., Marchioli R., Yusuf S., Tognoni G., 2000-Beta-carotene,
vitamin C, and vitamin E and cardiovascular diseases. Curr Cardiol Rep, 2:293-
299.
[45] Asayama K., Nakane T., Uchida N., Hayashibe H., Dobashi K., Nakazawa
S.,1994-Serum antioxidant status in streptozotocin-induced diabetic rat. Horm
Metab Res , 26;313-315.
[46] Sundaram RK., Bhaskar A., Vijayalingam S., Viswanathan M., Mohan R.,
Shanmugasundaram KR.,1996- Antioxidant status and lipid peroxidation in type
II diabetes mellitus with and without complications. Clin Sci (Colch) ,90:255-260.

61
[47] Ihara Y., Yamada Y., Toyokuni S., 2000- Antioxidant alpha-tocopherol
ameliorates glycemic control of GK rats, a model of type 2 diabetes, FEBS Lett,
473:24-26.
[48] Baker D., Campbell RK., 1992-Vitamin and mineral supplementation in
patients with diabetes mellitus. Diabetes Educ, 18:420-427
[49] Singh RB., Niaz MA., Rastogi SS., Bajaj S., Gaoli Z., Shoumin Z., 1998-
Current zinc intake and risk of diabetes and coronary artery disease and factors
associated with insulin resistance in rural and urban populations of North India. J
Am Coll Nutr, 17:564-570.
[50] DeValk HW., Verkaaik R., van Rijn HJM., Geerdink RA., Stuyvenberg A.,
1998- Oral magnesium supplementation in insulin-requiring Type 2 diabetic
patients. Diabet Med, 15: 503-507.
[51] Battell ML., Delgatty HLM., McNeil JH., 1998- Sodium selenate corrects
glucose tolerance and heart function in STZ diabetic rats. Mol Cell Biochem ,179:
27-34.
[52] Walter RM., Uriu-Hare JY., Olin KO., Oster MH., Anawalt BD., Crichfield
JW., Keen CL.,1991-Copper, zinc, manganese, and magnesium status and
complications of diabetes mellitus. Diabetes Care, 14:1050-1056.
[53] Car N., Car A., Granic M., Skrabalo Z., Momcilovic B.,1992- Zinc and copper
in the serum of diabetic patients. Biol Trace Elem Res , 32: 325-329.
[54] Coudray C., Richard MJ., Laporte F., Faure P., Roussel AM., Favier AE
.,1992- Superoxide dismutase activity and zinc status: a study in man and
animals. J Nutr Med, 3: 13 -26.
[55] Haskins K., Kench J., Powers K., Bradley B., Pugazhenthi S., Reusch
J.,2004 - Role for oxidative stress in the regeneration of islet beta cells . J Invest
Med, 52:45-49.

62
[56] Halliwell B., 1994-Free radicals, antioxidants and human disease:cause or
consequence ? Lancet, 344:721-724.
[57] Faure,P., Roussel,A, Coudray,C, Richard,MJ, Halimi,S, Favier,A .,1992- Zinc
and insulin sensitivity. Biol Trace Elem Res, 32:305-310.
[58] Arquilla,ER., Packer,S., Tarmas,W., Miyamoto,S., 1978- The effect of zinc
on insulin metabolism. Endocrinology, 103:1440-1449.
[59] Salgueiro MJ., Krebs N., Zubillaga MB., Weill R., Postaire E., Lysionek,AE.,
Caro,RA., De Paoli.,T, Hager,A., Boccio,J ., 2001- Zinc and diabetes mellitus: is
there a need of zinc supplementation in diabetes mellitus patients? Biol Trace
Elem Res ,81: 215-228.
[60] Disilvestro RA .,2000- Zinc in relation to diabetes and oxidative disease. J
Nutr ,130 (5S Suppl):1509S-1511S.
[61] Zelko IN., Mariani TJ., Folz RJ .,2002- Superoxide dismutase multigene
family: a comparison of the CuZn-SOD (SOD1), Mn-SOD (SOD2), and EC-SOD
(SOD3) gene structures, evolution, and expression. Free Radic Biol Med ,
33:337-349.
[62] Women Health document,06 may 2005.
http://womenshealth.about.com/cs/highbloodpressur/a/hypertentionhbp.htm
[63] Anne-Marie Roussel, PhD., FACN., Abdelhamid Kerkeni, PhD., Nouri
Zouari, MD., Sylvia Mahjoub, MD., Jean-Marc Matheau and Richard A.
Anderson, PhD, FACN.,2003- Antioxidant Effects of Zinc Supplementation in
Tunisians with Type 2 Diabetes Mellitus . J Am . Coll Nutr, 22(4) 316-321.
[64] Kinlaw WB., Levine AS., Morley JE., Silvis SE., 1983- Abnormal zinc
metabolism in type II diabetes mellitus. Am J Med, 75 (2):273-7.

63
[65] Pedrosa .,Lucia de Fátima Campos. ,Cozzolino., Sílvia .,Maria.,
Franciscato.,1999- Metabolic and functional alterations of copper in diabetes
mellitus. Brazilian J .Nutr , 12(3): 213-224.
[66] Williams NR., Rajput-Williams J., West JA., Nigdikar SV., Foote JW.,
Howard AN.,1995- Plasma, granulocyte and mononuclear cell copper and zinc in
patients with diabetes mellitus. Diabetic Care, 120(3):887-90.
[67] médicine document ,09 Sept 2005.
http://www.medicinenet.com/low_blood_pressure/article.htm
[68] Richard E.Klabunde,Ph.D.,2004-" Cardiovascular Physiology Concepts
"Published by Lippincott Williams & Wilkins.
[69] Feingold KR., Grunfeld C., Pang M., 1992- LDL subclass phenotypes and
triglyceride metabolism in non-insulin-dependent diabetes. Arterioscler Tromb ,
12: 1496-1502.
[70] Hearse DJ., Humphrey SM., Nayler WG., Slade A., Border D.,1975-
Ultrastructural damage associated with reoxygenation of the anoxic myocardium
.J Mol Cell Cardiol, 7(5):315-324.
[71] Freeman BA., Crapo JD., 1982- Biology of disease: free radicals and tissue
injury. Lab Invest, 47(5):412-26.
[72] Lucchesi BR., 1998- Free radicals and tissue injury. Dialogues Cardiovasc
Med, 3:3–22
[73] McCord JM., 2001- The evolution of free radicals and oxidative stress. Am J
Med, 108(8):652-9.
[74] Singal PK., Khaper N., Palace V., Kumar D.,1999- The role of oxidative
stress in the genesis of heart disease. Cardiovasc Res , 40(3):426-32

64
[75] Tiber AM., ,Sakhll M ., Joffe CD.,1986-"Relative value of plasma copper
,zinc, lipids and lipoproteins as marker of coronary artery disease".
Atheroscelerosis, 62: 105.
[76] Bergomi M., Rovesti S., Vinceti M., Vivoli R., Caselgrandi E., Vivoli G.,1997-
Zinc and copper status and blood pressure. J Trace Elem Med Biol , 11(3):166-9.
[77] Aggett PJ., 1999- An overview of the metabolism of copper. Eur J Med Res
, 4:214-216).
[78] Johnson WT., Thomas AC., 1999- Copper deprivation potentiates oxidative
stress in HL-60 cell mitochondria. Proc Soc Exp Biol Med, 221:147-152.
[79] Vaziri., Nosratola D., 2004- Roles of oxidative stress and antioxidant therapy
in chronic kidney disease and hypertension. Current Opin in Nephro & Hyper,
13(1):93-99
[80] Klevay LM., 1975- Coronary heart disease: the zinc/copper hypothesis. Am J
Clin Nutr , 28(7):764-774
[81] Dale A. Schuschke., 1997- Dietary Copper in the Physiology of the
Microcirculation . J . of Nutr , 127 (12): 2274-2281.
[82]Owen, C. A., 1982 - Biochemical Aspects of Copper. Copper Proteins,
Ceruloplasmin and Copper Protein Binding. Noyes, Park Ridge, NJ.
pp. 9-17, 75-111, 128-176.
[83] Klevay L. M., 1987- Hypertension in rats due to copper deficiency.
Nutr. Rep. Int .35:999-1005

65
[84] Connell, P, Young VM, Toborek M, Cohen DA, Barve S, McClain CJ, and
Hennig B., 1997- Zinc attenuates tumor necrosis factor-mediated activation of
transcription factors in endothelial cells. J Am College Nutr., 16: 411-417.
[85] He BP., Li DF., Ma JW., Chen J., Liu XY., Zhang XR., Xu JM.,2004-
Determination of trace copper and zinc in hypertension complicated with
hyperlipemia by atomic absorption spectrophotometry Guang Pu Xue Yu Guang
Pu Fen Xi. 24(6):741-743.
[86] Terres-Martos C., Navarro-Alarcon M., Martin-Lagos F, Lopez-G de la
Serrana H, Perez-Valero V, Lopez-Martinez MC.,1998- Serum zinc and copper
concentrations and Cu/Zn ratios in patients with hepatopathies or diabetes. J
Trace Elem Med Biol, 12(1): 44-49.
[87] Bergomi M., Rovesti S., Vinceti M., Vivoli R., Caselgrandi E., Vivoli G.,1998-
Zinc and copper status and blood pressure .J Trace Elem Med Boil, 12(1):1.
[88] Liu WM., Zhu ZG., Leng HX.,2004- Analysis of the contents of K, Na, Ca,
Mg, Zn, Cu, Fe and Mn in serum of middle and old-aged hypertension patients.
Guang Pu Xue Yu Guang Pu Fen Xi, Mar; 24 (3):360-362.
[89] Zargar AH., Shah NA., Masoodi SR., Laway BA., Dar FA., Khan AR., Sofi
FA., Wani AI., 1998- Copper, zinc, and magnesium levels in non-insulin
dependent diabetes mellitus. Postgrad Med J, 74: 665-877.
[90] Schlienger JL., Grunenberger F., Maier EA., Simon C., Chabrier G., Leroy
MJ.,1988-" Disorders of plasma trace elements in diabetes. Relation to blood
glucose equilibrium". J Nutr ,17(21):1076-1079.
[91] Feingold KR., Grunfeld C., Pang M., 1992- LDL subclass phenotypes and
triglyceride metabolism in non-insulin-dependent diabetes. Arterioscler Tromb,
12: 1496-1502.

66
[92] Metwalli O.,AL-okbi .S., Motawi.T,El-Ahmdy O.,1998-"Study of serum metals
and lipids profile in patient with acute myocardial infarction". Med .J. of
IAS,11:20-27.
[93] Karahan SC., Deger O., Orem A., Ucar F., Erem C., Alver A., Onder
E.,2001- The effects of impaired trace element status on polymorphonuclear
leukocyte activation in the development of vascular complications in Type 2
diabetes mellitus. Clin Chem Lab Med, 39 (2): 109-115.
[94] Osman E., vliyaoğlu., Levent K ., Nuriye U., Nazife K ., Baysal K., Ruhan K.,
Naciye Y., 2004- "Correlations of Serum Cu+2, Zn+2, Mg+2 and HbA1c in Type 2
and Type 2 Diabetes Mellitus ". Turk. J. of Endo.and Metab. 8(3) Page(s) 75-79.
[95] D'Ocon C., Alonso de Armino V., Frasquet I., 1987- Levels of Zn and Cu in
the serum of a diabetic population. Rev Esp Fisiol, 43 (3): 335-338.
[96] Mateo MC ., Bustamante JB., Cantalapiedra MA., 1978-Serum, zinc, copper
and insulin in diabetes mellitus. Biomedicine, 29(2):56-58.
[97] Uza G., Pavel O., Kovacs A ., Uza D ., Valaicu R ., 1984-"Serum
concentration of Na , K,Ca,P,Zn and Cu in patients with essential arterial
hypertension ". Clinic Exp Hypertens A . 6 (8): 1415-1429 .
[98] Russo., Oliviero ., Domenico .,1998- Anti-oxidant status and lipid
peroxidation in patients with essential hypertension ". J. of Hyper, 16(9):1267-
1271.
[99] Barandier C., Tanguy S., Pucheu S., Boucher F., De Leiris J.,1999- Effect of
antioxidant trace elements on the response of cardiac tissue to oxidative stress.
Ann NY Acad Sci , 87(4):138-55.
[100] Oberley LW. Free radicals and diabetes. Free Radical Biol Med 5: 113-124,
1988.
67
Appendix 1: UNRWA agreement

68
Appendix 2: Consent Form
------------------------------------------------------------------------------------------------------------------
: ............................................................................................. السیدة/ السید
, التحیة بعد
الغوث بعملفي وكالة تحت إشراف الطاقم الطبي لعیادة الزیتون الإسلامیةبالجامعة تقوم باحثة
وقد قامت بجمع عینات دم عشوائیة لدیكمالخارصین مستویات مصل النحاس و حول تقییمدراسة
.الغرضمل لھذا (4-3)لھذا الغرض لذلك نرجو التكرم منكم بالموافقة على سحب عینة دم
.و القبول لن تتأثر الخدمة الطبیة المقدمة إلیكم الرفض أفي حالة علما بأنھ
ن تعاونكم س حینشاكر
.......................................................................... .التوقیع
یةبالجامعة الإسلام الباحثة ---------------------------------------------------------------
-

69
Appendix 3: Questionnaire
For control group selection the following questions were answered after carrying out blood pressure measurement and blood analysis.
NO YES Question
No.
Are you smoker?
1
Are you practice any sports?
2
Are there any person in your family suffer from hypertension /diabetes mellitus?
3
Is measurement of the blood pressure greater than 90/140?
4
Is the person obese? (Body mass >32)?
5
Is the concentration of blood glucose > 110 mg/dl?
6
Is the concentration of blood cholesterol > 250mg/dl?
7
Is the concentration of blood triglyceride > 200 mg/dl?
8
Is the concentration of blood HDL >50 mg/dl?
9
Is the concentration of blood LDL > 132 mg/dl?
10
Note:
:individual are The criteria of healthy
Neither smoker or obese
The blood pressure is less than 90/140.
The blood glucose level is less than 110 mg/dl.
The blood cholesterol level is between (150-250) mg/dl.
The blood triglyceride is less than 200 mg/dl.
The blood HDL level is between (35-50) mg/dl.
The blood LDL is less than 132mg/dl.