Embed Size (px)
Citation preview
Journal of Advanced Research in Fluid Mechanics and Thermal Sciences
ISSN (online): 2289-7879 | Vol. 4, No. 1. Pages 1-12, 2014
1
Penerbit
Akademia Baru
The Kinetic Study of Malaysian Poultry
Processing Dewatered Sludge (PPDS) Combustion
Using Iso-Conversional Model Free Method
N. Aniza *,a, S. Hassan b and M. F. M. Nor c
Universiti Teknologi Petronas, Bandar Seri Iskandar, 31750 Tronoh, Perak, Malaysia a,*[email protected], b [email protected], c [email protected]
Abstract – The kinetic study of Malaysian Poultry Processing Dewatered Sludge (PPDS) from two
different origins, namely PPDS 1 and PPDS 2, has been conducted by using thermogravimetric analysis
(TGA). The temperature from 30°C to 1000°C was set in oxidizing atmosphere at four different heating
rates. The TG and DTG profiles from the TGA result depicted that the combustion characteristic of
both samples is different in every stage. Differences in fuel characteristic influenced the thermal
behaviour of the samples. In this study, two models from the iso-conversional model free method,
namely Flynn-Wall-Ozawa (FWO) and Kissinger-Akahira-Sunose (KAS) models were adopted to
calculate the kinetic parameters. The average activation energy of PPDS 1 is lower than PPDS 2, which
describes that the reaction mechanism of PPDS 1 is easier and requires less time to complete compared
to PPDS 2. The difference in extracting PPDS between two origins of waste at sludge water treatment
process slightly affected the outcome of this analysis. Copyright © 2014 Penerbit Akademia Baru - All
rights reserved.
Keywords: Thermogravimetric Analysis, Biomass, Combustion, Kinetic, Activation Energy
1.0 INTRODUCTION
Biomass waste receives a major interest in ongoing renewable energy studies towards the
efforts to meet the increasing energy needs of the modern society. In the practice of recovering
energy from biomass waste material, an in-depth understanding of the thermal conversion
process is essential, especially involving thermochemical reaction kinetics. Biomass can be
effectively converted into the source of energy by applying thermochemical conversion
process. In thermochemical conversion process of solid fuel, reaction kinetic is one of the
important features, as well as its fuel characterization. Combustion reaction kinetics has been
intensively investigated for the past few decades for a variety of conventional solid fuels and
commonly found biomass waste materials. However, it is not well defined for currently
proposed biomass waste such as poultry processing waste. A comprehensive understanding of
how fast a reaction takes place and a well-defined minimum energy required during the
combustion process of poultry processing waste will contribute to the new concept towards an
efficient design and an effective operation of the thermal conversion process.
Poultry processing industry in Malaysia is currently growing to support the increasing demands
of local consumption, as well as accommodate the needs of marketing and supplying chicken
meat to Asian market. The slaughtering process of broiler industry generates a huge amount of
Journal of Advanced Research in Fluid Mechanics and Thermal Sciences
ISSN (online): 2289-7879 | Vol. 4, No. 1. Pages 1-12, 2014
2
Penerbit
Akademia Baru
solid by-product that is not be intended for human consumption. The waste known as poultry
processing dewatered sludge (PPDS) has been going through wastewater treatment, which
contains internal organs, trimmings, feathers, blood and others [1]. According to Ibrahim et al.
[2], this waste material obviously contributes towards environmental problems such as waste
disposal due to scarcity of land, harmful to the surrounding environment as the waste undergoes
a slow degradation process and produces an awful stench. PPDS fuel potential for biomass
feedstock for the purpose of power generation has been investigated recently by many
researchers [2][3][4]. Based on the conclusion, PPDS with high calorific value, high carbon
content and low sulphur is comparable to coal, and therefore can be potentially used as a fuel
for thermal conversion technologies in power generation plant.
The reaction kinetics of common solid fuels have been thoroughly investigated and published
for coal, while some preliminary data is available for biomass waste materials such as wood
[5], rice husk [6], date palm residues [7][8], oil palm waste [9] and sewage sludge [10].
However, the data pertaining reaction kinetics during combustion of PPDS in available
literature is very limited. The purpose of this study is to determine the reaction kinetic
parameter, namely activation energy of PPDS by using thermogravimetric analysis (TGA). In
this study, the comparison of combustion behaviour and reaction kinetics of PPDS from two
selected origins was conducted. Two different iso-conventional model free methods, namely
Flynn-Wall-Ozawa method and Kissinger-Akahira-Sunose method were adopted to calculate
the activation energy.
2.0 METHODOLOGY
2.1 Material
In this research work, PPDS samples collected from two different plants were analysed for
their reaction kinetics in oxidizing atmospheres using non-isothermal thermogravimetric
kinetic analysis. An iso-conversional method (model free) was used together with the data
measured using a thermogravimetric analyzer (TGA) in obtaining the kinetic parameters.
The PPDS samples were taken from the plants located at the North region (Plant 1) and the
South region (Plant 2) of Peninsular Malaysia. It is important to highlight that these two plants
have similar production of waste but the processes in extracting the waste material are different.
This biomass material derived by slaughtered poultry has high moisture content. Before
proceeding with any analysis, the removal of moisture content of the sample was first
performed by oven drying at the temperature of 105°C for 24 h.
2.2 Thermogravimetric Analysis (TGA)
The samples were analyzed to determine the main properties that affect thermal conversion.
These include proximate analysis, ultimate analysis and calorific value test. The data of
proximate analysis including moisture content, volatile matter, fixed carbon and ash was
assessed by using thermogravimetric analysis. Ultimate analysis was conducted to evaluate the
content of carbon (C), hydrogen (H), nitrogen (H), and sulphur (S) of the sample. The analysis
was done using the CHNS analyzer. Calorific value test was carried out to measure the higher
heating value of PPDS sample, which was performed by using a bomb calorimeter.
Thermogravimetric analysis was carried out using thermogravimetric analyzer Labsys Evo
Setaram. Approximately 10 mg sample was measured and filled in an alumina crucible. A non-
Journal of Advanced Research in Fluid Mechanics and Thermal Sciences
ISSN (online): 2289-7879 | Vol. 4, No. 1. Pages 1-12, 2014
3
Penerbit
Akademia Baru
isothermal TGA under dynamic condition with the temperature from 30°C to 1000°C was
ramped in oxidizing atmosphere. The experiment was repeated for heating rate, β equal to 5,
10, 15 and 20 K/min. The reason of varying these four heating rates is to allow for the
calculation of kinetic parameters. On increasing the temperature, TG and DTG curves were
continuously recorded by the TGA software.
2.3 Kinetic Theory
The model fitting and model free (iso-conversional) methods are the two models that are
available to perform the calculation of kinetic analysis. However, compared to model fitting,
iso-conversional method is often used by numerous researchers. Without prefixing the reaction
order, the computation of kinetic parameters can be defined. The sufficient flexibility of model
free to allows the change of mechanism during the direction of reaction, and minimizing the
mass transfer limitation by using several heating rates is also the one of the reasons this model
is applied by many researchers[11][12].
Devolatilization of biomass reaction mechanism is assumed to progress as a single reaction in
a one-step global model [5] and can be expressed as:
������� �→ℎ�� + �������� (1)
where the rate constant of reaction, k can be explained by the Arrhenius equation.
� = ���� ��� (2)
where E is the activation energy (kJ/mol), T is the absolute temperature (K), R is the gas
constant (8.314 J��������) and A is the pre-exponential factor (�����). The rate of
conversion from solid state to volatile product (heterogeneous solid-state reaction) is described
by the following equation:
���� = �� !"�#! (3)
where # represents the degree of conversion, t, k(T) and f(α) represent the time, the rate
constant and the reaction model, respectively. Equation (4) can be produced when converting
equation (3) and obeys from the Arrhenius equation.
���� = ���
$%&"�#! (4)
At a non-isothermal state with a constant heating rate, β = ���� , equation (4) can be transformed
into the following equation (5).
���� =
�'��
� $%&"�#! (5)
By integrating both sides of equation (5),
( ��)��! = *�#! = +
' ( ��� ��⁄��- . �
/ (6)
Journal of Advanced Research in Fluid Mechanics and Thermal Sciences
ISSN (online): 2289-7879 | Vol. 4, No. 1. Pages 1-12, 2014
4
Penerbit
Akademia Baru
The implementation of iso-conversional method involves a series of TGA experiment that can
be done at various heating rates in the same condition [13]. In this study, two frequently used
iso-conversional methods; the Flynn-Wall-Ozawa (FWO) and Kissinger-Akahira-Sunose
(KAS) methods were applied to determine the kinetic parameter. In order to complete the
calculation for FWO method, the Doyle’s approximation of p(χ) was practised [14]. The
corresponding temperature of fixed value conversion degrees was determined, which yield at
every heating rate. The calculation using FWO method is expressed by the following equation
(7). A plotted graph of ln(β) versus 1000/T yielded a straight line with slope -1.052E/R s. From
this equation, the activation energy E can be obtained.
ln�2! = �� 3 +��4��!5 − 5.331 − 1.052 �
�� (7)
For the calculation of activation energy using KAS method, the following equation (8) was
used. The activation energy, E can be calculated from the slope, E/RT which was obtained by
plotting the graph of ln(β/ =! versus 1000/T.
�� > '�?@ = �� > +��4�@ −
��� (8)
3.0 RESULTS AND DISCUSSION
3.1 Fuel Analysis
Table 1 shows the fuel characteristics of both PPDS 1 and PPDS 2 for proximate analysis,
ultimate analysis and calorific value test. The result shows that PPDS 1 has high content of
moisture, fixed carbon and ash compared to PPDS 2. It is worth noticing that low moisture and
ash content, and high volatile matter makes the material becomes an attractive fuel for
thermochemical conversion process. High moisture content has a disadvantage that it will
affect the combustion performance during the ignition stage [15]. In addition, high moisture
content tends to reduce the calorific value. This can be proven by the findings in Table 1 where
PPDS 2 with low moisture content has high calorific value than PPDS 1.
Table 1: Proximate, ultimate and calorific value analysis for PPDS 1 and PPDS 2
Analysis PPDS 1 PPDS 2 ± Percentage Difference (%)
Proximate Analysis (wt. %)
Moisture Content 8.66 2.02 76.67
Volatile Matter 57.28 85.81 49.81
Fixed Carbon 22.46 8.51 62.11
Ash 11.6 3.66 68.45
Journal of Advanced Research in Fluid Mechanics and Thermal Sciences
ISSN (online): 2289-7879 | Vol. 4, No. 1. Pages 1-12, 2014
5
Penerbit
Akademia Baru
Ultimate Analysis (wt. %)
Carbon 69.95 52.85 24.45
Hydrogen 10.66 8.87 16.79
Nitrogen 3.29 5.66 41.87
Sulphur 0.96 0.80
16.67
Calorific Value
(MJ/kg)
22.9 23.43 2.26
The calorific value of PPDS is significantly higher compared to other biomass and the value is
close and comparable to coal [4]. Calorific value is an important characteristic that indicates
the available energy per unit mass in the sample. High calorific value shows its viability for
solid fuel resources. Ultimate analysis result shows that PPDS 1 has higher C, H and N content
than PPDS 2. The next feature to be highlighted is nitrogen content. Compared to other biomass
sample, nitrogen content for PPDS is considered high, which can cause problems related to
emissions of nitrogen oxides in combustion process [16].
3.2 Thermal Behaviour
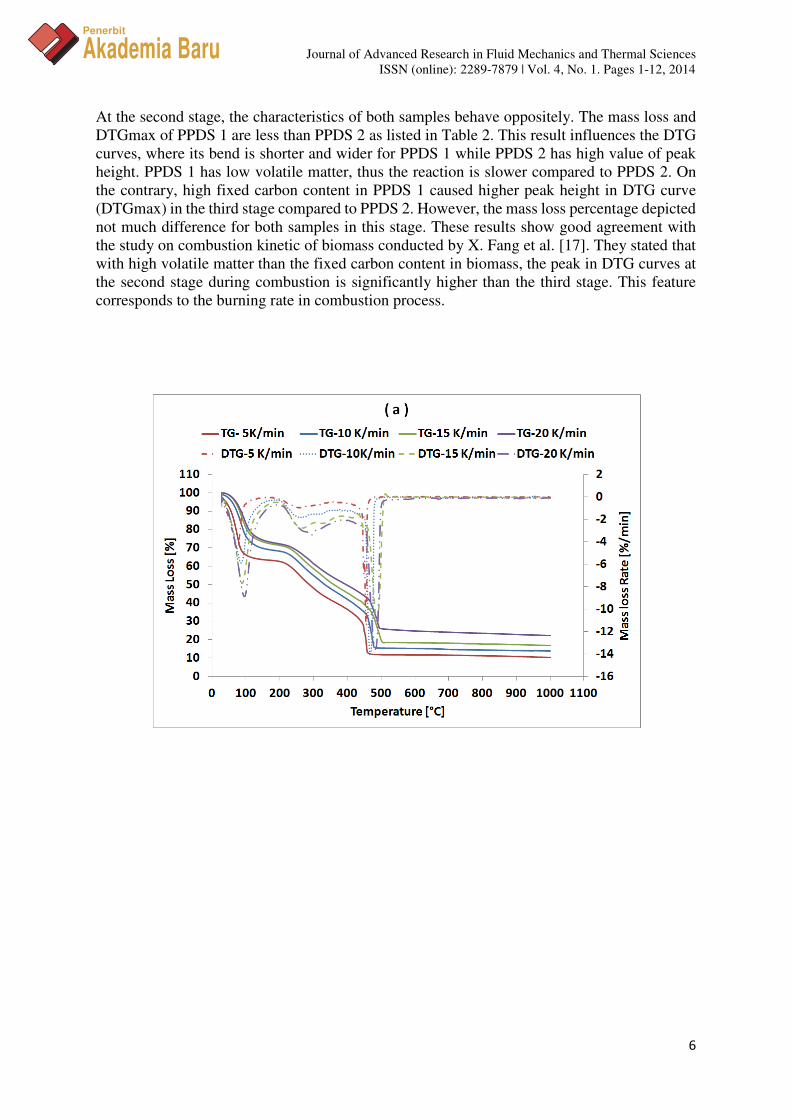
A non-isothermal thermogravimetric analysis (TGA) was conducted in this study with the
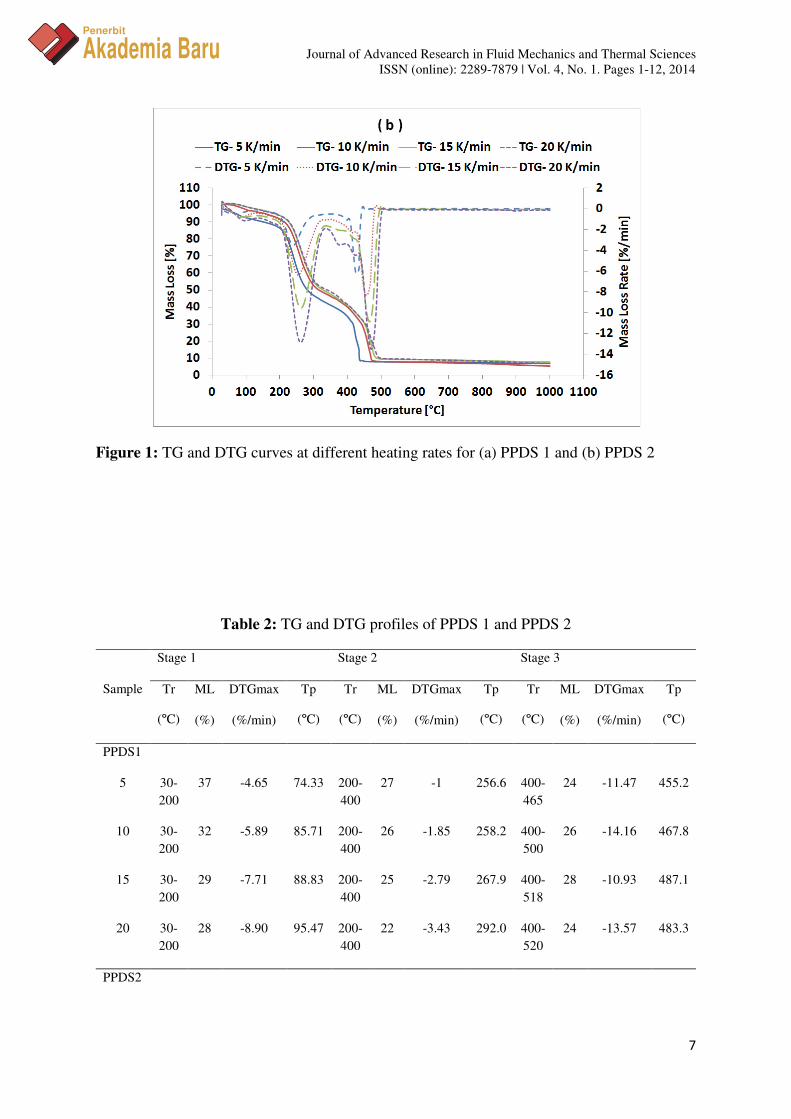
temperature range between 30°C up to 1000°C in oxidizing atmosphere. Fig. 1(a) and Fig. 1(b)
illustrate the TG and DTG curves captured by the software of TGA during the analysis at four
different heating rates respectively. The mass of sample dwindled as the temperature increased.
This can be described by the TG curves. The DTG curve reflects the percentage of mass loss
per unit time against temperature. As can be seen from the graphs, the DTG curves show 3
different peaks, which can be described as (i) evaporation of moisture, (ii) devolatilization
process and (iii) char combustion process.
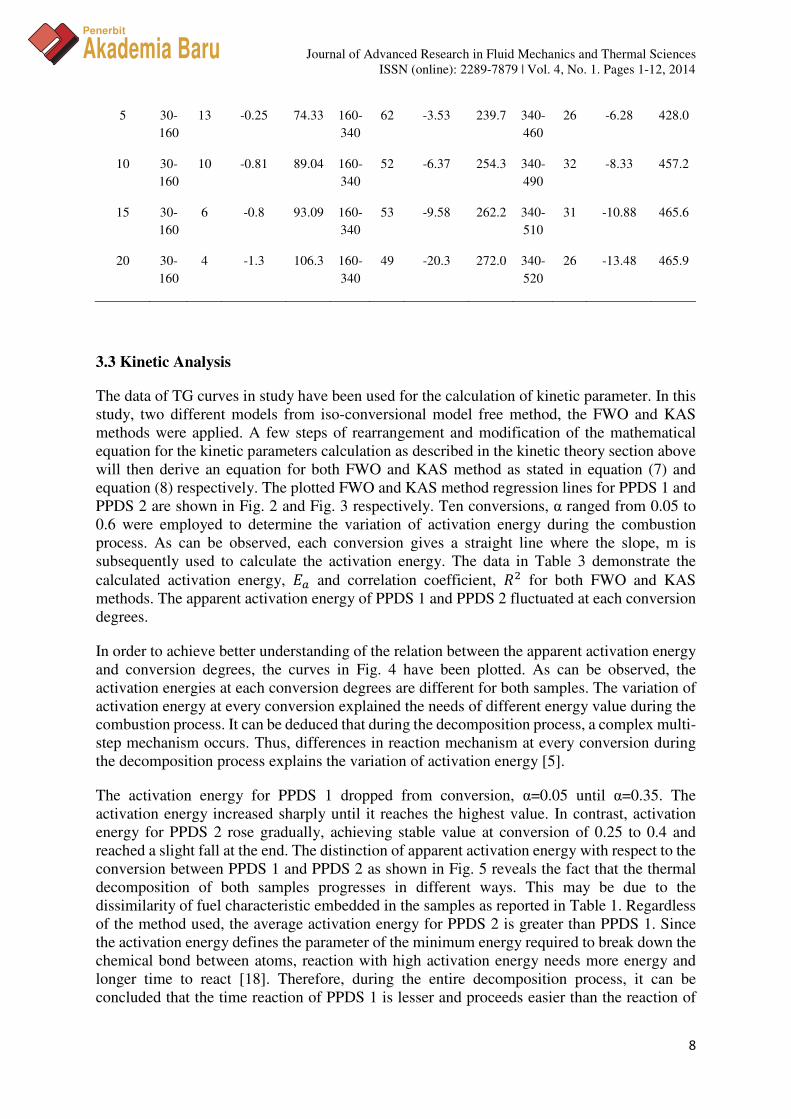
The TG and DTG profiles at each stage are shown in Table 2. Tr refers to the temperature
range, ML is the mass loss in percentage unit, DTGmax is the maximum mass loss rate and Tp
refers to the peak temperature corresponding to the DTGmax. According to Table 2, for PPDS
1, evaporation of moisture in stage 1 happened at the temperature of 30°C-200°C, while
devolatilization process and char of combustion took place at the temperature range of 200°C-
400°C and 400°C-520°C respectively. Conversely, for PPDS 2, the temperature range for these
3 stage is between 30°C-160°C (evaporation of moisture), 160°C-340° (devolatilization
process) and 340°-520°C (combustion of char). The DTG peak for PPDS 1 in the first stage is
high for every heating rate. As can be observed from the table, DTGmax of PPDS 1 at this
stage is greater than DTGmax of PPDS 2. The percentage of mass loss (ML) at this stage is
also higher, which ranged from 28% to 37% for PPDS 1, while for PPDS 2, the ML is just
around 4% to 13%. As for the temperature range during the first stage, PPDS 1 ends at
T=200°C, whereas PPDS 2 stops earlier at T=160°C. To relate with the proximate analysis
result in Table 1, PPDS 1 has higher moisture content than PPDS 2, thus it reacts actively and
requires higher temperature to complete the process in the first stage, which can be attributed
to evaporation of moisture.
Journal of Advanced Research in Fluid Mechanics and Thermal Sciences
ISSN (online): 2289-7879 | Vol. 4, No. 1. Pages 1-12, 2014
6
Penerbit
Akademia Baru
At the second stage, the characteristics of both samples behave oppositely. The mass loss and
DTGmax of PPDS 1 are less than PPDS 2 as listed in Table 2. This result influences the DTG
curves, where its bend is shorter and wider for PPDS 1 while PPDS 2 has high value of peak
height. PPDS 1 has low volatile matter, thus the reaction is slower compared to PPDS 2. On
the contrary, high fixed carbon content in PPDS 1 caused higher peak height in DTG curve
(DTGmax) in the third stage compared to PPDS 2. However, the mass loss percentage depicted
not much difference for both samples in this stage. These results show good agreement with
the study on combustion kinetic of biomass conducted by X. Fang et al. [17]. They stated that
with high volatile matter than the fixed carbon content in biomass, the peak in DTG curves at
the second stage during combustion is significantly higher than the third stage. This feature
corresponds to the burning rate in combustion process.
Journal of Advanced Research in Fluid Mechanics and Thermal Sciences
ISSN (online): 2289-7879 | Vol. 4, No. 1. Pages 1-12, 2014
7
Penerbit
Akademia Baru
Figure 1: TG and DTG curves at different heating rates for (a) PPDS 1 and (b) PPDS 2
Table 2: TG and DTG profiles of PPDS 1 and PPDS 2
Sample
Stage 1 Stage 2 Stage 3
Tr
(ºC)
ML
(%)
DTGmax
(%/min)
Tp
(ºC)
Tr
(ºC)
ML
(%)
DTGmax
(%/min)
Tp
(ºC)
Tr
(ºC)
ML
(%)
DTGmax
(%/min)
Tp
(ºC)
PPDS1
5 30-
200
37 -4.65 74.33 200-
400
27 -1 256.6 400-
465
24 -11.47 455.2
10 30-
200
32 -5.89 85.71 200-
400
26 -1.85 258.2 400-
500
26 -14.16 467.8
15 30-
200
29 -7.71 88.83 200-
400
25 -2.79 267.9 400-
518
28 -10.93 487.1
20 30-
200
28 -8.90 95.47 200-
400
22 -3.43 292.0 400-
520
24 -13.57 483.3
PPDS2
Journal of Advanced Research in Fluid Mechanics and Thermal Sciences
ISSN (online): 2289-7879 | Vol. 4, No. 1. Pages 1-12, 2014
8
Penerbit
Akademia Baru
5 30-
160
13 -0.25 74.33 160-
340
62 -3.53 239.7 340-
460
26 -6.28 428.0
10 30-
160
10 -0.81 89.04 160-
340
52 -6.37 254.3 340-
490
32 -8.33 457.2
15 30-
160
6 -0.8 93.09 160-
340
53 -9.58 262.2 340-
510
31 -10.88 465.6
20 30-
160
4 -1.3 106.3 160-
340
49 -20.3 272.0 340-
520
26 -13.48 465.9
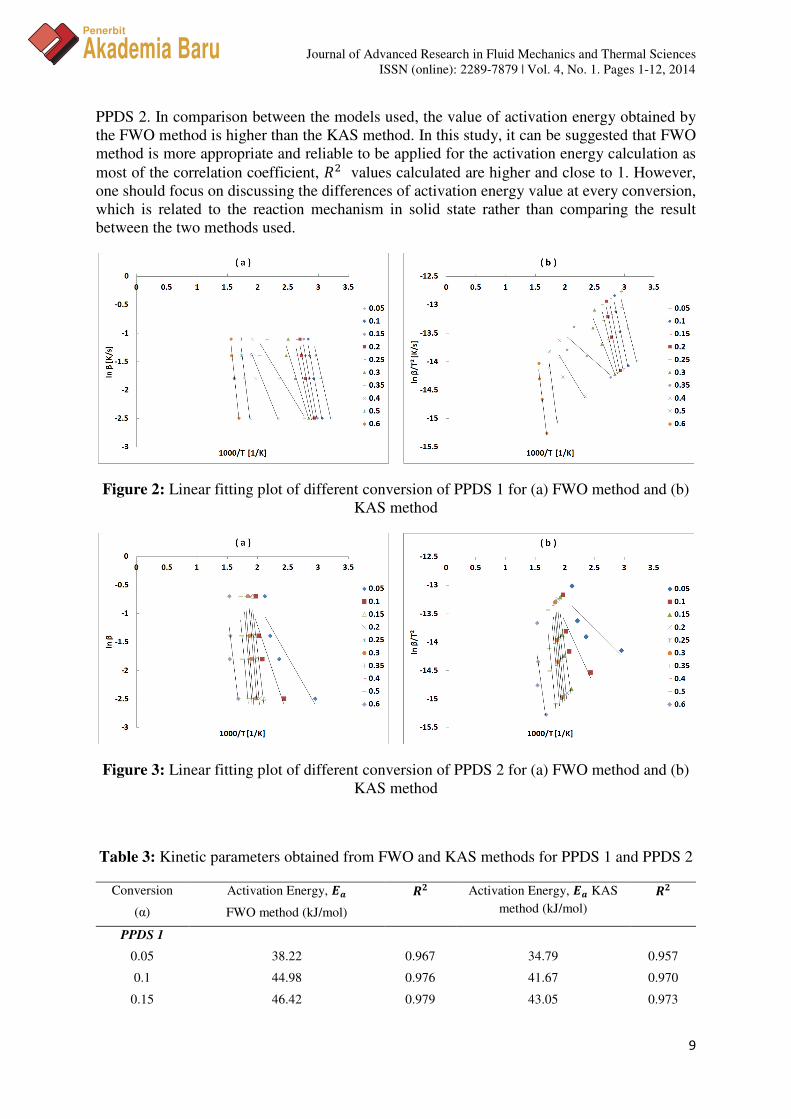
3.3 Kinetic Analysis
The data of TG curves in study have been used for the calculation of kinetic parameter. In this
study, two different models from iso-conversional model free method, the FWO and KAS
methods were applied. A few steps of rearrangement and modification of the mathematical
equation for the kinetic parameters calculation as described in the kinetic theory section above
will then derive an equation for both FWO and KAS method as stated in equation (7) and
equation (8) respectively. The plotted FWO and KAS method regression lines for PPDS 1 and
PPDS 2 are shown in Fig. 2 and Fig. 3 respectively. Ten conversions, α ranged from 0.05 to
0.6 were employed to determine the variation of activation energy during the combustion
process. As can be observed, each conversion gives a straight line where the slope, m is
subsequently used to calculate the activation energy. The data in Table 3 demonstrate the
calculated activation energy, AB and correlation coefficient, C= for both FWO and KAS
methods. The apparent activation energy of PPDS 1 and PPDS 2 fluctuated at each conversion
degrees.
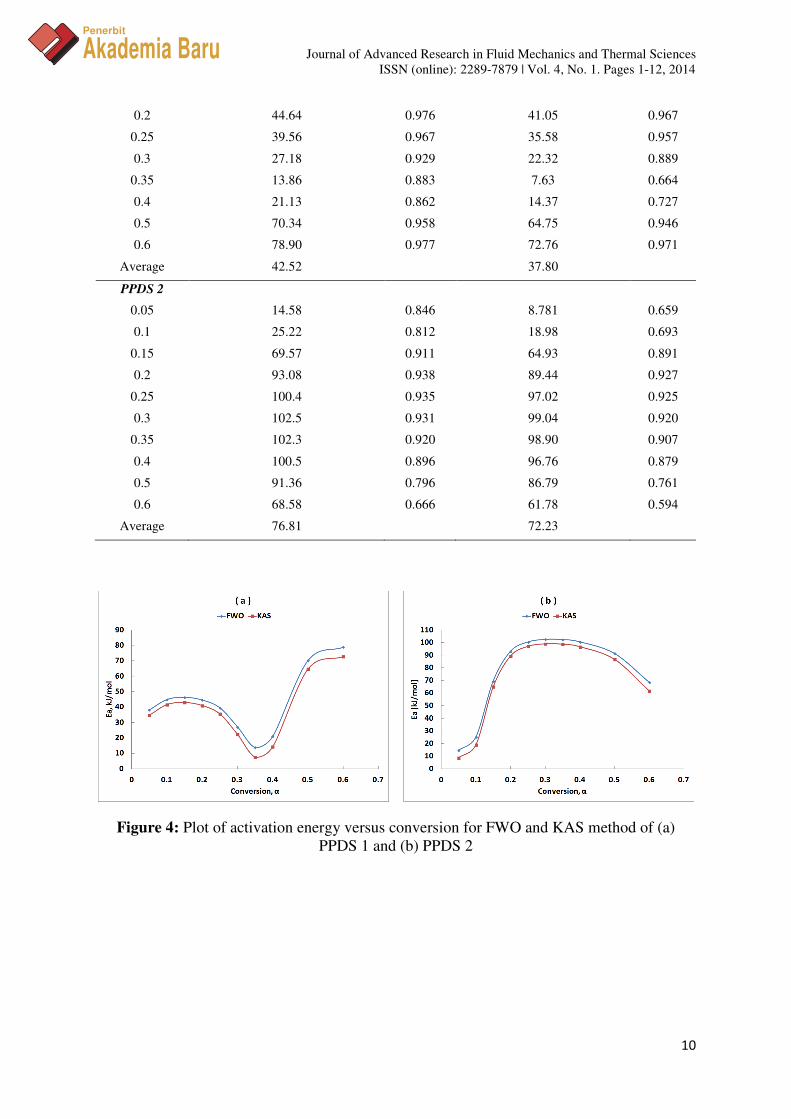
In order to achieve better understanding of the relation between the apparent activation energy
and conversion degrees, the curves in Fig. 4 have been plotted. As can be observed, the
activation energies at each conversion degrees are different for both samples. The variation of
activation energy at every conversion explained the needs of different energy value during the
combustion process. It can be deduced that during the decomposition process, a complex multi-
step mechanism occurs. Thus, differences in reaction mechanism at every conversion during
the decomposition process explains the variation of activation energy [5].
The activation energy for PPDS 1 dropped from conversion, α=0.05 until α=0.35. The
activation energy increased sharply until it reaches the highest value. In contrast, activation
energy for PPDS 2 rose gradually, achieving stable value at conversion of 0.25 to 0.4 and
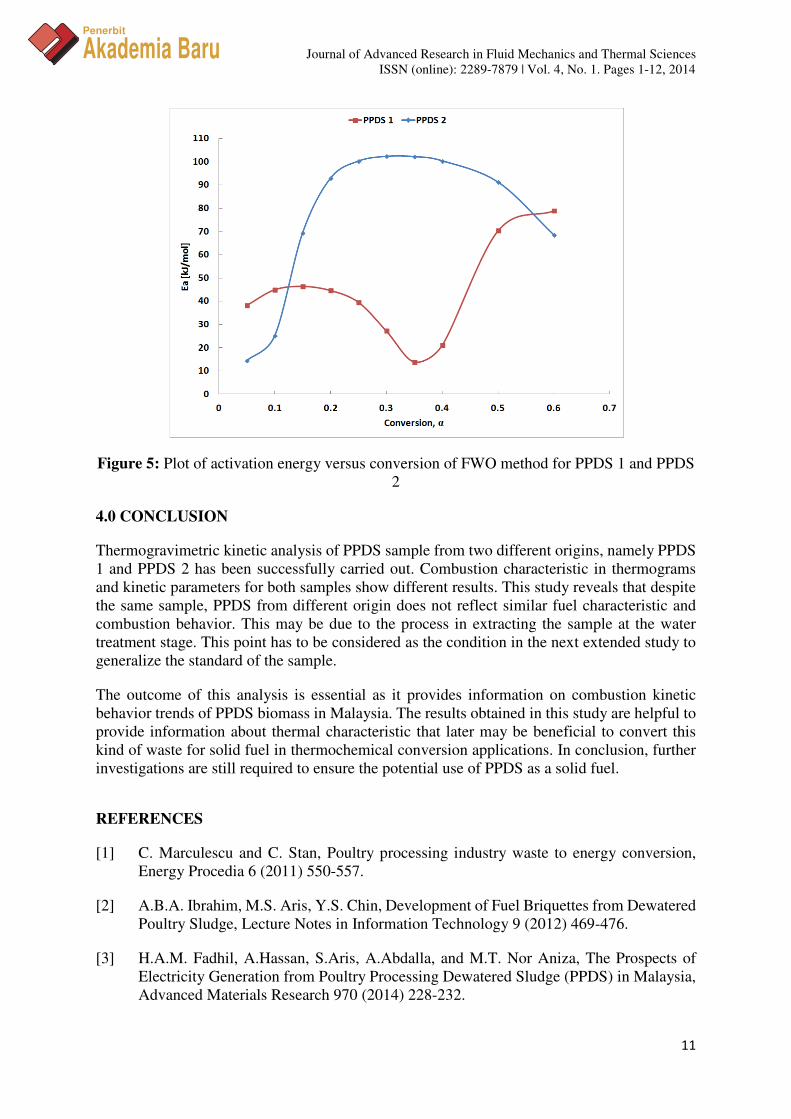
reached a slight fall at the end. The distinction of apparent activation energy with respect to the
conversion between PPDS 1 and PPDS 2 as shown in Fig. 5 reveals the fact that the thermal
decomposition of both samples progresses in different ways. This may be due to the
dissimilarity of fuel characteristic embedded in the samples as reported in Table 1. Regardless
of the method used, the average activation energy for PPDS 2 is greater than PPDS 1. Since
the activation energy defines the parameter of the minimum energy required to break down the
chemical bond between atoms, reaction with high activation energy needs more energy and
longer time to react [18]. Therefore, during the entire decomposition process, it can be
concluded that the time reaction of PPDS 1 is lesser and proceeds easier than the reaction of
Journal of Advanced Research in Fluid Mechanics and Thermal Sciences
ISSN (online): 2289-7879 | Vol. 4, No. 1. Pages 1-12, 2014
9
Penerbit
Akademia Baru
PPDS 2. In comparison between the models used, the value of activation energy obtained by
the FWO method is higher than the KAS method. In this study, it can be suggested that FWO
method is more appropriate and reliable to be applied for the activation energy calculation as
most of the correlation coefficient, C= values calculated are higher and close to 1. However,
one should focus on discussing the differences of activation energy value at every conversion,
which is related to the reaction mechanism in solid state rather than comparing the result
between the two methods used.
Figure 2: Linear fitting plot of different conversion of PPDS 1 for (a) FWO method and (b)
KAS method
Figure 3: Linear fitting plot of different conversion of PPDS 2 for (a) FWO method and (b)
KAS method
Table 3: Kinetic parameters obtained from FWO and KAS methods for PPDS 1 and PPDS 2
Conversion
(α)
Activation Energy, DE
FWO method (kJ/mol)
FG Activation Energy, DE KAS
method (kJ/mol)
FG
PPDS 1
0.05 38.22 0.967 34.79 0.957
0.1 44.98 0.976 41.67 0.970
0.15 46.42 0.979 43.05 0.973
Journal of Advanced Research in Fluid Mechanics and Thermal Sciences
ISSN (online): 2289-7879 | Vol. 4, No. 1. Pages 1-12, 2014
10
Penerbit
Akademia Baru
0.2 44.64 0.976 41.05 0.967
0.25 39.56 0.967 35.58 0.957
0.3 27.18 0.929 22.32 0.889
0.35 13.86 0.883 7.63 0.664
0.4 21.13 0.862 14.37 0.727
0.5 70.34 0.958 64.75 0.946
0.6
Average
78.90
42.52
0.977 72.76
37.80
0.971
PPDS 2
0.05 14.58 0.846 8.781 0.659
0.1 25.22 0.812 18.98 0.693
0.15 69.57 0.911 64.93 0.891
0.2 93.08 0.938 89.44 0.927
0.25 100.4 0.935 97.02 0.925
0.3 102.5 0.931 99.04 0.920
0.35 102.3 0.920 98.90 0.907
0.4 100.5 0.896 96.76 0.879
0.5 91.36 0.796 86.79 0.761
0.6
Average
68.58
76.81
0.666 61.78
72.23
0.594
Figure 4: Plot of activation energy versus conversion for FWO and KAS method of (a)
PPDS 1 and (b) PPDS 2
Journal of Advanced Research in Fluid Mechanics and Thermal Sciences
ISSN (online): 2289-7879 | Vol. 4, No. 1. Pages 1-12, 2014
11
Penerbit
Akademia Baru
Figure 5: Plot of activation energy versus conversion of FWO method for PPDS 1 and PPDS
2
4.0 CONCLUSION
Thermogravimetric kinetic analysis of PPDS sample from two different origins, namely PPDS
1 and PPDS 2 has been successfully carried out. Combustion characteristic in thermograms
and kinetic parameters for both samples show different results. This study reveals that despite
the same sample, PPDS from different origin does not reflect similar fuel characteristic and
combustion behavior. This may be due to the process in extracting the sample at the water
treatment stage. This point has to be considered as the condition in the next extended study to
generalize the standard of the sample.
The outcome of this analysis is essential as it provides information on combustion kinetic
behavior trends of PPDS biomass in Malaysia. The results obtained in this study are helpful to
provide information about thermal characteristic that later may be beneficial to convert this
kind of waste for solid fuel in thermochemical conversion applications. In conclusion, further
investigations are still required to ensure the potential use of PPDS as a solid fuel.
REFERENCES
[1] C. Marculescu and C. Stan, Poultry processing industry waste to energy conversion,
Energy Procedia 6 (2011) 550-557.
[2] A.B.A. Ibrahim, M.S. Aris, Y.S. Chin, Development of Fuel Briquettes from Dewatered
Poultry Sludge, Lecture Notes in Information Technology 9 (2012) 469-476.
[3] H.A.M. Fadhil, A.Hassan, S.Aris, A.Abdalla, and M.T. Nor Aniza, The Prospects of
Electricity Generation from Poultry Processing Dewatered Sludge (PPDS) in Malaysia,
Advanced Materials Research 970 (2014) 228-232.
Journal of Advanced Research in Fluid Mechanics and Thermal Sciences
ISSN (online): 2289-7879 | Vol. 4, No. 1. Pages 1-12, 2014
12
Penerbit
Akademia Baru
[4] M.S.A.A.H. Abbas, A.B.A. Ibrahim, M.F.H.A. Muttalib, Fuel Characterization and
Energy Prediction of Malaysian Poultry Processing, Asian Journal of Scientific
Research 6 (2013) 498-507.
[5] K. Slopiecka, P. Bartocci, and F. Fantozzi, Thermogravimetric analysis and kinetic
study of poplar wood pyrolysis, Applied Energy 97 (2012) 491-497.
[6] P. Parthasarathy, K.S. Narayanan, and L. Arockiam, Study on kinetic parameters of
different biomass samples using thermogravimetric analysis, Biomass and Bioenergy 58
(2013) 58-66.
[7] Y. El may, M. Jeguirim, S. Dorge, G. Trouvé, and R. Said, Study on the thermal behavior
of different date palm residues: Characterization and devolatilization kinetics under inert
and oxidative atmospheres, Energy 44 (2012) 702-709.
[8] H.H. Sait, A. Hussain, A.A. Salema, and F.N. Ani, Pyrolysis and combustion kinetics
of date palm biomass using thermogravimetric analysis, Bioresources Technology 118
(2012) 382-389.
[9] P. Luangkiattikhun, C. Tangsathitkulchai, and M. Tangsathitkulchai, Non-isothermal
thermogravimetric analysis of oil-palm solid wastes, Bioresources Technology 99
(2008) 986-997.
[10] M. Otero, M. E. Sanchez, X. Gómez, and a Morán, Thermogravimetric analysis of
biowastes during combustion, Waste Management 30 (2010) 1183-1187.
[11] E. Biagini, A. Fantei, and L. Tognotti, Effect of the heating rate on the devolatilization
of biomass residues, Thermochimica Acta 472 (2008) 55-63.
[12] E. Sima-Ella and T. J. Mays, Analysis of the oxidation reactivity of carbonaceous
materials using thermogravimetric analysis, Journal of Thermal Analysis and
Calorimetry 80 (2005) 109-113.
[13] A. Khawam and D. R. Flanagan, Role of isoconversional methods in varying activation
energies of solid-state kinetics, Thermochimica Acta 436 (2005) 101-112.
[14] C. D. Doyle, Estimating Isothermal Life from Thermogravimetric Data, Journal of
Applied Polymer Science VI (1962) 639-642.
[15] R. Omar, A. Idris, R. Yunus, K. Khalid, and M. I. Aida Isma, Characterization of empty
fruit bunch for microwave-assisted pyrolysis, Fuel 90 (2011) 1536-1544.
[16] A. Magdziarz and M. Wilk, Thermal characteristics of the combustion process of
biomass and sewage sludge, Journal of Thermal Analysis and Calorimetry 114 (2013)
519-529.
[17] D. K. Shen, S. Gu, B. Jin, and M. X. Fang, Thermal degradation mechanisms of wood
under inert and oxidative environments using DAEM methods, Bioresources
Technology 102 (2011) 2047-2052.

Journal of Advanced Research in Fluid Mechanics and Thermal Sciences
ISSN (online): 2289-7879 | Vol. 4, No. 1. Pages 1-12, 2014
13
Penerbit
Akademia Baru
[18] C. Gai, Y. Dong, and T. Zhang, The kinetic analysis of the pyrolysis of agricultural
residue under non-isothermal conditions, Bioresources Technology 127 (2013) 298-305.