Embed Size (px)
Citation preview
The Latest Science on The Latest Science on Energy Based SolutionsEnergy Based Solutions
for Climate Changefor Climate Change
Professor William MoomawProfessor William Moomaw
Tufts UniversityTufts University
Earth Day 2004Earth Day 2004
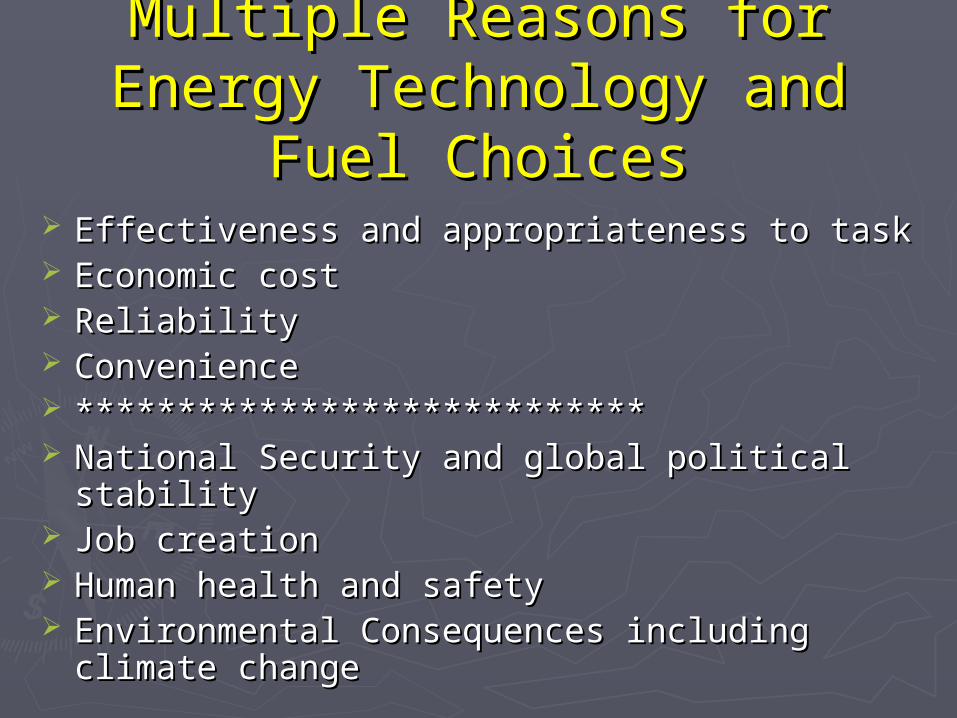
Multiple Reasons for Energy Multiple Reasons for Energy Technology and Fuel ChoicesTechnology and Fuel Choices
Effectiveness and appropriateness to taskEffectiveness and appropriateness to task Economic cost Economic cost ReliabilityReliability ConvenienceConvenience ******************************************************** National Security and global political stability National Security and global political stability Job creationJob creation Human health and safetyHuman health and safety Environmental Consequences including climate Environmental Consequences including climate
changechange

Sources of Heat Trapping Sources of Heat Trapping GasesGases
Carbon dioxide from fossil fuel burning, iron, Carbon dioxide from fossil fuel burning, iron, aluminum, ammonia and cementaluminum, ammonia and cement
Methane from agriculture (livestock and rice), Methane from agriculture (livestock and rice), waste disposal (landfills and sewage treatment), waste disposal (landfills and sewage treatment), leakage of natural gasleakage of natural gas
Nitrous oxide from nitrogen fertilizer and Nitrous oxide from nitrogen fertilizer and industrial production of nylon and nitric acidindustrial production of nylon and nitric acid
Deforestation, forest fires and loss of carbon Deforestation, forest fires and loss of carbon from agricultural soilsfrom agricultural soils
Fires in forests, coal mines and from gas flaringFires in forests, coal mines and from gas flaring
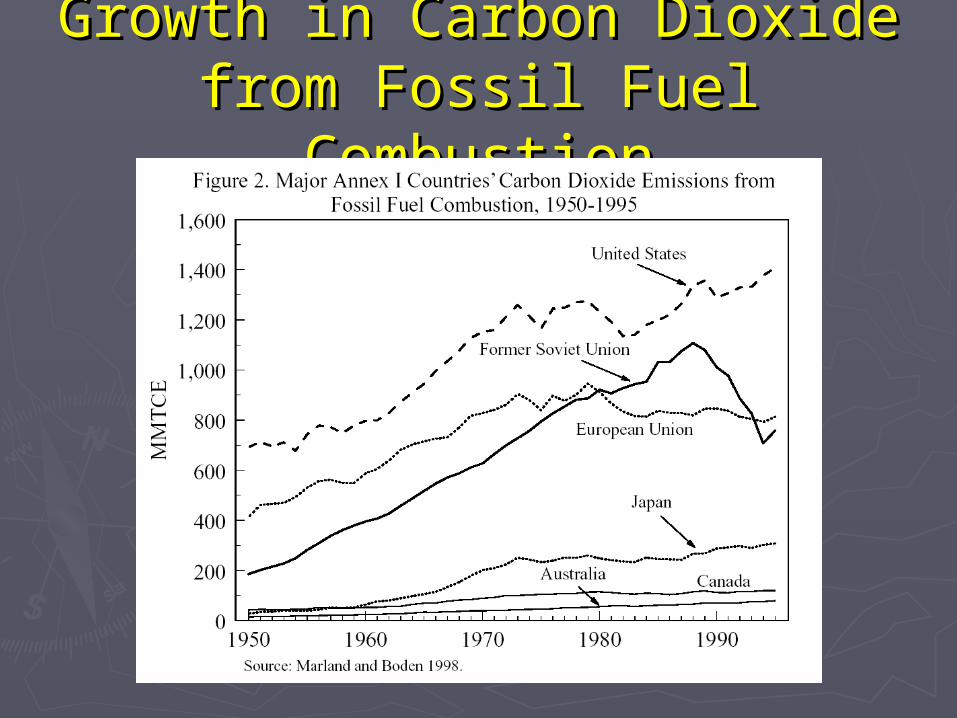
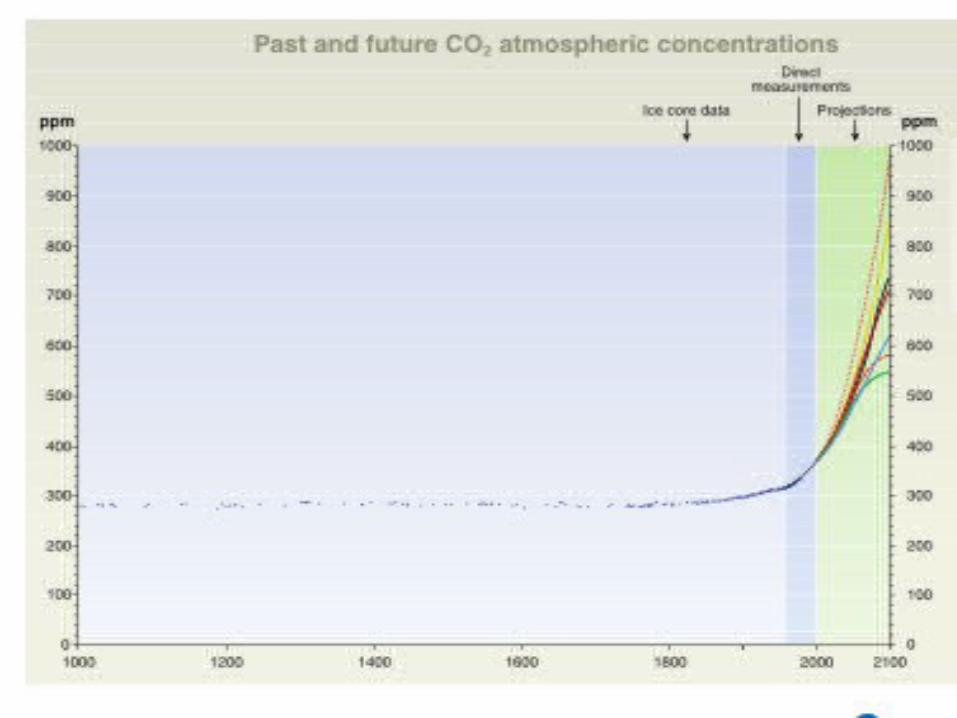
Growth in Carbon Dioxide from Growth in Carbon Dioxide from Fossil Fuel CombustionFossil Fuel Combustion


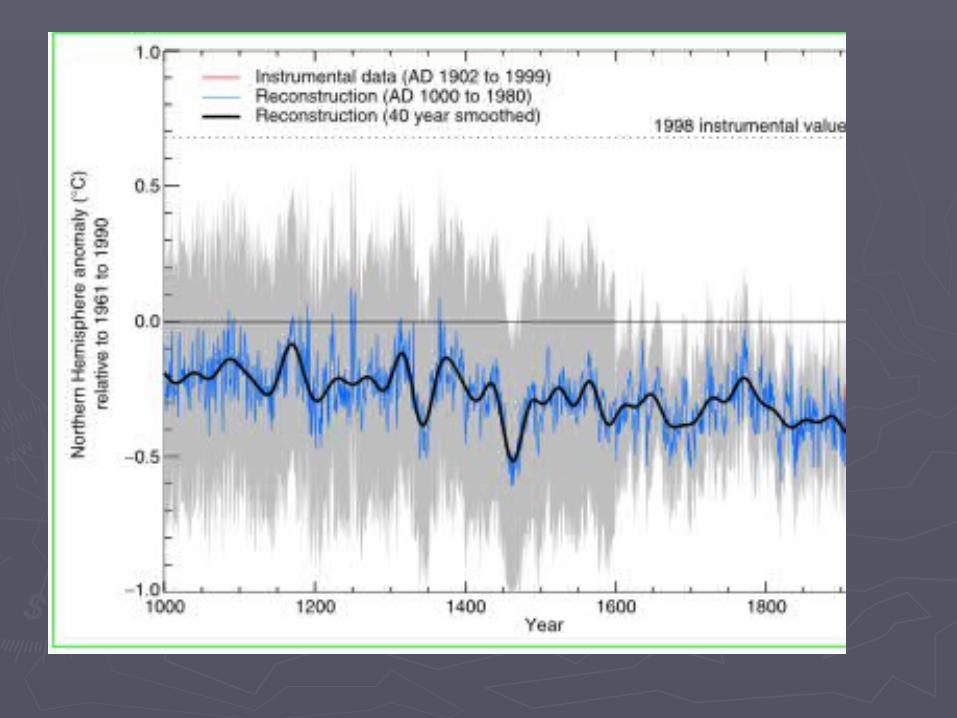

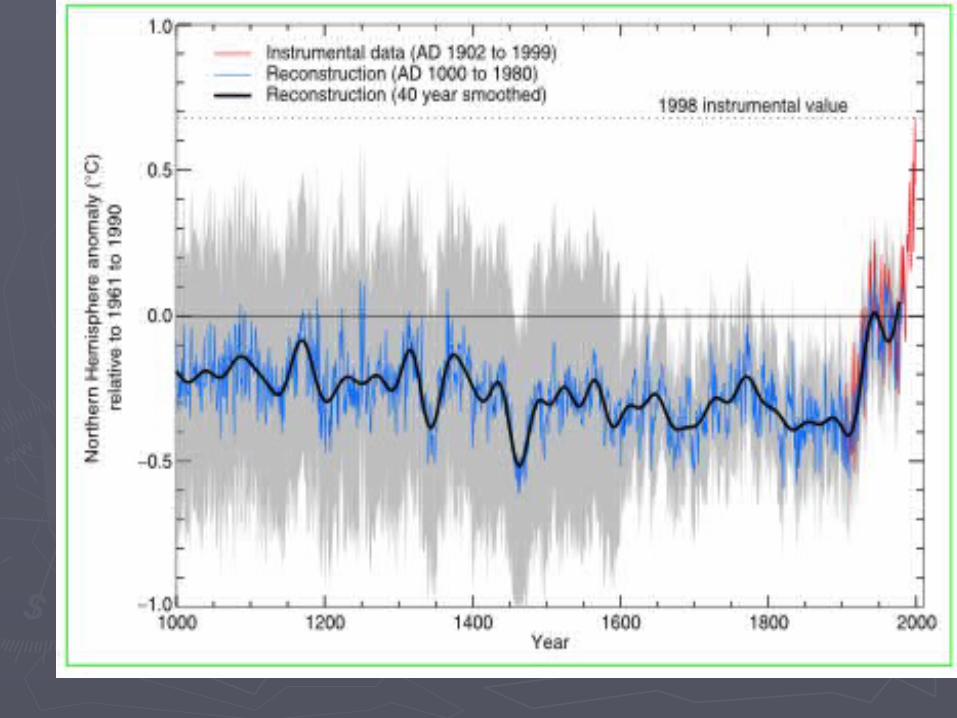
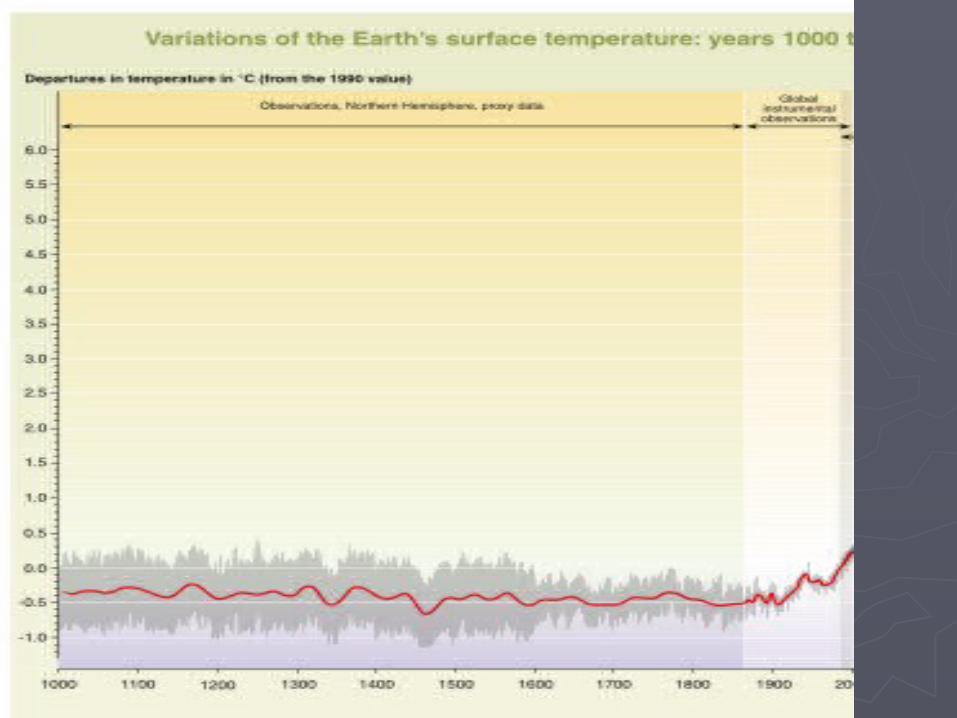

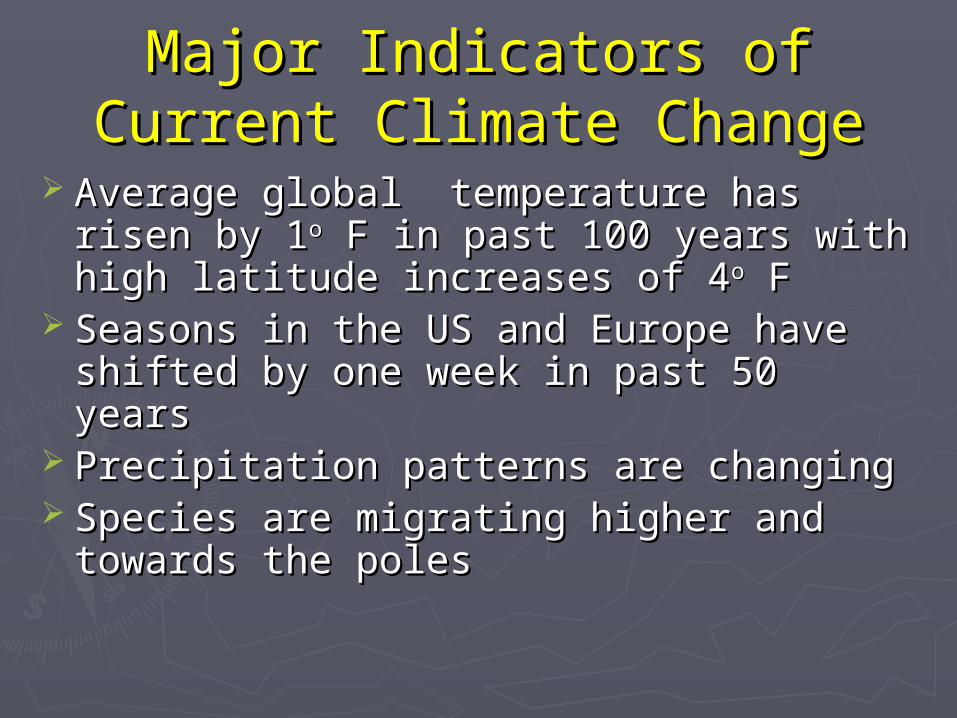
Major Indicators of Current Major Indicators of Current Climate ChangeClimate Change
Average global temperature has risen by 1Average global temperature has risen by 1oo F in past 100 years with high latitude F in past 100 years with high latitude increases of 4increases of 4oo F F
Seasons in the US and Europe have shifted Seasons in the US and Europe have shifted by one week in past 50 years by one week in past 50 years
Precipitation patterns are changingPrecipitation patterns are changing Species are migrating higher and towards Species are migrating higher and towards
the poles the poles
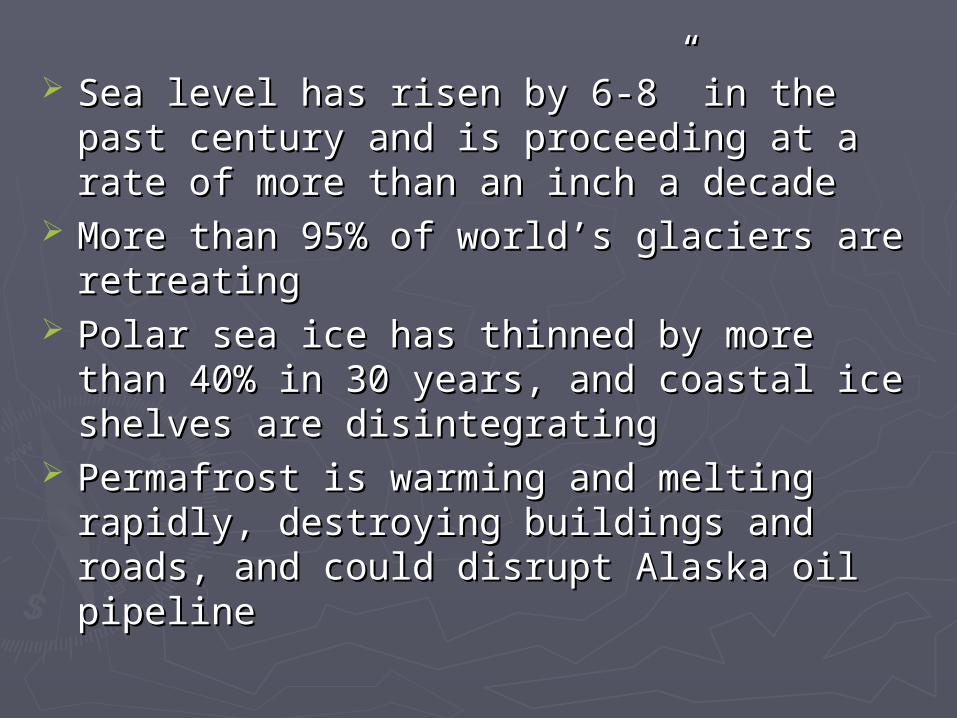
Sea level has risen by 6-8” in the past century and Sea level has risen by 6-8” in the past century and is proceeding at a rate of more than an inch a is proceeding at a rate of more than an inch a decade decade
More than 95% of world’s glaciers are retreatingMore than 95% of world’s glaciers are retreating Polar sea ice has thinned by more than 40% in 30 Polar sea ice has thinned by more than 40% in 30
years, and coastal ice shelves are disintegratingyears, and coastal ice shelves are disintegrating Permafrost is warming and melting rapidly, Permafrost is warming and melting rapidly,
destroying buildings and roads, and could disrupt destroying buildings and roads, and could disrupt Alaska oil pipelineAlaska oil pipeline
How Can We Assess How Can We Assess Technologies?Technologies?
Many technologies have been evaluated Many technologies have been evaluated under controlled conditions by industry, under controlled conditions by industry, government and university researchers for government and university researchers for their performance, cost and effectiveness in their performance, cost and effectiveness in reducing heat trapping gases and other reducing heat trapping gases and other pollutants.pollutants.
These studies have been reviewed by These studies have been reviewed by independent energy and engineering independent energy and engineering experts, and additional tests have been experts, and additional tests have been conducted.conducted.

Identify Emissions by Sector Identify Emissions by Sector 1995 (IPCC)1995 (IPCC)
Global shareGlobal share Annual growthAnnual growth Building sector 31% (+1.0%/year)Building sector 31% (+1.0%/year) Transport sector 22% (+2.4%/year)Transport sector 22% (+2.4%/year) Industrial sector 43% (+0.4%/year)Industrial sector 43% (+0.4%/year) Agricultural sector 4% (+0.6%/year)Agricultural sector 4% (+0.6%/year)
{Electric power 31% for generation{Electric power 31% for generationNote this is included in first four categories}Note this is included in first four categories}

Basic StrategiesBasic Strategies
Make existing emitting technologies more Make existing emitting technologies more efficient in the use and production of energyefficient in the use and production of energy
Change processes to reduce non-energy Change processes to reduce non-energy emissions from industry and agricultureemissions from industry and agriculture
Shift to new technologies and fuels that emit Shift to new technologies and fuels that emit little or no heat trapping gaseslittle or no heat trapping gases
Sequester carbon dioxide in forests, soils or Sequester carbon dioxide in forests, soils or geological reservoirsgeological reservoirs
Identify Effective StrategiesIdentify Effective Strategies
Reduce emissions of heat trapping Reduce emissions of heat trapping gases by utilizing technologies that gases by utilizing technologies that are more efficientare more efficient
Shift standards and incentives to Shift standards and incentives to construct buildings that use 30-70% construct buildings that use 30-70% less energy for heating and coolingless energy for heating and cooling
Purchase appliances that use 10-80% Purchase appliances that use 10-80% less energyless energy
Identify Effective StrategiesIdentify Effective Strategies Build electric power generating systems that use 30% Build electric power generating systems that use 30%
less fuel, or which utilize currently wasted heat from less fuel, or which utilize currently wasted heat from coal and natural gas power plants for heating and coal and natural gas power plants for heating and coolingcooling
Buy vehicles that get 50 to 100% more miles per gallonBuy vehicles that get 50 to 100% more miles per gallon Shift to cost effective industrial processes that use 50% Shift to cost effective industrial processes that use 50%
less energy and release much less process gasesless energy and release much less process gases Improve agriculture and waste management practicesImprove agriculture and waste management practices
Buildings (31%) Buildings (31%) (potential reductions 30-70%)(potential reductions 30-70%)
Orientation to optimize use of sun and wind Orientation to optimize use of sun and wind for passive heating, cooling and ventilationfor passive heating, cooling and ventilation
Effective insulation to reduce need for Effective insulation to reduce need for excess heating or coolingexcess heating or cooling
Efficient, well located windows that reduce Efficient, well located windows that reduce need for artificial lighting, and maintain need for artificial lighting, and maintain appropriate temperatures in all seasonsappropriate temperatures in all seasons
Controlled ventilation with heat recovery Controlled ventilation with heat recovery CostCost of saving 40% of energy use is of saving 40% of energy use is one-one-
fifthfifth the cost of supplying that energy the cost of supplying that energy

Where do we spend $ on Where do we spend $ on our home energy bills?our home energy bills?

Energy Star Refrigerators IEnergy Star Refrigerators I
“Replacing a 10-year old refrigerator bought in 1990 with a new ENERGY STAR qualified model would save enough energy to light the average household for over three months and (prevent) over 300 pounds of pollution each year.”
Improving energy efficiency standards have driven this efficiency improvement trend.
Energy Star Refrigerators IIEnergy Star Refrigerators II
Electricity cost savings are $120 per year, while additional purchase price is $100-$200.
Economic payback is eight years or less. Purchase stimulates the economy and
create jobs. Provides air pollution and global warming
benefits through lower energy use Protects ozone layer by replacing CFCs.

Appliance Efficiency Appliance Efficiency ImprovementImprovement

Appliance Efficiency InformationAppliance Efficiency Information

Efficient Appliances -WashersEfficient Appliances -Washers
Most efficient clothes washer uses 70% less Most efficient clothes washer uses 70% less electricity than does least efficient available.electricity than does least efficient available.
Spins clothes drier, thereby reducing drier Spins clothes drier, thereby reducing drier time and energy usetime and energy use
It uses 85% less water, saving 16,000 It uses 85% less water, saving 16,000 gallons per yeargallons per year
It gets clothes cleanerIt gets clothes cleaner It costs twice as muchIt costs twice as much
Transportation(22%)Transportation(22%)(potential reductions 50-100%)(potential reductions 50-100%)
Transportation accounts for 22% of global Transportation accounts for 22% of global carbon dioxide emissions and 33% of US carbon dioxide emissions and 33% of US emissions.emissions.
It is the fastest growing sector in terms of It is the fastest growing sector in terms of emissions.emissions.
Transportation depends on petroleum for Transportation depends on petroleum for 97% of its fuel97% of its fuel

History of Vehicle Efficiency History of Vehicle Efficiency GainsGains
Following the oil shocks, US autos doubled Following the oil shocks, US autos doubled efficiency from 13.5 mpg to 27.5 mpg in 10 efficiency from 13.5 mpg to 27.5 mpg in 10 years.years.
Air pollution emissions dropped by 90%, and Air pollution emissions dropped by 90%, and vehicles are available today that have vehicles are available today that have reduced pollution by 99%.reduced pollution by 99%.
Safety increased through improved crash Safety increased through improved crash resistance, seat belts and air bags.resistance, seat belts and air bags.
Power and performance increasedPower and performance increased
Potential for Future GainsPotential for Future Gains Current technologies could Current technologies could increase auto & light increase auto & light
truck fuel efficiency in the near term by 50-truck fuel efficiency in the near term by 50-100%100% without changing weight, size or without changing weight, size or performance.performance. Hybrid gasoline electricHybrid gasoline electric Continuously variable transmissionContinuously variable transmission Improved tires and aerodynamicsImproved tires and aerodynamics Shift from gasoline to new diesel for 25% improvement Shift from gasoline to new diesel for 25% improvement
Weight reductions could bring about additional Weight reductions could bring about additional savings by a similar, additional factor.savings by a similar, additional factor.
Heavy trucks could increase efficiency 60%Heavy trucks could increase efficiency 60% Fuel cells are low emitting, but in 10 yrs.Fuel cells are low emitting, but in 10 yrs.
Industrial Emissions (43%)Industrial Emissions (43%)(potential reductions of 10-65%)(potential reductions of 10-65%)
Industry accounts for 43% of all carbon dioxide Industry accounts for 43% of all carbon dioxide emissions, but emissions are emissions, but emissions are fallingfalling by 0.8% per by 0.8% per year in industrial countries.year in industrial countries.
In theIn the industrial world, carbon dioxide from world, carbon dioxide from industry industry decreaseddecreased by 9% between 1971 and by 9% between 1971 and 1995, even though energy use rose 17% and 1995, even though energy use rose 17% and industrial output doubled.industrial output doubled.
Energy and CO2 emissions are falling in Energy and CO2 emissions are falling in China by similar amounts as inefficient, by similar amounts as inefficient, uncompetitive industries are replaced.uncompetitive industries are replaced.
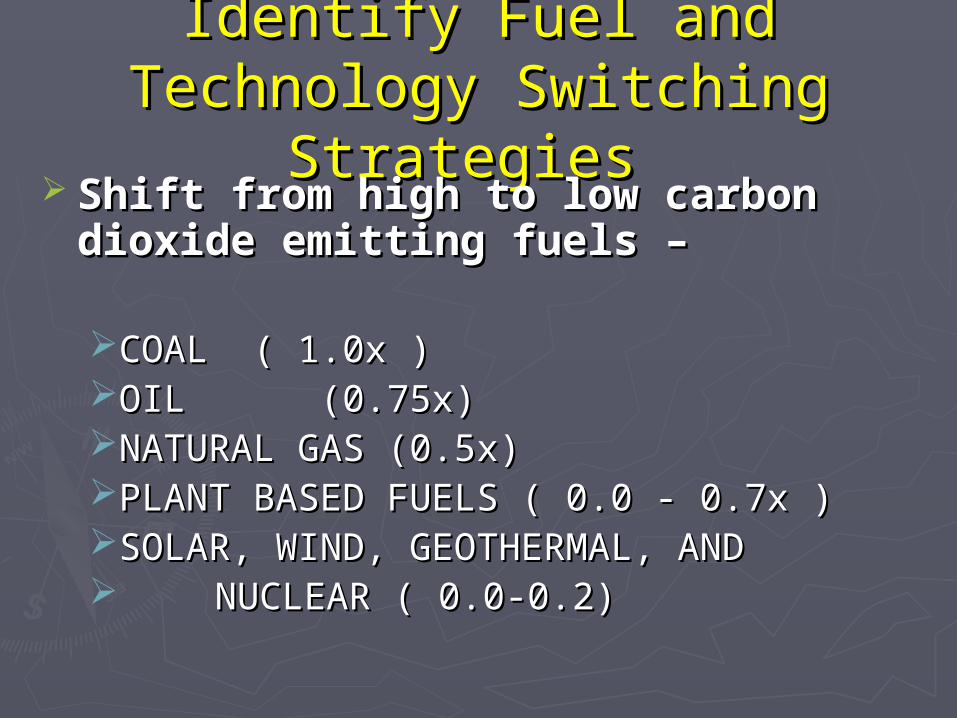
Identify Fuel and Technology Identify Fuel and Technology Switching StrategiesSwitching Strategies
Shift from high to low carbon dioxide Shift from high to low carbon dioxide emitting fuels – emitting fuels –
COAL ( 1.0x )COAL ( 1.0x )OIL (0.75x)OIL (0.75x)NATURAL GAS (0.5x) NATURAL GAS (0.5x) PLANT BASED FUELS ( 0.0 - 0.7x )PLANT BASED FUELS ( 0.0 - 0.7x )SOLAR, WIND, GEOTHERMAL, ANDSOLAR, WIND, GEOTHERMAL, AND NUCLEAR ( 0.0-0.2)NUCLEAR ( 0.0-0.2)

Relative CO2 Emissions to Relative CO2 Emissions to Produce the Same EnergyProduce the Same Energy
0.0
0.2
0.4
0.6
0.8
1.0
Relative CO2 per Unit of
Energy
Coal Oil Nat. gas Plants S, W, H,G, N
Electric Power Production (2000)Electric Power Production (2000)
Coal generates 38% of global electricity Coal generates 38% of global electricity (55% in US) but produces 70% of world’s (55% in US) but produces 70% of world’s electric power CO2.electric power CO2.
Natural gas generates 18% of global Natural gas generates 18% of global electricity and 19% of electric power CO2. electricity and 19% of electric power CO2.
Oil generates 9% of global electricity and Oil generates 9% of global electricity and 11% of electricity CO2.11% of electricity CO2.
Hydropower, nuclear power and renewable Hydropower, nuclear power and renewable sources produce 35% of global electricity sources produce 35% of global electricity and no direct CO2.and no direct CO2.

010203040506070
Per cent Electricty and CO2
Coal Gas Oil S,W, H,G, N
Electric Power Generation Fuels
owe
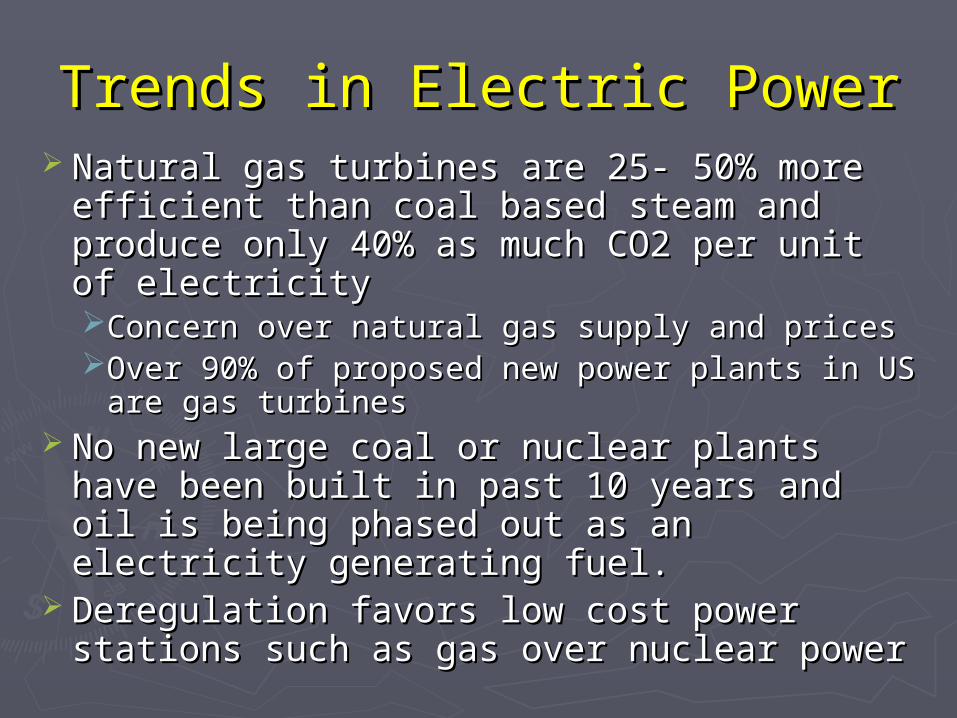
Trends in Electric PowerTrends in Electric Power Natural gas turbines are 25- 50% more Natural gas turbines are 25- 50% more
efficient than coal based steam and produce efficient than coal based steam and produce only 40% as much CO2 per unit of electricityonly 40% as much CO2 per unit of electricityConcern over natural gas supply and pricesConcern over natural gas supply and pricesOver 90% of proposed new power plants in US Over 90% of proposed new power plants in US
are gas turbinesare gas turbines No new large coal or nuclear plants have No new large coal or nuclear plants have
been built in past 10 years and oil is being been built in past 10 years and oil is being phased out as an electricity generating fuel.phased out as an electricity generating fuel.
Deregulation favors low cost power stations Deregulation favors low cost power stations such as gas over nuclear power such as gas over nuclear power

Wind Generated Electric PowerWind Generated Electric Power
Wind is the fastest growing electric power source in Wind is the fastest growing electric power source in percentage terms increasing at 25%/year.percentage terms increasing at 25%/year.
Installed wind capacity passed 31,000 MW by end of Installed wind capacity passed 31,000 MW by end of 2002 - three years ahead of predictions.2002 - three years ahead of predictions.
Over 20% of electricity in Denmark and parts of Over 20% of electricity in Denmark and parts of Germany are now supplied by wind.Germany are now supplied by wind.
The US had 90% of wind electric capacity in 1990, but The US had 90% of wind electric capacity in 1990, but dropped to third place behind Germany and Spain last dropped to third place behind Germany and Spain last year.year.
Plains states and off-shore wind parks have great Plains states and off-shore wind parks have great potential for production of wind electricity at a cost of potential for production of wind electricity at a cost of 4cents/kwh which is competitive with clean coal.4cents/kwh which is competitive with clean coal.
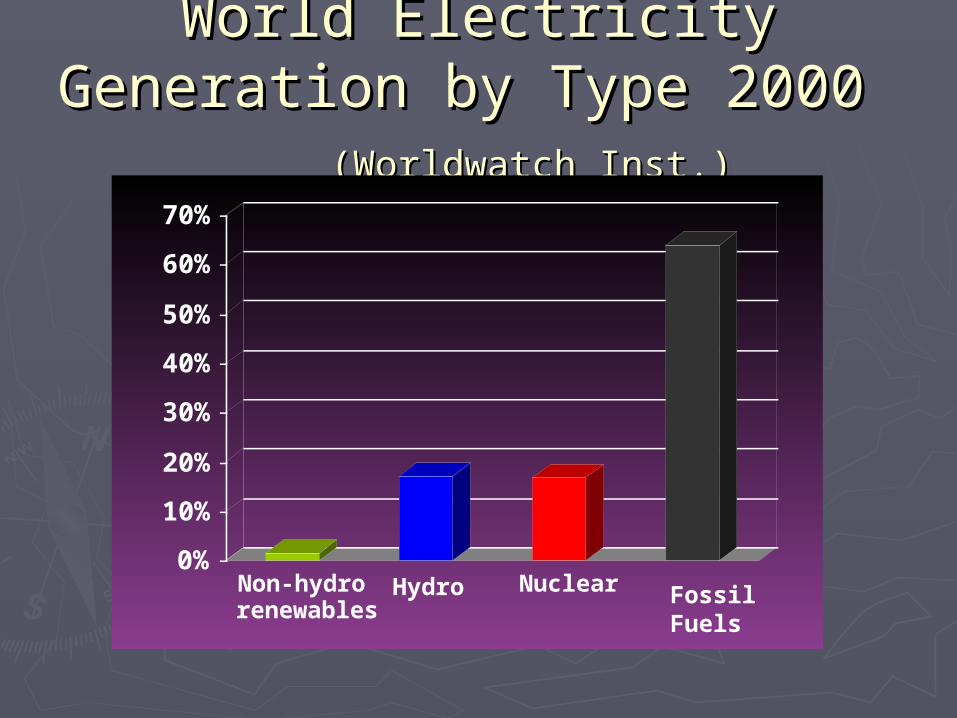
World Electricity Generation by World Electricity Generation by Type 2000 Type 2000 (Worldwatch Inst.)(Worldwatch Inst.)
0%
10%
20%
30%
40%
50%
60%
70%
Non-hydrorenewables
NuclearHydro Fossil Fuels
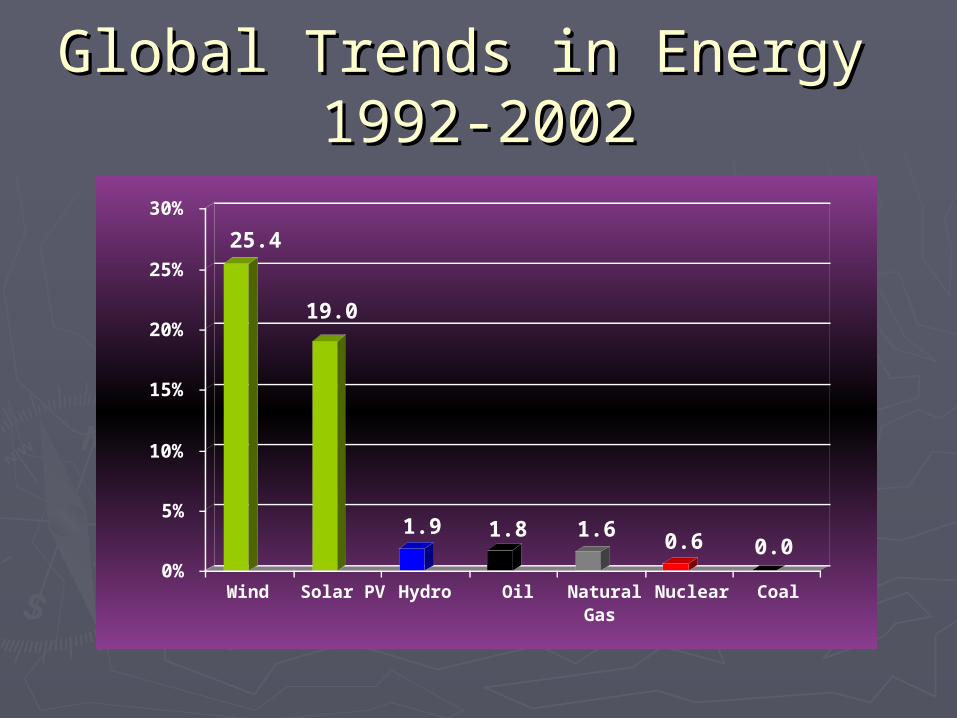
Global Trends in Energy Global Trends in Energy 1992-20021992-2002
25.4
19.0
1.9 1.8 1.6 0.6 0.00%
5%
10%
15%
20%
25%
30%
Wind Solar PV Hydro Oil NaturalGas
Nuclear Coal
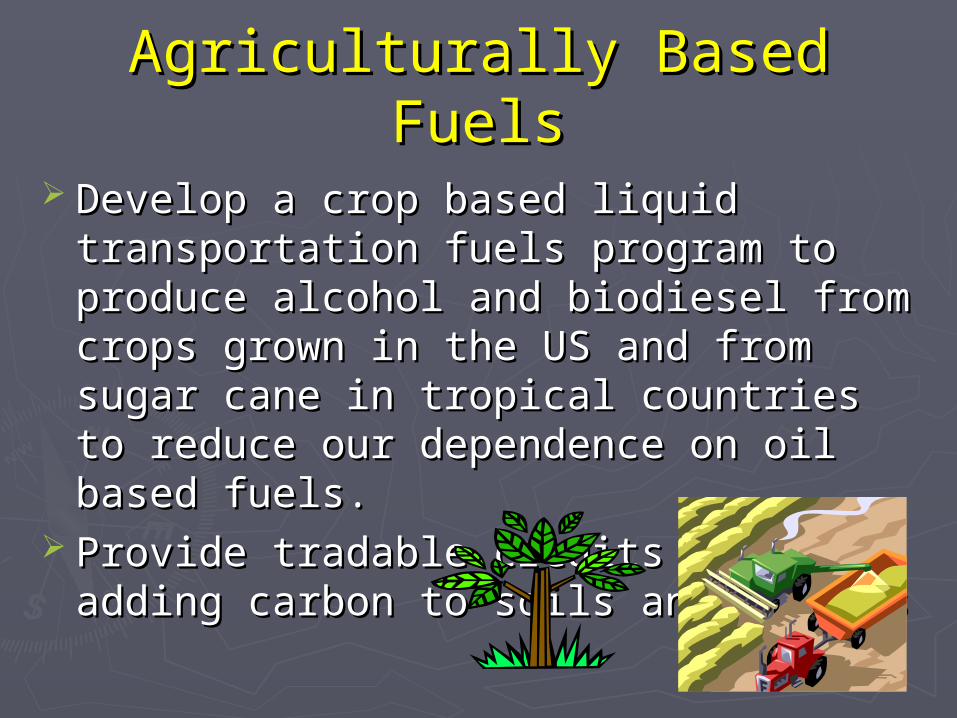
Agriculturally Based FuelsAgriculturally Based Fuels
Develop a crop based liquid transportation Develop a crop based liquid transportation fuels program to produce alcohol and fuels program to produce alcohol and biodiesel from crops grown in the US and biodiesel from crops grown in the US and from sugar cane in tropical countries to from sugar cane in tropical countries to reduce our dependence on oil based fuels.reduce our dependence on oil based fuels.
Provide tradable credits for adding carbon to Provide tradable credits for adding carbon to soils and forestssoils and forests
Multiple Benefits of BiofuelsMultiple Benefits of Biofuels
Creates jobs, lowers dependence on Creates jobs, lowers dependence on unstable regions of the world for petroleum, unstable regions of the world for petroleum, promotes trade, adds value to US economy, promotes trade, adds value to US economy, increases farm incomes, reduces need for increases farm incomes, reduces need for farm subsidies - farm subsidies - andand lowers CO2 emissions. lowers CO2 emissions.
An Integrated Economic Rural An Integrated Economic Rural Development StrategyDevelopment Strategy
Develop large wind turbine generation Develop large wind turbine generation capacity on agricultural lands and public or capacity on agricultural lands and public or private rangelands in Great Plains states - private rangelands in Great Plains states - Also continue to produce grain and cattle.Also continue to produce grain and cattle.
Develop international alcohol auto fuel from Develop international alcohol auto fuel from sugar cane for tropical developing countriessugar cane for tropical developing countries

Economic Implications of Economic Implications of Emissions ReductionsEmissions Reductions
The Intergovernmental Panel on Climate Change The Intergovernmental Panel on Climate Change has verified hundreds of currently existing has verified hundreds of currently existing technologies and measures capable of slowing technologies and measures capable of slowing and reversing the rise in greenhouse gases.and reversing the rise in greenhouse gases.
The technological potential exists to reduce The technological potential exists to reduce carbon dioxide emissions by nearly 30% world-carbon dioxide emissions by nearly 30% world-wide by 2010.wide by 2010.
Half of these reductions could be achieved at a Half of these reductions could be achieved at a savings or zero cost, the remainder would cost savings or zero cost, the remainder would cost zero to the equivalent of 25 cents/gal. gasoline. zero to the equivalent of 25 cents/gal. gasoline.
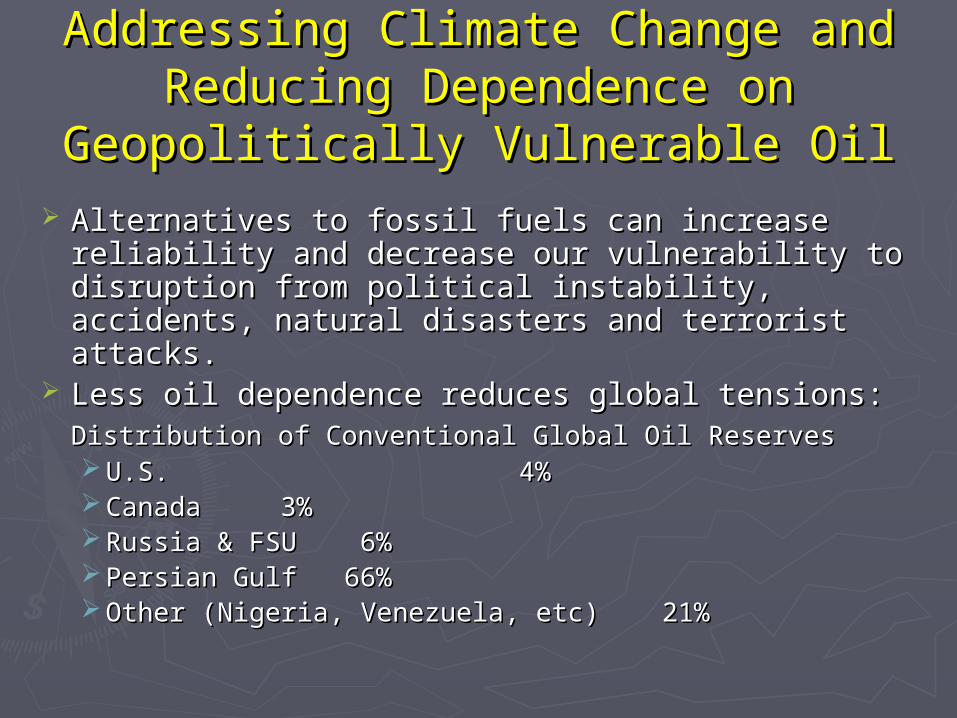
Addressing Climate Change and Addressing Climate Change and Reducing Dependence on Geopolitically Reducing Dependence on Geopolitically
Vulnerable OilVulnerable Oil
Alternatives to fossil fuels can increase reliability and Alternatives to fossil fuels can increase reliability and decrease our vulnerability to disruption from political decrease our vulnerability to disruption from political instability, accidents, natural disasters and terrorist instability, accidents, natural disasters and terrorist attacks.attacks.
Less oil dependence reduces global tensions:Less oil dependence reduces global tensions:Distribution of Conventional Global Oil ReservesDistribution of Conventional Global Oil Reserves U.S. U.S. 4% 4% CanadaCanada 3% 3% Russia & FSURussia & FSU 6% 6% Persian GulfPersian Gulf 66%66% Other (Nigeria, Venezuela, etc)Other (Nigeria, Venezuela, etc) 21%21%

Meeting Climate, Security and Meeting Climate, Security and Economic GoalsEconomic Goals
It is possible to introduce new technology in It is possible to introduce new technology in the natural replacement cycle of capital the natural replacement cycle of capital stock such as cars, appliances, buildings stock such as cars, appliances, buildings and power plants that substantially reduce and power plants that substantially reduce heat trapping gas emissions.heat trapping gas emissions.
Choices can be made that increase national Choices can be made that increase national security and global political stability, provide security and global political stability, provide jobs and improve the economy of the United jobs and improve the economy of the United States.States.
National Energy Policy InitiativeNational Energy Policy Initiative
In March 2002,a non-partisan, independent group In March 2002,a non-partisan, independent group of energy experts released a report on Capitol Hill.of energy experts released a report on Capitol Hill.
They suggested that America could meet our long-They suggested that America could meet our long-term energy and national security goals while term energy and national security goals while addressing climate change by developing policies addressing climate change by developing policies supportive of new technologies and practices.supportive of new technologies and practices.
The plan has been endorsed by former members The plan has been endorsed by former members of the Carter, Reagan, first Bush and Clinton of the Carter, Reagan, first Bush and Clinton administrations along with 75 additional energy administrations along with 75 additional energy experts from industry and universities.experts from industry and universities.
http://www.nepinitiative.org/ http://www.nepinitiative.org/

More InformationMore Information
To find out more:
www.tufts.edu/tci
http://www.ipcc.ch
http://www.nepinitiative.org