Embed Size (px)
Citation preview

The LLNL FMD Decision Support System: Concise Description of Features and Output
DIMACS Workshop March 2006“Data Mining and Epidemiological Modeling”
Tanya Kostova
T. Bates, C. Melius, S. Smith, A. Robertson, S. Hazlett, P. Hullinger, Lawrence Livermore National Laboratory

LLNL is developing a decision support system for evaluation of the economic impact of FMD epidemics
•Effort funded by the Department of Homeland Security
•DHS has numerous S&T investments in research projects for agriculture security countermeasures and requires tools to help evaluate future investments
•Numerous FMD epidemiological models exist but…
–They are not national in scale
–Current models target natural or accidental introduction not an intentional act
–Epidemiological and economic models are not coupled
GENERAL FEATURES OF THE EPIDEMIC MODEL
Agent-based spatially-explicit discrete-time computational model
Time progresses in increments of 1 unit (=1 day)

GENERAL FEATURES
Agent-based spatially-explicit discrete-time computational model
Time progresses in increments of 1 unit (=1 day)
In a time stepping agent based model, at each time increment some of the agents change some of their attributes depending on their previous state and on the previous states of some of the other agents.
GENERAL FEATURES
The FMD model agents are the animal facilities.
Facilities are groups of animals managed in a specific manner.
Agent-based spatially-explicit discrete-time computational model
Time progresses in increments of 1 unit (=1 day)
In a time stepping agent based model, at each time increment some of the agents change some of their attributes depending on their previous state and on the previous states of some of the other agents.
Farms, Markets, Feedlots, Slaughter houses …
THE ATTRIBUTES OF THE FACILITY AGENT
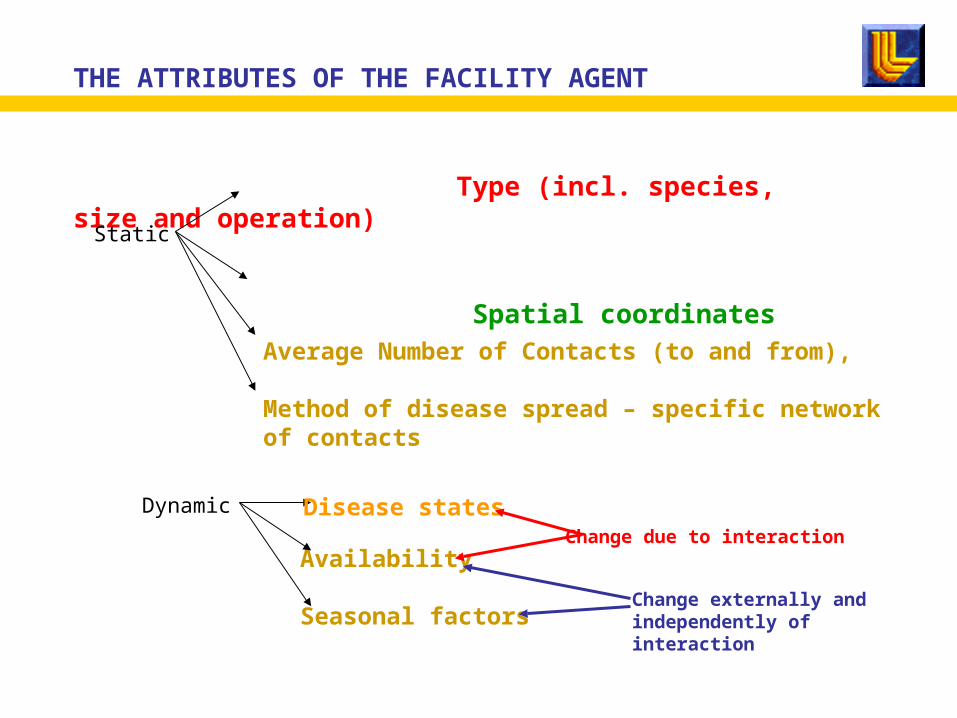
Type (incl. species, size and operation) Spatial coordinates
Static
Dynamic Disease states
Average Number of Contacts (to and from),
Method of disease spread – specific network of contacts
Availability
Seasonal factors
Change due to interaction
Change externally and independently of interaction
THE ATTRIBUTES OF THE FACILITY AGENT
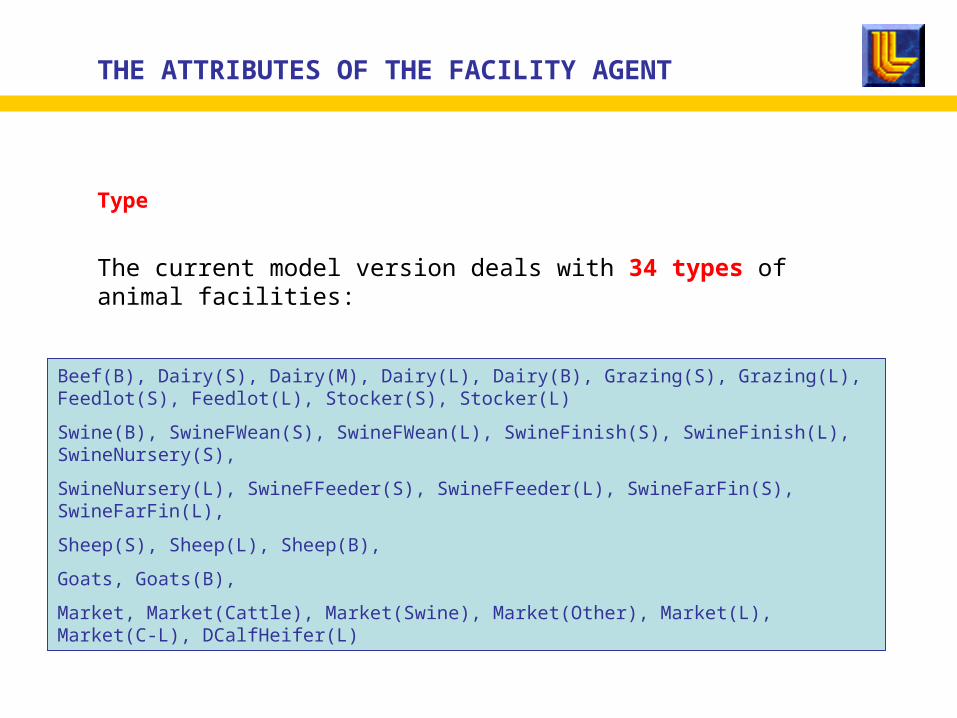
Type
The current model version deals with 34 types of animal facilities:
Beef(B), Dairy(S), Dairy(M), Dairy(L), Dairy(B), Grazing(S), Grazing(L), Feedlot(S), Feedlot(L), Stocker(S), Stocker(L)
Swine(B), SwineFWean(S), SwineFWean(L), SwineFinish(S), SwineFinish(L), SwineNursery(S),
SwineNursery(L), SwineFFeeder(S), SwineFFeeder(L), SwineFarFin(S), SwineFarFin(L),
Sheep(S), Sheep(L), Sheep(B),
Goats, Goats(B),
Market, Market(Cattle), Market(Swine), Market(Other), Market(L), Market(C-L), DCalfHeifer(L)

Beef (S)
The spatial coordinates of each facility are exact “up to the county level”
The NASS data supplies the numbers of different facility types in each county
Swine (S)
Dairy (S)
There are 1.2M facilities (according to NASS data) with 160M animals.
These do not include markets which come from another database.
Thus, we model 1.2M+ facilities and their contacts.
THE ATTRIBUTES OF THE FACILITY AGENT

Hogs and pigsCattle and cowsSheep
The spatial coordinates of the facilities are generated using a random algorithm based on the county-based data.
THE ATTRIBUTES OF THE FACILITY AGENT

THE ATTRIBUTES OF THE FACILITY AGENT
Type (incl. species, size and operation) Spatial coordinates
Static
Dynamic Disease states
Average Number of Contacts (to and from),
Method of disease spread – specific network of contacts
Availability
Seasonal factors
Change due to interaction
Change externally and independently of interaction
THE ATTRIBUTES OF THE FACILITY AGENT
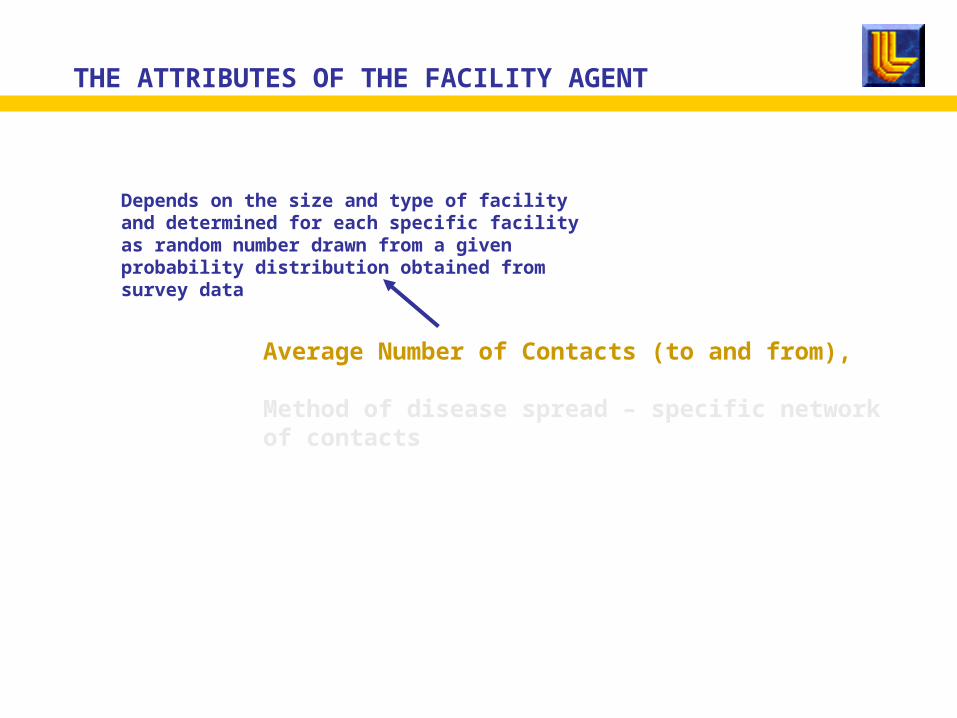
Average Number of Contacts (to and from),
Method of disease spread – specific network of contacts
Depends on the size and type of facility and determined for each specific facility as random number drawn from a given probability distribution obtained from survey data

THE ATTRIBUTES OF THE FACILITY AGENT
Average Number of Contacts (to and from)
Method of disease spread – specific network of contacts
Depends on the size and type of facility and determined for each specific facility as random number drawn from a given probability distribution obtained from survey data
Direct (regional and inter-state)
Indirect (high risk and low risk)

THE ATTRIBUTES OF THE FACILITY AGENT
Type (incl. species, size and operation) Spatial coordinates
Static
Dynamic Disease states
Average Number of Contacts (to and from),
Method of disease spread – specific network of contacts
Availability
Seasonal factors
Change due to interaction
Change externally and independently of interaction

THE ATTRIBUTES OF THE FACILITY AGENT
Disease states
Susceptible Latent(infected)
Subclinically infectious Clinically
infectious
Immune
Infection
Waning of immunity
Vaccinated
SuspectedConfirmedCulledS - Susceptible (healthy)L- LatentU- Subclinically infectiousI- Clinically infectiousW – Vaccinated and susceptibleV- Vaccinated M- ImmuneP- SuspectedF- ConfirmedX - Culled ?

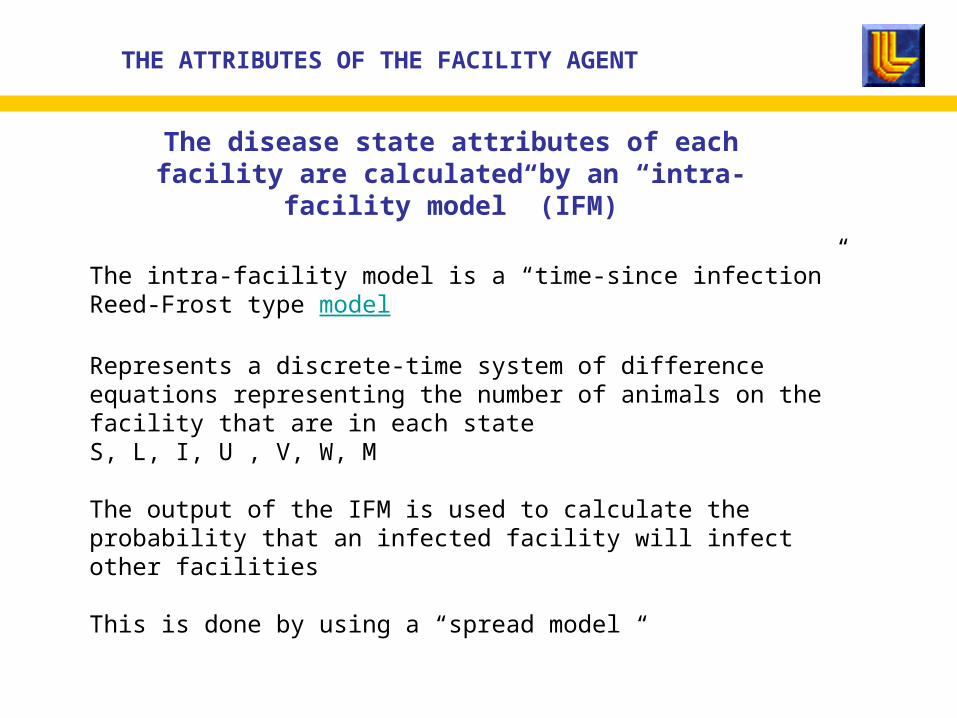
The disease state attributes of each facility are calculated by an “intra-facility model” (IFM)
THE ATTRIBUTES OF THE FACILITY AGENT
The intra-facility model is a “time-since infection” Reed-Frost type model
Represents a discrete-time system of difference equations representing the number of animals on the facility that are in each state S, L, I, U , V, W, M
The intra-facility model is a “time-since infection” Reed-Frost type model
Represents a discrete-time system of difference equations representing the number of animals on the facility that are in each state S, L, I, U , V, W, M
The output of the IFM is used to calculate the probability that an infected facility will infect other facilities
This is done by using a “spread model “
The disease state attributes of each facility are calculated by an “intra-facility model” (IFM)
THE ATTRIBUTES OF THE FACILITY AGENT

THE ATTRIBUTES OF THE FACILITY AGENT
Average Number of Contacts (to and from)
Method of disease spread – specific network of contacts
Availability
Seasonal factors
These attributes are used by the Spread Model to calculate the newly infected facilities

Infected agents can spread the epidemic via various methods along method-specific networks
For each method, the infection can be spread within a predefined set of facilities specific to the method.
Thus, an infected facility will spread the infection to the facilities within the networks to which it belongs.
Examples of methods - direct (movement of animals) - indirect: personnel movements; - inter-state direct movements “Truck routes”
network
“Vet routes”network
infected not infected
The Spread Model calculates the newly infected facilities

The epidemic spread is modeled by a random process
Uses information about the Average Number of adequate Contacts ANC of the infected facility by each of the methods
The daily number of adequate contacts RANCmi is obtained from a Poisson process with mean ANC
For each method of infection m
For each infected facility i:
- A probability density function Pmi(j)
defined on each of the nodes j of the
network Smi of m and i is calculated
- For each node j of Smi the probability Cmj
is calculated
Pmi(j) is the probability that facility j will get a contact with facility i by method m. Distance dependent
Cmj is the probability that an
adequate contact to facility j will cause infection.
Pmi(j) is used in a roulette algorithm to determine which facilities receive an adequate contact
Cmj is used to determine which of the contacted facilities become infected
RANCmi, Pmi(j) and Cmj are used to trace back the cause of infection of j
A contact originating from a facility that can cause infection is an adequate contact.
An adequate contact that actually infects a target facility is an effective contact.
STEP
1
STEP
2
STEP
3
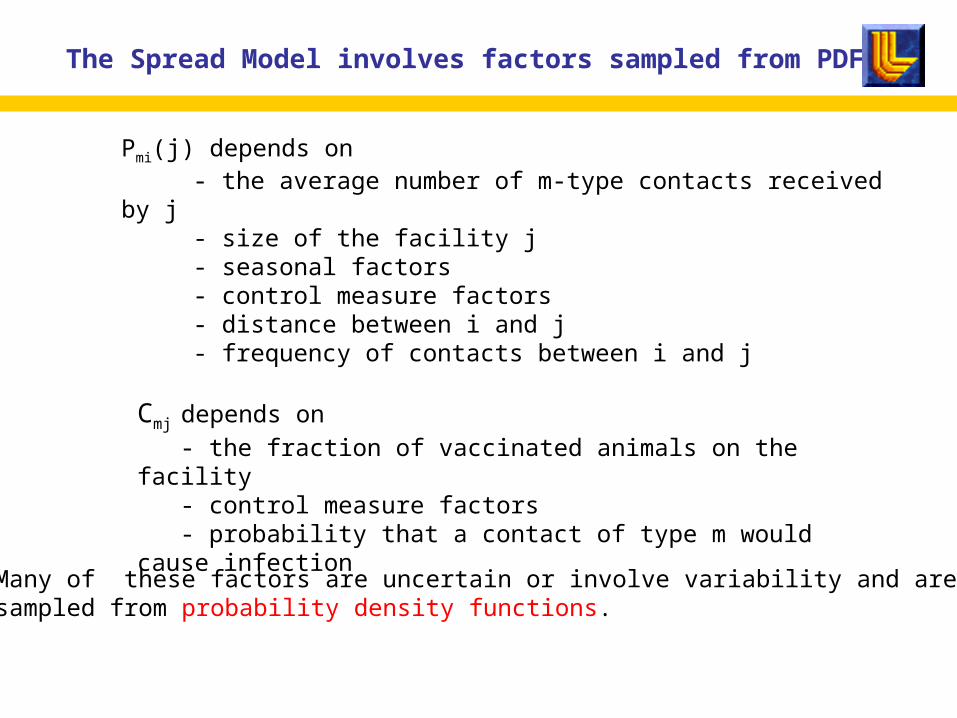
Pmi(j) depends on - the average number of m-type contacts received by j - size of the facility j - seasonal factors - control measure factors - distance between i and j - frequency of contacts between i and j
The Spread Model involves factors sampled from PDFs
Cmj depends on
- the fraction of vaccinated animals on the facility - control measure factors - probability that a contact of type m would cause infection
Many of these factors are uncertain or involve variability and are sampled from probability density functions.

The Control Measures Component
“Control measures” include Vaccination Culling Contact restrictions Isolation Increased detection
Control measures are applied regionally
Control Measure A1:Culling on Circle
Control Policy B
Control Measure A2:Vaccination on Ring
Control Measure A3: Movement Restrictions on State
Control Policy A
Control Measure B1:Vaccination on County
Control Measure B2: Movement Restrictions on State

IFM
Control Measures
Spread model
Events during one increment of time

AGGREGATION ALGORITHMS
Our model is of US - national scale; however to keep calculations to a minimum:
- We do not calculate all facilities at all times.
- Only facilities in infected and their neighboring counties are initialized
- Intra-facility model calculated only for infected facilities
- Counties and states that have not been yet infected are considered as aggregated entities; if a contact happens to in such a county, it gets disaggregated.

OUTPUTS
A simulation is made of N MC runs
N O(102) - O(103)

OUTPUTS
A simulation is made of N MC runs
N O(102) - O(103)
A run implements M time steps
M O(102), usually 200-330 days or until a certain criterion is met (epidemic comes to end)

OUTPUTS
A simulation is made of N MC runs
N O(102) - O(103)
A run implements M time steps
M O(102), usually 200-330 days or until a certain criterion is met (epidemic comes to end)
At each time step we keep track of the number P of facilities that are currently involved in the epidemic (i.e. the ones that are infected or in the neighborhoods of infected facilities.
P O(102) - O(105) ???
For each facility the important data (current states, costs, trace-back facilities) is O(101)

OUTPUTS
Thus, the total output of a simulation could be in the range of or more.
O(1010)
Naturally, we do not keep all this output although what we do not keep may be important for the analysis
What do we keep currently?

OUTPUTS
Daily Numbers of facilities of the 34 types that are in the 9 disease states L- LatentU- Subclinically infectiousI- Clinically infectiousW – Vaccinated and susceptibleV- Vaccinated M- ImmuneP- SuspectedF- ConfirmedX - Culled
Numbers of facilities that have just acquired a new state
Numbers of facilities that have ever been in some disease state
Total numbers of infected, vaccinated, culled facilities
Daily and total numbers of infected, vaccinated, culled animals of different species

OUTPUTS
Durations:
Lengths of time for which the 34 types of facilities were in some disease state
Duration of total epidemic
Costs associated with epidemic and control measures

OUTPUTS
Currently, output is in Excel spreadsheet format and is used for visualization
Duration
Duration of epidemic
C
um
ula
tiv
e F
req
ue
nc
y
Days after index herd infected
As well as to calculate statistics (means, quantiles, skewness, kurtosis, etc.) of MC output.
Epidemic model outputs and data mining
Question:
How can modern data mining tools help in the analysis of output data generated by a large-scale epidemic model?

Epidemic model outputs and data mining
Question:
How can modern data mining tools help in the analysis of output data generated by a large-scale epidemic model?
Specifically, can data mining help uncover important relations between
- scope of epidemic and spatial distributions of facilities? - how control measures are applied and the cost of the epidemic?
Epidemic model outputs and data mining
Further, can data-mining tools help …
Identify sources (infected facilities), likely transmission mechanisms? Classify of outbreaks into "natural" vs. "intentional" to help policy makers develop correct response strategies?

Epidemic model outputs and data mining
Further, can data-mining tools help …
Identify sources (infected facilities), likely transmission mechanisms? Classify of outbreaks into "natural" vs. "intentional" to help policy makers develop correct response strategies?
Identify key facilities/locations for surveillance?
Identify which control mechanisms are having the largest impact?

Epidemic model outputs and data mining
Further, can data-mining tools help …
Identify sources (infected facilities), likely transmission mechanisms? Classify of outbreaks into "natural" vs. "intentional" to help policy makers develop correct response strategies?
Identify key facilities/locations for surveillance?
Identify which control mechanisms are having the largest impact? Evaluate new technologies?
Evaluate vulnerability of different industries and regions of the country?

If the answer is “yes” to at least some of our questions, which are the recommended data mining tools?
Are they available?