Embed Size (px)
Citation preview
Applied Financial Economics, 1999, 9, 215-232
The long-run performance of initial publicofferings in Thailand
D. E. ALLEN, N. J. MORKEL-KINGSBURY* andW. PIBOONTHANAKIAT*
School of Finance and Business Economics, Edith Cowan University. Joondalup Campus,Joondalup Drive, Joondalup, WA 6027, * Siam Sanwa Industrial Credit Public CompanyLtd (SICCO), 130 Wireless Road, Bangkok. Thailand and ^Department of Accounting andFinance. Monash University, Australia
This paper analyses the long-run performance of initial public offerings (IPOs) on theThai Stock Exchange. It uses a sample of 150 IPOs listed on the Thai Slock ExchangeMain Board between 1985 and 1992. The initial return is 63.49%. The cumulativeadjusted return at the end of the three-year anniversary is 10.02%. This resultcontrasts with those of most of the studies of long-run IPO performance in developedmarkets. This result, however, appears sensitive to outlying observations. Whilst thereis no significant evidence that the IPOs underperform the market in the long run,removal of outliers from cross-sectional analysis suggest that Thai IPOs may under-perform the market in the long run. Further research, including more recent data mayhelp clarify this issue.
I. I N T R O D U C T I O N
This paper analyses the long-run performance of initialpublic offerings (IPOs) on the Thai Stock Exchange. Earlystudies of IPOs focused on initial as well as immediateaftermarket returns.^ They found that IPOs exhibit largeinitial returns. An evaluation of the intrinsic value of IPOstocks is difficult since these stocks are issued by companieswith no prior market capitalization. Moreover, these firmsmay have much of their value represented by growth oppor-tunities rather than assets in place (Hanley and Ritter, 1992).A number of their existing shareholders may also possessnon-public information. The existence of high uncertaintyabout the true value of new issues and the asymmetricinformation problem has been accepted as factors forcingissuing firms or their underwriters to deliberately under-price their new issues. Several hypotheses developed fromthese grounds are able to explain why IPOs are intention-ally underpriced.^ They are, however, unable to precisely
identify the correlation of the potential explanations and themagnitude of each rationale for each IPO. Hanley andRitter (1992) suggest that the explanations for initial under-pricing of IPOs are not mutually exclusive. A given reason isalso likely to be more important for some IPOs than forothers.
Researchers have been further puzzled by the long-runperformance of IPOs. Several studies have shown that IPOsunderperform the market in the long run. The long-runperformance of Thai IPOs and possible explanations are thecentral concerns in this study.
Ritter (1991) stated that the understanding of IPO perfor-mance is beneficial to both investors and issuers. On onehand, investors may develop trading strategies yieldingsuperior returns. On the other hand, the existence of a hotissue market may allow issuers to successfully time their newissues resulting in a lower cost of going public. Some fea-tures of Thai economy and stock market are very likely tobe different from such countries as US which is the centre
' See Reiliy and Hatfield (1969), McDonald and Fisher (1972), Reilly (1973, 1977) for examples. For a review of early empirical studies oninitial as well as immediate aftermarket performance of IPOs, see Dawson (1987).^The proposed hypotheses include the information asymmetry hypothesis (Baron, 1982; Rock, 1986, Beatty and Ritter, 1986), thesignalling hypothesis (Leland and Pyle, 1977), the certification hypothesis (Booth and Smith, 1986; Titman and Trueman, 1986) and thelawsuit avoidance hypothesis (Tinic, 1988).
0960-3107 © 1999 Routledge 215

216 D. E. Allen et al.
for most empirical studies. Finally, there is only one pub-lished work on the performance of Thai IPOs.
The paper is organized as follows. Section II reviewsprevious studies on the long-run performance of IPOs. TheThai stoek markets and IPOs are outlined in Section III.Data, methodology and hypotheses are described in SectionIV. Section V reports and discusses the results. A briefconclusion follows in the final section.
II. PREVIOUS WORK
Early studies of the long-run performance of IPOs wereundertaken in the United States and several document theexistence of long-run underperformance. Stern andBornstein (1985) show that 1922 new issues floated during1975-85 underperform the market by 22%. In contrast,Ibbotson (1975) finds that the aftermarket performance ofthe US common stocks floated during the 1960s is positivein the first year and negative in the next three years beforereturning to be positive in the fifth year. The aftermarketperformance of IPOs has gained more attention recently.The evidence shows strong short-run underpricing. Al-though the results on long-run performance are mixed,a preponderance of underperformance is evident. SeeLoughran et al. (1994).
Ritter (1991) investigated the 1526 US IPOs floated dur-ing 1975-84, and found significant underperformance. IPOsin his sample underperform a group of matching firms overa three year period by 29.13%. The long run underperfor-mance of US IPOs is also documented by Aggarwal andRivoli (1990). They report the NASDAQ index adjustedreturn of —13.73% at the 250 post listing day for a sampleof 1598 IPOs during 1977-1987. Levis (1993), adoptedmethods similar to Ritter's (1991), and found that 712 UKIPOs floated during 1980-88 underperform the HGSC In-dex (Extended Hoare Govett Smaller Companies Index)over a three year period by 8.31%. Long-run underperfor-mance is also found in three Latin America stock markets.Aggarwal et a/.( 1993) report - 4 7 % and -23.7% three-year returns for 62 Brazilian IPO offerings in 1980-90 and36 Chilean IPOs in 1982-90 as well as a - 19.6% one-yearreturn for 44 Mexican IPOs in 1987-90.
A study of Finnish IPOs by Keloharju (1993) reports a— 26.4% long-run cumulated market adjusted return for 79
issues going public between 1 January 1984 and 31 July 1989.In Australia, Mustow (1992), and Allen and Patrick (1994)also document significant long-run underperformance and36-month post-listing returns of —112.8% and —25.38%are reported. The substantial difference between the results ofthe two studies may be due to the different time periodanalysed. Aggarwal and Rivoli (1990) and Ritter (1991) pro-pose that the turn-around of IPO performance inherent inpoor long-term performance appears to be consistent withthe fads hypothesis of De Bondt and Thaler (1985, 1987).
Aggarwal and Rivoli (1990) suggest that fads are likelyto be a good explanation for IPO performance because(i) fads are likely to occur when estimation of the trueintrinsic value of the firm is difficult; (ii) risky securitiesare likely to be subject to high levels of noise trading;(iii) IPO investors appear to be more speculative; and(iv) the marginal investors in initial trading may be over-optimistic.
Ibbotson and Jafle (1975), and Ritter (1984) provide evid-ence of the existence of 'hot issue markets'. The hot issuemarkets are usually defined as periods in which large num-bers of IPOs are floated and the average initial returns areabnormally high. It has been argued that during these hotissue periods many poor quality IPOs are floated on themarket, taking advantage of market over-optimism - Shiller(1990) and Ritter (1991).
Using gross proceeds as a proxy for ex-ante uncertainty,Beatty and Ritter(1986)find that the degree of underpricingis positively related to the ex-ante uncertainty about theex-post value of IPOs. De Bondt and Thaler (1985, 1987)report systematic reversals of the past and subsequent ab-normal returns for individual securities. They interpret thisfinding as evidence consistent with the overreaction hypoth-esis. Therefore, it is expected that a smaller issue shouldhave a higher initial underpricing followed by a worseaftermarket performance.
Ritter (1991) shows that there is some tendency for IPOswhich have the highest average matching firm-adjusted in-itial returns to have the worst aftermarket performance.This tendency is also stronger for smaller issues. Ritter(1991) analyses the long-run performance of IPOs in eachyear and finds that long-run underperformance is not asgeneral a phenomenon as short-run underpricing. More-over, he finds that the annual volume of IPOs is negativelyrelated to the aftermarket performance. Loughran et al.(1994) also reach the same conclusion that firms havemarket timing ability. Ritter (1991) categorized his sampleinto 13 industries and reported that the long-run perfor-mance of IPOs in different industries varies widely. Heinterpreted the underperformance of IPOs in many indus-tries relative to other firms in the same industries as beingconsistent with the fads hypothesis.
III. THE THAI STOCK EXCHANGE ANDIPOs
Market performance
Established by the government in 1974, the SecurityExchange of Thailand (SET), is the only organized stockexchange in Thailand. With trading operations beginningon 30 April 1975, the SET has developed from a minimarketof 21 listed at the end of its first year, into one of the world'semerging markets (Agtmael, 1993). By the end of 1996, the

Initial public offerings in Thailand 111
1975 76 77 78 79 80 81 82 83 84 85 86 87
Year
89 90 91 92 93 1994
Fig. 1. SET index and daily average turnover for the period of 1975 to June 1994 (Source: The Stock Exchange of Thailand, 1994, p. 14)
Commonstocks93%
Banking23%
Unit trusts3%
Communi-cation18%
Propertydevelopment
10%Building and
furnishingmaterial
10%
Finance andsecurities
15%
Fig. 2. Market capitalization for common stock and for each sector {as at 30 June 1994) (Source: The Stock Exchange of Thailand (1994,p. 23)
SET had 454 companies and 71 unit trusts listed witha market capitalization of USSICK) bilhon. Figure 1 depictsthe performance of the SET over the past two decades.Apart from a brief boom in 1977/78 where the SET index-*reached a high of 257.73 points, the SET had remainedreasonably stable in its first decade of trading. At the end of1985 the SET index was at 134.73 points.
A number of factors contributed to a dynamic expansion incapital activities from 1986 onwards. Improved confidence inboth the Thai domestic and regional political and economicenvironment, as well as various measures introduced by theSET to facilitate the expansion of trading in the primary andsecondary markets (Lian, 1993), encouraged greater invest-ment from domestic and foreign investors.
The Persian gulf crisis, combined with a unfavourabledomestic climate resulted in a drop in the SET index of45%, from a peak of 1143.78 points in July 1990 to 612.86points at year's end. In the following three years rapidgrowth in the number of institutional investors, lower inter-
est rates and a inflow of foreign funds, contributed to thegrowth of the SET index to a new high of 1682.85 points in1993.
Market structure
Common stocks are the major securities traded in the SET.Although the numbers and market shares of unit trusts arestill very small, they have increased significantly during thepast few years. The increases have helped to make themarket to be more fundamentally based and to reducemanipulations to some extent (Anon., 1994). At the end ofJune 1994, there were 361 common stocks accounting for95.9IV0 of total market capitalization. Five of 31 sectorspossess the majority of shares (76%) of the commonstock market capitalization. Figure 2 portrays the marketcapitalization of securities in proportion to the market asa whole as well as the market share of each major sector ofcommon stocks.
' The SET index = (Current market value + Base market value) x 100 where the market value of 30 April 1975 is used as a base.

218 D. E. Allen et al.
IPOs in Thailand
A company wishing to make a public offering must firstconform to the requirements of the Securities & ExchangeAct (SEA) and gain permission from the Securities & Ex-change Commission (SEC). Public offerings follow theprocedure briefly outlined below:*
i. The initial public offering (IPO) or prospectus is sub-mitted to the SEC through an authorized finance andsecurities company;
ii. The listing application is then submitted to the SET;iii. The application is then considered by the listing sub-
committee;iv. A company visit and a company management interview
is conducted;V. SET Board of Governor's grant their approval for list-
ing;vi. Trading is then allowed in listed stocks.
The average time for the approval process from the settingof the ofFer price to the issue date, is generally two to threemonths (Wethyavivorn and Koo-smith, 1991). However,this can take as long as a year. Investors wishing to sub-scribe in the IPO are required to pay in advance and theissuer earns interest on all money deposited, even if oversubscribed (Chowdhry and Sherman, 1996).
The SET actively encourages small investors through thelisting requirements of the SEA. Accordingly companiesapplying for listing must provide an allocation of sharesavailable to small investors of between 15-30% of thecompanies' registered capital. A small investor is defined asan entity holding not more than 1% of the listed stock.Furthermore, there must at least be 600 small investors forhsted stocks and, at least 300 for listed companies in provin-cial zones.
The only prior study on the performance of Thai IPOs isby Wethyavivorn and Koo-Smith (1991). They report aninitial return of 68.69% for 32 Thai IPOs floated duringJanuary 1988 and June 1989. This high initial return isadjusted instantly by the second trading day; the excessreturn on the second trading day is — 0.24%. The adjustedreturns for the end of the first, third and sixth month are— 8.29, 6.74 and —3.02% respectively. However, none of
these returns are significant.
IV. DATA AND RESEARCH M E T H O D S
The initial sample is comprised of 151 IPOs listed on themain board of the Stock Exchange of Thailand between1985 and 1992. All initial public offerings having the re-quired data; offering date and price, available were included.
Table 1. Distribution of IPOs by year during 1985-92
Year
19851986198719881989199019911992
Total
Totalnumberof IPOs
31
193434396035
225
Numbersof IPOs inthe sample
I04
1216305434
151
% included
33.330
21.0535.2947.0676.9290.0097.14
67.11
Table 1 presents the distribution of the sample by year.Since the database is only available to 31 December 1992,the sample size of the after market return analysis willdechne and drop to only 32 IPOs in the 36th month. As thesample size of 32 is rather small a two-year aftermarketperformance is investigated rather than three-year as gener-ally performed in previous studies.
All the data used in this study except for the ofTering price,number of shares issued and offering date is obtained fromthe Pacific-Basin Capital Markets (PACAP) database com-piled by The University of Rhode Island. The offering priceand date are obtained from the new listed security reportcompiled by the Investor Services and Information Section,Public Relations Department, The Security exchange ofThailand.
Methodology
The methodology adopted follows Ritter (1991). We firstanalyse both initial returns and aftermarket returns. Severalcross-sectional and time-series analyses are employed in anattempt to explore factors determining IPO performance.Finally, regression analyses are undertaken.
Retums analyses. Returns are calculated for two intervals;the initial return period defined as the offering date to theclose of the first trading date, and the aftermarket returnperiod defined as the three years after the IPO exclusive ofthe initial return period. The aftermarket period is dividedinto 36 months where month is the calendar month startingfrom the month following the first trading day. This defini-tion creates a time interval; the second trading day tothe last trading day of that month, for IPOs not startingtrading at the end of month. This time interval is definedas month 0 and is included in the analyses. For example,the month 0 of an IPO which starts trading on 22 January
*For a more detailed listing of qualifications and procedures for companies refer to Appendices I and II.

Initial public offerings in Thailand 219
will be the period from the 23rd to the last trading day ofJanuary and the monthly period starts from February.
(1) Initial returns. The initial return is defined as thepercentage change of the stock price from the subscriptionprice and the closing price on the first trading day. It can bewritten as:
where P, = closing price on the first trading day of IPOi and 5,- = subscription price of IPOj.
(2) Aftermarket returns. Following Ritter (1991), the per-formance of IPOs is calculated by cumulative adjustedreturns (CARs) with monthly portfolio rebalancing. Twomarket returns; the PACAP monthly equally-weighted mar-ket returns with cash dividend reinvested^ and the PACAPmonthly value-weighted market returns with cash dividendreinvested,^ are used as the benchmarks.
The CARs can be calculated from the following calcu-lation series:
1. Raw return(i) for month 0 is calculated as
where r,, is return for IPOi in month 0; Pi.f. is closingprice of IPO; on the last trading day of the first tradingmonth; Pj is closing price of IPOj on the first trading day.(ii) for month 1 to 36 the monthly returns are obtainedfrom the PACAP data base.
2. Market return(i) for month 0 is calculated as
r^, = n (I+^o -1
where dr^t is daily market return for IPOj on day r; S isthe second trading day; L is the last trading day of thefirst trading month.(ii) for month 1 to 36 the monthly market return isobtained from the PACAP data base
3. Market adjusted retums
where r;, is monthly raw return for IPOj in month f; r^, ismonthly market return in month t.
4. Average market adjusted return for month t on a port-folio of n stocks
1 "
n j = i
5. Cumulative market-adjusted return {CARs) from month0 to month t
CARs, =( = 0
The calculation of the aftermarket return does not fullytake the effect of different risk levels into account. (It isassumed that IPOs have the same systematic risk as themarket benchmark employed in the test, but it does notalter the direction of the results.) Balvers et al. (1988),Ibbotson (1975) and Reilly (1977) have documented thatthe systematic risk of new issues is greater than onewhich is the systematic risk of the market index. Theassumption that IPOs have the same systematic risk asthe market index, therefore, provides an upward bias inthe estimation of the returns and strengthens the results(Ritter, 1991, and Aggarwal and Rivoli, 1990). The aver-age market adjusted return (AR,) and the cumulativeabnormal return {CARs) for each month are tested fortheir significance.
The f-statistics for the AR, series are calculated as
t{AR,) = Asd,
where n, is the number of firms trading in event montht and sd, is cross-sectional standard deviation for eventmonth t. The statistical significant of the CARs is cal-culated as
t{CAR,) =CAR,
(r-var-H2(r -
where var is average cross-sectional variance over 36months and cov is first-order autocovariance of the AR,series.
As an alternative to the use of CARs which implicitlyassume monthly portfolio rebalancing, two-year market
^ PACAP DATA DEFINITION - Monthly Equally Weighted Market Returns with Cash Dividends Reinvested, (I) Item representsmonthly returns with cash dividends reinvested for an equally weighted market portfolio. (2) All stocks with non-missing returns andnon-missing market values for the previous month are included in the caleulation. (3) The weights are defined as l/CNTCO, whereCNTCO is number of stocks included in caleulation,"PACAP DATA DEFINITION - Monthly Value-Weighted Market Returns with Cash Dividends Reinvested. (1) Item representsmonthly returns with cash dividends reinvested for an value-weighted market portfolio, (2) All stocks with non-missing returns andnon-missing market values for the previous month are included in the calculation. (3) The weight assigned to stock i is
MKTVALi
where MKTVALi is previous month's total market value of stock i, and CNTCO is number of common stocks included in the calculation.
220 D. E. Allen et al.
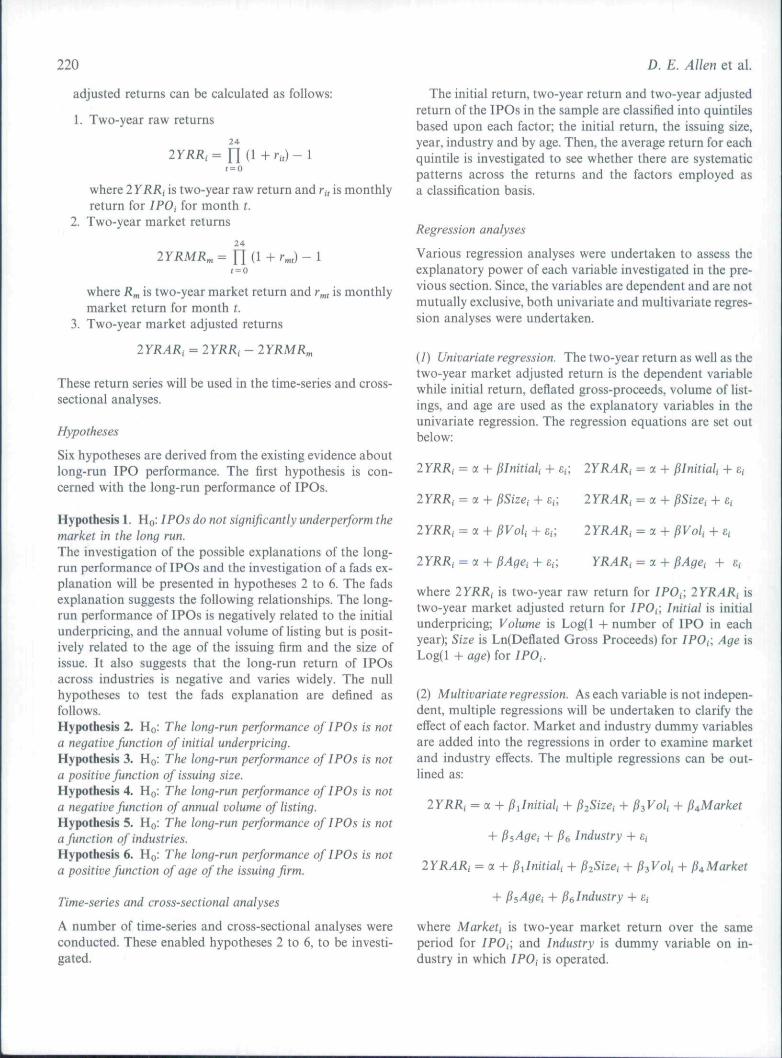
adjusted returns can be calculated as follows:
1. Two-year raw returns
where 2YRRj is two-year raw return and r,, is monthlyreturn for IPOi for month t.
2. Two-year market returns
1 = 0
where R^ is two-year market return and r^, is monthlymarket return for month r.
3. Two-year market adjusted returns
lYRARi = lYRRi - lYRMR^
These return series will be used in the time-series and cross-sectional analyses.
Hypotheses
Six hypotheses are derived from the existing evidence aboutlong-run IPO performance. The first hypothesis is con-cerned with the long-run performance of IPOs.
Hypothesis I. HQ- I POS do not significantly underperform themarket in the long run.The investigation of the possible explanations of the long-run performance of IPOs and the investigation of a fads ex-planation will be presented in hypotheses 2 to 6. The fadsexplanation suggests the following relationships. The long-run performance of IPOs is negatively related to the initialunderpricing, and the annual volume of listing but is posit-ively related to the age of the issuing firm and the size ofissue. It also suggests that the long-run return of IPOsacross industries is negative and varies widely. The nullhypotheses to test the fads explanation are defined asfollows.Hypothesis 2. HQI The long-run performance of IPOs is nota negative function of initial underpricing.Hypothesis 3. HQ: The long-run performance of IPOs is nota positive function of issuing size.Hypothesis 4. HQ: The long-run performance of IPOs is nota negative function of annual volume of listing.Hypothesis 5. HQ: The long-run performance of IPOs is nota function of industries.Hypothesis 6. HQ. The long-run performance of IPOs is nota positive function of age ofthe issuing firm.
Time-series and cross-sectional analyses
A number of time-series and cross-sectional analyses wereconducted. These enabled hypotheses 2 to 6, to be investi-gated.
The initial return, two-year return and two-year adjustedreturn of the IPOs in the sample are classified into quintilesbased upon each factor; the initial return, the issuing size,year, industry and by age. Then, the average return for eachquintile is investigated to see whether there are systematicpatterns across the returns and the factors employed asa classification basis.
Regression analyses
Various regression analyses were undertaken to assess theexplanatory power of each variable investigated in the pre-vious section. Since, the variables are dependent and are notmutually exclusive, both univariate and multivariate regres-sion analyses were undertaken.
{!) Univariate regression. The two-year return as well as thetwo-year market adjusted return is the dependent variablewhile initial return, deflated gross-proceeds, volume of list-ings, and age are used as the explanatory variables in theunivariate regression. The regression equations are set outbelow:
2YRRi = a -i- + er, 2YRARi = a £,-
= a
2YRRi = a + 2YRARi = a ++
where 2YRRi is two-year raw return for IPOc 2YRARi istwo-year market adjusted return for IPOc, Initial is initialunderpricing; Volume is Log(l -I- number of IPO in eachyear); Size is Ln(Deflated Gross Proceeds) for IPOc, Age isLog(l + age) for
(2) Multivariate regression. As each variable is not indepen-dent, multiple regressions will be undertaken to clarify theeifect of each factor. Market and industry dummy variablesare added into the regressions in order to examine marketand industry effects. The multiple regressions can be out-lined as:
+2YRRi = a -I- ̂ ylnitiaU ^ ^jSizei + p
i + ^6 Industry +
U -I-
where Marketj is two-year market return over the sameperiod for IPOi, and Industry is dummy variable on in-dustry in which /PO, is operated.

Initial public offerings in Thailand
V. RESULTS
Initial return
The average initial return for the sample of 151 IPOs listedon the Stock Exchange of Thailand during 1985-92 is63.49%. The figure drops slightly to 61.98% when adjustedby the market return using the SET index as the benchmark.This figure is similar to the average initial adjusted return of68.69% of 32 Thai IPOs reported by Wethyavivorn andKoo-smith (1991). The average initial adjusted return of
221
Thai IPOs is very high when compared with that of US, UKand Australia. For example, Ritter (1991) and Levis (1993)report the average initial adjusted return of about 14% forthe US and UK IPOs respectively while Finn and Higham(1988) report an abnormal return of 29.2% for AustralianIPOs.
Aftermarket performance
Table 2 reports the average market adjusted returns {AR,)and cumulative average market adjusted retums (CAR,) for
Table 2. Abnormal returns for IPOs listed during 1985-92'
Month
0I23456789
10U12131415161718192021222324252627282930313233343536
Sample
143147147147145141139139139139127121117113109106979485827370646362595253504741404038373732
AR, (%)
- 2 . 9 0- 1.41
0.191.72
- 0 . 8 20.51
- 2 . 2 1- 0 . 7
0.09- 1 . 4 8
1.431.44
- 1.26- 0 . 6 6
1.150.01
- 0 . 10.73
- 1.65-2 .45-0 .95- 1.57
1.03-0 .95
0.312.51.23.580.410.694.644.692.692.82
- 1 . 4 4- 0 . 0 2- 1.24
Equally
/-stat
-2 .38-0 .79
0.171.57
-0 .750.35
- 2 . 0 2- 0 . 6 3
0.06- 1 . 5 7
1.181.06
-0 .82-0 .50
0.830.01
-0 .060.46
- 1.04- 1.55-0 .49- 1.14
0.62-0 .49
0.151.360.561.970.210.241.130.921.130.93
-0 .73-0 .01- 0 . 6 3
weighted
CAR, (%)
- 2 . 9 0- 4 . 3 1- 4 . 1 2- 2 . 4 0- 3 . 2 2-2 .71-4 ,92- 5 . 6 2- 5 . 5 3-7 .01-5 .58- 4 . 1 4- 5 . 4 0- 6 . 0 6- 4 . 9 1- 4 . 9 0- 5 . 0 0- 4 . 2 7- 5 . 9 2- 8 . 3 7- 9 . 3 2
- 10.89- 9 . 8 6
- 10.81- 10.50- 8 . 0 0- 6 . 8 0- 3 . 2 2- 2 . 8 1- 2 . 1 2
2.527.219.90
12.7211.2811.2610.02
Nstat
- 2 . 1 8-2 .31- 1.80-0 .91- 1.08-0 .82- 1 . 3 7- 1 . 4 6- 1.36- 1 . 6 3-1 .18- 0 . 8 2- 1 . 0 1- 1.08- 0 . 8 3- 0 . 7 9- 0 . 7 5- 0 . 6 1- 0 . 7 8- 1 . 0 6- 1 . 0 9- 1 . 2 1- 1 . 0 3- 1.09- 1.03-0 .75-0 .59-0 .28- 0 . 2 3-0 .17
0.180.500.680.840,720,710.58
AR, (%)
-2 .35-0 .79
0.921.710.440.83
-1 .38- 0 . 6 3
0.20- 1.17
1.762.04
- 0 . 1 9-0 .28
1.430.360.531.24
- 2 . 1 0- 2 . 4 7-0 .39-0 .75
2.27- 0 . 1 4
1.042.61
- 0 . 8 43.951.030.855.535.323.514,02
-0 .691.15
-1 .06
Value
r-stat
- 1.90- 0 . 4 4
0.821.570.380.58
- 1.21-0 .59
0.14-1 .17
1.461.45
- 0 . 1 2- 0 . 2 1
1.110.300.320.75
- 1 . 3 4- 1 . 5 4- 0 . 1 8- 0 . 5 4
1.32-0 .07
0.491.44
- 0 . 4 02.140.490.281.381.101.461.29
- 0 . 3 70.75
-0 ,49
weighted
CAR, i%)
-2 .35- 3 . 1 3- 2 . 2 1- 0 . 5 0- 0 . 0 6
0.77- 0 . 6 1- 1.24- 1.04- 2 . 2 1- 0 . 4 5
1.591.401.122.562.913.454.682.580.12
- 0 . 2 7- 1 . 0 2
1.251.112.154.773.937.888.909.75
15.2920.6024.1128.1327.4428.6027,54
t-stat
- 1.76-1 .68-0 .97- 0 . 1 9- 0 . 0 2
0.23- 0 . 1 7- 0 . 3 2-0 .25- 0 . 5 1- 0 . 0 9
0.320.260.200.430.470.510.670.340.01
- 0 . 0 3- O . U
0.130.110,210.450.340.670.730.761.091.431.651.851.761.801.59
Note: "The average market adjusted retums (AR,) and cumulative average market adjusted returns (CARj) with associated f-statistic for 36months after going public, excluding the initial retum. Two market returns; equally weighted and value weighted are used as the benchmarks.AR, is computed as AR, = ]/«£?= i art,, where ari, is the average market adjusted return for IPO ( in event month t. The f-statistic iscalculated as AR, = 1/n Y.'i=o "'"'" ^h^^^ ^^n 's the average market adjusted return for IPO in event month t. The f-statistic is calculated asAR, • {n,)^'^/sd,, where n, is the number of firms trading in month f, and sd, is the cross-sectional standard deviation in month t. CAR, iscomputed as CARs, = l^".^^ AR,. The f-statistic is calculated as t(CAR,) = C/lR,(n,)'/^/(f Var -I- 2(f - 1)-Cov)"^. where Var is theaverage cross-sectional variance over 36 months and Cov is the first-order autocovariance of the AR, series. These have a value of 0.000143and 0.0254 for equally weighted market adjusted returns and a value of 0.000132 and 0.0255 for value weighted market adjusted retums.

222 D. E. Allen et al.
the 36 months post listing for IPOs listed during 1985-92.As mentioned previously, the drop in the number of com-panies in the sample is due to the PACAP database beingavailable only to 31 December 1992. Two market returnsare used as a benchmark but we focus first on the equallyweighted market adjusted return. The average market ad-justed return at the end of the listing month is —2.9% andis statistically significant at the 5% level. This suggests thatthe high initial underpricing of the IPOs is adjusted quicklyin the early aftermarket. After a slight increase over the nextthree months, the average market adjusted returns fluctuatemarginally before turning to a positive adjusted returnseries during month 24 to 33. These positive return seriesdrive the cumulative average adjusted returns to becomepositive in the 30th and subsequent months. The cumulativeaverage adjusted return is 10.02% at the end of three yearanniversary. Apart from the first two months none of thecumulative adjusted returns are significant at the 5% level.
The aftermarket performance similar to the above pat-terns is also found when using the vaiue weighted marketreturn as a benchmark. However, the cumulative averageadjusted returns for the first two months are significant onlyat the 10% level. Additionally, the average value weightedmarket adjusted returns are higher than the average equallyweighted returns for every month. The cumulative adjustedreturn is 27.54% at the end of the 36th month. The differentperformance of these two aftermarket adjusted returns con-firms Ritter's finding that the long run performance of IPOsis sensitive to the benchmark employed. The better perfor-mance of the value weighted adjusted return is not surpris-ing since it is consistent with the size effect anomalydocumented by Banz (1981). That is small firm investmentstend to yield higher returns than large firm ones. Similarresults are also reported by Levis (1993). Furthermore, thesurvivorship bias seems not to be a problem in this study
given that none of the IPOs in the sample is delisted beforetheir three year anniversary. Both the equally weighted andthe value weighted market adjusted returns as well as rawreturns are depicted in Fig. 3.
The aftermarket performance is consistent with the re-sults reported by Wethyavivorn and Koo-smith (1991). Thatis the performance of the IPOs is mostly adjusted in theearly aftermarket and there is no consistent performancesubsequently in the aftermarket. The aftermarket perfor-mance, however, does not correspond with other studies.For example Ritter (1991); Mustow (1992); Levis (1993);Aggarwal et al. (1993) and Allen and Patrick (1994) finda gradual decline of the long-run adjusted returns over thethree year period.
The above results suggest that the hypothesis that IPOsdo not significantly under-perform the market in the long-run cannot be rejected.
Cross-sectional and time-series results
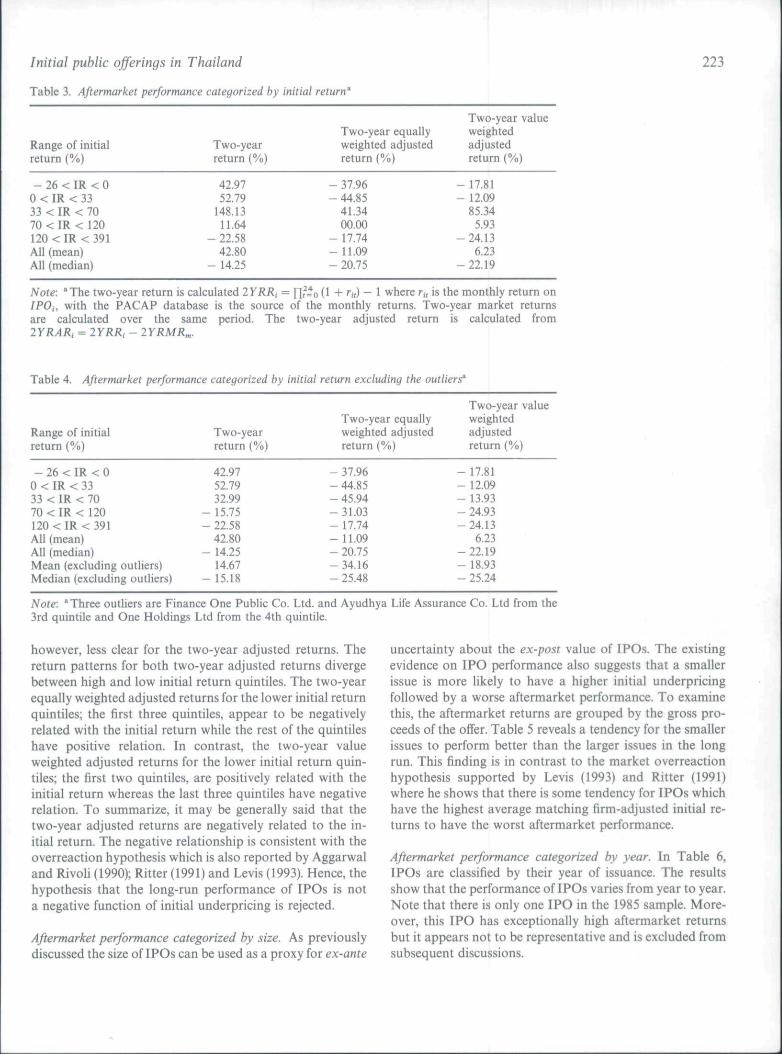
Aftermarket performance categorized by initial returns. InTable 3, the 62 IPOs with data available are categorized byinitial return. This permits an examination of a relationshipbetween the initial underpricing and the aftermarket perfor-mance.
A close inspection of Table 3 suggests that there is noprecise systematic relationship between the initial returnand the aftermarket returns. The relations are, however,clearer when three IPOs having substantial returns areexcluded from the analysis. Table 4 shows the results afterexcluding the outliers.
After excluding the outliers, there is a strong tendency forthe two-year raw returns to be negatively related with theinitial returns. IPOs in the higher initial return quintile havethe worse aftermarket performance. The relationship is.
65
(0
<
o
55 •
45 •
35 -
25 •
1 5 •
5 -
- 5 •
_ 1C .
1
. \'[
. 1
)I
11 13 15 17 19
Month
\—\—I—{'^L* I [ I 1 ! - 1 I
21 23 25 27 29 31 33 35
Fig. 3. The aftermarket performance of IPOs listing during 1986-1992. (The figure plots the initiai raw return together with the cumulativeaverage market adjusted returns (CARs) from month 0 to 36 for three series; raw return ( ), equally weighted adjusted returns ( ), andthe vaiue weighted adjusted returns) ( -).
Initial public offerings in Thailand 223
Table 3. Aftermarket performance categorized by initial retum'
Range of initialreturn (%)
Two-yearreturn (%)
42.9752.79
148.1311,64
- 22,5842,80
- 14,25
Two-year equallyweighted adjustedreturn (%)
- 37.96- 44.85
41.3400,00
- 17.74-11.09- 20.75
Two-year valueweightedadjustedreturn (%)
- 17.81- 12.09
85.345.93
-24.136.23
-22.19
- 26 < IR < 00 < IR < 3333 < IR < 707 0 < I R < 120120<IR<391All (mean)Al! (median)
Note: 'The two-year return is calculated 2YRRi = [\f=o{i + ru) — 1 where TJ, is the monthly return onIFOj, with the PACAP database is the source of the monthly returns. Two-year market returnsare calculated over the same period. The two-year adjusted return is calculated from
Table 4, Aftermarket performance categorized by initial return excluding the outliers'
Range of initialreturn (%)
- 26 < IR < 00 < IR < 3333 < IR < 7070 < IR < 120120 <IR <391All (mean)All (median)Mean (excluding outliers)Median (excluding outliers)
Two-yearreturn (%)
42.9752.7932.99
- 15.75- 22.58
42.80- 14.25
14,67- !5,18
Two-year equallyweighted adjustedreturn (%)
- 37,96- 44,85- 45,94- 31.03- 17,74- 11,09- 20.75- 34.16- 25.48
Two-year valueweightedadjustedretum (%)
- 17.81-12.09- 13.93- 24.93-24.13
6.23-22.19- 18,93- 25,24
Note: "Three outliers are Finance One Public Co. Ltd. and Ayudhya Life Assurance Co. Ltd from the3rd quintile and One Holdings Ltd from the 4th quintile.
however, less clear for the two-year adjusted returns. Thereturn patterns for both two-year adjusted returns divergebetween high and low initial return quintiles. The two-yearequally weighted adjusted returns for the lower initial returnquintiles; the first three quintiles, appear to be negativelyrelated with the initial return while the rest of the quintileshave positive relation. In contrast, the two-year valueweighted adjusted returns for the lower initial return quin-tiles; the first two quintiles, are positively related with theinitial return whereas the last three quintiles have negativerelation. To summarize, it may be generally said that thetwo-year adjusted returns are negatively related to the in-itial return. The negative relationship is consistent with theoverreaction hypothesis which is also reported by Aggarwaland Rivoli (1990); Ritter (1991) and Levis (1993). Hence, thehypothesis that the long-run performance of IPOs is nota negative function of initial underpricing is rejected.
Aftermarket performance categorized by size. As previouslydiscussed the size oflPOs can be used as a proxy for ex-ante
uncertainty about the ex-post value of IPOs. The existingevidence on IPO performance also suggests that a smallerissue is more likely to have a higher initial underpricingfollowed by a worse aftermarket performance. To examinethis, the aftermarket returns are grouped by the gross pro-ceeds of the offer. Table 5 reveals a tendency for the smallerissues to perform better than the larger issues in the longrun. This finding is in contrast to the market overreactionhypothesis supported by Levis (1993) and Ritter (1991)where he shows that there is some tendency for IPOs whichhave the highest average matching firm-adjusted initial re-turns to have the worst aftermarket performance.
Aftermarket performance categorized by year. In Table 6,IPOs are classified by their year of issuance. The resultsshow that the performance of IPOs varies from year to year.Note that there is only one IPO in the 1985 sample. More-over, this IPO has exceptionally high aftermarket returnsbut it appears not to be representative and is excluded fromsubsequent discussions.

224 D. E. Allen et al.
Table 5. Aftermarket performance categorized by size"
Deflated grossproceeds
26 < GS < 4646 < GS < 707 0 < G S < 1 1 01 1 0 < G S < 190190 < GS > 850850 < GS > 4,500All (mean)All (median)
Two-yearreturn
243,67129,4068.82
-11,31- 14,90- 37,71
42,80- 14.25
Two-year equallyweighted adjustedreturn
133.8122.6613.75
- 14.20- 24.96- 67.69- 11.09- 20.75
Two-year valueweightedadjustedreturn
174.6159.3130.25
- 18.40- 23.94-68.14
6.71-22.19
Note: ^Size is the gross proceeds from the IPOs measured in the Baht of 1990 purchasing power usingGDP deflators.
Table 6, Aftermarket performance categorised by year
Year
19851987198819891990All (mean)All (median)
Numbersof IPOs
14
132024
Initial return
19.2331,6335,75
157,8311.1188.9357.14
Two-yearreturn
249.12175.51133.69
- 13.8210.0342.80
- 14.25
Two-yearequallyweightedadjusted return
46.92- 124.92- 12.77- 15.84
10.32- 11.09- 20,75
Two-yearvalue weightedadjusted return
113.85-8 .5147.16
- 20.305.396.71
- 22.19
All of the average initial returns are positive suggestingthat the initial underpricing is a general phenomenon. Thesubstantial increase of the average initial return in 1989 islargely attributed to the market boom. The considerabledrop in the 1990 average initial return is mainly due toa slump in the market caused by the Persian Gulf Crisis.Almost half of IPOs listed during the Gulf War period havea negative initial return. Excluding these IPOs, the averageinitial return increases to 103.44%. In contrast, there are nosystematic patterns in the aftermarket performance.
The two-year returns are very high for IPOs Hsted in 1987and 1988. However, it should be noted that these highreturns drop considerably when a few IPOs having excep-tionally high returns are excluded. The returns fall to 27.8%and 75.74% after the elimination of Ayudhya Life Assur-ance Co. Ltd and Finance One Public Co. Ltd in 1987 and1988 respectively. Yet, this time period still is the bestperformer overall. This good performance is as expectedsince the two-year periods for these IPOs cover the periodof the rising and booming market. However, the two-yearadjusted returns for these two years after excluding anoutlier are negative indicating the IPOs significantly under-perform the market in the long run. The equally weighted
adjusted return and value weighted adjusted return for 1988after removing Finance One Public Co. Ltd are — 60.94%and —3.94% respectively. Note that the worst two-yearequally weighted adjusted return in 1987 is mostly driven bythe performance of IPOs from the banking industry (theindustry effect is discussed in the next section). IPOs listedduring 1989 and 1990 also underperform the market in thelong run. After excluding One Holding Ltd, the two-yearreturn, equally weighted adjusted return and value weightedadjusted return for 1990 are - 4 . 3 3 % , - 5 . 4 2 % and— 10.46% respectively. The aftermarket performances after
adjusting for outliers are summarized in Table 7.The increasing volume of IPOs during 1988-90 together
with the exceptionally high initial returns followed by thelong run underperformance even in the rising market ap-pears to be consistent with the market fads hypothesis.Except for the two-year equally weighted adjusted return,there is evidence that the annual volume of IPOs is negativerelated to the aftermarket performance. The negative rela-tion matches with Ritter's (1991) finding while the positivefunction of the two-year equally weighted adjusted returnmatches the results of Allen and Patrick (1994). The mixedresults lead to an inability to reject hypothesis 4.

Initial public offerings in Thailand
Table 7. Aftermarket performance categorized by year excluding outliers"
225
Year
1987198819891990Mean (excluditig outliers)Median (excluding outliers)
Numbersof IPOs
3122023
Itiitial retum
19.8634.32
157.8372.4391.2857.91
Two-yearreturn
27.875.74
- 13.82- 4 . 3 3
10.63- 16.38
Two-yearequallyweightedadjusted return
- 296.81- 60.94- 15.84
-5 .42- 35.56- 28.72
Two-yearvalue weightedadjusted returti
- 179.02- 3 . 9 4
- 20.30- 10.46- 21.22- 25.98
Note: * Three utiiers excluded frotn the 1987,1988 and 1990 are Ayudhya Life Assuratice Co. Ltd, Finatice One PuhlicCo. Ltd and One Holdings Ltd respectively.
Table 8. Aftermarket performance categorized by industry
Industry
Agribusiness (1)Banking (2)Building and furnishing tnaterials (3)Chemicals and plastics (4)Communication (6)Electrical products and computer (7)Electronic components (8)Energy (9)Finance and securities (11)Foods and beverages (12)Health care services (13)Hotels and travel services (14)Insurance(16)Jewellery and ornaments (18)Packaging (21)Pharmaceutical products and cosmetics (22)Printing and publishing (23)Property development (25)Pulp and paper (26)Textiles clothing and footwear (27)Transportation (28)Warehouse and silo (30)
Numberof IPOs
11353121163224141141411
Initial return
86.5922.3759.3728.4675.20
132.53190.77120.8365.76
110.14165.50131.36115.0165.7159.42
- 22.86261.11215.0943.4339.97
- 5 . 5 681.54
Two-yearreturn
- 35.48- 16.24
14.91- 4 . 2 6
30.30- 69.04- 0 . 4 7
45.04271.67108.09
- 39.64- 40.67
224.21- 39.93
17.79- 14.84
118.8828.82
- 50.1061.60
-0 .28-43.21
Two-yearequallyweightedadjusted return
- 59.66- 225.67
5.14- 64.50
37,12- 49.67- 0 . 5 9- 1 . 4 1
93.02- 7 . 4 6
- 22.09- 55.28
109.03- 10.77
-3 .01- 54.29
135.6830.52
-43.1518.06
- 135.18- 14.15
Two-yearvalue weightedadjusted return
- 50.63- 153.37
1.85- 47.04
37.47- 55.56
- 7 . 0 3- 3 . 4 8158.0135.11
- 27.67- 63.06
164.93- 16.56
- 2 . 7 5- 55.82
127.7920.56
-44 .2833.21
- 80.05- 17.62
Aftermarket performance categorized by industry. Table 8groups IPOs by industry based on the industry index as-signed by the Security Exchange of Thailand. The samplecovers 22 out of 31 industries. However, note that someindustries have only one IPO in the sample and theseindustries are excluded from the following analysis. Yet theywill be included in the regression analysis where similarindustries are grouped together.
Table 8 shows that the performance of IPOs in differentindustries varies widely. Excluding industries having oneIPO, the property investment industry has the highest initialreturn (215.09%) while the banking industry has the lowestone (22.37%). The banking industry has the worst two-year
adjusted returns ( —225.67% and — 153.37% for equallyweighted and value-weighted respectively) whereas thefinance artd securities as well as insurance industry have thebest long run performance. However, the long run returns ofthese best performers drop significantly when outliers areexcluded. The two-year return and the two-year valueweighted adjusted return of the finance and securitiesindustry fall from 271,67% to 160.2% and from 158.01% to57.55% respectively when Finance One Public Co. Ltd isdropped out. Those of insurance industry decrease from224.21% to 92.74% and from 164.93% to 52.23% respec-tively when Ayudhya Life Assurance Co. Ltd is excluded.Likewise, the long run performance of several other
226 D. E. Allen et al.
industries is very sensitive to the exceptional performance ofindividual issues. After adjusting for such issues, the longrun returns decline dramatically causing the long run re-turns in most industries to be negative. The wide variationin the long run performance and the underperformance inmany industries are consistent with Ritter (1991). He inter-prets these results as being consistent with the fads hypo-thesis.
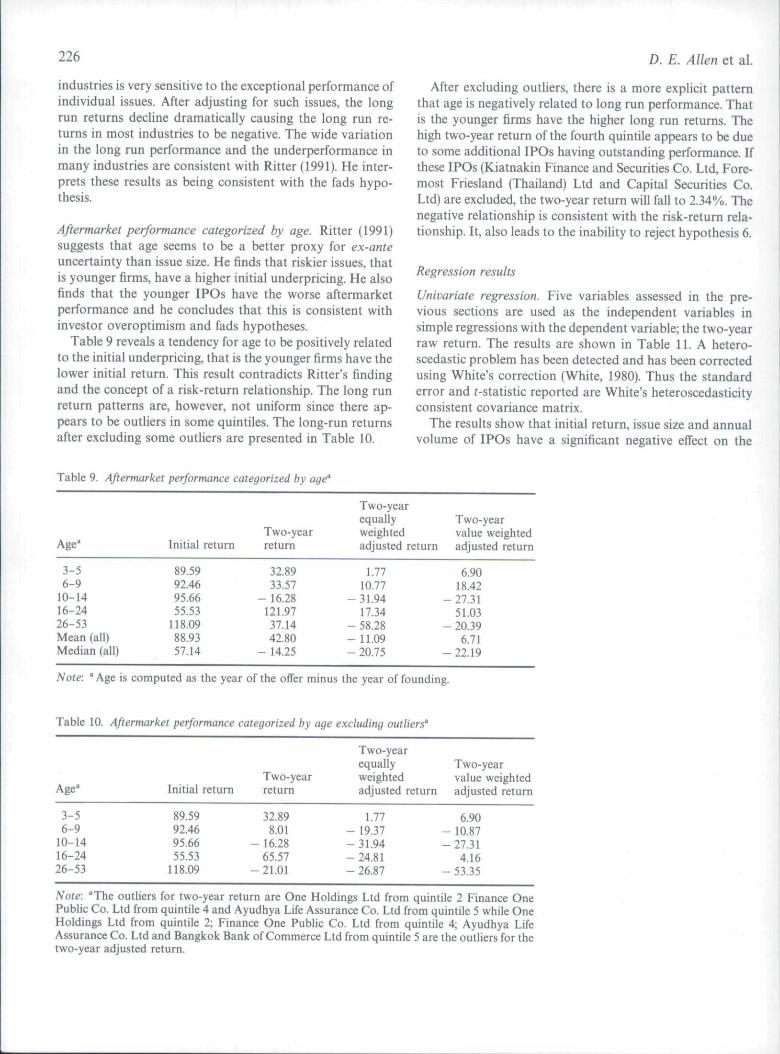
Aftermarket performance categorized by age. Ritter (1991)suggests that age seems to be a better proxy for ex-anteuncertainty than issue size. He finds that riskier issues, thatis younger firms, have a higher initial underpricing. He alsofinds that the younger IPOs have the worse aftermarketperformance and he concludes that this is consistent withinvestor overoptimism and fads hypotheses.
Table 9 reveals a tendency for age to be positively relatedto the initial underpricing, that is the younger firms have thelower initial return. This result contradicts Ritter's findingand the concept of a risk-return relationship. The long runreturn patterns are, however, not uniform since there ap-pears to be outliers in some quintiles. The long-run returnsafter excluding some outliers are presented in Table 10.
After excluding outliers, there is a more explicit patternthat age is negatively related to long run performance. Thatis the younger firms have the higher long run returns. Thehigh two-year return ofthe fourth quintile appears to be dueto some additional IPOs having outstanding performance. Ifthese IPOs (Kiatnakin Finance and Securities Co. Ltd, Fore-most Friesland (Thailand) Ltd and Capital Securities Co.Ltd) are excluded, the two-year return will fall to 2.34%. Thenegative relationship is consistent with the risk-return rela-tionship. It, also leads to the inability to reject hypothesis 6.
Regression results
Univariate regression. Five variables assessed in the pre-vious sections are used as the independent variables insimple regressions with the dependent variable; the two-yearraw return. The results are shown in Table 11. A hetero-scedastic problem has been detected and has been correctedusing White's correction (White, 1980). Thus the standarderror and r-statistic reported are White's heteroscedasticityconsistent covariance matrix.
The results show that initial return, issue size and annualvolume of IPOs have a significant negative effect on the
Table 9. Aftermarket performance categorized by age"
Age"
3-56-9
10-1416-2426-53Mean (all)Median (all)
Initial return
89.5992.4695.6655.53
118.0988.9357.14
Two-yearreturn
32.8933.57
- 16.28121.9737.1442.80
- 14.25
Two-yearequallyweightedadjusted return
1.7710.77
- 31.9417.34
- 58.28-11 .09- 20.75
Two-yearvalue weightedadjusted return
6.9018.42
- 27.315LO3
- 20.396.71
-22.19
Note: 'Age is computed as the year of the offer minus the year of founding.
Table 10. Aftermarket performance categorized by age excluding outliers'
Age"
3-56-9
10-1416-2426-53
Initial return
89.5992.4695.6655.53
118.09
Two-yearreturn
32.898.01
- 16.2865.57
-21.01
Two-yearequallyweightedadjusted return
1.77- 19.37- 31.94-24.81- 26.87
Two-yearvalue weightedadjusted return
6.90- 10.87- 27.31
4.16- 53.35
Note: "The outliers for two-year return are One Holdings Ltd from quintile 2 Fitiance OnePublic Co. Ltd from quintile 4 and Ayudhya Life Assuratice Co. Ltd from quintile 5 while OneHoldings Ltd from quintile 2; Finance One Public Co. Ltd from quintile 4; Ayudhya LifeAssurance Co. Ltd and Bangkok Bank of Commerce Ltd from quintile 5 are the outliers for thetwo-year adjusted return.

Initial public offerings in Thailand
Table 11. Univariate regression results
111
Indepetidentvariables
Estimatedcoefficient
Standarderror Prob |(| > X R'
Initial returnMarket returnIssue sizeVolumeAge
0.29731.25930.55362.80010.4742
0.09520.29850.19711.1240.7054
0.00180.000080.004980.012740.51298
0.036320.22870.14260.07310.0072
Note: The dependetit variable is two-year return calculated as 2YRRi — Yif^^il -I-r,,) — 1where r;, is the monthly return on IPOi; Initial return is calculated as r̂ — (Pj/S )̂ — 1 where r^, isthe closing price on the first trading day of IPOi and S, is the subscription price of
Market return is the two-year value weighted adjusted return calculated as= [ ]"p (1 -I- rn,) — 1 where r„, is the monthly market return; Issue Size is the
Ln(Deflated gross proceeds) measured in Baht using 1990 purchasing power; Volume isLog(l + number of IPO in each year); Age is Log(l + age). The number of observations are 62for all regressions except issue size. (The number of observations for issue size is 53 since thereare some missing values.
aftermarket performance. The first two variables are signifi-cant even at the 1% level. On the other hand, market returnand age have a positive effect on the long-run returns. Theformer factor is highly significant whereas the latter one isinsignificant. Market condition appears to have the highestexplanatory power on the long-run return followed by thesize of the issue. Initial return and volume have rather lowexplanatory power. These regression analyses provide cor-roborative evidence to the aftermarket performance re-ported in the previous sections. Although, the estimatedcoefficient on age has the opposite effect to that of thecross-sectional results, it is not statistically significant.
Multivariate regression. Besides five variables examined inthe simple regression, the dummy variables to capture in-dustry effects were included in the multiple regression.Twenty-two industries in the sample were grouped intosix categories as shown in Appendix IIL Category 3(agribusiness industry) is used as an omitted category. Themultiple regression results are reported in Table 12.
The adjusted R^ of the multiple regression is 0.3245indicating that 32.45% of the variation in the long runreturn is explained by the whole set of explanatory vari-ables. This explanatory power is rather high comparedwith the evidence reported by Ritter (1991) and Allen andPatrick (1994). Their adjusted R^ are 7% and 15.05%respectively.
Initial return and issue size still have a highly significantnegative effect on the two-year return. In contrast, theestimated coefficient on age becomes negative and signifi-cant. The signs of the estimated coefficient of the marketreturn and volume are still the same; positive for the marketreturn and negative for volume, but both of them becomestatistically insignificant. These results are opposed to thosereported by Ritter as well as Allen and Patrick. They findthat market return and annual volume has significant effect
Table 12. Multiple regression results with two-year return as thedependent variable {the numher of observations are 53).
Independentvariables
ConstantInitial returnMarket returnIssue sizeVolumeAgeCATlCAT!CAT4CAT5CAT6
Estimatedcoefficient
11.6513- 0.4744
0.2888- 0.5494- 0.0567- 1.1514
2.22171.16050.49890.76811.6978
Standarderror
3.8300.11550.68830.16041.5990.53470.66250.29960.30100.26790.5568
Prob |r| > X
0.002350.000040.67480.00060.97160.03130.00080.00010.09740.00410.0023
while initial underpricing is insignificant. Ritter also reportsthe coefficient on age is positive and significant.
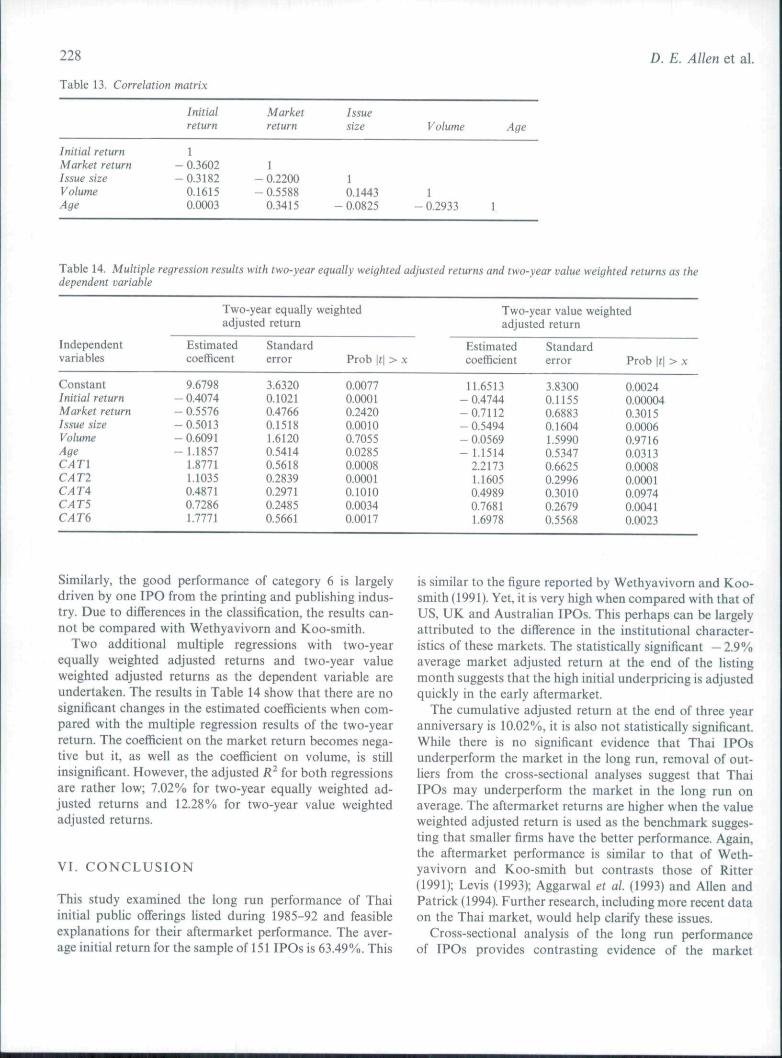
The alteration in the significance levels of the marketreturn and volume may be caused by a multicollinearityproblem. The correlation matrix in Table 13 shows that themarket return has a fairly high correlation with the annualvolume of IPOs. However, there are no significant changesin the significance level of both variables when either themarket return or the annual volume of IPOs is excludedfrom the multiple regression.
The positive signs on the estimated coefficient of alldummy variables suggest that all IPOs in these categoriesoutperform the IPOs in the omitted category; agribusinessindustry. The estimated coefficient of all categories exceptfor category 4 are highly significant. The category 4 issignificant at 10% level. Overall, the financial institutionsseem to have the best long-run performance. The superiorperformance in the financial institutions is mainly driven byIPOs for finance and securities; and insurance industries.
228 D. E. Allen et al.
Table 13. Correlation matrix
Initialreturn
Marketreturn
Issuesize Volume Age
Initial returnMarket returnIssue sizeVolumeAge
1- 0.3602-0.3182
0.16150.0003
1- 0.2200-0.5588
0.3415
10.1443
- 0.08251
- 0.2933
Table 14. Multiple regression results with two-year equally weighted adjusted returns and two-year value weighted returns as thedependent variable
Independentvariables
ConstantInitial returnMarket returnIssue sizeVolumeAgeCATlCATlCAT ACATSCAT6
Two-year equallyadjusted return
Estimatedcoefficent
9.6798- 0.4074- 0.5576-0.5013- 0.6091- 1.1857
1.87711.10350.48710.72861.7771
Standarderror
3.63200.10210.47660.15181.61200.54140.56180.28390.29710.24850.5661
weighted
Prob \t\ > X
0.00770.00010.24200.00100.70550.02850.00080.00010.10100.00340.0017
Two-year value weightedadjusted return
Estimatedcoefficient
11.6513- 0.4744-0.7112- 0.5494- 0.0569- 1.1514
2.21731.16050.49890.76811.6978
Standarderror
3.83000.11550.68830.16041.59900.53470.66250.29960.30100.26790.5568
Prob \t\> X
0.00240.000040.30150.00060.97160.03130.00080.00010.09740.00410.0023
Similarly, the good performance of category 6 is largelydriven by one IPO from the printing and publishing indus-try. Due to differences in the classification, the results can-not be compared with Wethyavivorn and Koo-smith.
Two additional multiple regressions with two-yearequally weighted adjusted returns and two-year valueweighted adjusted returns as the dependent variable areundertaken. The results in Table 14 show that there are nosignificant changes in the estimated coefficients when com-pared with the multiple regression results of the two-yearreturn. The coefficient on the market return becomes nega-tive but it, as well as the coefficient on volume, is stillinsignificant. However, the adjusted K* for both regressionsare rather low; 7.02% for two-year equally weighted ad-justed returns and 12.28% for two-year value weightedadjusted returns.
VI. C O N C L U S I O N
This study examined the long run performance of Thaiinitial public offerings Hsted during 1985-92 and feasibleexplanations for their aftermarket performance. The aver-age initial return for the sample of 151 IPOs is 63.49%. This
is similar to the figure reported by Wethyavivorn and Koo-smith (1991). Yet, it is very high when compared with that ofUS, UK and Australian IPOs. This perhaps can be largelyattributed to the difference in the institutional character-istics of these markets. The statistically significant — 2.9%average market adjusted return at the end of the listingmonth suggests that the high initial underpricing is adjustedquickly in the early aftermarket.
The cumulative adjusted return at the end of three yearanniversary is 10.02%, it is also not statistically significant.While there is no significant evidence that Thai IPOsunderperform the market in the long run, removal of out-liers from the cross-sectional analyses suggest that ThaiIPOs may underperform the market in the long run onaverage. The aftermarket returns are higher when the valueweighted adjusted return is used as the benchmark sugges-ting that smaller firms have the better performance. Again,the aftermarket performance is similar to that of Weth-yavivorn and Koo-smith but contrasts those of Ritter(1991); Levis (1993); Aggarwal et al. (1993) and Allen andPatrick (1994). Further research, including more recent dataon the Thai market, would help clarify these issues.
Cross-sectional analysis of the long run performanceof IPOs provides contrasting evidence of the market

Initial public offerings in Thailand 229
overreaction hypothesis. After excluding outliers, IPOsthat have a higher initial return tend to have the worseaftermarket performance. This negative relationship isconsistent with the overreaction hypothesis reported byAggarwal and Rivoli (1990); Ritter (1991} and Levis (1993).However analysis in relation to the size of the issuingcompany lo long run performance, reveals that smallerissues tend to perform better than larger issues in the longrun. This finding is in contrast to the market overreactionhypothesis supported by Ritter (1991); Levis (1993). Yet, it issimilar to the result of Allen and Patrick (1994).
With regard to evidence in relation to the market fadshypothesis, again the evidence with Thai IPOs is mixed. Theincreasing volume of IPOs during 1988-90 together withthe exceptionally high initial returns followed by long-rununderperformance even in the rising market appears to beconsistent with the hypothesis. After removing outliers,there is similar evidence that the annual volume of IPOs isnegative related to the two-year return and two-year valueweighted adjusted return. In contrast, the relation for thetwo-year equally weighted adjusted return appears to bepositive.
Analysis by industrial sector appears to be ambiguouswith the performance of IPOs in different industries varyingwidely. The long run performance of several industries isvery sensitive to the exceptional performance of individualissues. After adjusting for such issues, the long run returns inmost industries become negative. The wide variation in thelong run performance and the underperformance in manyindustries can be considered consistent with the fads hy-pothesis as reported by Ritter (1991). However, when con-sidering the age of IPO firms, the relationship between ageand initial underpricing is positive, and between age andlong run performance is negative. That is the younger firmshave lower initial returns but higher long run return. Thisrelationship is not indicative of the market fads hypothesis.
Regression analyses provide some evidence supportingthe previous results. Initial return, issue size and age arefound to be significantly and negatively related to the after-market returns. The estimated coefficients on market returnand annual volume of the IPOs, in contrast, are not statist-ically significant. While these results appear to be consistentwith the market overoptimism and fads hypotheses, theambiguous results from the cross-sectional analysis suggestthat firm specifics have more eifect on the long run perfor-mance than market conditions. It is suggested that perhapsfurther research, with more data over a three year period,would clarify whether or not the Thai IPO market exhibitscharacteristics consistent with these hypotheses.
ACKNOWLEDGEMENTS
The authors would like to thank the referees for theirvaluable and helpful comments.
REFERENCES
Aggarwal, R., Leal, R. and Hernanmdez. L. (1993) The aftermarketperformance of initial public offerings in Latin America,Financial Management, 22, 42-53,
Aggarwal, R. and Rivoli, P. (1990) Fads in the initial offeringmarket. Financial Management, 19(4),, 45-57.
Allen, D. E. and Patrick, M. (1994) Some further Australian evid-ence on the long-run performance of initial public offerings:1974-1984, Department of Finance and Banking, Curtin Uni-versity of Technology.
Agtmale, A. W. (1993) Thailand: from mini-market to leadingemerging market, in The World's Emerging Stock Markets,K. H. Park and A, W. Agtmale (Ed.) Probus Publishing,Chicago,
Anonymous (1994) Asian equity guide: Thailand, Asiamoney,March, 58-63.
Balvers, R. J., McDonald, B. and Miller, R. E. (1988) Underpricingofnew issues and the choice of auditor as a signal of Investmentbanker reputation. The Accounting Review, 63 (4), 605-22.
Baron, D. P. (1982) A model of the demand for investment bankingadvising and distribution services for new issues. Journal ofFinance, V {4% 955-76.
Banz, R. W. (1981) The relationship between return and marketvalue of common stocks. Journal of Financial Economics, 9(1),3-18.
Beatty, R. P. and Ritter, J. R. (1986) Investment banking, reputa-tion, and the underpricing of initial public offerings, Journa/o/Financial Economics., 15 (1/2), 213-32.
Booth, P, and Smith, C, J. (1986) Capital raising, underwriting andthe certification hypothesis. Journal of Finance, 15(1/2),261-81.
Chowdhry, B. and Sherman, A. (1996) International differences inoversubscription and underpricing of IPOs, Journal of Corpo-rate Finance. 2(4), 359-81.
Dawson, S, M, (1987) Secondary stock market performance ofinitial public offers. Hong Kong. Singapore and Malaysia:1978-84, Journal of Business Finance and Accounting, 45(1),65-76,
De Bondt, W, F. M. and Thaler, R. (1985) Does the stock marketoverreact? Journal of Finance, 40(3), 793-805.
De Bondt, W. F. M. and Thaler, R. (1987) Further evidence ofinvestor overreaction and stock market seasonality. Journal ofFinance, 42(3), 557-82.
Finn, F. J. and Higham, R. (1988) The performance of unseasonednew equity issues-cum-stock exchange listings in Australia,Journal of Banking and Finance, 12 (3), 333-51.
Hanley, K. W. and Ritter, J. R. (1992) Going public, in The NewPaigrave Dictionary of Money and Finance, (Eds) P. Newman, M.Milgate and J. Eatwell, Stockton Press, London, pp. 248-255.
Ibbotson. R. G, (1975) Price performance of common stock newissues. Journal of Financial Economics, 2(3), 235-72.
Ibbotson, R. G, and Jaffe, J. (1975) Hot issue markets. Journal ofFinance, :iO (4), 1027-42.
Keloharju, M, (1993) Winner's curse, legal liability and the long-run performance of initial public offerings in Finland, Journalof Financial Economics, 34(2), 251-77.
Leland, H. E. and Pyle, D. (1977) Information asymmetry, financialstructure, and financial intermediaries. Journal of Finance,32(2), 371-87.
Lian, D. C. B. (1993) Financial development in Thailand, Journalof Asian Business, 9(4), 110-37.
Levis, M. (1993) The long-run performance of initial public offer-ings: the UK experience 1980-88, Financial Management,22(1), 28-41.

230 D. E. Allen et al.
Loughrati, T., Ritter, J. R. and Rydqvist, K. (1994) Initial publicofferitigs: International insights, Pacific-Basin Finance Jour-nal 2{1,% 165-99.
McDonald, J. G. and Fisher, A. K. (1972) New-issue stock pricebehaviour, Journal of Finance, 27(1), 97-102.
Mustow, D. (1992) The long run performance of initial publicofferings and some factors affecting that performance. Hon-ours Dissertation, University of Melbourne.
Reilly, F. K. (1973) Further evidence on short run results for newissues investors. Journal of Financial and Quantitative Analy-sis, ^{\), 83-90.
Reilly, F. K. (1977) New issues revisited. Financial Management,6(4), 28-42.
Reilly, F. K. and Hatfield, K. (1969) Investor experiencewith new stock issues, Financiai Analysts Journal, 25(5),73-80.
Research and Development Department, The Stock Exchange ofThailand (1994) The Stock Market in Thailand 1994, TheStock Exchange of Thailand, Bangkok.
Ritter, J. R. (1984) The 'hot issue' market of 1980, Journal ofBusiness, SI {2), 215-40.
Ritter, J. R. (1991) The long-run performance of initial publicofferings, Journal of Finance, 46(1), 3-27.
Rock, K. (1986) Why new issues are underpriced, Journal of Finan-cial Economics, 15 (1/2), 187-212.
Shiller, R. J. (1990) Speculative prices and popular models. Journalof Economics Perspectives, 4, 55-65.
Stern, R. L. and Bornstein, P. (1985) Why new issues are lousyinvestments, Forbes, 136, 152-90.
The Stock Exchange of Thailand and Chandler and Thong-ek LawOffice Limited (1992) Rules, Conditions and Procedures Gov-erning Listing and Delisting Securities, Stock Exchange ofThailand, Bangkok.
Tinic, S. (1988) Anatomy of IPOs of common stock, Journal ofFinance, 43{4},n9-n2.
Titman, S. and Trueman, B. (1986) Information quality and thevaluation of new issues. Journal of Accounting and Economics,8(2), 159-72.
Wethyavivorn, K. and Koo-smith. Y. (1991) Initial public offers inThailand, 1988-89: price and returns pattern, in Pacific-BasinCapital Market Research, Volume II (Eds.), S. G. Rhee, andR. P. Chang, Elsvier Science Publishers, North Holland,pp. 379-94.
White, H. (1980) A heteroskedasticity consistent covariance matrixestimator and a direct test for heteroskedasticity, £co/io-
icfl, 48(4), 817-38.

Initial public offerings in Thailand
APPENDIX I: LISTING REQUIREMENTS
231
Qualifications Listed companyListed company in aprovincial zone
Infrastructure or basic industry(a newly established company)
1. Registered capital ^ 60 million Bahtin form of ordinaryshares
2. Total market ^ 500 million Bahtcapitalization
3. Cash payment for ordinary > 75% of the registeredshares in 1.
4. Distribution of ordinaryshares4.1 Number of small
shareholders
4.2 Total shares heldby small share-holder in 4
5. Nature of business
6. Business operations6.1 Operations
6.2 Past financial status
capital
600 shareholders30% of registeredcapital
Main business is beneficialto economy and society
40 million Baht 60 million Baht
^ 200 million Baht ^ 500 million Baht
Same as a listed company Same as a listed company
^ 300 shareholders^ 20% of registered
capital
600 shareholders30% of registered capital
At least 3 years of operatingtrack record undersubstantially the samemanagement
Company profit- Year 1 ^ 5 million Baht- Year 2 ^ 5 million Baht- Last year before filingapplication ^ 25 million Bahtand total for the last three years^ 50 million Baht or profit for
the last three years ^ 80million Baht
Same as a listed company 1. -Having an investment in a basicinfrastructure project witha concession period ^ 20 years or-Operating in a large scale basicindustry
2. Project cost ^ 10000 million Baht3. Having the need to raise funds to
commence the project4. Having an investment in a project by
the promoters > 50% of the paid upcapital for the whole project
5. Having a feasibility study
1. Same as listed company Having competent and experienced2. Having the main operation management in finance, production and
and most of the labour in marketingprovincial zone
Profit for the most recent yearor for the last two years ^ 1 5million Baht
Source: The Stock Exchange of Thailand (1994, p. 19)
232 D. E. Allen et al.
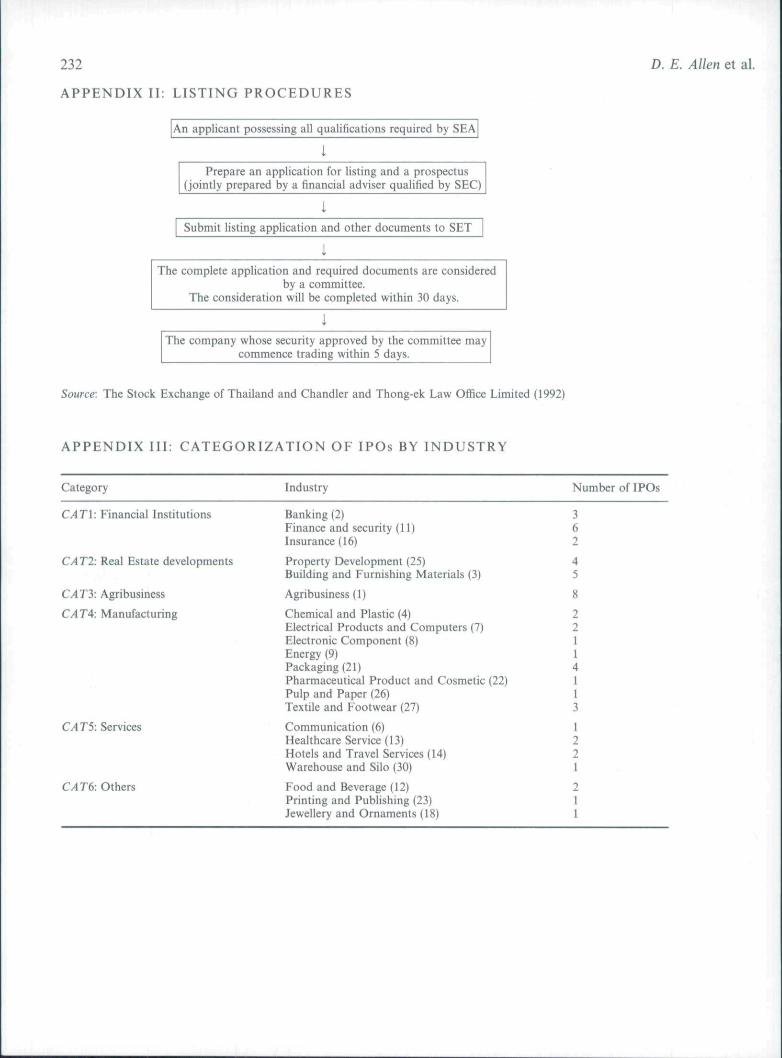
APPENDIX II: LISTING PROCEDURES
An applicant possessing all qualifications required by SEA
iPrepare ati application for listing and a prospectus
(jointly prepared by a financial adviser qualified by SEC)
iSubmit listing applicatioti and other documents to SET
iThe complete application and required documents are considered
by a committee.The consideration wili be completed within 30 days.
IThe company whose security approved by the committee may
commence trading within 5 days.
Source: The Stock Exchange of Thailand and Chandler and Thong-ek Law Office Limited (1992)
APPENDIX III: CATEGORIZATION OF IPOs BY INDUSTRY
Category Industry Number of IPOs
CATl: Financial Institutions
CATl. Real Estate developments
CAT}: Agribusiness
CAT A: Manufacturing
CAT5: Services
CATb: Others
Banking (2)Finance and security (II)Insurance (16)
Property Development (25)
Building and Furnishing Materials (3)
Agribusiness (1)
Chemical and Plastic (4)Electrical Products and Computers (7)Electronic Component (8)Energy (9)Packaging (21)Pharmaceutical Product and Cosmetic (22)Pulp and Paper (26)Textile and Footwear (27)Communication (6)Healthcare Service (13)Hotels and Travel Services (14)Warehouse and Silo (30)
Food and Beverage (12)Printing and Publishing (23)Jewellery and Ornaments (18)