Embed Size (px)
Citation preview
The Many Faces of
PovertyVolume 8
The Many Faces of Poverty: Volume 8Copyright © PEP-CBMS Network Office, 2017
ALL RIGHTS RESERVED.No part of this publication may be reproduced, stored in a retrievalsystem, or transmitted in any form or by any means—whether virtual,electronic, mechanical, photocopying, recording, or otherwise—without the written permission of the copyright owner.
Acknowledgements
The publication of this volume has been made possible through the PEP-CBMSNetwork Office based at the Angelo King Institute for Economic and Business Studiesof De La Salle University-Manila with the aid of a grant from the InternationalDevelopment Research Centre (IDRC) of Canada and the Department for InternationalDevelopment (DFID) of United Kingdom.
Published by De La Salle University Publishing House for the CBMS International Network Coordinating Team
First printing, 2017
Published and distributed byDe La Salle University2401 Taft Avenue, Manila, Philippines 0922Tel. No: (632) 524-4611 loc. 271Telefax: (632) 523-4281Emails: [email protected]: http://www.dlsu.edu.ph/offices/publishing-house/default.asp
The De La Salle University Publishing House is the publications officeof De La Salle University, Manila, Philippines
Printed in the Philippines
Prepared byCelia M. ReyesAnne Bernadette E. MandapJasminda A. QuilitisSteffie Joi I. CalubayanJezha Lee Z. NabiongRachelle Gladys M. AudarVincent Brylle W. BiñasEva Salve T. BacudJoshua D. Moreto
CONTENTS
Foreword
Introduction
Explanatory Text
The Many Faces of Poverty
Province of Albay
City of Balanga
City of Candon
Province of Marinduque
i
City of Marikina
City of Parañaque
1
3
9
87
135
167
199
231
CONTENTS
City of Valenzuela263
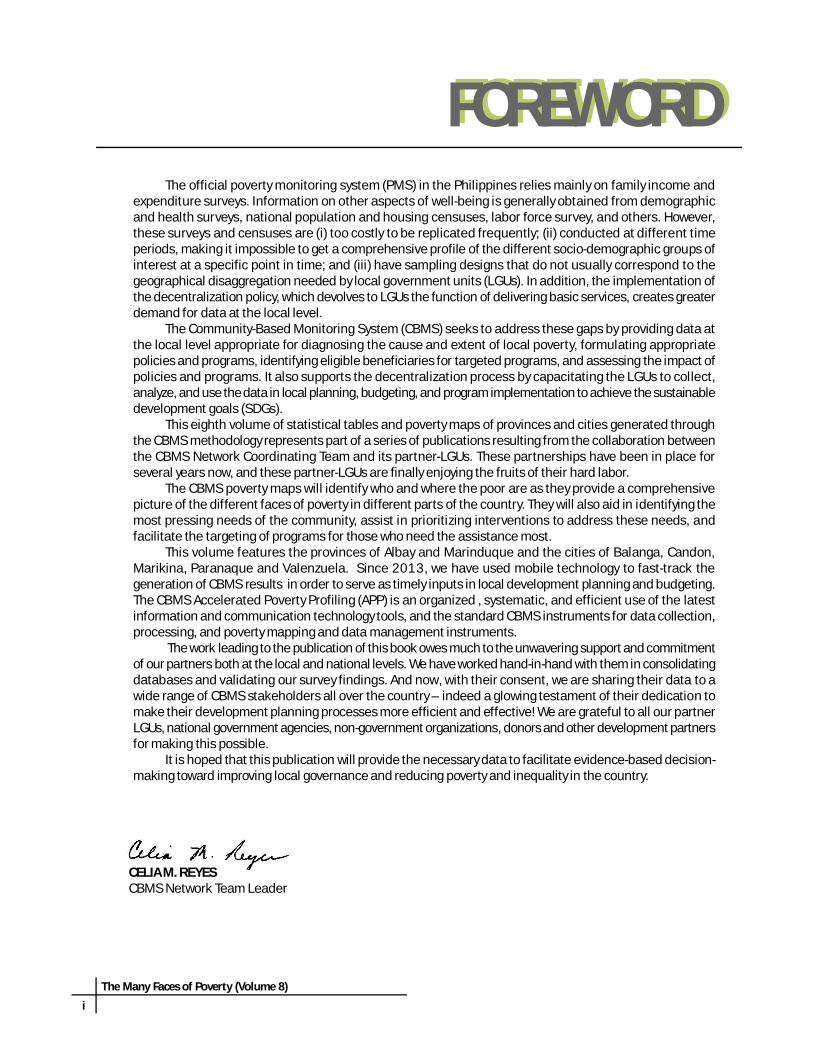
FOREWORDThe official poverty monitoring system (PMS) in the Philippines relies mainly on family income and
expenditure surveys. Information on other aspects of well-being is generally obtained from demographicand health surveys, national population and housing censuses, labor force survey, and others. However,these surveys and censuses are (i) too costly to be replicated frequently; (ii) conducted at different timeperiods, making it impossible to get a comprehensive profile of the different socio-demographic groups ofinterest at a specific point in time; and (iii) have sampling designs that do not usually correspond to thegeographical disaggregation needed by local government units (LGUs). In addition, the implementation ofthe decentralization policy, which devolves to LGUs the function of delivering basic services, creates greaterdemand for data at the local level.
The Community-Based Monitoring System (CBMS) seeks to address these gaps by providing data atthe local level appropriate for diagnosing the cause and extent of local poverty, formulating appropriatepolicies and programs, identifying eligible beneficiaries for targeted programs, and assessing the impact ofpolicies and programs. It also supports the decentralization process by capacitating the LGUs to collect,analyze, and use the data in local planning, budgeting, and program implementation to achieve the sustainabledevelopment goals (SDGs).
This eighth volume of statistical tables and poverty maps of provinces and cities generated throughthe CBMS methodology represents part of a series of publications resulting from the collaboration betweenthe CBMS Network Coordinating Team and its partner-LGUs. These partnerships have been in place forseveral years now, and these partner-LGUs are finally enjoying the fruits of their hard labor.
The CBMS poverty maps will identify who and where the poor are as they provide a comprehensivepicture of the different faces of poverty in different parts of the country. They will also aid in identifying themost pressing needs of the community, assist in prioritizing interventions to address these needs, andfacilitate the targeting of programs for those who need the assistance most.
This volume features the provinces of Albay and Marinduque and the cities of Balanga, Candon,Marikina, Paranaque and Valenzuela. Since 2013, we have used mobile technology to fast-track thegeneration of CBMS results in order to serve as timely inputs in local development planning and budgeting.The CBMS Accelerated Poverty Profiling (APP) is an organized , systematic, and efficient use of the latestinformation and communication technology tools, and the standard CBMS instruments for data collection,processing, and poverty mapping and data management instruments.
The work leading to the publication of this book owes much to the unwavering support and commitmentof our partners both at the local and national levels. We have worked hand-in-hand with them in consolidatingdatabases and validating our survey findings. And now, with their consent, we are sharing their data to awide range of CBMS stakeholders all over the country – indeed a glowing testament of their dedication tomake their development planning processes more efficient and effective! We are grateful to all our partnerLGUs, national government agencies, non-government organizations, donors and other development partnersfor making this possible.
It is hoped that this publication will provide the necessary data to facilitate evidence-based decision-making toward improving local governance and reducing poverty and inequality in the country.
i
The Many Faces of Poverty (Volume 8)
CELIA M. REYESCBMS Network Team Leader
FOREWORD
INTRODUCTION
The Many Faces of Poverty (Volume 8)
1
1 Decentralization in the Philippines: Strengthening Local Government Financing and Resource Management in the Short-Term, 2005 (A joint document of the World Bank and the Asian Development Bank).
Table 1. Internal Revenue Allotment of LocalGovernment Units, 2013–2016
Year2016
2015
2014
2013
TOTALAve. per yearSource: DBM
Amount(in P billion)
428.6
389.9
341.6
302.3
1,462.4365.6
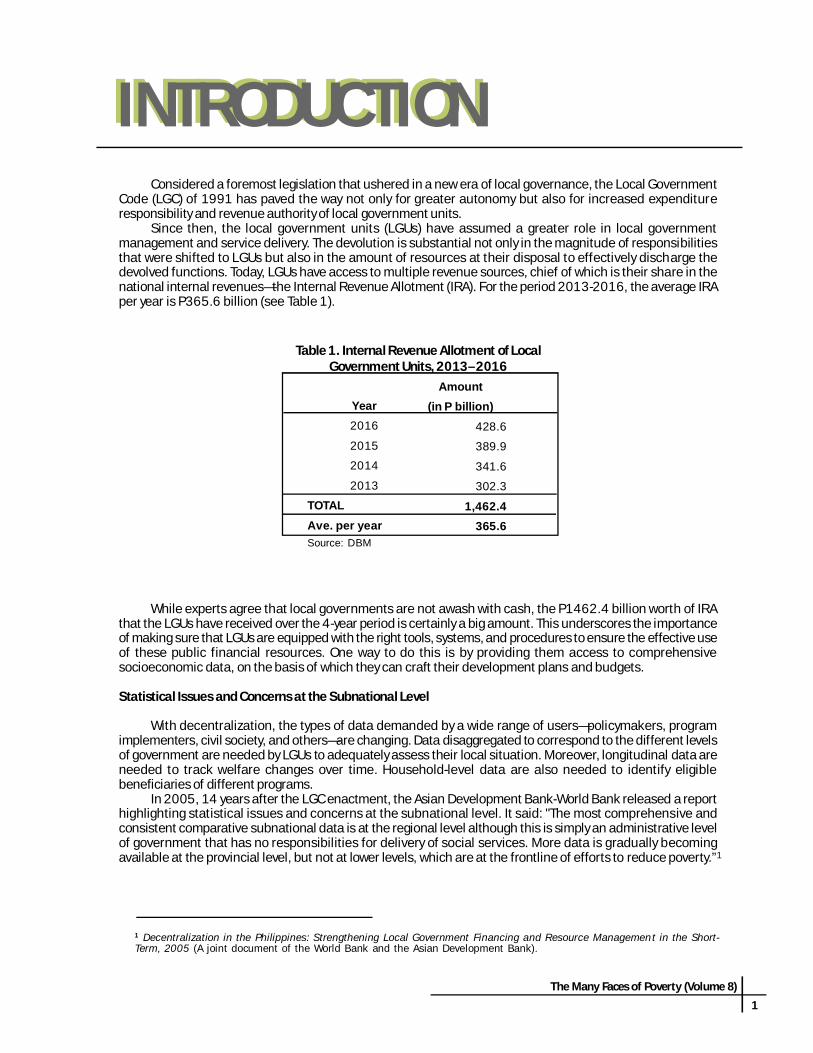
INTRODUCTIONConsidered a foremost legislation that ushered in a new era of local governance, the Local Government
Code (LGC) of 1991 has paved the way not only for greater autonomy but also for increased expenditureresponsibility and revenue authority of local government units.
Since then, the local government units (LGUs) have assumed a greater role in local governmentmanagement and service delivery. The devolution is substantial not only in the magnitude of responsibilitiesthat were shifted to LGUs but also in the amount of resources at their disposal to effectively discharge thedevolved functions. Today, LGUs have access to multiple revenue sources, chief of which is their share in thenational internal revenues—the Internal Revenue Allotment (IRA). For the period 2013-2016, the average IRAper year is P365.6 billion (see Table 1).
While experts agree that local governments are not awash with cash, the P1462.4 billion worth of IRAthat the LGUs have received over the 4-year period is certainly a big amount. This underscores the importanceof making sure that LGUs are equipped with the right tools, systems, and procedures to ensure the effective useof these public financial resources. One way to do this is by providing them access to comprehensivesocioeconomic data, on the basis of which they can craft their development plans and budgets.
Statistical Issues and Concerns at the Subnational Level
With decentralization, the types of data demanded by a wide range of users—policymakers, programimplementers, civil society, and others—are changing. Data disaggregated to correspond to the different levelsof government are needed by LGUs to adequately assess their local situation. Moreover, longitudinal data areneeded to track welfare changes over time. Household-level data are also needed to identify eligiblebeneficiaries of different programs.
In 2005, 14 years after the LGC enactment, the Asian Development Bank-World Bank released a reporthighlighting statistical issues and concerns at the subnational level. It said: "The most comprehensive andconsistent comparative subnational data is at the regional level although this is simply an administrative levelof government that has no responsibilities for delivery of social services. More data is gradually becomingavailable at the provincial level, but not at lower levels, which are at the frontline of efforts to reduce poverty.”1
Local Poverty Monitoring System Rise up to the Challenge
Owing to still unresolved statistical issues and concerns at the subnational level, an increasing number of LGUs allover the country have taken the initiative to adopt and establish the Community-Based Monitoring System (CBMS).National government agencies have likewise recognized the value of CBMS as a cost-effective tool for variousthematic concerns such as the Millenium Development Goals/Sustainable Development Goals, gender anddevelopment, Disaster Risk Reduction and Management (DRRM), and Climate Change Adaptation (CCA), Bottom-Up Budgeting (BUB), and migration and development, among others.
The CBMS was developed in 1993 to fill in the necessary information for more evidence-based planning andprogram implementation and for monitoring the micro-level impacts of macro policies and shocks particularly onthe most vulnerable groups of the population. CBMS is an organized process of collecting, processing, validatingand use of data for various development concerns. It was designed as a system that can be used and sustained byLGUs over time and facilitates information sharing at each geopolitical level for purposes of better policymakingand program implementation.
Since the early 2000, the implementation and use of CBMS has been supported by policy issuances at the localand national levels. Also, the inclusion of CBMS in the list of projects that can be funded through the BUB funds isa recognition that CBMS is important in facilitating evidence-based decision-making. Some of the policy issuancesare as follows:
o DILG Memorandum Circular 2001-105
Issued in August 2001, the circular enjoins all local chief executives to undertake local programs on povertyreduction and economic transformation and emphasized the need to designate Local Poverty Reduction ActionOfficers (LPRAOs) and to formulate a Local Poverty Reduction Action Plan (LPRAP).
o NAPC En Banc Resolution No. 7Issued in March 2003, the resolution directs LGUs to adopt the 13 core local poverty indicators as the minimum setof community-based information for poverty diagnosis and planning at the local levels and integrate such informationin their local poverty monitoring system and local level action plans and program.
o DILG Memorandum Circular 2003-92Issued in April 2003, it provides policy guidelines for the adoption of the 13 core local poverty indicators for planning.The guidelines shall aid the LGUs in assessing and understanding poverty and its dimensions at the barangays,municipalities, cities and provinces with the end view of formulating an LPRAP and implementing the plans andprograms to reduce poverty.
o DILG Memorandum Circular 2004-152Issued in November 2004, the circular encourages LGUs to intensify efforts in implementing programs, projects andactivities towards the achievement of the millennium development goals (MDGs).
o NSCB Resolution No. 6, Series of 2005Issued in January 24, 2005, the resolution recognizes the CBMS as a viable and cost efficient system that can be usedto generate the Core Local Poverty Indicators (CLPIs) and ensure uniformity and standardization of CLPI databases ofall LGUs. It further enjoined the NAPC, DILG, other government agencies and LGUs to coordinate with the CBMSInternational Network Coordinating Team towards the fastracking and full implementation of the CBMS.
o League of Municipalities of the Philippines (LMP) Memorandum Circular 027-2006Issued in June 2006, enjoining all CBMS-implementing municipalities to adopt/sustain the adoption of the CBMS asa tool for local poverty diagnosis and ensure the incorporation of the MDG targets and utilization of CBMS data in theformulation of local development plans.
o SDC Resolution No. 3, Series of 2006Issued on July 19, 2006, the resolution adopts the CBMS as the prescribed monitoring tool for the generation of theCore Local Poverty Indicator Database. It further enjoined the NAPC, DILG, other government agencies and LGUs tocoordinate with the CBMS Network Coordinating Team towards the fast-tracking and full implementation of the CBMS.
o PhilHealth Board Resolution No. 982, S.2007In March 2007, the Philippine Health Insurance Corporation (PhilHealth) adopted the CBMS as the principal source ofdata in identifying indigent families to be enrolled under the sponsorship program of the National Health Insurance
2
The Many Faces of Poverty (Volume 8)
The Many Faces of Poverty (Volume 8)
3
Program (NHIP). The Program is implemented in partnership with the local government units (LGUs) and PhilHealth.The LGU and the National Government through PhilHealth share the annual premium payment of P1,200 per indigenthousehold to get enrolled.
o League of Provinces of the Philippines (LPP) Resolution No. 2011-01Issued in January 28, 2011, urging the Department of Social and Welfare Development (DSWD) and the Departmentof Health (DOH) to adopt the CBMS and other locally-developed poverty monitoring systems as its targeting system inidentifying beneficiaries to the Pantawid Pamilyang Pilipino Program (4Ps) and the Philhealth Indigent SponsoredProgram
o DBM-DILG-DSWD-NAPC Joint Memorandum Circular No. 1, Series of 2012Issued on March 8, 2012, the joint memorandum circular identifies the collection of relevant economic and socialdata such as those that can be obtained from CBMS, as one of the main components in empowering poor LGUs and inthe bottom-up planning and budgeting approach.
o DILG Memorandum Circular 2012-73Issued on April 17, 2012, the circular provides that the Local Disaster Risk Reduction and Management Fund can beutilized for disaster prevention and mitigation projects including the implementation of a CBMS with CCA/DRRMindicators.
o DILG Memorandum Circular 2012-142Issued in August 10, 2012, the circular enjoins all local chief executives to utilize the community-based monitoringsystem (CBMS) in planning and project development. It also recommends for the adoption of CBMS to coincide withthe synchronized local planning and budgeting calendar and with the bottom up planning and budgeting preparationcalendar.
o DILG Memorandum Circular 2016-69Issued in May 23, 2016, the circular provides policy guidelines for the implementation of CBMS and capacitydevelopment projects on GAD and DRR-CCA under the FY 2016 Bottom-Up Budgeting (BUB). The guidelines shall aid theLGUs for the efficient and effective execution of subproject components, monitoring, and reporting of projects underthe BUB program.
As of February 2, 2017, CBMS is being implemented in 77 provinces (32 of which are implementing the systemprovince-wide), 903 municipalities, and 79 cities, covering a total of 24,676 barangays. Data generated by CBMShave so far been used in diagnosing the nature and extent of poverty in their localities, identifying appropriateinterventions, identifying eligible beneficiaries of poverty reduction programs, and monitoring the impact of someof these programs.
Parallel with efforts to establish databanks at each geopolitical level, a national repository of CBMS data has alsobeen established at the CBMS Network Office, the Department of the Interior and Local Government (DILG) andthe National Anti-Poverty Commission (NAPC). The national repository aims to facilitate data sharing acrossgovernment agencies, the private sector, donor agencies, and other relevant stakeholders. Specifically, the nationalrepository will (i) facilitate the access and use of the integrated CBMS database by national entities in theiradvocacy work with key decision makers, (ii) support government and non-government funding sources instrengthening evidence-based planning and monitoring and in aligning their interventions to national priorities,and (iii) facilitate the implementation of targeted programs.
Concluding Remarks
Public statistics will increasingly shape public agenda at the local level as more and more LGUs establish their ownmonitoring systems to make their development planning processes more efficient and effective. In this scenario,local poverty monitoring systems such as the CBMS will have an extremely important role to play.
The country's experience with local-level poverty monitoring systems clearly demonstrates that there can be acomprehensive picture of the poverty situation. Very few, if any, national surveys collect information on the differentdimensions of poverty. There is a survey on income and expenditure, another on health, another on education,another on employment, another on nutrition, and others. As the samples and the reference periods are different,there is no comprehensive picture of the poverty status of the population at any point in time. This is where CBMScan make a difference as it addresses these gaps through its set of core indicators relating to the differentdimensions of poverty.
4
The Many Faces of Poverty (Volume 8)
EXPLANATORY TEXTA. CBMS Core Indicators
The statistical tables and poverty maps presented in this volume pertain to the CBMS Core Indicators(also known as Core Local Poverty Indicators1), which were generated using the CBMS methodology.
The CBMS Core Indicators are a set of carefully selected indicators that capture the multiple dimensionsof poverty. They define the basic criteria for attaining a decent quality of life and correspond to theminimum basic needs covering (a) health, (b) nutrition, (c) housing, (d) water and sanitation, (e) basiceducation, (f) income, (g) employment, and (h) peace and order. Together, these indicators provideinformation not only on how poor a community is, but also on who in the community is poor, and where.
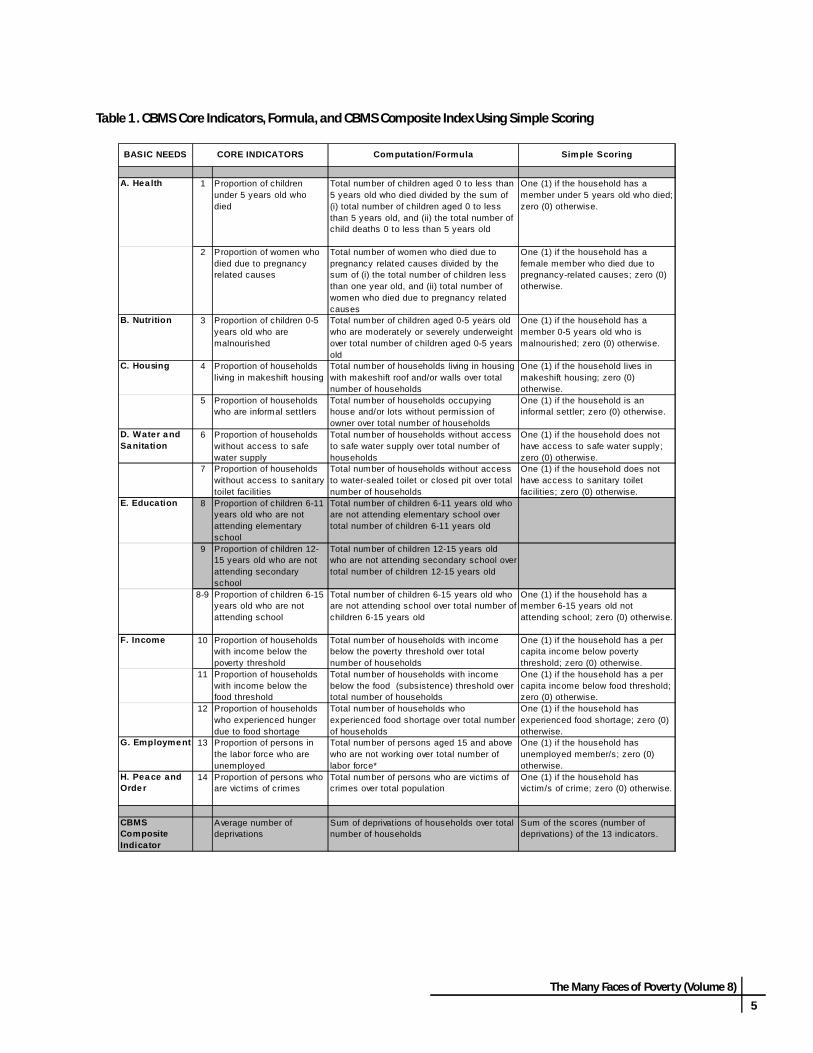
The CBMS Core Indicators are presented in Table 1. Meanwhile, the poverty and food thresholds usedare presented in Table 2.
1 The Department of the Interior and Local Government (DILG) has issued Memorandum Circular 2003-92 (April 2003) toset policy guidelines for the adoption of the 13 core local poverty indicators, for planning and Memoradum Circular 2004-152(November 2004) to encourage LGUs to intensify efforts toward the achievement of the millennium development goals (MDGs).The latter circular also enjoins LGUs to use monitoring systems such as MBN-CBIS, CBMS, IRAP, etc., to monitor and diagnosethe nature and extent of poverty in their respective localities. CBMS was adopted by the DILG as the data collection andprocessing system for the CLPIMS which was the tool adopted to monitor the MDGs for LGUs.
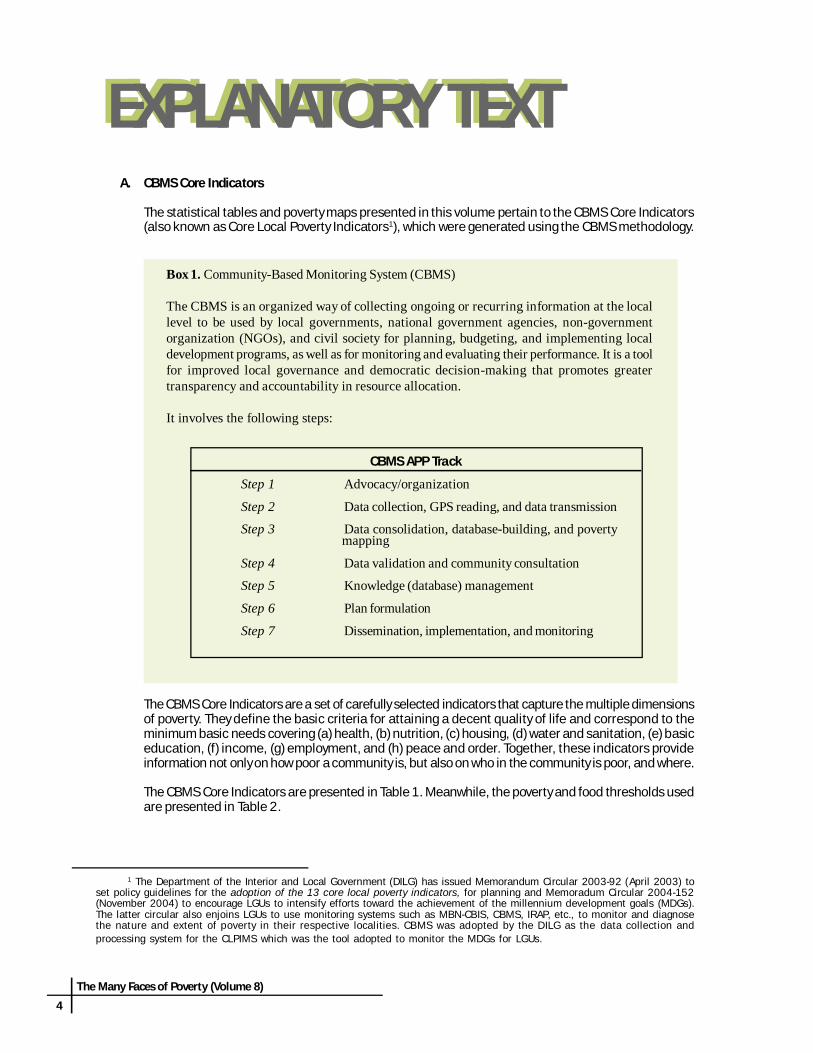
Box 1. Community-Based Monitoring System (CBMS)
The CBMS is an organized way of collecting ongoing or recurring information at the locallevel to be used by local governments, national government agencies, non-governmentorganization (NGOs), and civil society for planning, budgeting, and implementing localdevelopment programs, as well as for monitoring and evaluating their performance. It is a toolfor improved local governance and democratic decision-making that promotes greatertransparency and accountability in resource allocation.
It involves the following steps:
CBMS APP Track
Step 1 Advocacy/organization
Step 2 Data collection, GPS reading, and data transmission
Step 3 Data consolidation, database-building, and poverty mapping
Step 4 Data validation and community consultation
Step 5 Knowledge (database) management
Step 6 Plan formulation
Step 7 Dissemination, implementation, and monitoring
EXPLANATORY TEXT
The Many Faces of Poverty (Volume 8)
5
Table 1. CBMS Core Indicators, Formula, and CBMS Composite Index Using Simple Scoring
A. Hea lth 1 Proportion of children under 5 years old who died
Total number of children aged 0 to less than 5 years old who died divided by the sum of (i) total number of children aged 0 to less than 5 years old, and (ii) the total number of child deaths 0 to less than 5 years old
One (1) if the household has a member under 5 years old who died; zero (0) otherwise.
2 Proportion of women who died due to pregnancy related causes
Total number of women who died due to pregnancy related causes divided by the sum of (i) the total number of children less than one year old, and (ii) total number of women who died due to pregnancy related causes
One (1) if the household has a female member who died due to pregnancy-related causes; zero (0) otherwise.
B. Nutrition 3 Proportion of children 0-5 years old who are malnourished
Total number of children aged 0-5 years old who are moderately or severely underweight over total number of children aged 0-5 years old
One (1) if the household has a member 0-5 years old who is malnourished; zero (0) otherwise.
C. Housing 4 Proportion of households living in makeshift housing
Total number of households living in housing with makeshift roof and/or walls over total number of households
One (1) if the household lives in makeshift housing; zero (0) otherwise.
5 Proportion of households who are informal settlers
Total number of households occupying house and/or lots without permission of owner over total number of households
One (1) if the household is an informal settler; zero (0) otherwise.
D. Water and Sanitation
6 Proportion of households without access to safe water supply
Total number of households without access to safe water supply over total number of households
One (1) if the household does not have access to safe water supply; zero (0) otherwise.
7 Proportion of households without access to sanitary toilet facilities
Total number of households without access to water-sealed toilet or closed pit over total number of households
One (1) if the household does not have access to sanitary toilet facilities; zero (0) otherwise.
E. Education 8 Proportion of children 6-11 years old who are not attending elementary school
Total number of children 6-11 years old who are not attending elementary school over total number of children 6-11 years old
9 Proportion of children 12-15 years old who are not attending secondary school
Total number of children 12-15 years old who are not attending secondary school over total number of children 12-15 years old
8-9 Proportion of children 6-15 years old who are not attending school
Total number of children 6-15 years old who are not attending school over total number of children 6-15 years old
One (1) if the household has a member 6-15 years old not attending school; zero (0) otherwise.
F. Income 10 Proportion of households with income below the poverty threshold
Total number of households with income below the poverty threshold over total number of households
One (1) if the household has a per capita income below poverty threshold; zero (0) otherwise.
11 Proportion of households with income below the food threshold
Total number of households with income below the food (subsistence) threshold over total number of households
One (1) if the household has a per capita income below food threshold; zero (0) otherwise.
12 Proportion of households who experienced hunger due to food shortage
Total number of households who experienced food shortage over total number of households
One (1) if the household has experienced food shortage; zero (0) otherwise.
G. Employment 13 Proportion of persons in the labor force who are unemployed
Total number of persons aged 15 and above who are not working over total number of labor force*
One (1) if the household has unemployed member/s; zero (0) otherwise.
H. Peace and Order
14 Proportion of persons who are vict ims of crimes
Total number of persons who are victims of crimes over total population
One (1) if the household has victim/s of crime; zero (0) otherwise.
CBMS Composite Indicator
Average number of deprivations
Sum of deprivations of households over total number of households
Sum of the scores (number of deprivations) of the 13 indicators.
BASIC NEEDS CORE INDICATORS Computation/Formula Simple Scoring
B. CBMS Methodology
The CBMS is an organized processing of collecting, processing, validating and use of information and isbeing implemented using structured instruments and training modules. One of the primary objectives ofthe CBMS is to generate data to diagnose the extent and causes of poverty, formulate appropriate plansand programs,identify eligible beneficiaries and assess the impacts of policies and programs.
Data used in this report is a by-product of the CBMS implementation by the LGUs featured in this volume.In particular, primary data was generated using the CBMS Accelerated Poverty Profiling (APP)2 tools includingthe CBMS Scan and PORTAL (using android gadgets and ICT for data collection), the CBMS StatSim (dataprocessing) and Quantum GIS (QGIS)3 for poverty mapping.
Primary data collection was done through the conduct of a household census administered by trained localenumerators and field coordinators using the standard CBMS APP modules and instruments (householdprofile questionnaires and barangay profile questionnaires). Data from the census operations aretransmitted and stored in a CBMS PORTAL and are likewise established at the databanks at the LGU-level.
C. Authority of the CBMS Census
In 2005, the Philippine Statisical Authority (formerly National Statistical Coordination Board) has issuedResolution No. 6, which recognizes and enjoins support to the CBMS as a tool for strengthening thestatistical system at the local level. It also directs the PSA Technical Staff to initiate and coordinate an
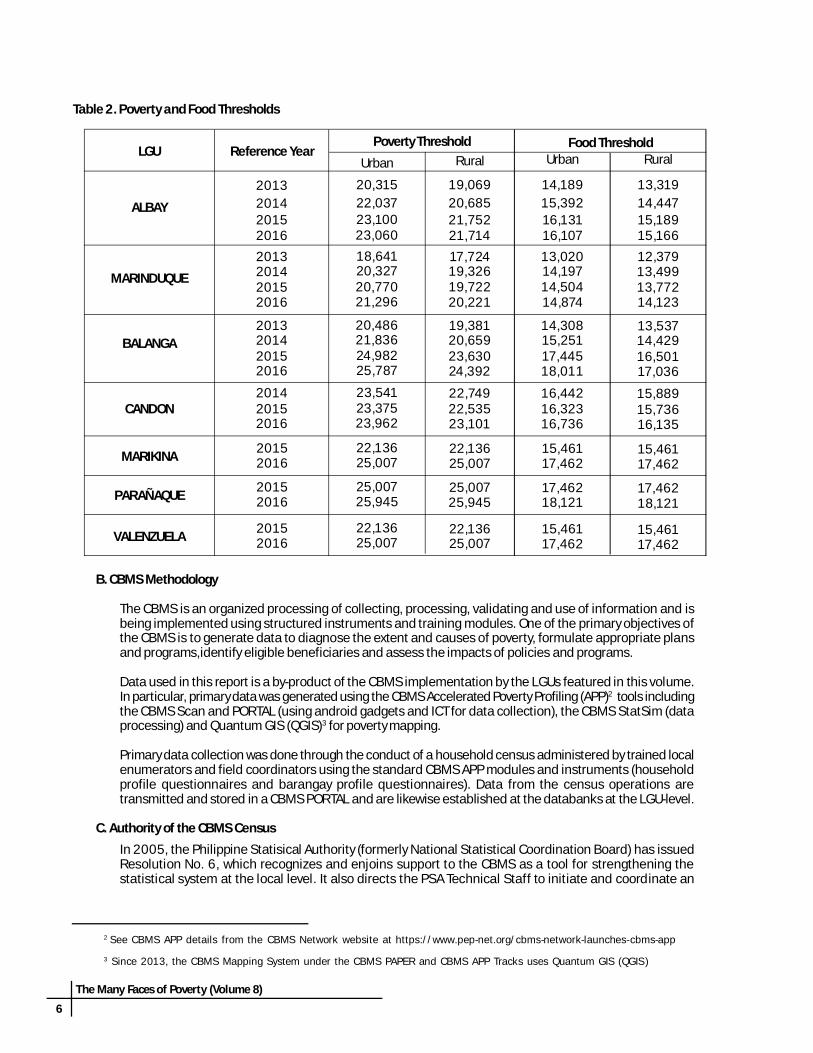
Table 2. Poverty and Food Thresholds
2 See CBMS APP details from the CBMS Network website at https://www.pep-net.org/cbms-network-launches-cbms-app
3 Since 2013, the CBMS Mapping System under the CBMS PAPER and CBMS APP Tracks uses Quantum GIS (QGIS)
LGU Reference YearPoverty Threshold Food Threshold
ALBAY
2013201420152016
MARINDUQUE
2013201420152016
BALANGA
CANDON
MARIKINA
Urban Rural Urban Rural
2013201420152016
201420152016
20152016
PARAÑAQUE 20152016
VALENZUELA 20152016
20,31522,03723,10023,06018,64120,32720,77021,296
20,48621,83624,98225,787
23,54123,37523,962
22,13625,007
25,00725,945
22,13625,007
19,06920,68521,75221,71417,72419,32619,72220,221
19,38120,65923,63024,392
22,74922,53523,101
22,13625,007
25,00725,945
22,13625,007
14,18915,39216,13116,10713,02014,19714,50414,874
14,30815,25117,44518,011
16,44216,32316,736
15,46117,462
17,46218,121
15,46117,462
13,31914,44715,18915,16612,37913,49913,77214,123
13,53714,42916,50117,036
15,88915,73616,135
15,46117,462
17,46218,121
15,46117,462
6
The Many Faces of Poverty (Volume 8)
The Many Faces of Poverty (Volume 8)
7
advocacy program for the adoption of the CBMS by the LGUs, through the Regional Statistical CoordinationCommittees (RSCCs), the technical arm of the Executive Board in the regions. The PSA has also approvedthe 2015 CBMS Questionnaire (PSA Approval No.DILG1540-01 and DILG-1540-02).
D. CBMS Census Operations
All census operations were undertaken under the supervision of the CBMS Technical Working Groups(TWGs) at the City Levels. They identified the local personnel who were trained as enumerators and fieldcoordinators. Technical assistance was provided by the PEP-CBMS Network Office and the Department ofthe Interior and Local Government (DILG).
Training is mainly conducted at two levels. The first level training (Training of Trainors) is conducted formembers of the TWGs. This is conducted by a pool of CBMS Accredited Trainers from the DILG . Meanwhile,a second level training (Training of Enumerators) is conducted for enumerators--usually composed ofbarangay health workers and students. Members of the TWG act as trainors in this training.
E. Data Processing System
The CBMS Statistics Simulator (CBMS STATSIM) was developed by the CBMS International NetworkCoordinating Team to process the data from the CBMS census. It is designed to automatically computeand generate tables containing the 13+1 core indicators of poverty, the MDG indicators, and DRRM-related indicators, among others.
Poverty maps are generated using the Quantum GIS (QGIS). QGIS is capable of creating and storing spatial(shapefiles) and non-spatial (texts and numbers) data as well as generating maps, reports and graphsideal for presentation and analysis of poverty attributes in the community. This has significantly addressedthe need for a simple yet powerful and free geographically-oriented database.
These systems can be accessed and are being provided by the CBMS Network for free to CBMS APPimplementing LGUs in the country.
E. CBMS Poverty Maps
The poverty map for each indicator is prepared at the province and/or city level. A simple color scheme isused for the poverty maps. Green, light green, pink and red represents the four ranges of data for eachindicator. Shades of green indicate performance better than the province and/or city average while shadesof red indicate performance worse than the province and/or city average. Each indicator, however, used adifferent range relative to the province and/or city data. Meanwhile, gray is used to indicate that the CBMSdata for the particular LGU is not included and/or available.
F. Dimensions of Poverty
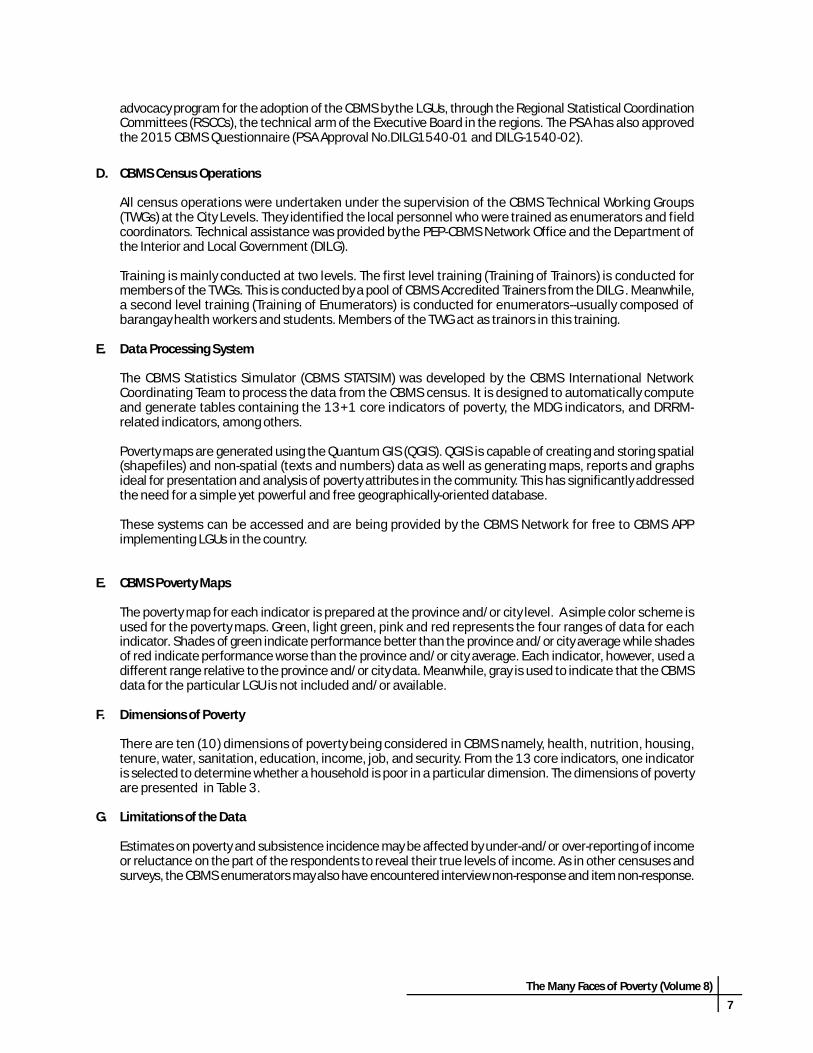
There are ten (10) dimensions of poverty being considered in CBMS namely, health, nutrition, housing,tenure, water, sanitation, education, income, job, and security. From the 13 core indicators, one indicatoris selected to determine whether a household is poor in a particular dimension. The dimensions of povertyare presented in Table 3.
G. Limitations of the Data
Estimates on poverty and subsistence incidence may be affected by under-and/or over-reporting of incomeor reluctance on the part of the respondents to reveal their true levels of income. As in other censuses andsurveys, the CBMS enumerators may also have encountered interview non-response and item non-response.
Table 3. Dimensions of Poverty
Dimension Indicator Poverty Status
Health Proportion of children under 5 yearsold who died
If household has at least one child under 5years old who died, then the household isconsidered health poor
Nutrition Proportion of children 0-5 years oldwho are malnourished
If household has at least one child 0-5 yearsold who are malnourished, then thehousehold is considered nutrition poor
Housing Proportion of households living inmakeshift housing
If household is living in makeshifthousing, then the household isconsidered housing poor
Tenure Proportion of households who areinformal settlers
If household is an informal settler, then thehousehold is considered tenure poor
Water Proportion of households withoutaccess to safe water supply
If household has no access to safe watersupply, then the household is consideredwater poor
Sanitation Proportion of households withoutaccess to sanitary toilet facilities
If household has no access to sanitary toiletfacilities, then the household is consideredsanitation poor
Education Proportion of children 6-15 years oldwho are not attending school
If household has at least one child 6-15 yearsold who is not attending school, then thehousehold is considered education poor
Income Proportion of households withincome below the food threshold
If the per capita income of the household isbelow the the food threshold, then thehousehold is considered income poor
Job Proportion of persons in the laborforce who are unemployed
If household has at least one unemployedmember, then the household isconsidered job poor
Security Proportion of persons who arevictims of crime
If household has at least one member whohas been a victim of crime, then thehousehold is considered security poor
8
The Many Faces of Poverty (Volume 8)

The Many Faces of Poverty (Volume 8)
231
Republic of the PhilippinesCITY OF PARAÑAQUE
Message
I am pleased to extend warm greetings to the Community-Based MonitoringSystem (CBMS) Network for providing free technical assistance -- from the datacollection stage to the building of the CBMS database in cooperation with theBureau of Local Government Development of the Department of Interior and LocalGovernment (DILG-BLGD) to the institutionalization of the CBMS to generate baselinedata for poverty diagnosis, monitoring, and ecological profiling.
The City Government of Paranaque has just come up with the results of itsfirst Community-Based Monitoring System comprising of 16 Barangays. The resultsrepresent different facets of poverty which will be used as basis for the preparationof our local development plans, investment programming and other purposes.
Poverty is too critical an issue that everyone, irrespective of politicalaffiliation and leaning, should be deeply concerned about its eradication. Effectivepoverty alleviation must respond to the needs of population groups with the view of improving the living standards of thepeople. There should be sufficient participation of the grassroots people in the identification and implementation ofprojects, and in the provision of greater opportunities for "bottom-up approach". This will not only increase theircommitment to such program but also promote empowerment as well as sustainability.
Congratulations to the CBMS Network on the upcoming publication of "The Many Faces of Poverty."
Let us work together and embrace the challenges that the future holds!
Maraming salamat po.
EDWIN OLIVAREZCity Mayor
232
The Many Faces of Poverty (Volume 8)
The Many Faces of Poverty in theCity of Parañaque
POPULATION
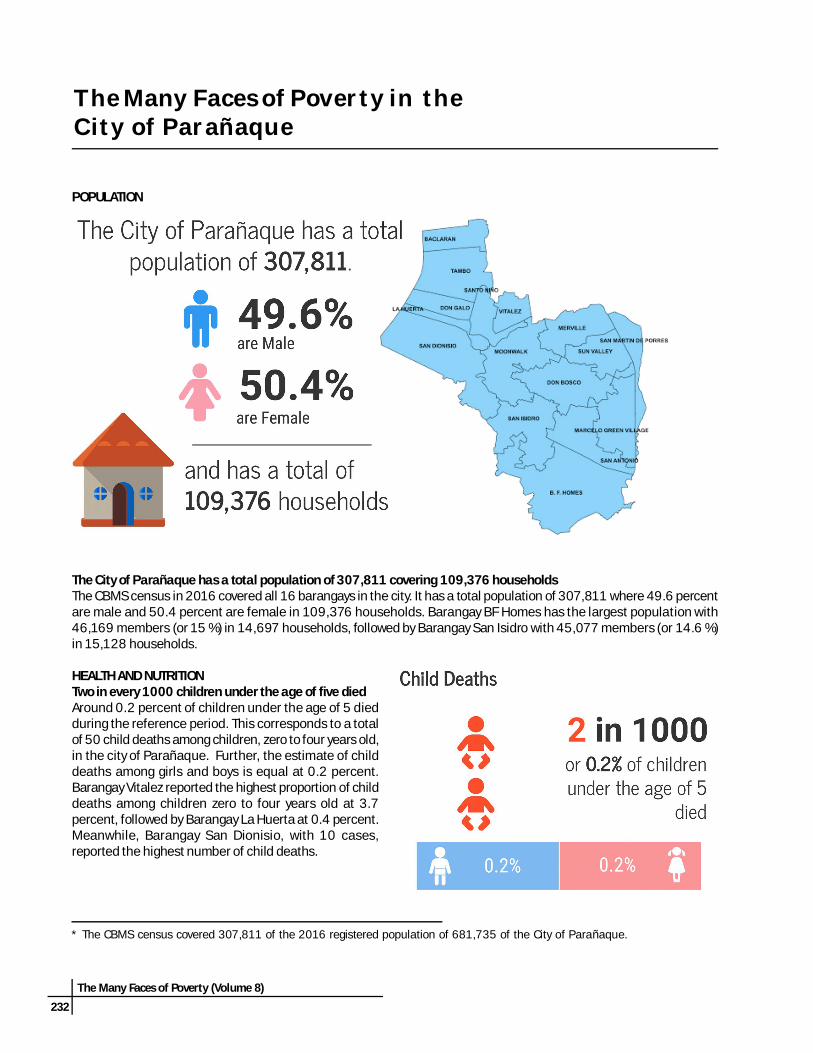
The City of Parañaque has a total population of 307,811 covering 109,376 householdsThe CBMS census in 2016 covered all 16 barangays in the city. It has a total population of 307,811 where 49.6 percentare male and 50.4 percent are female in 109,376 households. Barangay BF Homes has the largest population with46,169 members (or 15 %) in 14,697 households, followed by Barangay San Isidro with 45,077 members (or 14.6 %)in 15,128 households.
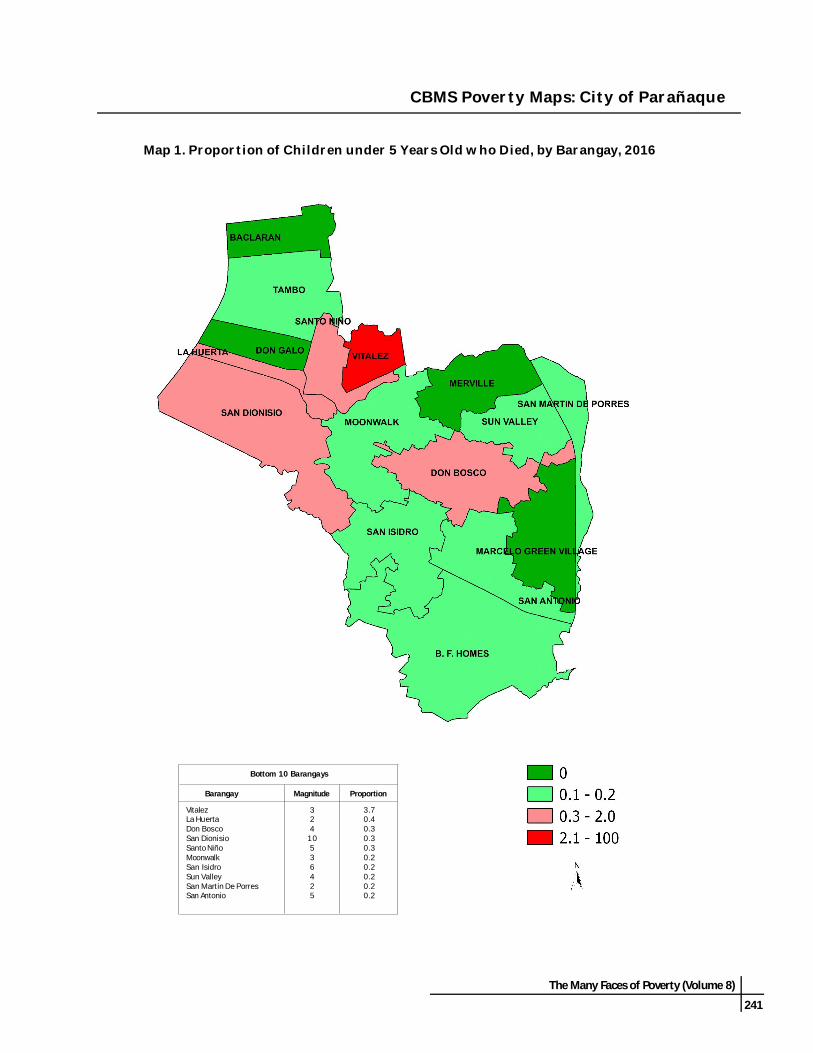
HEALTH AND NUTRITIONTwo in every 1000 children under the age of five diedAround 0.2 percent of children under the age of 5 diedduring the reference period. This corresponds to a totalof 50 child deaths among children, zero to four years old,in the city of Parañaque. Further, the estimate of childdeaths among girls and boys is equal at 0.2 percent.Barangay Vitalez reported the highest proportion of childdeaths among children zero to four years old at 3.7percent, followed by Barangay La Huerta at 0.4 percent.Meanwhile, Barangay San Dionisio, with 10 cases,reported the highest number of child deaths.
* The CBMS census covered 307,811 of the 2016 registered population of 681,735 of the City of Parañaque.
The Many Faces of Poverty (Volume 8)
233
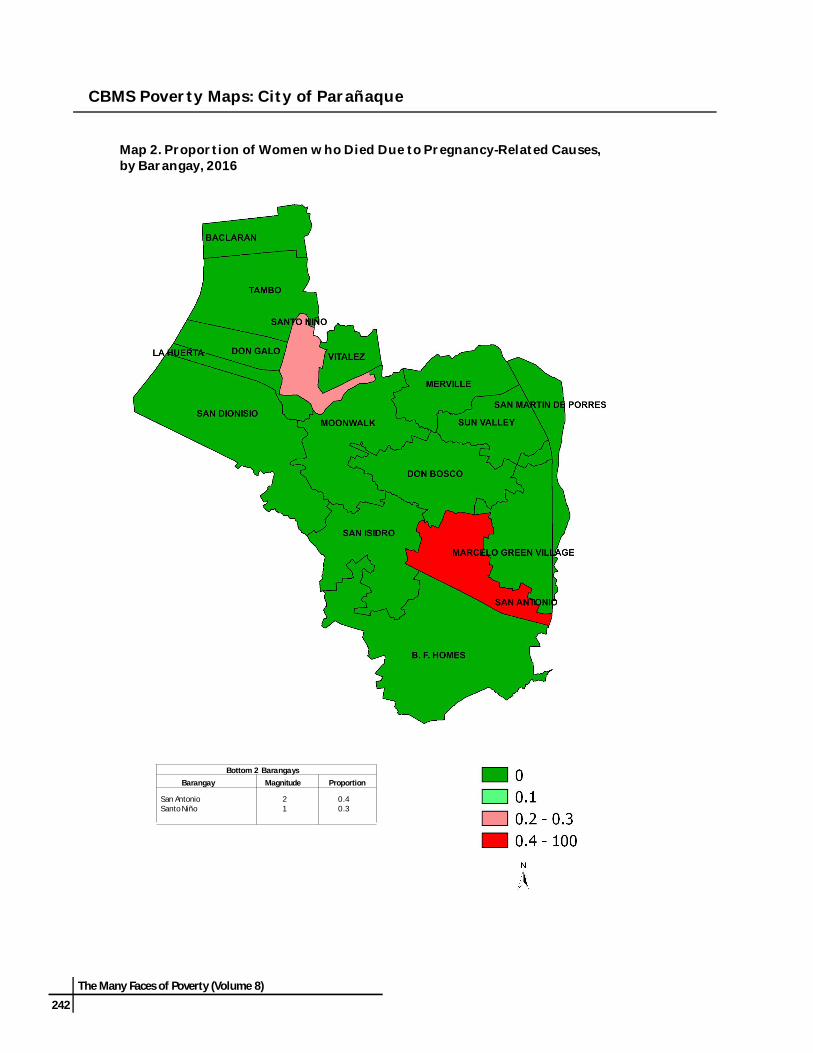
Three pregnant women died due to pregnancy-related causesThe results of the CBMS census in Parañaque revealed that 3 pregnant women aged 15-49 died due to pregnancy-related causes during the reference period. These maternal deaths were reported in Barangay San Antonio with 2 casesand Santo Niño with 1 case.
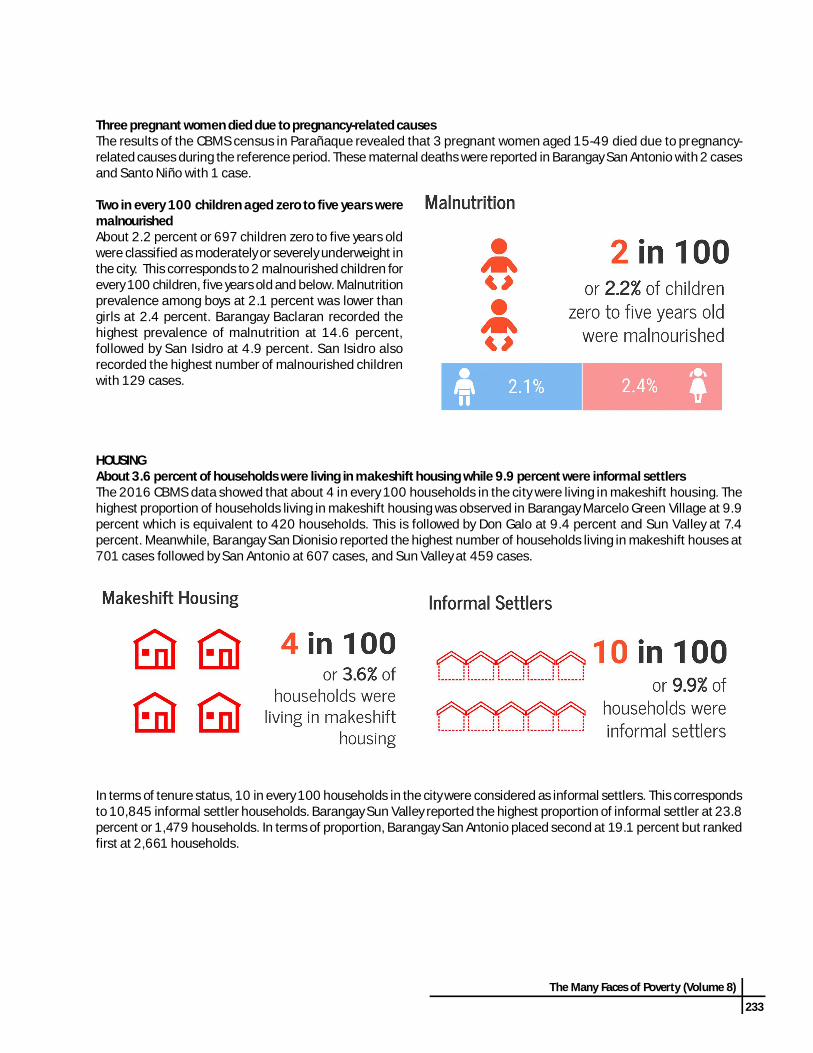
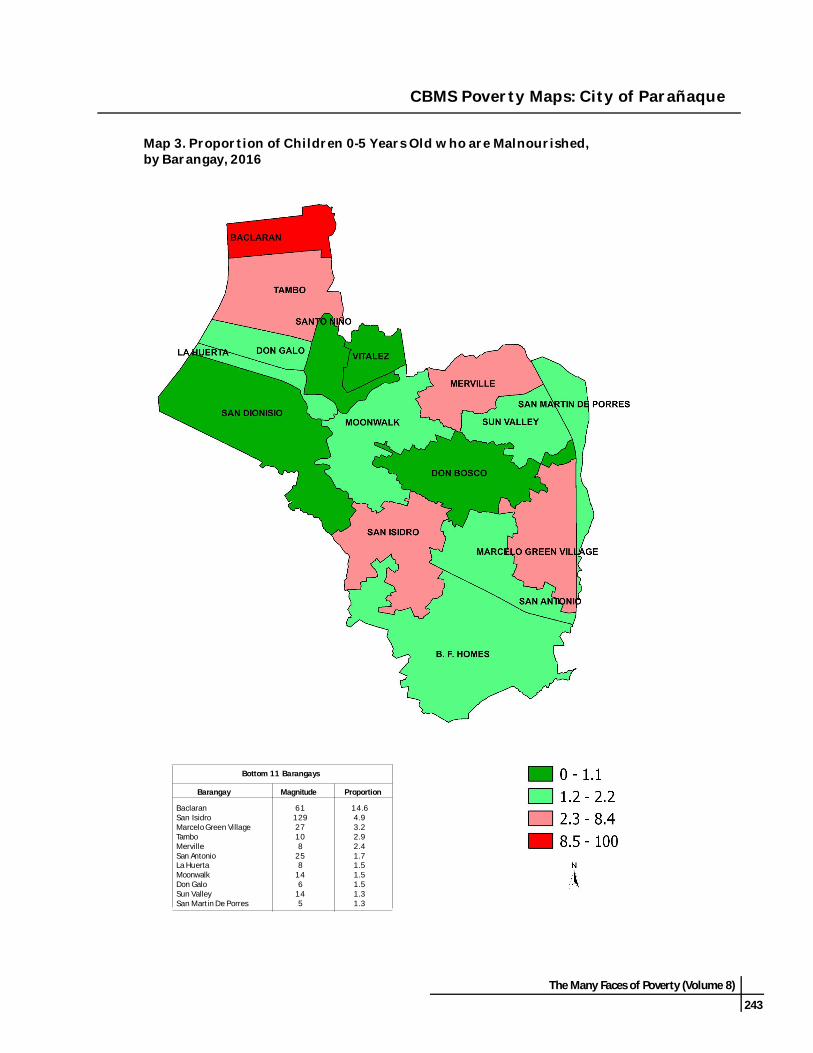
Two in every 100 children aged zero to five years weremalnourishedAbout 2.2 percent or 697 children zero to five years oldwere classified as moderately or severely underweight inthe city. This corresponds to 2 malnourished children forevery 100 children, five years old and below. Malnutritionprevalence among boys at 2.1 percent was lower thangirls at 2.4 percent. Barangay Baclaran recorded thehighest prevalence of malnutrition at 14.6 percent,followed by San Isidro at 4.9 percent. San Isidro alsorecorded the highest number of malnourished childrenwith 129 cases.
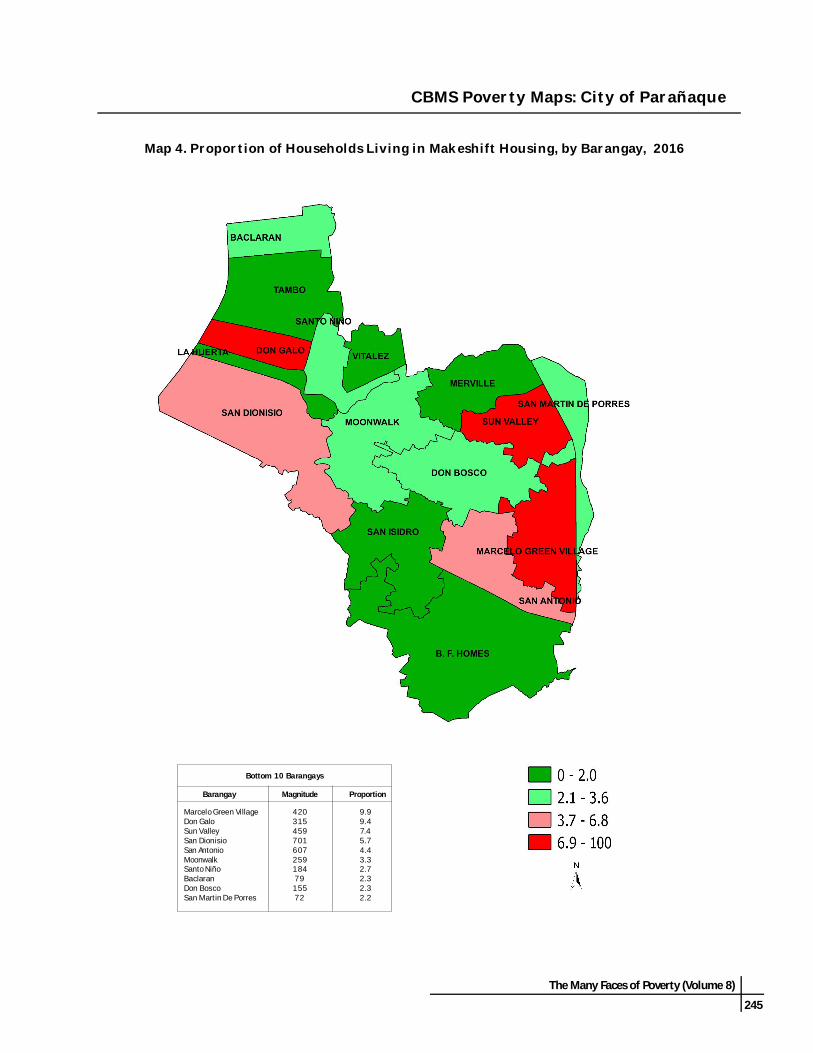
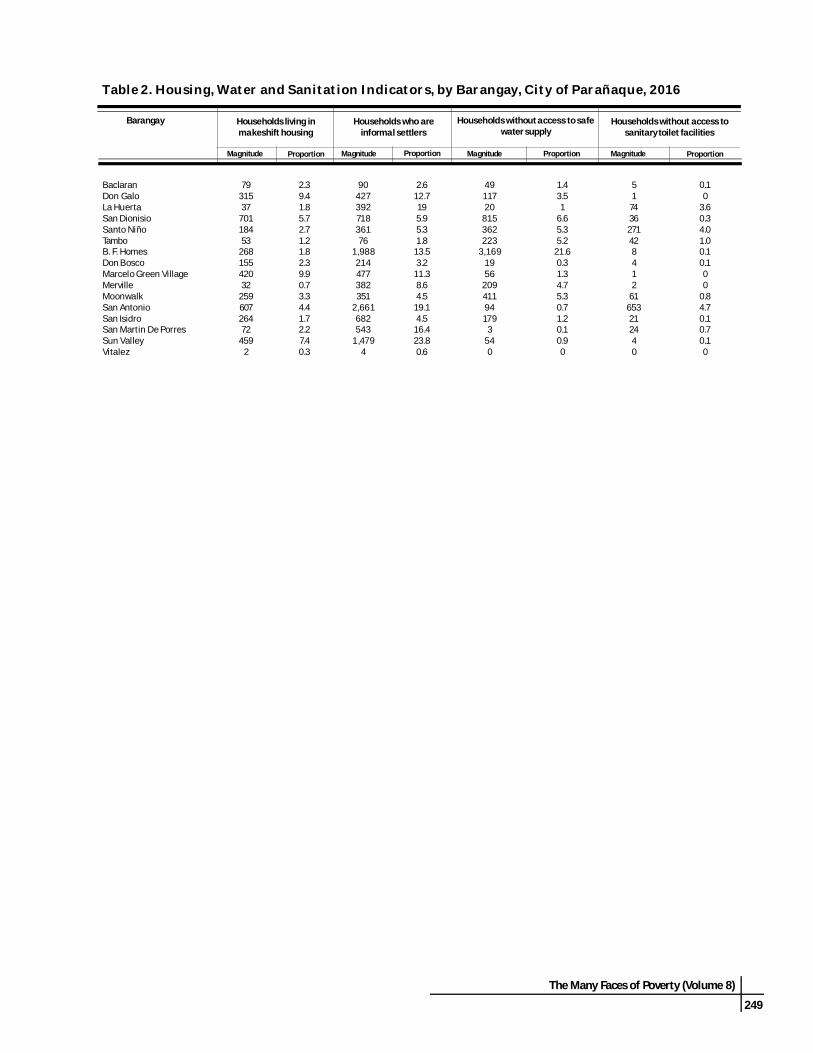
HOUSINGAbout 3.6 percent of households were living in makeshift housing while 9.9 percent were informal settlersThe 2016 CBMS data showed that about 4 in every 100 households in the city were living in makeshift housing. Thehighest proportion of households living in makeshift housing was observed in Barangay Marcelo Green Village at 9.9percent which is equivalent to 420 households. This is followed by Don Galo at 9.4 percent and Sun Valley at 7.4percent. Meanwhile, Barangay San Dionisio reported the highest number of households living in makeshift houses at701 cases followed by San Antonio at 607 cases, and Sun Valley at 459 cases.
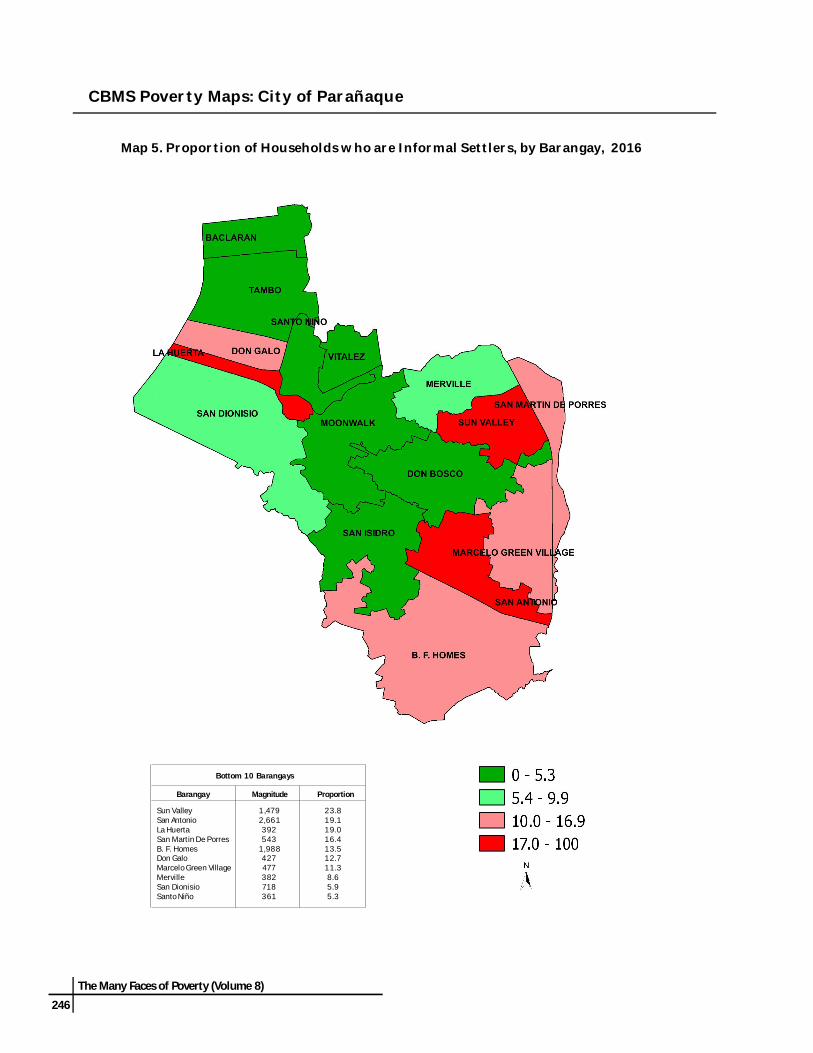
In terms of tenure status, 10 in every 100 households in the city were considered as informal settlers. This correspondsto 10,845 informal settler households. Barangay Sun Valley reported the highest proportion of informal settler at 23.8percent or 1,479 households. In terms of proportion, Barangay San Antonio placed second at 19.1 percent but rankedfirst at 2,661 households.
234
The Many Faces of Poverty (Volume 8)
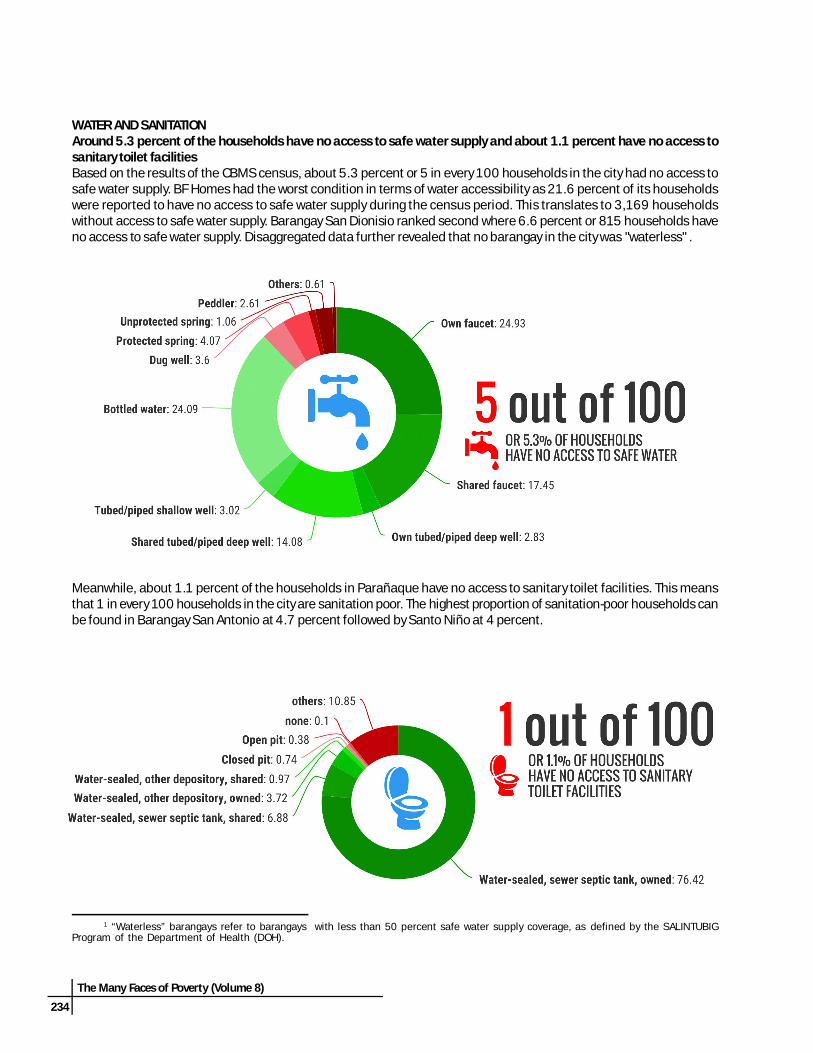
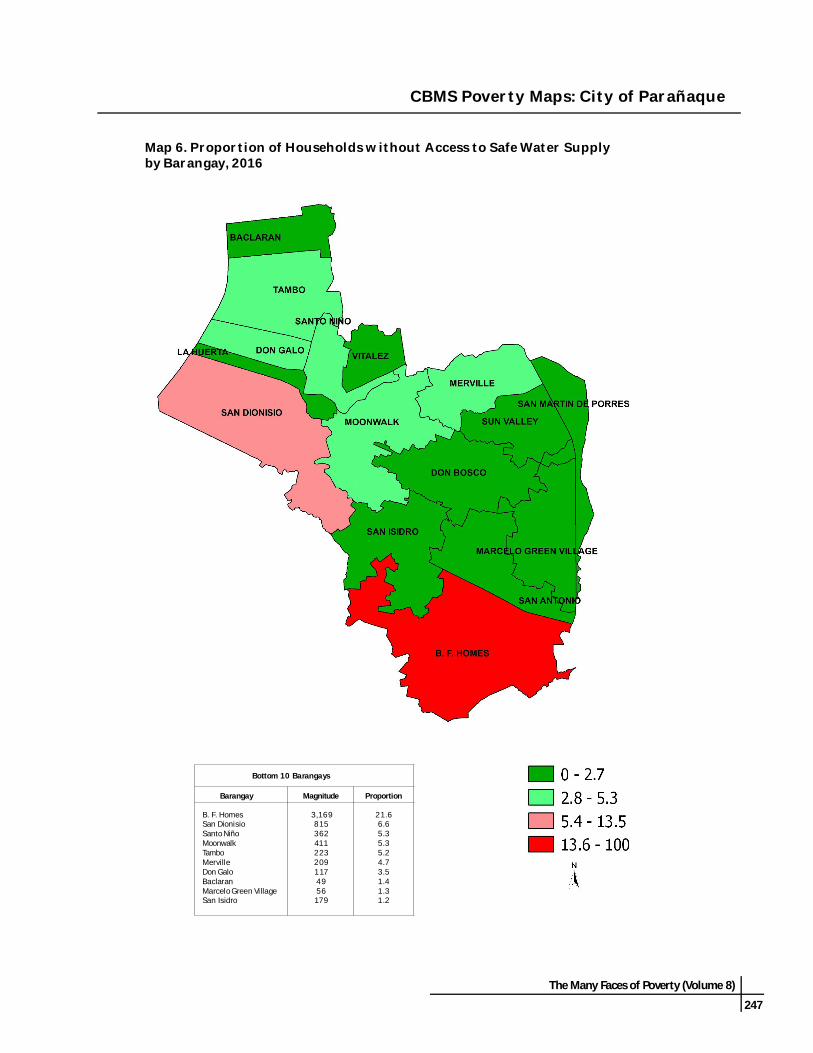
WATER AND SANITATIONAround 5.3 percent of the households have no access to safe water supply and about 1.1 percent have no access tosanitary toilet facilitiesBased on the results of the CBMS census, about 5.3 percent or 5 in every 100 households in the city had no access tosafe water supply. BF Homes had the worst condition in terms of water accessibility as 21.6 percent of its householdswere reported to have no access to safe water supply during the census period. This translates to 3,169 householdswithout access to safe water supply. Barangay San Dionisio ranked second where 6.6 percent or 815 households haveno access to safe water supply. Disaggregated data further revealed that no barangay in the city was "waterless" .
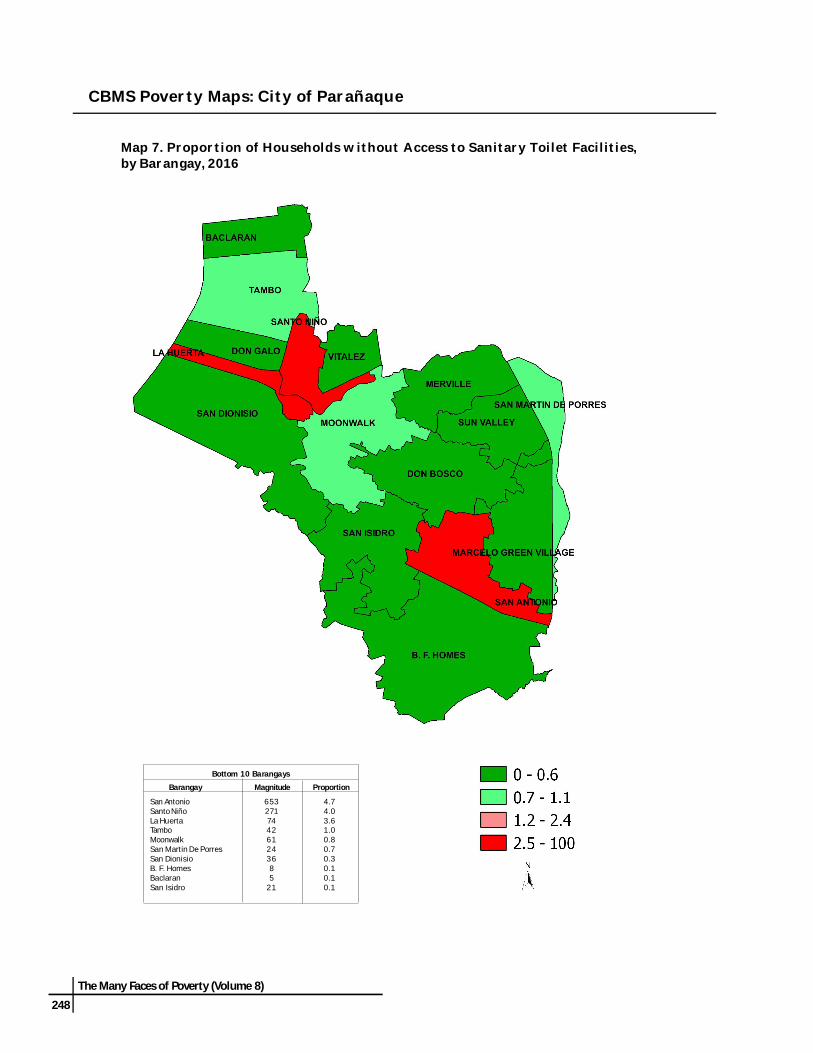
Meanwhile, about 1.1 percent of the households in Parañaque have no access to sanitary toilet facilities. This meansthat 1 in every 100 households in the city are sanitation poor. The highest proportion of sanitation-poor households canbe found in Barangay San Antonio at 4.7 percent followed by Santo Niño at 4 percent.
1 “Waterless” barangays refer to barangays with less than 50 percent safe water supply coverage, as defined by the SALINTUBIGProgram of the Department of Health (DOH).
The Many Faces of Poverty (Volume 8)
235
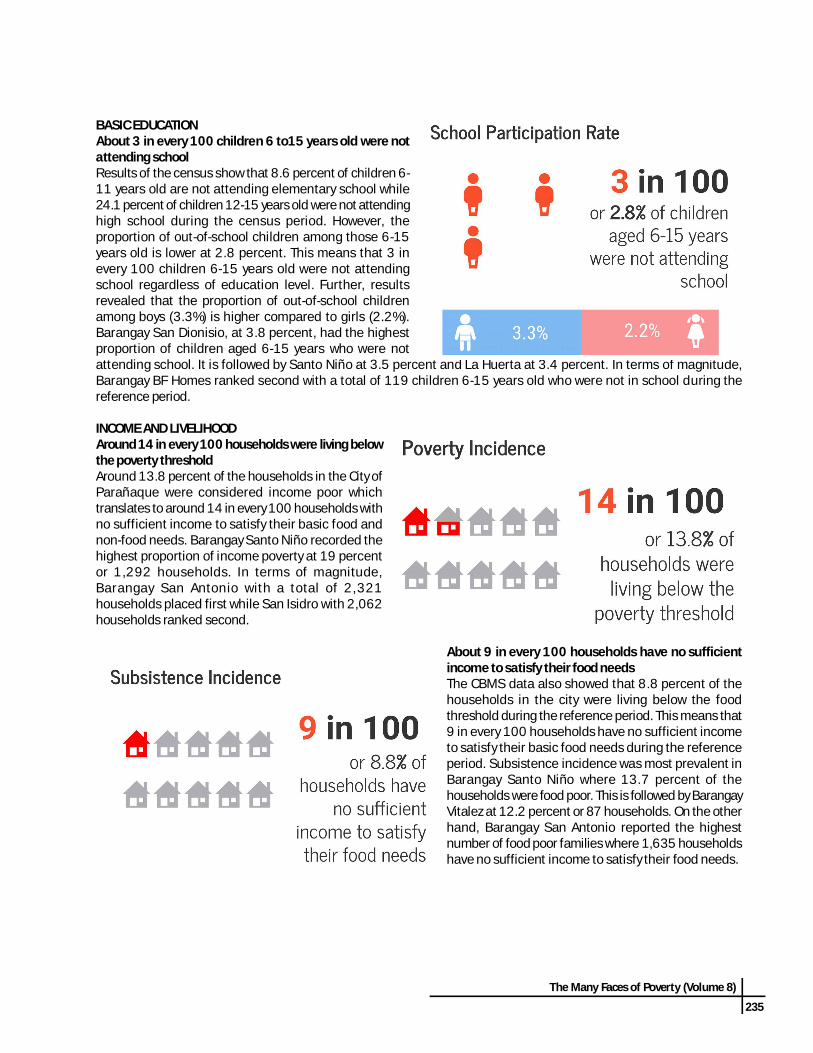
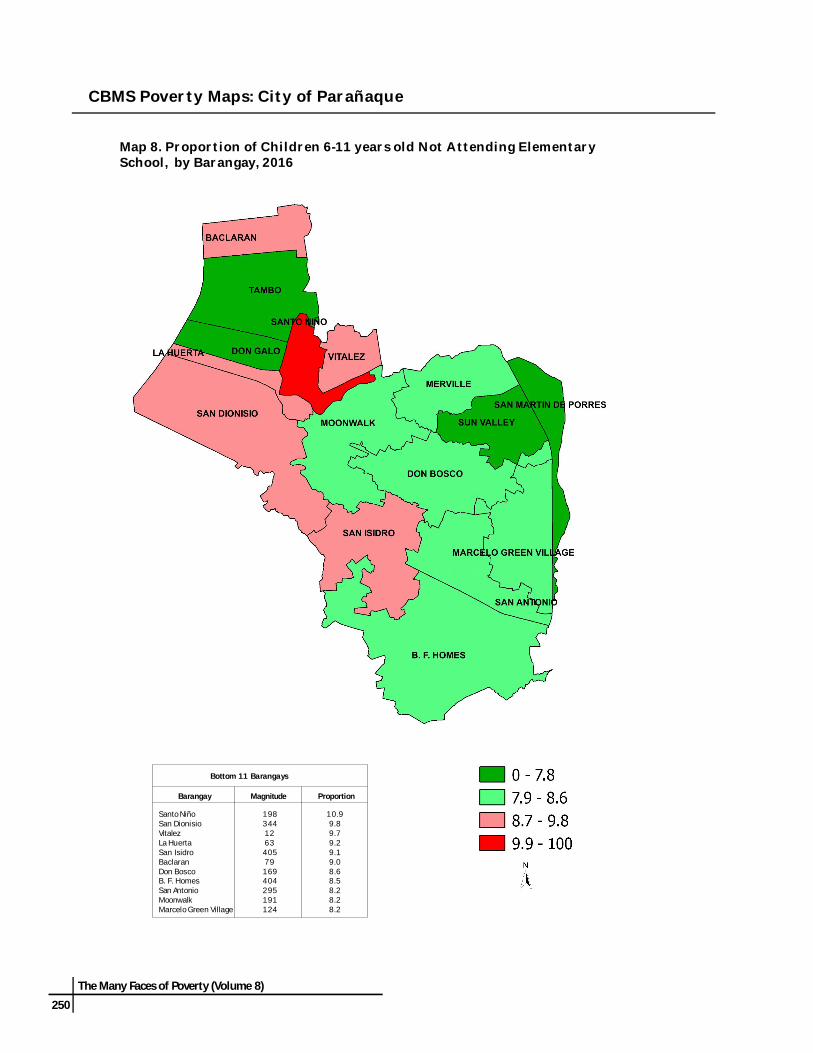
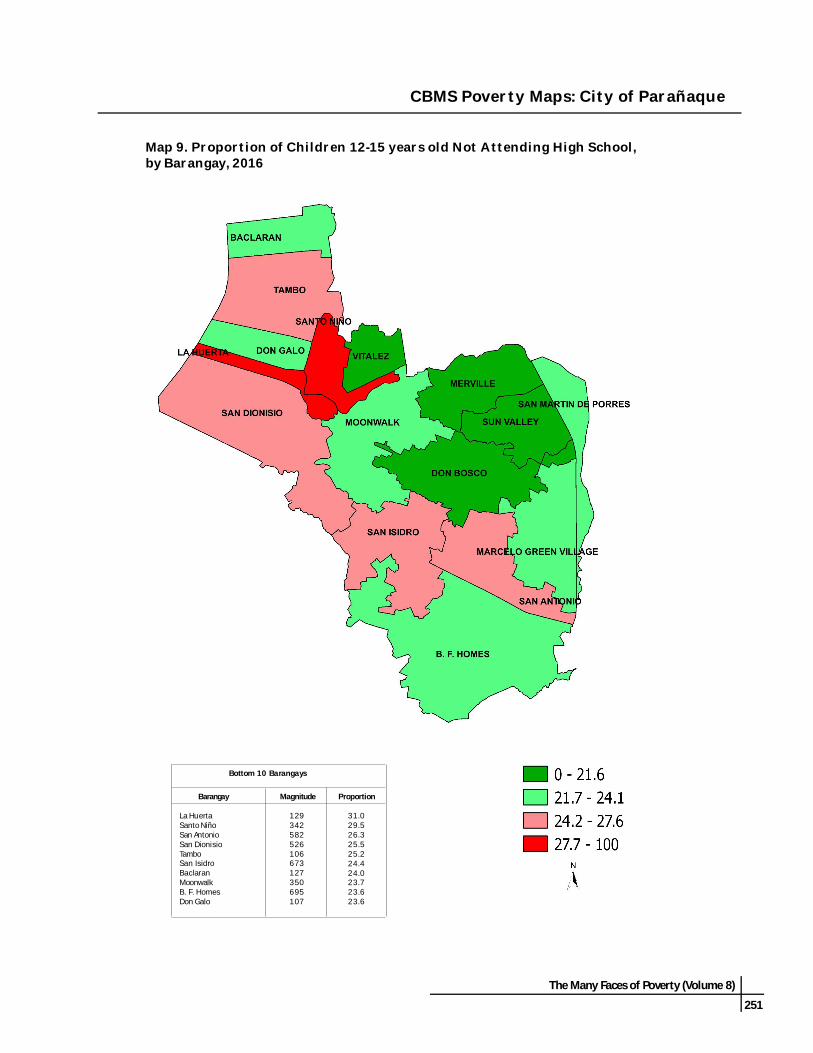
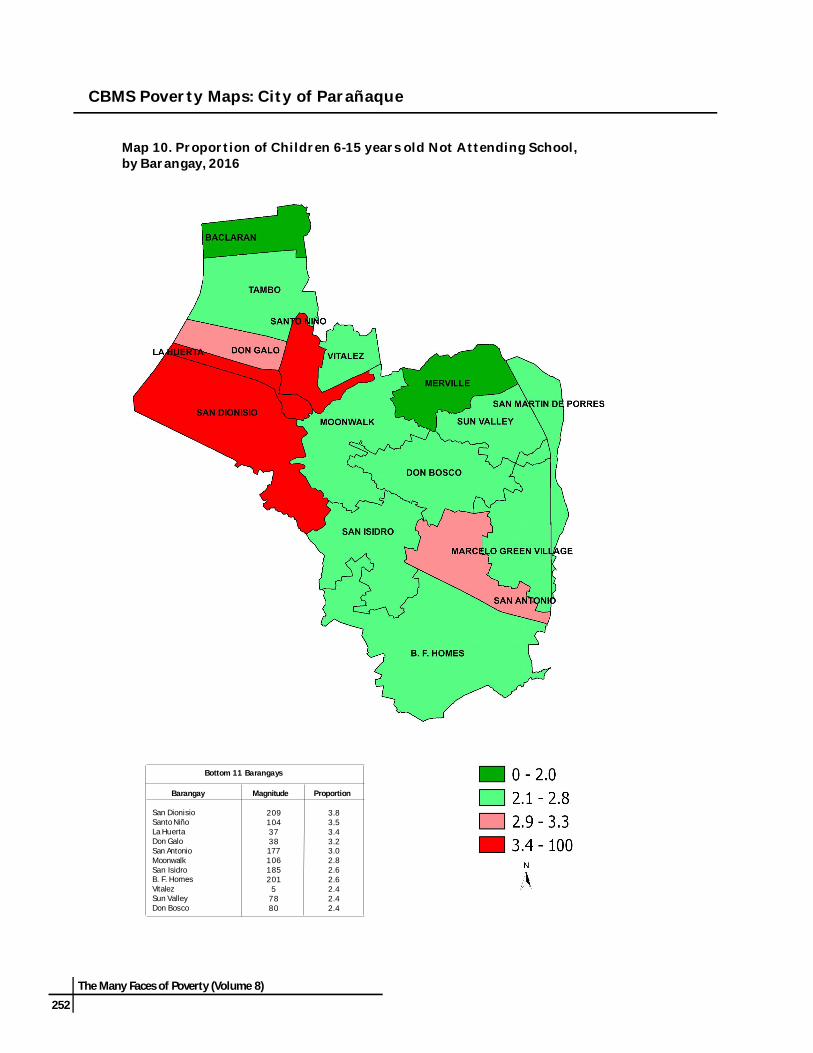
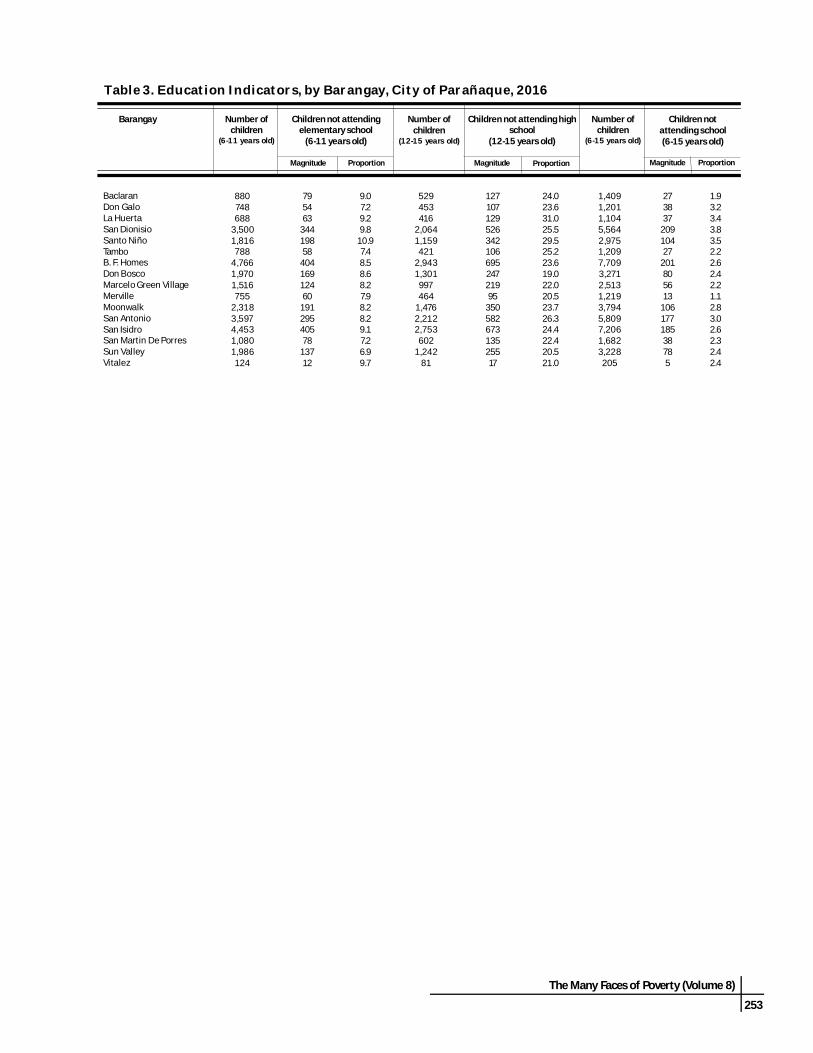
BASIC EDUCATIONAbout 3 in every 100 children 6 to15 years old were notattending schoolResults of the census show that 8.6 percent of children 6-11 years old are not attending elementary school while24.1 percent of children 12-15 years old were not attendinghigh school during the census period. However, theproportion of out-of-school children among those 6-15years old is lower at 2.8 percent. This means that 3 inevery 100 children 6-15 years old were not attendingschool regardless of education level. Further, resultsrevealed that the proportion of out-of-school childrenamong boys (3.3%) is higher compared to girls (2.2%).Barangay San Dionisio, at 3.8 percent, had the highestproportion of children aged 6-15 years who were notattending school. It is followed by Santo Niño at 3.5 percent and La Huerta at 3.4 percent. In terms of magnitude,Barangay BF Homes ranked second with a total of 119 children 6-15 years old who were not in school during thereference period.
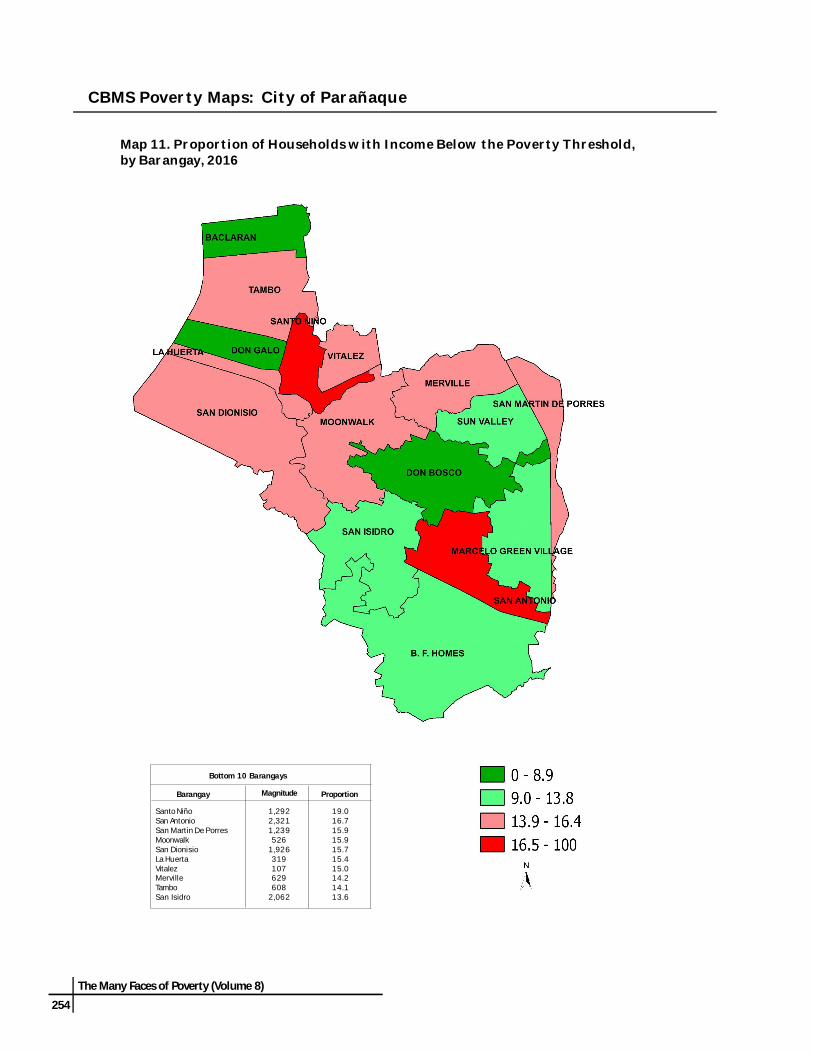
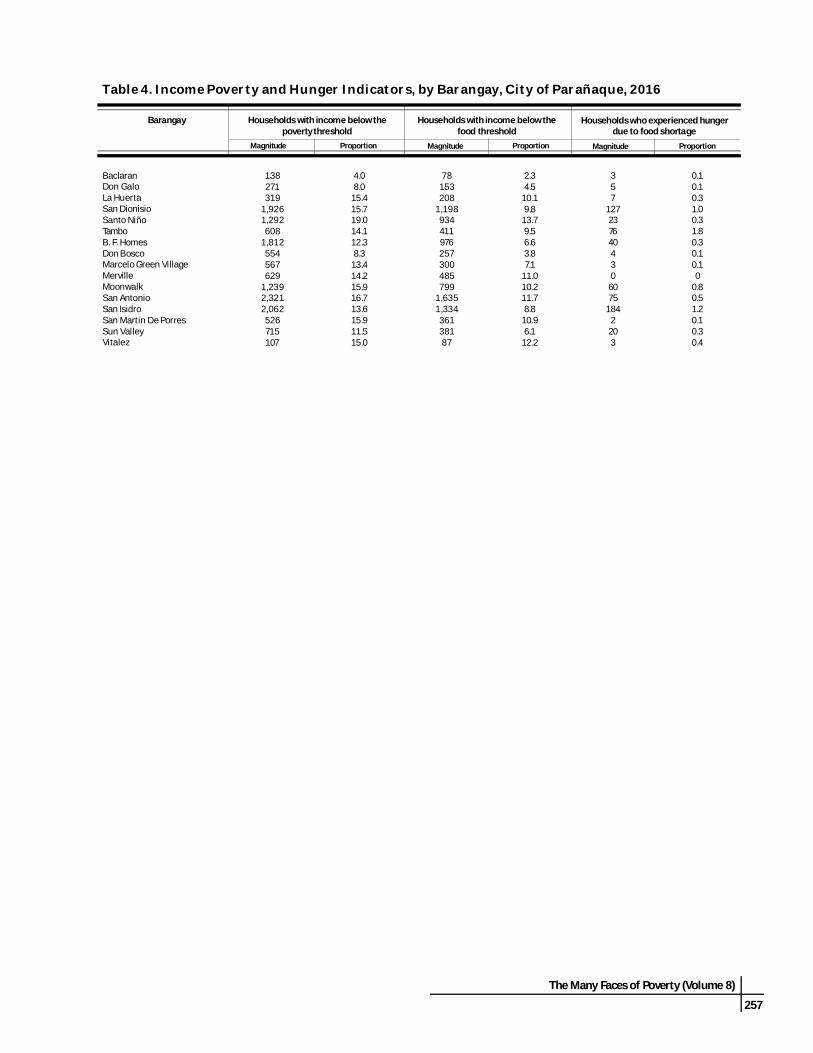
INCOME AND LIVELIHOODAround 14 in every 100 households were living belowthe poverty thresholdAround 13.8 percent of the households in the City ofParañaque were considered income poor whichtranslates to around 14 in every 100 households withno sufficient income to satisfy their basic food andnon-food needs. Barangay Santo Niño recorded thehighest proportion of income poverty at 19 percentor 1,292 households. In terms of magnitude,Barangay San Antonio with a total of 2,321households placed first while San Isidro with 2,062households ranked second.
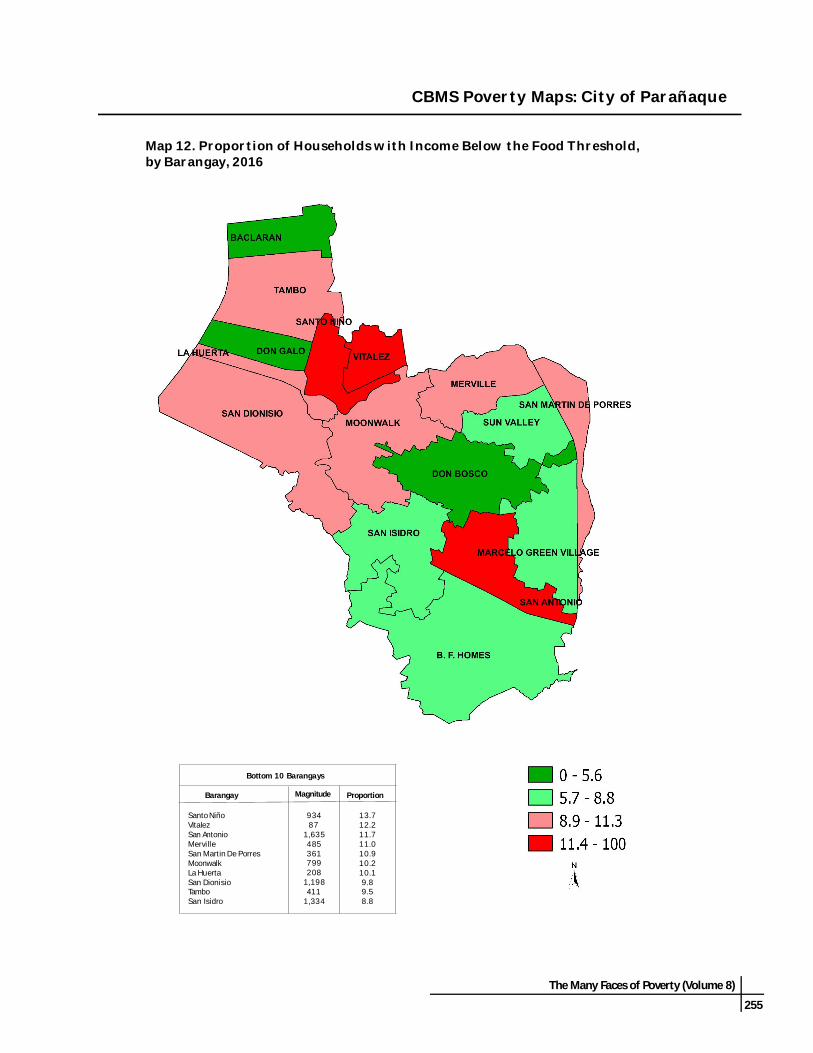
About 9 in every 100 households have no sufficientincome to satisfy their food needsThe CBMS data also showed that 8.8 percent of thehouseholds in the city were living below the foodthreshold during the reference period. This means that9 in every 100 households have no sufficient incometo satisfy their basic food needs during the referenceperiod. Subsistence incidence was most prevalent inBarangay Santo Niño where 13.7 percent of thehouseholds were food poor. This is followed by BarangayVitalez at 12.2 percent or 87 households. On the otherhand, Barangay San Antonio reported the highestnumber of food poor families where 1,635 householdshave no sufficient income to satisfy their food needs.
236
The Many Faces of Poverty (Volume 8)
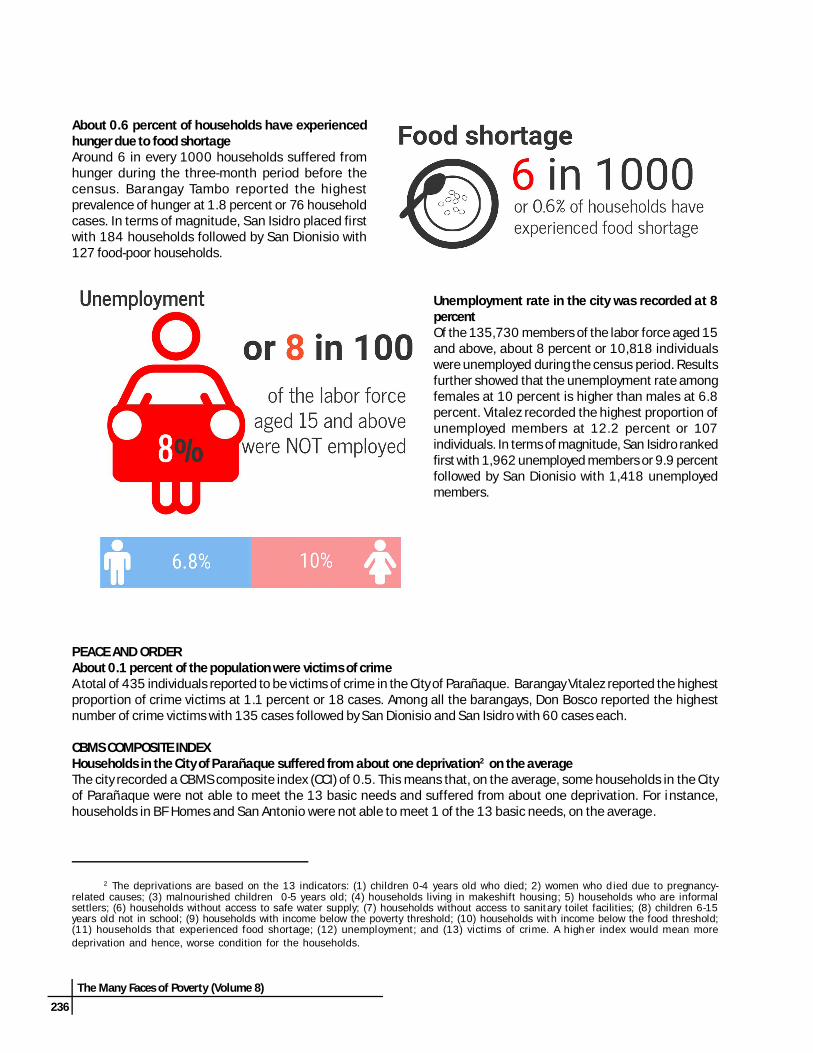
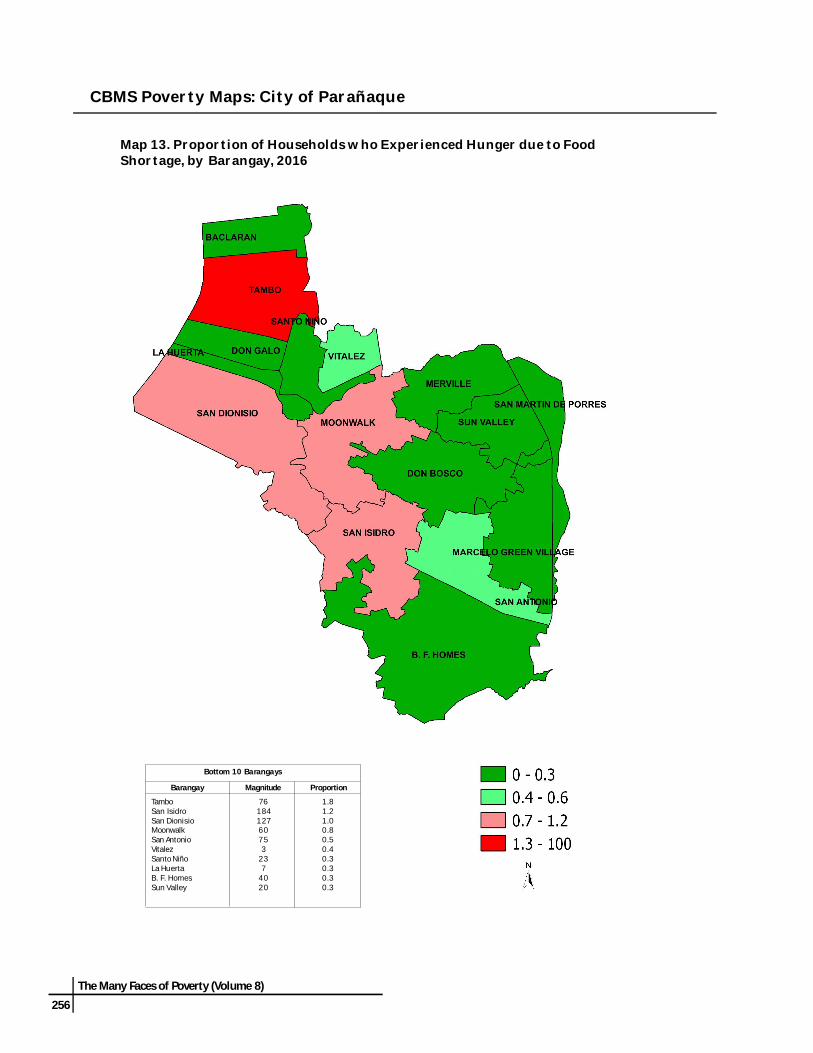
About 0.6 percent of households have experiencedhunger due to food shortageAround 6 in every 1000 households suffered fromhunger during the three-month period before thecensus. Barangay Tambo reported the highestprevalence of hunger at 1.8 percent or 76 householdcases. In terms of magnitude, San Isidro placed firstwith 184 households followed by San Dionisio with127 food-poor households.
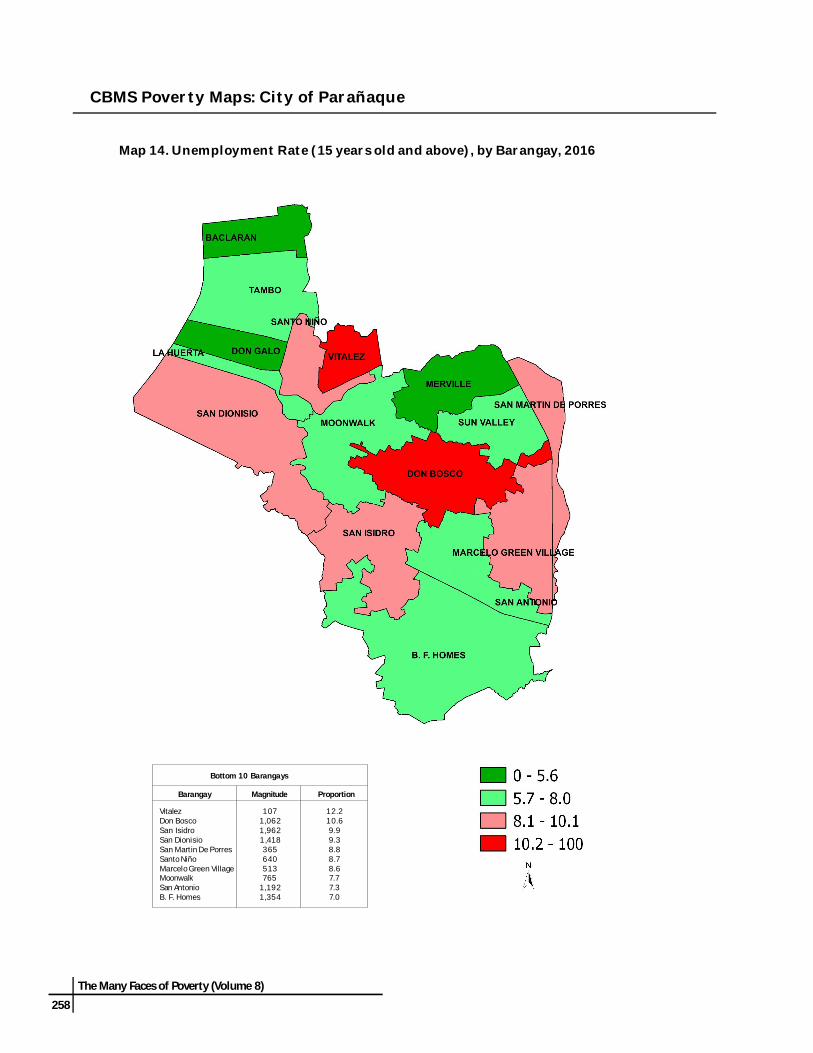
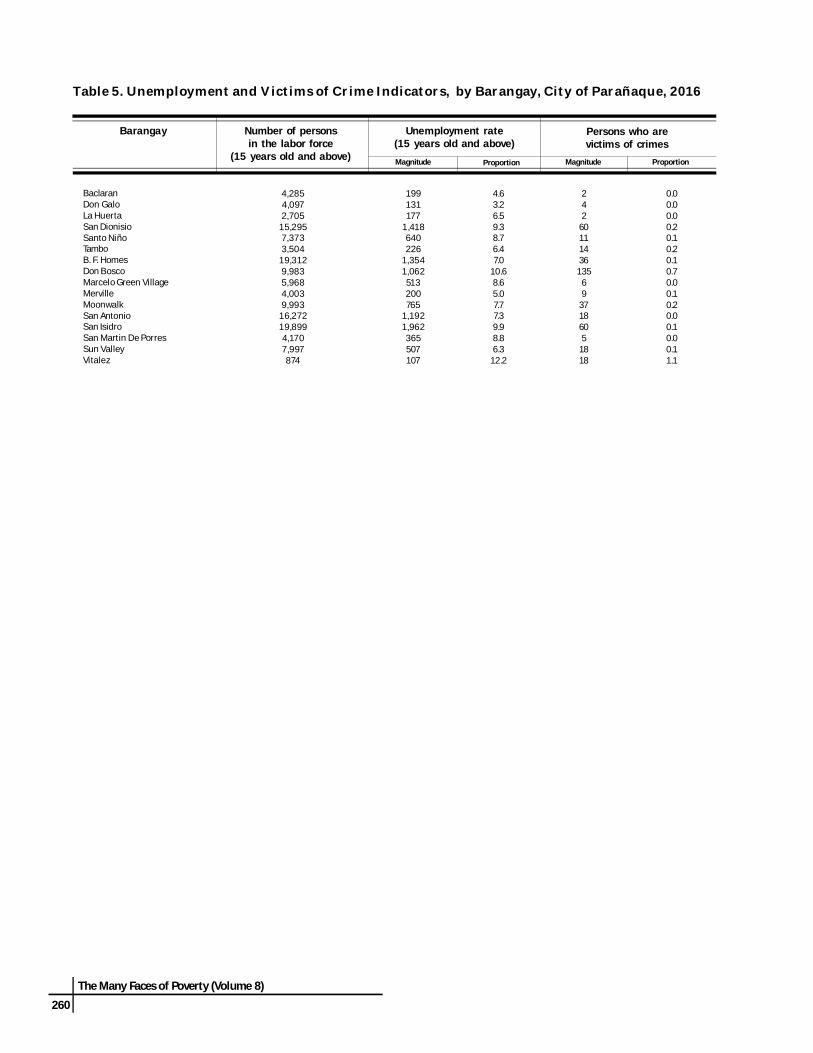
Unemployment rate in the city was recorded at 8percentOf the 135,730 members of the labor force aged 15and above, about 8 percent or 10,818 individualswere unemployed during the census period. Resultsfurther showed that the unemployment rate amongfemales at 10 percent is higher than males at 6.8percent. Vitalez recorded the highest proportion ofunemployed members at 12.2 percent or 107individuals. In terms of magnitude, San Isidro rankedfirst with 1,962 unemployed members or 9.9 percentfollowed by San Dionisio with 1,418 unemployedmembers.
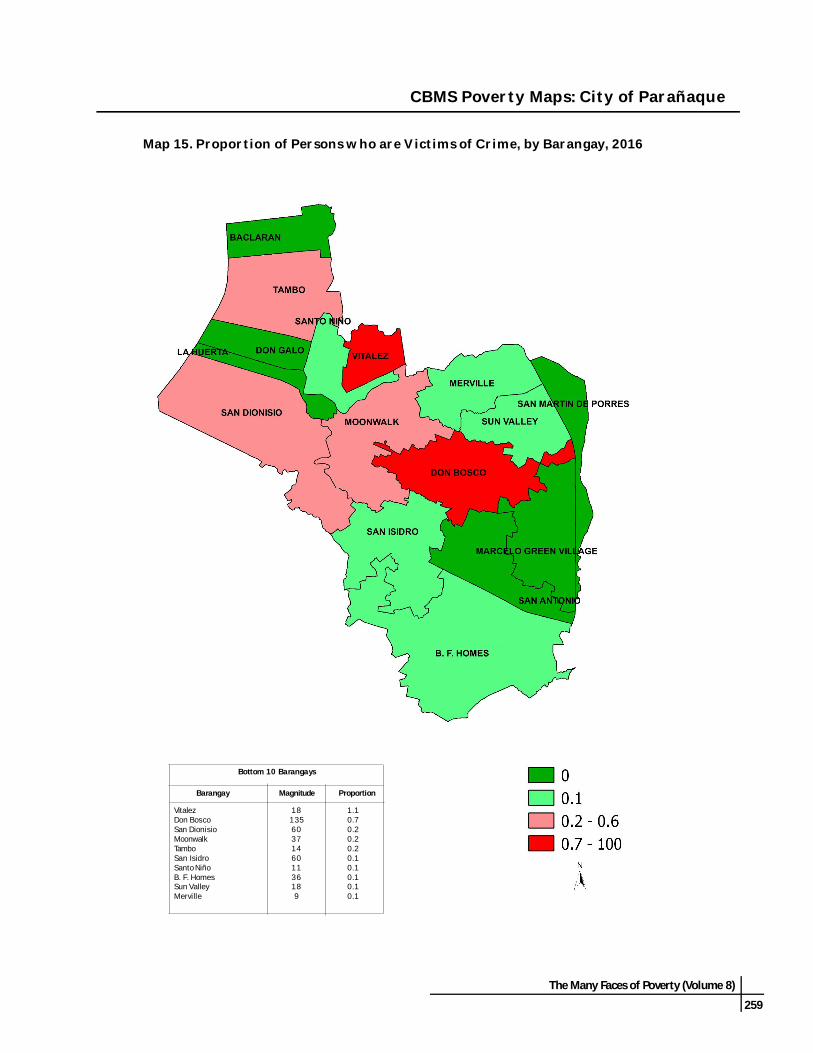
PEACE AND ORDERAbout 0.1 percent of the population were victims of crimeA total of 435 individuals reported to be victims of crime in the City of Parañaque. Barangay Vitalez reported the highestproportion of crime victims at 1.1 percent or 18 cases. Among all the barangays, Don Bosco reported the highestnumber of crime victims with 135 cases followed by San Dionisio and San Isidro with 60 cases each.
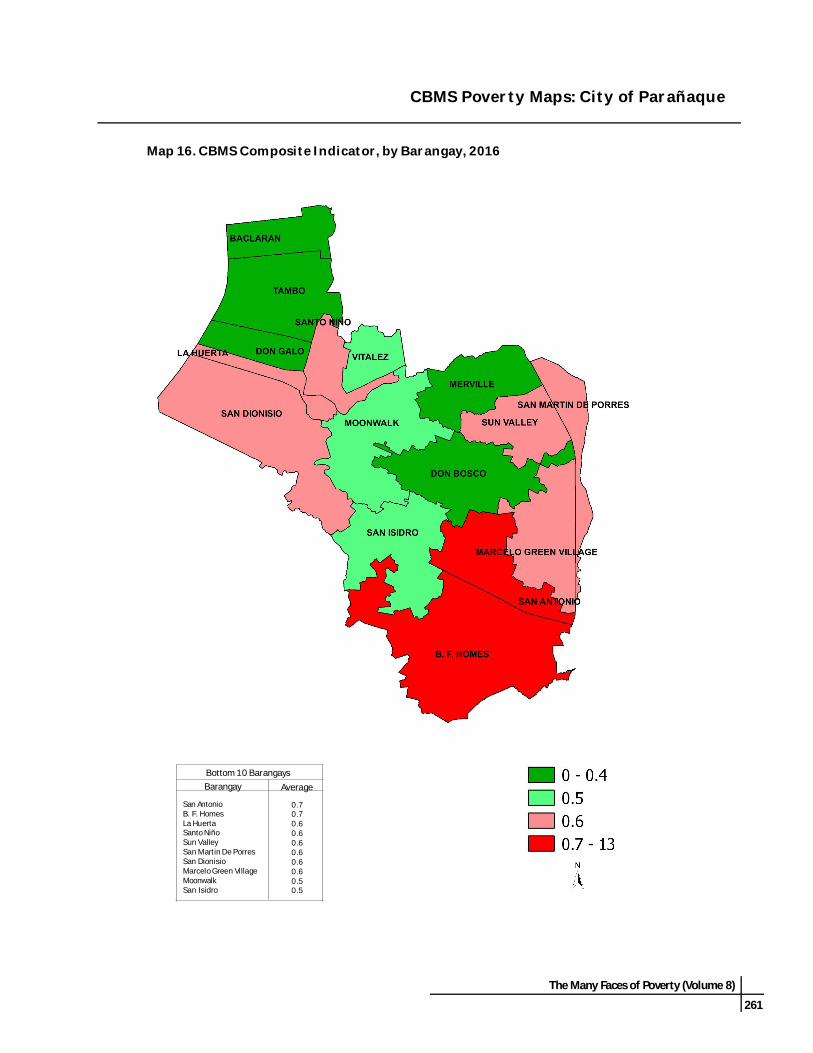
CBMS COMPOSITE INDEXHouseholds in the City of Parañaque suffered from about one deprivation2 on the averageThe city recorded a CBMS composite index (CCI) of 0.5. This means that, on the average, some households in the Cityof Parañaque were not able to meet the 13 basic needs and suffered from about one deprivation. For instance,households in BF Homes and San Antonio were not able to meet 1 of the 13 basic needs, on the average.
2 The deprivations are based on the 13 indicators: (1) children 0-4 years old who died; 2) women who d ied due to pregnancy-related causes; (3) malnourished children 0-5 years old; (4) households living in makeshift housing ; 5) households who are informalsettlers; (6) households without access to safe water supply; (7) households without access to sanitary toilet facilities; (8) children 6-15years old not in school; (9) households with income below the poverty threshold; (10) households with income below the food threshold;(11) households that experienced food shortage; (12) unemployment; and (13) victims of crime. A high er index would mean moredeprivation and hence, worse condition for the households.
The Many Faces of Poverty (Volume 8)
237
3 From the 13 CBMS core indicators, one indicator is selected to determine whether a household is poor in a particular dimension:1) children aged 0-4 years old who died for health, 2) malnourished children 0-5 years old for nutrition, 3) households living in makeshifthouses for housing, 4) households who are informal settlers for tenure, 5) households without access to safe water supply for water, 6)households without access to sanitary toilet facilities for sanitation, 7) children aged 6-15 years not In school for education, 8)households with income below the food threshold for income, 9) unemployment for job, and 10) victims of crime for security.
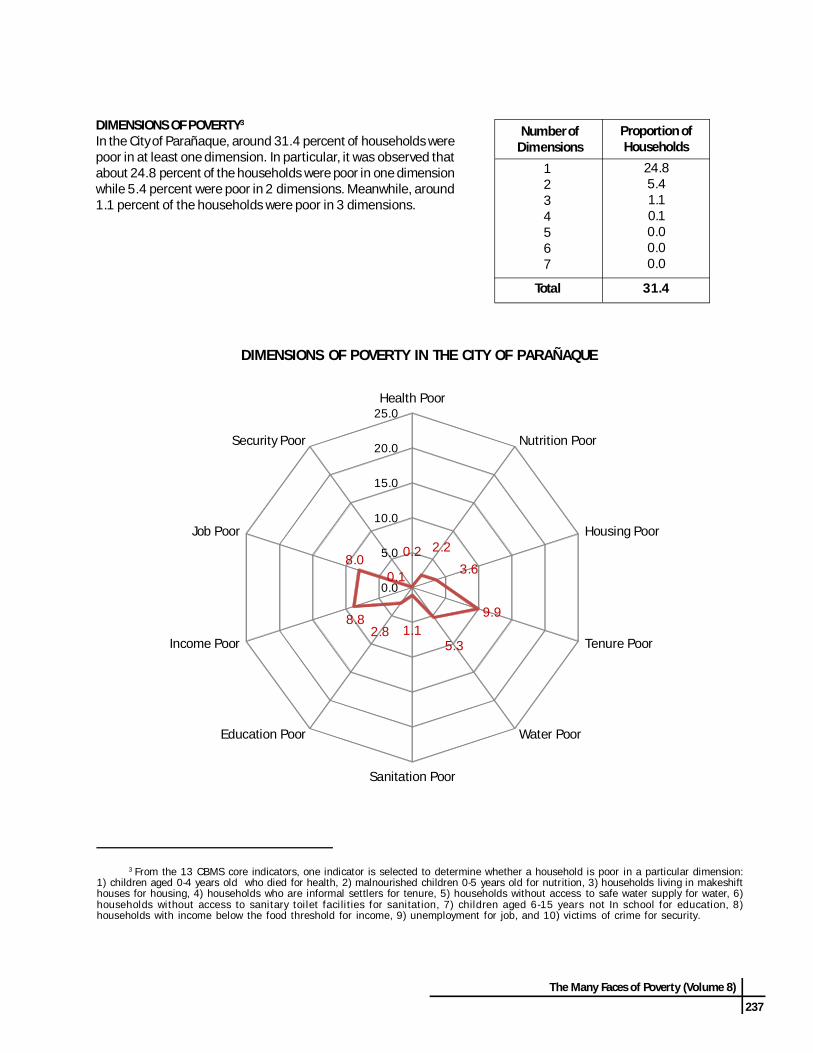
DIMENSIONS OF POVERTY3
In the City of Parañaque, around 31.4 percent of households werepoor in at least one dimension. In particular, it was observed thatabout 24.8 percent of the households were poor in one dimensionwhile 5.4 percent were poor in 2 dimensions. Meanwhile, around1.1 percent of the households were poor in 3 dimensions.
Number ofDimensions
Proportion ofHouseholds
1234567
Total 31.4
24.85.41.10.10.00.00.0
DIMENSIONS OF POVERTY IN THE CITY OF PARAÑAQUE
0.2 2.2
3.6
9.9
5.31.12.8
8.8
8.00.1
0.0
5.0
10.0
15.0
20.0
25.0Health Poor
Nutrition Poor
Housing Poor
Tenure Poor
Water Poor
Sanitation Poor
Education Poor
Income Poor
Job Poor
Security Poor

238
The Many Faces of Poverty (Volume 8)
The Many Faces of Poverty (Volume 8)
239
The Many Faces of Povertyin the City of Parañaque
INDICATOR
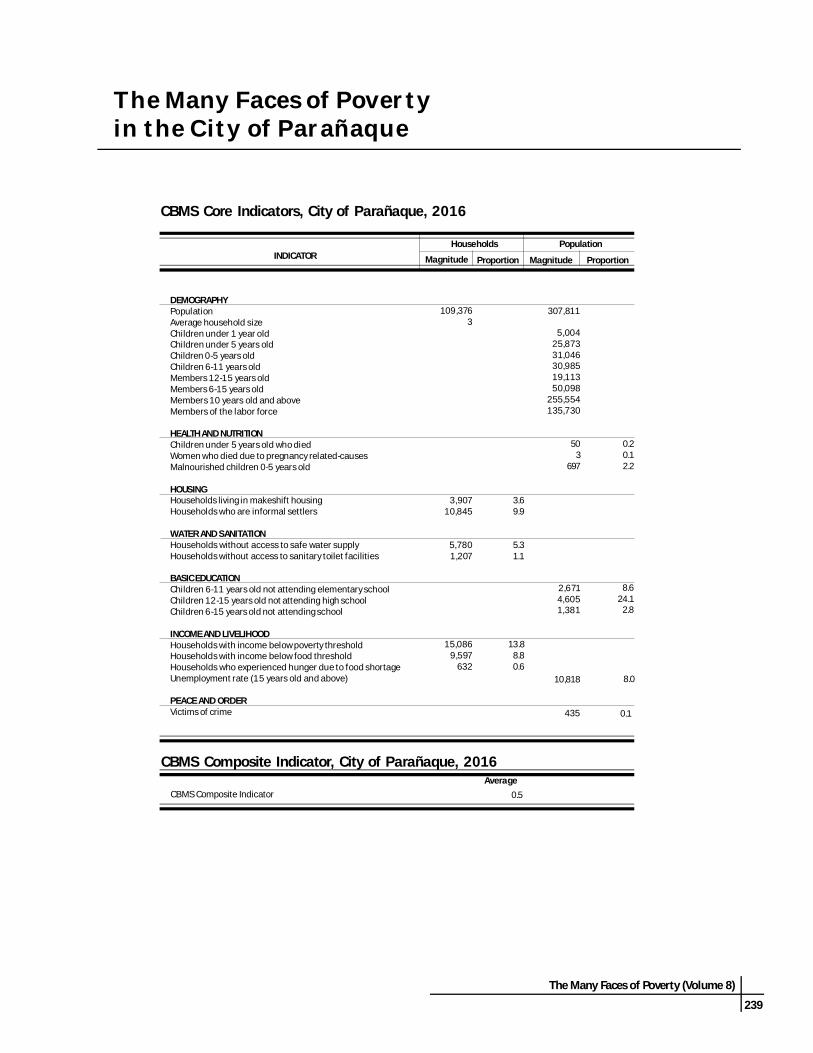
DEMOGRAPHYPopulationAverage household sizeChildren under 1 year oldChildren under 5 years oldChildren 0-5 years oldChildren 6-11 years oldMembers 12-15 years oldMembers 6-15 years oldMembers 10 years old and aboveMembers of the labor force
HEALTH AND NUTRITIONChildren under 5 years old who diedWomen who died due to pregnancy related-causesMalnourished children 0-5 years old
HOUSINGHouseholds living in makeshift housingHouseholds who are informal settlers
WATER AND SANITATIONHouseholds without access to safe water supplyHouseholds without access to sanitary toilet facilities
BASIC EDUCATIONChildren 6-11 years old not attending elementary schoolChildren 12-15 years old not attending high schoolChildren 6-15 years old not attending school
INCOME AND LIVELIHOODHouseholds with income below poverty thresholdHouseholds with income below food thresholdHouseholds who experienced hunger due to food shortageUnemployment rate (15 years old and above)
PEACE AND ORDERVictims of crime
Magnitude Proportion
Households Population
CBMS Core Indicators, City of Parañaque, 2016
ProportionMagnitude
5,004 25,873 31,046 30,985 19,113 50,098
255,554 135,730
307,811
503
697
0.20.12.2
435 0.1
10,818 8.0
CBMS Composite Indicator, City of Parañaque, 2016
CBMS Composite IndicatorAverage
0.5
15,086 9,597
632
13.88.80.6
2,671 4,605 1,381
8.624.1
2.8
109,376 3
3,907 10,845
5,780 1,207
3.69.9
5.31.1
240
The Many Faces of Poverty (Volume 8)
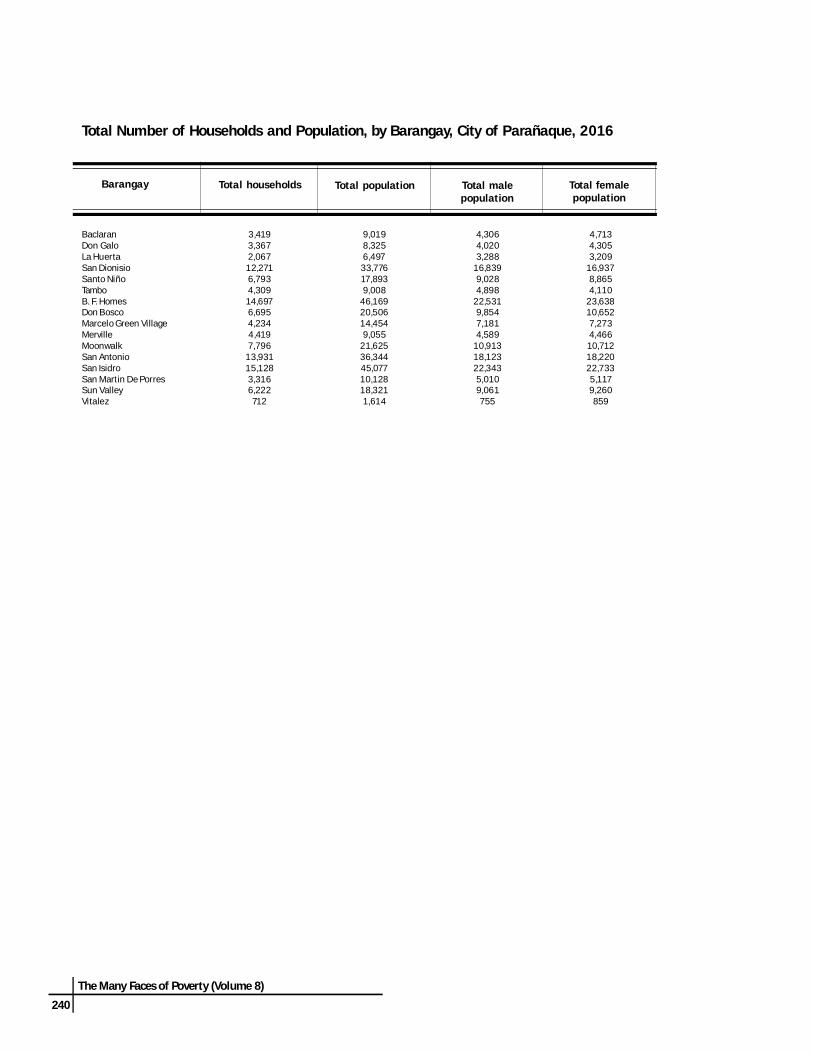
Total Number of Households and Population, by Barangay, City of Parañaque, 2016
Barangay Total households Total population
9,019 8,325 6,497 33,776 17,893 9,008
46,169 20,506 14,454 9,055
21,625 36,344 45,077 10,128 18,321 1,614
BaclaranDon GaloLa HuertaSan DionisioSanto NiñoTamboB. F. HomesDon BoscoMarcelo Green VillageMervilleMoonwalkSan AntonioSan IsidroSan Martin De PorresSun ValleyVitalez
3,419 3,367 2,067 12,271 6,793 4,309 14,697 6,695 4,234 4,419 7,796 13,931 15,128 3,316 6,222 712
Total malepopulation
Total femalepopulation
4,306 4,020 3,288
16,839 9,028 4,898
22,531 9,854 7,181 4,589
10,913 18,123 22,343 5,010 9,061 755
4,713 4,305 3,209
16,937 8,865 4,110
23,638 10,652 7,273 4,466 10,712 18,220 22,733 5,117 9,260 859
The Many Faces of Poverty (Volume 8)
241
CBMS Poverty Maps: City of Parañaque
Map 1. Proportion of Children under 5 Years Old who Died, by Barangay, 2016
Bottom 10 Barangays
VitalezLa HuertaDon BoscoSan DionisioSanto NiñoMoonwalkSan IsidroSun ValleySan Martin De PorresSan Antonio
3.70.40.30.30.30.20.20.20.20.2
3 2 4
10 5 3 6 4 2 5
Barangay Magnitude Proportion
242
The Many Faces of Poverty (Volume 8)
Map 2. Proportion of Women who Died Due to Pregnancy-Related Causes,by Barangay, 2016
CBMS Poverty Maps: City of Parañaque
Bottom 2 Barangays
San AntonioSanto Niño
2 1
0.40.3
Barangay Magnitude Proportion
The Many Faces of Poverty (Volume 8)
243
Map 3. Proportion of Children 0-5 Years Old who are Malnourished,by Barangay, 2016
CBMS Poverty Maps: City of Parañaque
Bottom 11 Barangays
BaclaranSan IsidroMarcelo Green VillageTamboMervilleSan AntonioLa HuertaMoonwalkDon GaloSun ValleySan Martin De Porres
61 129 27 10 8
25 8
14 6
14 5
14.64.93.22.92.41.71.51.51.51.31.3
Barangay Magnitude Proportion
244
The Many Faces of Poverty (Volume 8)
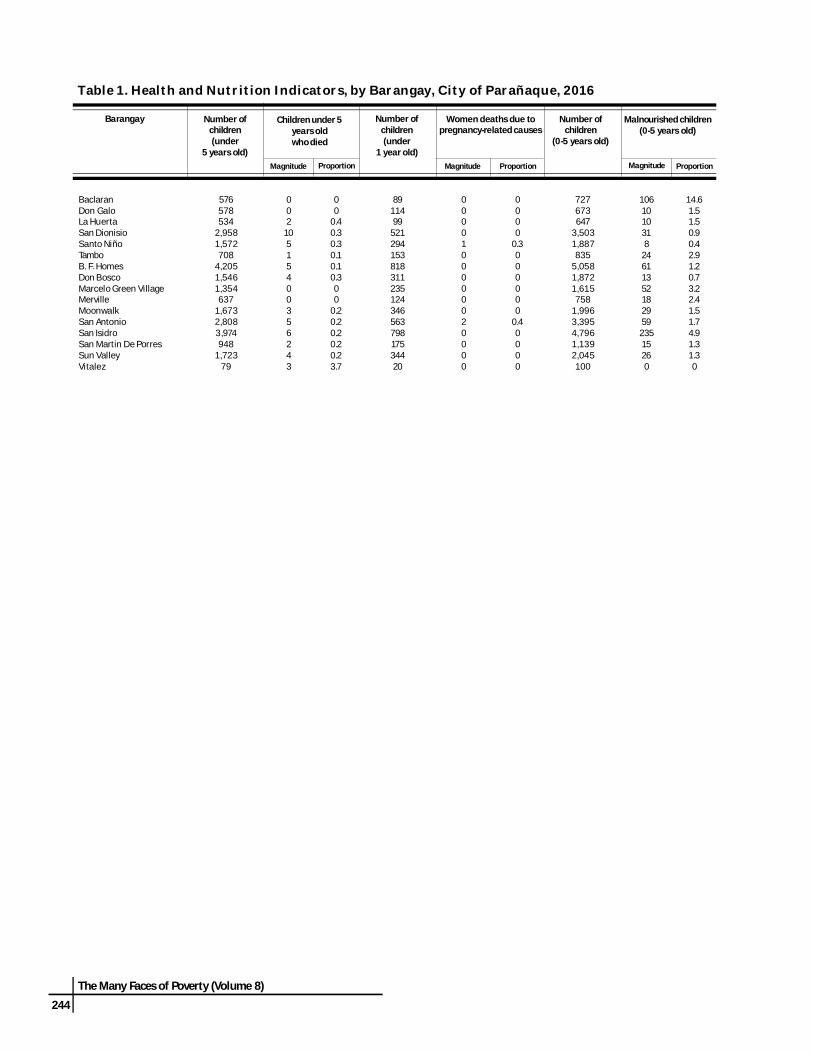
Table 1. Health and Nutrition Indicators, by Barangay, City of Parañaque, 2016
Barangay Number ofchildren
(0-5 years old)
Malnourished children(0-5 years old)
Proportion
Children under 5years oldwho died
Number ofchildren(under
1 year old)
Women deaths due topregnancy-related causes
Magnitude Magnitude Proportion Magnitude Proportion
Number ofchildren(under
5 years old)
576 578 534
2,958 1,572 708
4,205 1,546 1,354 637
1,673 2,808 3,974 948
1,723 79
727 673 647
3,503 1,887 835
5,058 1,872 1,615 758
1,996 3,395 4,796 1,139 2,045 100
1061010318
2461135218295923515260
14.61.51.50.90.42.91.20.73.22.41.51.74.91.31.30
002
10515400356243
00
0.40.30.30.10.10.300
0.20.20.20.20.23.7
0000100000020000
0000
0.3000000
0.40000
8911499
52129415381831123512434656379817534420
BaclaranDon GaloLa HuertaSan DionisioSanto NiñoTamboB. F. HomesDon BoscoMarcelo Green VillageMervilleMoonwalkSan AntonioSan IsidroSan Martin De PorresSun ValleyVitalez
The Many Faces of Poverty (Volume 8)
245
CBMS Poverty Maps: City of Parañaque
Map 4. Proportion of Households Living in Makeshift Housing, by Barangay, 2016
Barangay Magnitude Proportion
Bottom 10 Barangays
Marcelo Green VillageDon GaloSun ValleySan DionisioSan AntonioMoonwalkSanto NiñoBaclaranDon BoscoSan Martin De Porres
420 315 459 701 607 259 184 79
155 72
9.99.47.45.74.43.32.72.32.32.2
246
The Many Faces of Poverty (Volume 8)
Map 5. Proportion of Households who are Informal Settlers, by Barangay, 2016
CBMS Poverty Maps: City of Parañaque
Barangay Magnitude Proportion
Bottom 10 Barangays
Sun ValleySan AntonioLa HuertaSan Martin De PorresB. F. HomesDon GaloMarcelo Green VillageMervilleSan DionisioSanto Niño
1,479 2,661 392 543
1,988 427 477 382 718 361
23.819.119.016.413.512.711.38.65.95.3
The Many Faces of Poverty (Volume 8)
247
CBMS Poverty Maps: City of Parañaque
Map 6. Proportion of Households without Access to Safe Water Supplyby Barangay, 2016
Bottom 10 Barangays
Barangay Magnitude Proportion
B. F. HomesSan DionisioSanto NiñoMoonwalkTamboMervilleDon GaloBaclaranMarcelo Green VillageSan Isidro
3,169 815 362 411 223 209 117 49 56 179
21.66.65.35.35.24.73.51.41.31.2
248
The Many Faces of Poverty (Volume 8)
Map 7. Proportion of Households without Access to Sanitary Toilet Facilities,by Barangay, 2016
CBMS Poverty Maps: City of Parañaque
Bottom 10 Barangays
San AntonioSanto NiñoLa HuertaTamboMoonwalkSan Martin De PorresSan DionisioB. F. HomesBaclaranSan Isidro
653 271 74 42 61 24 36 8 5
21
4.74.03.61.00.80.70.30.10.10.1
Barangay Magnitude Proportion
The Many Faces of Poverty (Volume 8)
249
Table 2. Housing, Water and Sanitation Indicators, by Barangay, City of Parañaque, 2016
Households living inmakeshift housing
Households who areinformal settlers
Households without access to safewater supply
Households without access tosanitary toilet facilities
Barangay
ProportionProportion Proportion Proportion Magnitude Magnitude Magnitude Magnitude
7931537
70118453
26815542032
25960726472
4592
2.39.41.85.72.71.21.82.39.90.73.34.41.72.27.40.3
90 427 392 718 361 76
1,988 214 477 382 351
2,661 682 543
1,479 4
2.612.7195.95.31.8
13.53.2
11.38.64.5
19.14.5
16.423.80.6
49 117 20
815 362 223
3,169 19 56
209 411 94 179 3
54 0
1.43.51
6.65.35.2
21.60.31.34.75.30.71.20.10.90
517436271428412
61653212440
0.10
3.60.34.01.00.10.100
0.84.70.10.70.10
BaclaranDon GaloLa HuertaSan DionisioSanto NiñoTamboB. F. HomesDon BoscoMarcelo Green VillageMervilleMoonwalkSan AntonioSan IsidroSan Martin De PorresSun ValleyVitalez
250
The Many Faces of Poverty (Volume 8)
Map 8. Proportion of Children 6-11 years old Not Attending ElementarySchool, by Barangay, 2016
CBMS Poverty Maps: City of Parañaque
Barangay Magnitude Proportion
Bottom 11 Barangays
Santo NiñoSan DionisioVitalezLa HuertaSan IsidroBaclaranDon BoscoB. F. HomesSan AntonioMoonwalkMarcelo Green Village
198 344 12 63
405 79
169 404 295 191 124
10.99.89.79.29.19.08.68.58.28.28.2
The Many Faces of Poverty (Volume 8)
251
CBMS Poverty Maps: City of Parañaque
Map 9. Proportion of Children 12-15 years old Not Attending High School,by Barangay, 2016
Bottom 10 Barangays
Barangay Magnitude Proportion
La HuertaSanto NiñoSan AntonioSan DionisioTamboSan IsidroBaclaranMoonwalkB. F. HomesDon Galo
129 342 582 526 106 673 127 350 695 107
31.029.526.325.525.224.424.023.723.623.6
252
The Many Faces of Poverty (Volume 8)
Map 10. Proportion of Children 6-15 years old Not Attending School,by Barangay, 2016
CBMS Poverty Maps: City of Parañaque
Bottom 11 Barangays
Barangay Magnitude Proportion
San DionisioSanto NiñoLa HuertaDon GaloSan AntonioMoonwalkSan IsidroB. F. HomesVitalezSun ValleyDon Bosco
209 104 37 38
177 106 185 201
5 78 80
3.83.53.43.23.02.82.62.62.42.42.4
The Many Faces of Poverty (Volume 8)
253
Table 3. Education Indicators, by Barangay, City of Parañaque, 2016
Number ofchildren
(6-11 years old)
Children not attendingelementary school
(6-11 years old)
Number ofchildren
(12-15 years old)
Children not attending highschool
(12-15 years old)
Number ofchildren
(6-15 years old)
Children notattending school(6-15 years old)
Barangay
Magnitude Magnitude MagnitudeProportion Proportion Proportion
880 748 688
3,500 1,816 788
4,766 1,970 1,516 755
2,318 3,597 4,453 1,080 1,986 124
795463
34419858
40416912460
19129540578
13712
9.07.29.29.8
10.97.48.58.68.27.98.28.29.17.26.99.7
529 453 416
2,064 1,159 421
2,943 1,301 997 464
1,476 2,212 2,753 602
1,242 81
12710712952634210669524721995
35058267313525517
24.023.631.025.529.525.223.619.022.020.523.726.324.422.420.521.0
1,409 1,201 1,104 5,564 2,975 1,209 7,709 3,271 2,513 1,219 3,794 5,809 7,206 1,682 3,228 205
273837
20910427
201805613
10617718538785
1.93.23.43.83.52.22.62.42.21.12.83.02.62.32.42.4
BaclaranDon GaloLa HuertaSan DionisioSanto NiñoTamboB. F. HomesDon BoscoMarcelo Green VillageMervilleMoonwalkSan AntonioSan IsidroSan Martin De PorresSun ValleyVitalez
254
The Many Faces of Poverty (Volume 8)
CBMS Poverty Maps: City of Parañaque
Map 11. Proportion of Households with Income Below the Poverty Threshold,by Barangay, 2016
Barangay Magnitude Proportion
Bottom 10 Barangays
Santo NiñoSan AntonioSan Martin De PorresMoonwalkSan DionisioLa HuertaVitalezMervilleTamboSan Isidro
1,292 2,321 1,239
526 1,926
319 107 629 608
2,062
19.016.715.915.915.715.415.014.214.113.6
The Many Faces of Poverty (Volume 8)
255
Map 12. Proportion of Households with Income Below the Food Threshold,by Barangay, 2016
CBMS Poverty Maps: City of Parañaque
Barangay Magnitude Proportion
Bottom 10 Barangays
Santo NiñoVitalezSan AntonioMervilleSan Martin De PorresMoonwalkLa HuertaSan DionisioTamboSan Isidro
934 87
1,635 485 361 799 208
1,198 411
1,334
13.712.211.711.010.910.210.19.89.58.8
256
The Many Faces of Poverty (Volume 8)
Map 13. Proportion of Households who Experienced Hunger due to FoodShortage, by Barangay, 2016
CBMS Poverty Maps: City of Parañaque
TamboSan IsidroSan DionisioMoonwalkSan AntonioVitalezSanto NiñoLa HuertaB. F. HomesSun Valley
76 184 127 60 75 3
23 7
40 20
1.81.21.00.80.50.40.30.30.30.3
Bottom 10 Barangays
Barangay Magnitude Proportion
The Many Faces of Poverty (Volume 8)
257
Households with income below thepoverty threshold
Households with income below thefood threshold
Households who experienced hungerdue to food shortage
Table 4. Income Poverty and Hunger Indicators, by Barangay, City of Parañaque, 2016
Barangay
Magnitude Magnitude MagnitudeProportion Proportion Proportion
138 271 319
1,926 1,292 608
1,812 554 567 629
1,239 2,321 2,062 526 715 107
4.08.0
15.415.719.014.112.38.3
13.414.215.916.713.615.911.515.0
78 153 208
1,198 934 411 976 257 300 485 799
1,635 1,334 361 381 87
2.34.5
10.19.8
13.79.56.63.87.1
11.010.211.78.8
10.96.1
12.2
357
1272376404306075
1842203
0.10.10.31.00.31.80.30.10.10
0.80.51.20.10.30.4
BaclaranDon GaloLa HuertaSan DionisioSanto NiñoTamboB. F. HomesDon BoscoMarcelo Green VillageMervilleMoonwalkSan AntonioSan IsidroSan Martin De PorresSun ValleyVitalez
258
The Many Faces of Poverty (Volume 8)
Map 14. Unemployment Rate (15 years old and above), by Barangay, 2016
CBMS Poverty Maps: City of Parañaque
Barangay Magnitude Proportion
Bottom 10 Barangays
VitalezDon BoscoSan IsidroSan DionisioSan Martin De PorresSanto NiñoMarcelo Green VillageMoonwalkSan AntonioB. F. Homes
107 1,062 1,962 1,418 365 640 513 765
1,192 1,354
12.210.69.99.38.88.78.67.77.37.0
The Many Faces of Poverty (Volume 8)
259
Map 15. Proportion of Persons who are Victims of Crime, by Barangay, 2016
CBMS Poverty Maps: City of Parañaque
Barangay Magnitude Proportion
VitalezDon BoscoSan DionisioMoonwalkTamboSan IsidroSanto NiñoB. F. HomesSun ValleyMerville
18 135 60 37 14 60 11 36 18 9
1.10.70.20.20.20.10.10.10.10.1
Bottom 10 Barangays
260
The Many Faces of Poverty (Volume 8)
Table 5. Unemployment and Victims of Crime Indicators, by Barangay, City of Parañaque, 2016
Unemployment rate(15 years old and above)
Persons who arevictims of crimes
Number of personsin the labor force
(15 years old and above)
Barangay
ProportionProportion MagnitudeMagnitude
4,285 4,097 2,705 15,295 7,373 3,504 19,312 9,983 5,968 4,003 9,993 16,272 19,899 4,170 7,997 874
199 131 177
1,418 640 226
1,354 1,062 513 200 765
1,192 1,962 365 507 107
4.63.26.59.38.76.47.0
10.68.65.07.77.39.98.86.3
12.2
242
60111436135
69
3718605
1818
0.00.00.00.20.10.20.10.70.00.10.20.00.10.00.11.1
BaclaranDon GaloLa HuertaSan DionisioSanto NiñoTamboB. F. HomesDon BoscoMarcelo Green VillageMervilleMoonwalkSan AntonioSan IsidroSan Martin De PorresSun ValleyVitalez
The Many Faces of Poverty (Volume 8)
261
Map 16. CBMS Composite Indicator, by Barangay, 2016
CBMS Poverty Maps: City of Parañaque
Bottom 10 Barangays
San AntonioB. F. HomesLa HuertaSanto NiñoSun ValleySan Martin De PorresSan DionisioMarcelo Green VillageMoonwalkSan Isidro
0.7 0.7 0.6 0.6 0.6 0.6 0.6 0.6 0.5 0.5
Barangay Average
262
The Many Faces of Poverty (Volume 8)
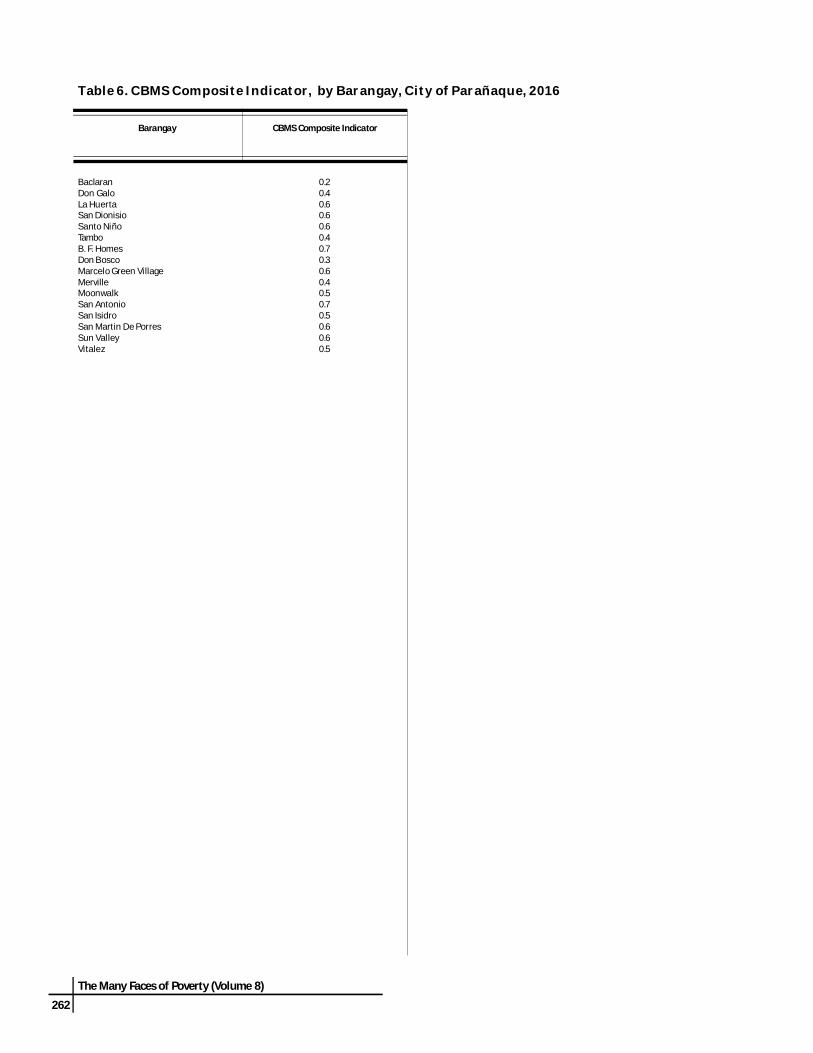
Table 6. CBMS Composite Indicator, by Barangay, City of Parañaque, 2016
Barangay CBMS Composite Indicator
BaclaranDon GaloLa HuertaSan DionisioSanto NiñoTamboB. F. HomesDon BoscoMarcelo Green VillageMervilleMoonwalkSan AntonioSan IsidroSan Martin De PorresSun ValleyVitalez
0.20.40.60.60.60.40.70.30.60.40.50.70.50.60.60.5