Embed Size (px)
Citation preview

The Median vs the Mean Fragment Size and other Issues with the
Kuz-Ram model Dr. h.c. Finn Ouchterlony Chair of Mining Engng & Mineral Economics Montanuniversität Leoben, Austria

Mean / Median and Kuz-Ram Issues Kuz-Ram precursors
• Koshelev et al. 1971 - x0 • Kuznetsov 1973 - ⟨x⟩
Kuz-Ram + mean/median • Cunningham 1983-2005 • Kuz-Ram problems • Mean vs median, x50 vs ⟨x⟩
Future Work • Distribution free xP (P = 20, 50, 80%)
2
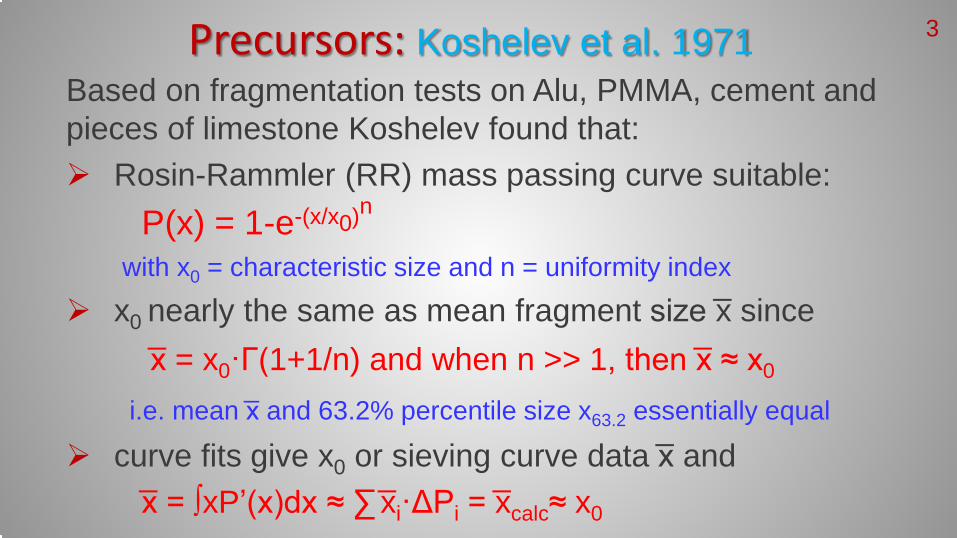
Precursors: Koshelev et al. 1971 Based on fragmentation tests on Alu, PMMA, cement and pieces of limestone Koshelev found that: Rosin-Rammler (RR) mass passing curve suitable: P(x) = 1-e-(x/x0)n
with x0 = characteristic size and n = uniformity index
x0 nearly the same as mean fragment size ͞x since ͞x = x0·Γ(1+1/n) and when n >> 1, then ͞x ≈ x0 i.e. mean ͞x and 63.2% percentile size x63.2 essentially equal
curve fits give x0 or sieving curve data ͞x and ͞x = ∫xP’(x)dx ≈ ∑ ͞xi·ΔPi = ͞xcalc≈ x0
3
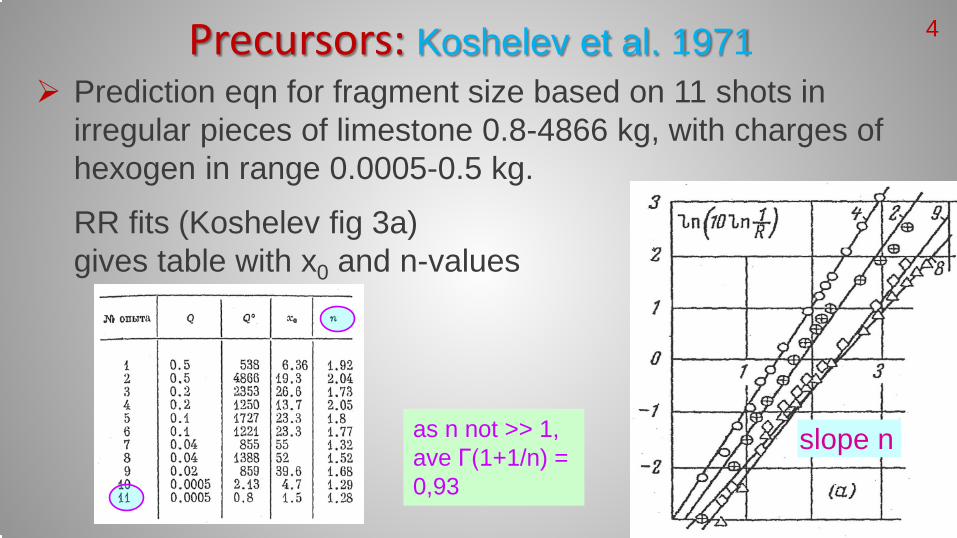
Prediction eqn for fragment size based on 11 shots in irregular pieces of limestone 0.8-4866 kg, with charges of hexogen in range 0.0005-0.5 kg.
RR fits (Koshelev fig 3a) gives table with x0 and n-values
Precursors: Koshelev et al. 1971
slope n as n not >> 1, ave Γ(1+1/n) = 0,93
4
slope -4/5
Koshelev fig 4
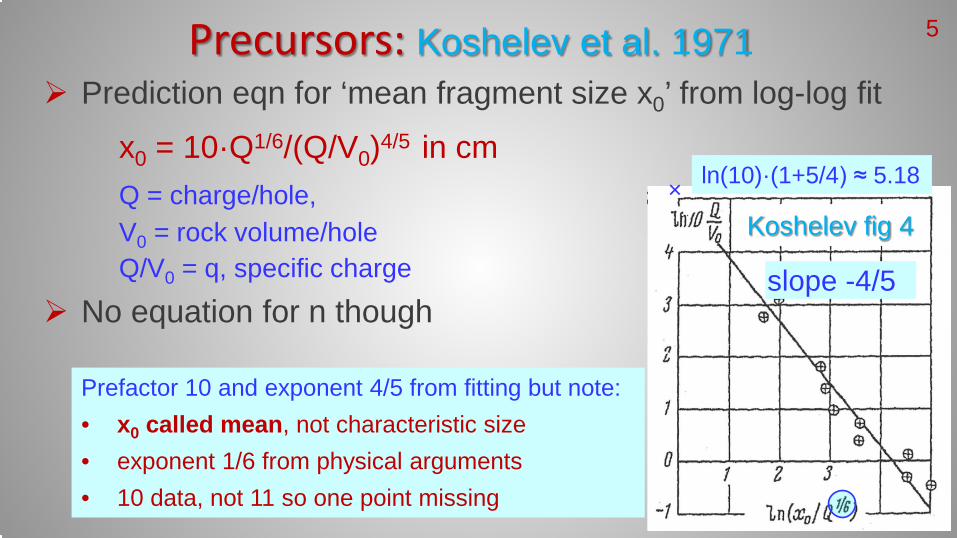
Prefactor 10 and exponent 4/5 from fitting but note: • x0 called mean, not characteristic size • exponent 1/6 from physical arguments • 10 data, not 11 so one point missing
Prediction eqn for ‘mean fragment size x0’ from log-log fit
x0 = 10·Q1/6/(Q/V0)4/5 in cm Q = charge/hole, V0 = rock volume/hole Q/V0 = q, specific charge
No equation for n though
Precursors: Koshelev et al. 1971
× ln(10)·(1+5/4) ≈ 5.18
5

1973 Kuznetsov published an extended prediction formula for the mean fragment size of a quarry or bench blast. He used ⟨x⟩ to denote ͞x so
⟨x⟩ = ͞x = A·Q1/6/(Q/V0)4/5 in cm Q is the equiv. TNT charge in a hole, V0 nominal breakage volume.
From tests in mines & quarries A was obtained as 7 for medium hard rocks; f = 8-10 A = 10 for hard but highly fissured rocks, f = 10-14 13 for very hard weakly fissure rocks, f = 12-16 f is the Protodyakonov’s stamp hardness
Still no prediction equation for n
Precursors: Kuznetsov 1973 6
Precursors: Kuznetsov 1973 Checking Kuznetsov’s data shows that fragmentation is
coarse, sieving procedures not described, no mention of how x0 or ͞x was obtained, contradiction of n > 1 requirement in 13 of 14 cases where possible to check. So ͞x ≈ x0 simply not true etc. More details in paper.
This shows that for this pioneering work we have • ‘engineering’ character of formula development • wide deviation from RR behavior accepted • a formula that is not so uniquely related to the mean
size ͞x as one might think to begin with
7
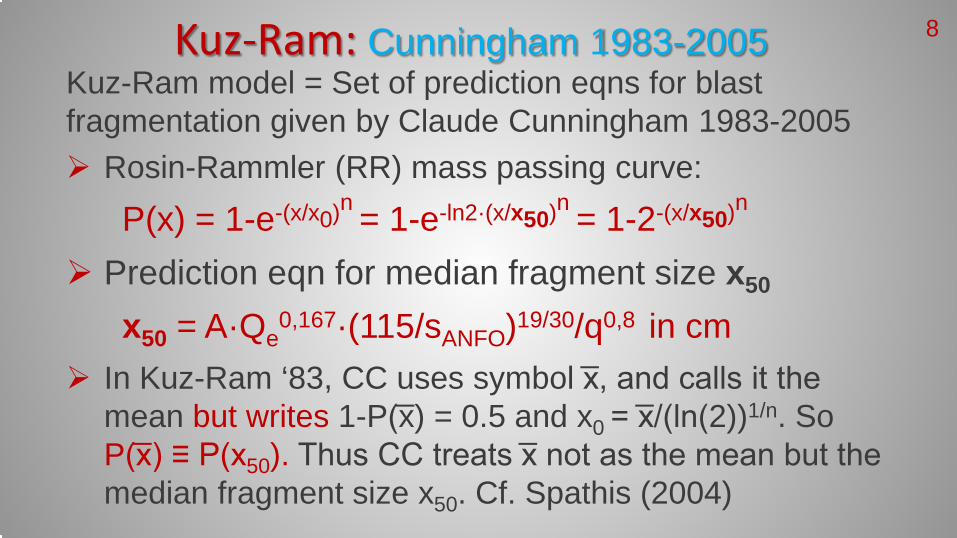
Kuz-Ram model = Set of prediction eqns for blast fragmentation given by Claude Cunningham 1983-2005 Rosin-Rammler (RR) mass passing curve: P(x) = 1-e-(x/x0)n = 1-e-ln2·(x/x50)n = 1-2-(x/x50)n Prediction eqn for median fragment size x50 x50 = A·Qe
0,167·(115/sANFO)19/30/q0,8 in cm In Kuz-Ram ‘83, CC uses symbol ͞x, and calls it the
mean but writes 1-P(͞x) = 0.5 and x0 = ͞x/(ln(2))1/n. So P(͞x) ≡ P(x50). Thus CC treats ͞x not as the mean but the median fragment size x50. Cf. Spathis (2004)
Kuz-Ram: Cunningham 1983-2005 8
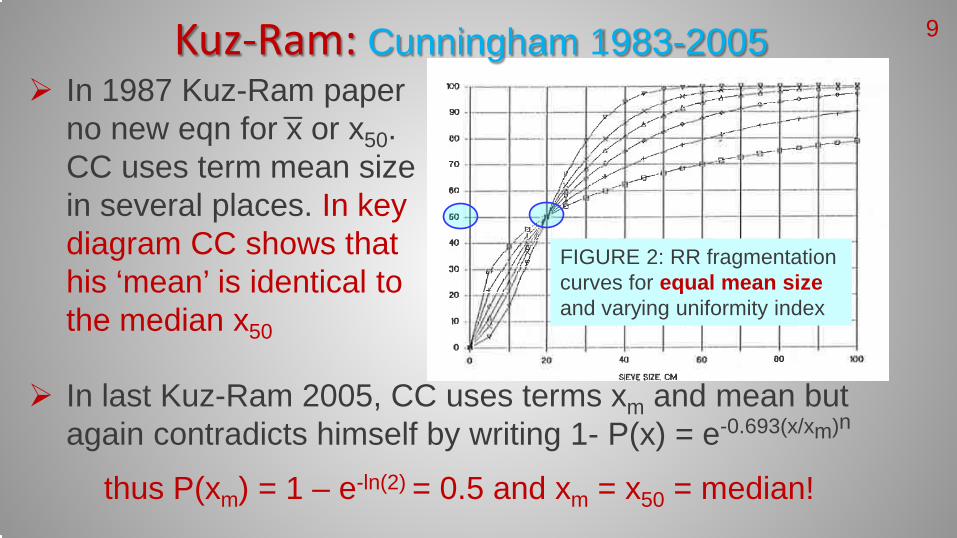
FIGURE 2: RR fragmentation curves for equal mean size and varying uniformity index
In last Kuz-Ram 2005, CC uses terms xm and mean but again contradicts himself by writing 1- P(x) = e-0.693(x/xm)n
thus P(xm) = 1 – e-ln(2) = 0.5 and xm = x50 = median!
Kuz-Ram: Cunningham 1983-2005 In 1987 Kuz-Ram paper
no new eqn for ͞x or x50. CC uses term mean size in several places. In key diagram CC shows that his ‘mean’ is identical to the median x50
9
Thus Cunningham de facto in his Kuz-Ram papers uses the median x50 as key fragment size measure!
In Kuz-Ram ‘83 CC uses Kuznetsov’s rock factor A = 7-13 valid for mean (or 63.2% passing) fragment size. Error not large compared to formula inaccuracies but Spathis (2004) noted it and said it could explain poor fines prediction.
Spathis (2009, 2013) extended this critique to Kuz-Ram ‘87 but CC had now proposed new A-factor for use with x50
A = 0,06·(RMD+JF+RDI+HF) based on Lilly’s digability factor. So Spathis’ critique not
valid from ‘87 on.
Kuz-Ram: Cunningham 1983-2005 10
Cunningham’s real contribution is expression for uniformity index n. With x50 and n whole fragment size distribution is computable. n in Kuz-Ram ‘87 depends only on geometry
n = (2.2-0.014·B/Ø)·(1-SD/B)·√[(1+S/B)/2]· ·[|Lb-Lc|/Ltot+0.1]0.1·(Ltot /H) In Kuz-Ram 2005, A and n equations have changed but n
still independent of specific charge q e.g. Problems with Kuz-Ram model:
• No largest boulder size, infinite size possible • Not enough fine material according to RR function • Uniformity index independent of specific charge
Kuz-Ram: Cunningham 1983-2005 11
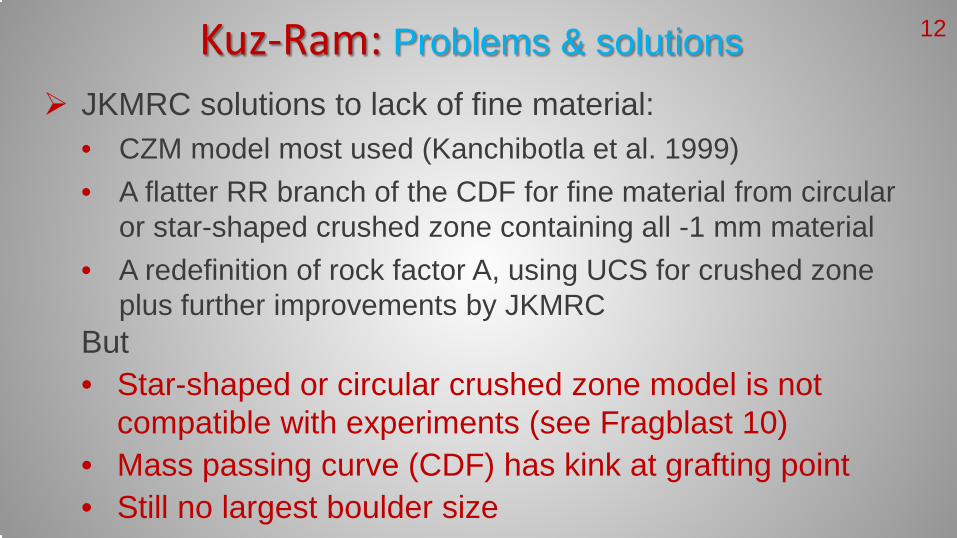
Kuz-Ram: Problems & solutions JKMRC solutions to lack of fine material:
• CZM model most used (Kanchibotla et al. 1999) • A flatter RR branch of the CDF for fine material from circular
or star-shaped crushed zone containing all -1 mm material • A redefinition of rock factor A, using UCS for crushed zone
plus further improvements by JKMRC But • Star-shaped or circular crushed zone model is not
compatible with experiments (see Fragblast 10) • Mass passing curve (CDF) has kink at grafting point • Still no largest boulder size
12
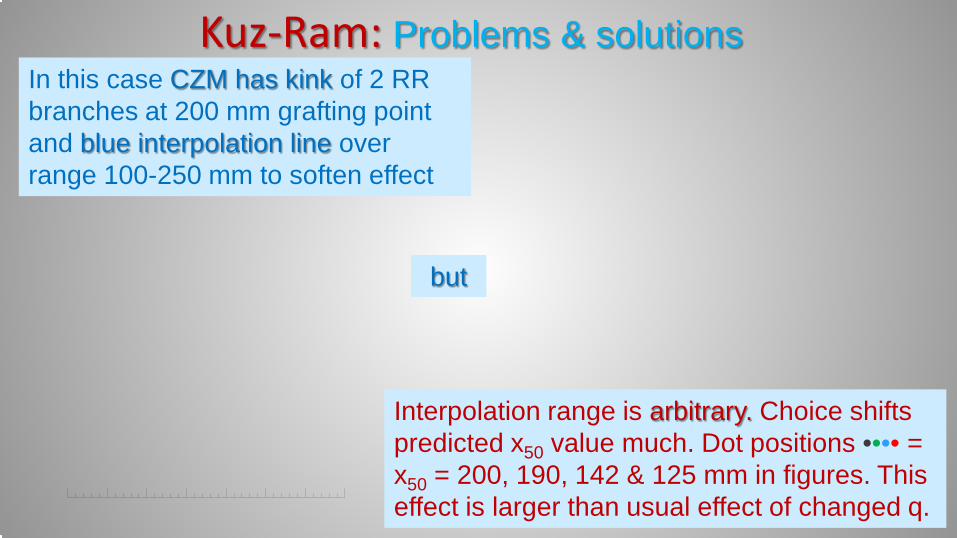
Kuz-Ram: Problems & solutions In this case CZM has kink of 2 RR branches at 200 mm grafting point and blue interpolation line over range 100-250 mm to soften effect
but
Interpolation range is arbitrary. Choice shifts predicted x50 value much. Dot positions •••• = x50 = 200, 190, 142 & 125 mm in figures. This effect is larger than usual effect of changed q.
Kuz-Ram: Problems & solutions
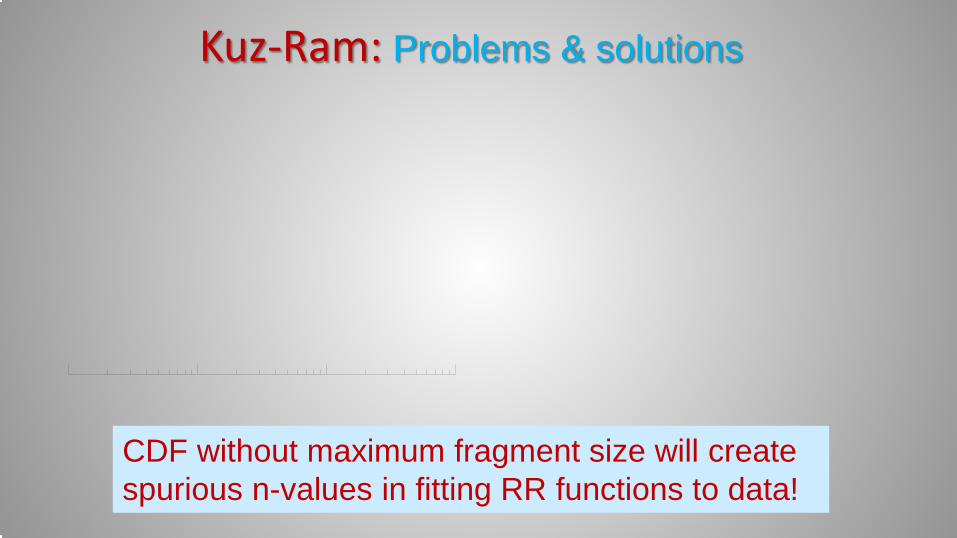
CDF without maximum fragment size will create spurious n-values in fitting RR functions to data!
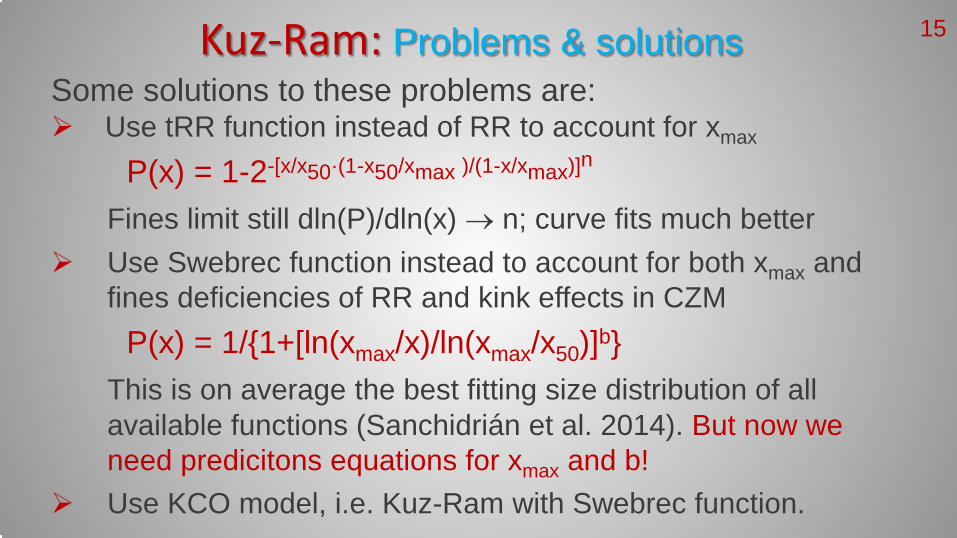
Kuz-Ram: Problems & solutions Some solutions to these problems are: Use tRR function instead of RR to account for xmax
P(x) = 1-2-[x/x50·(1-x50/xmax )/(1-x/xmax)]n
Fines limit still dln(P)/dln(x) → n; curve fits much better Use Swebrec function instead to account for both xmax and
fines deficiencies of RR and kink effects in CZM P(x) = 1/{1+[ln(xmax/x)/ln(xmax/x50)]b} This is on average the best fitting size distribution of all
available functions (Sanchidrián et al. 2014). But now we need predicitons equations for xmax and b!
Use KCO model, i.e. Kuz-Ram with Swebrec function.
15
Kuz-Ram: Mean vs. median issue Which measure is better, the mean ͞x or the median x50? First, does the Soviet work of Koshelev, which led to the
mean via x0 allow a similar representation for x50?
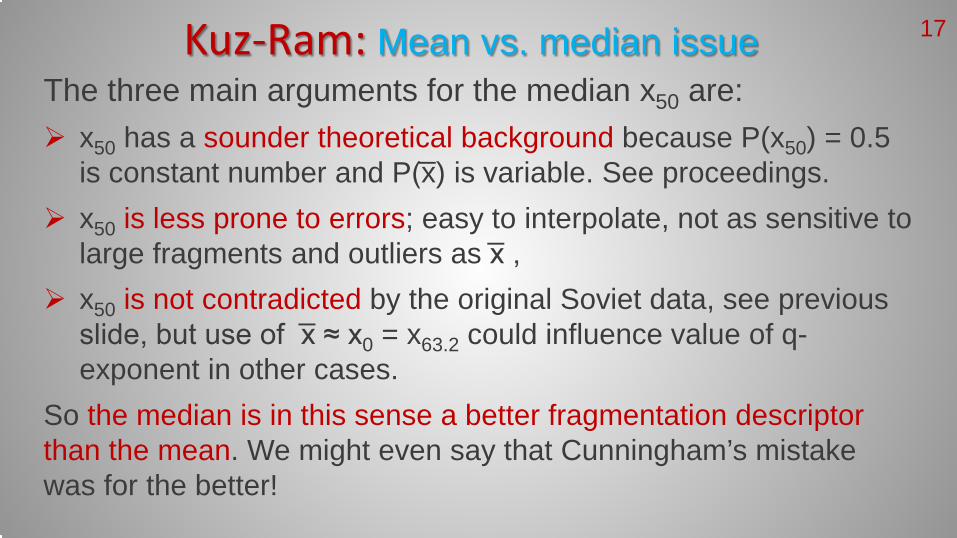
The three main arguments for the median x50 are: x50 has a sounder theoretical background because P(x50) = 0.5
is constant number and P(͞x) is variable. See proceedings. x50 is less prone to errors; easy to interpolate, not as sensitive to
large fragments and outliers as ͞x , x50 is not contradicted by the original Soviet data, see previous
slide, but use of ͞x ≈ x0 = x63.2 could influence value of q-exponent in other cases.
So the median is in this sense a better fragmentation descriptor than the mean. We might even say that Cunningham’s mistake was for the better!
Kuz-Ram: Mean vs. median issue 17
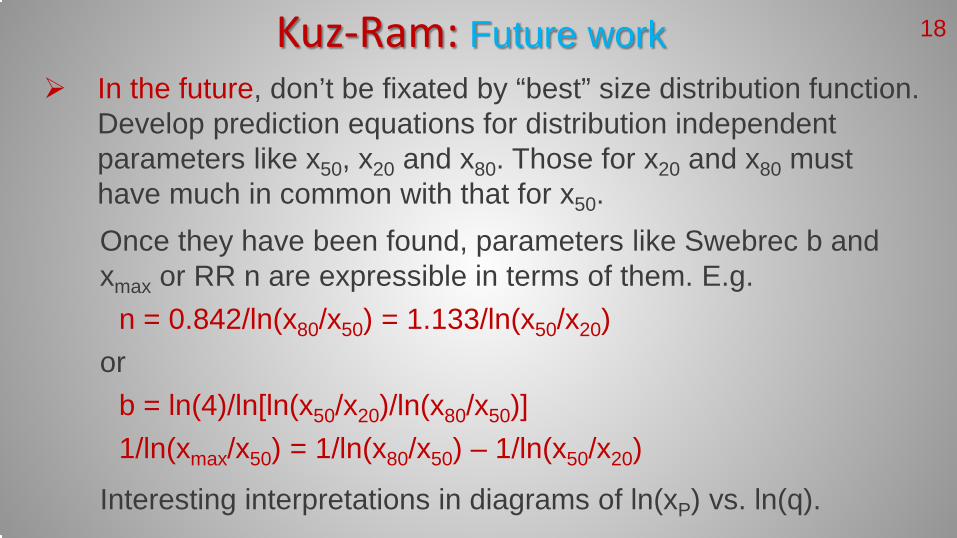
Kuz-Ram: Future work In the future, don’t be fixated by “best” size distribution function.
Develop prediction equations for distribution independent parameters like x50, x20 and x80. Those for x20 and x80 must have much in common with that for x50. Once they have been found, parameters like Swebrec b and xmax or RR n are expressible in terms of them. E.g. n = 0.842/ln(x80/x50) = 1.133/ln(x50/x20) or b = ln(4)/ln[ln(x50/x20)/ln(x80/x50)] 1/ln(xmax/x50) = 1/ln(x80/x50) – 1/ln(x50/x20)
Interesting interpretations in diagrams of ln(xP) vs. ln(q).
18
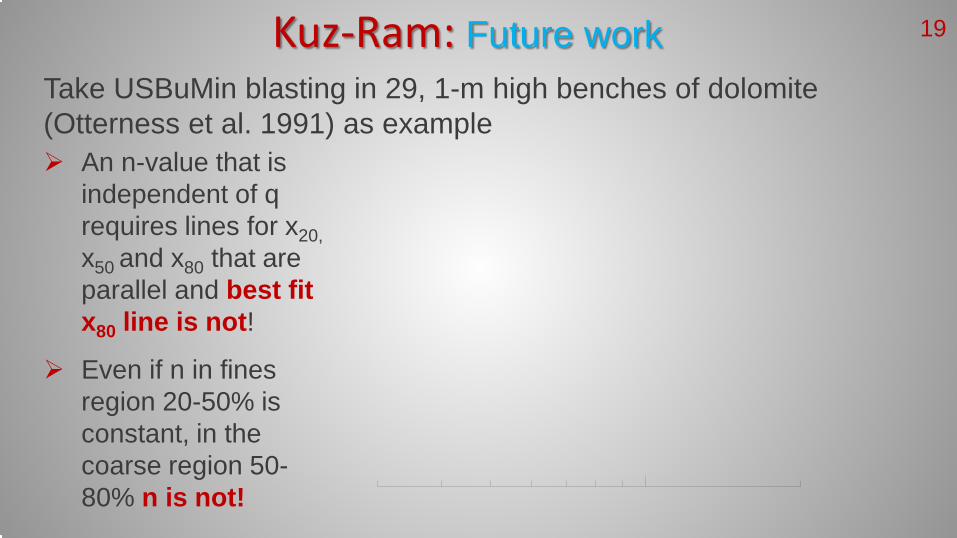
Kuz-Ram: Future work Take USBuMin blasting in 29, 1-m high benches of dolomite (Otterness et al. 1991) as example An n-value that is
independent of q requires lines for x20, x50 and x80 that are parallel and best fit x80 line is not!
Even if n in fines region 20-50% is constant, in the coarse region 50-80% n is not!
19
Kuz-Ram: Future work With x20, x50 and x80 we are independent of which
function that fits the data best! In hind-sight it would have been better if the Kuz-Ram model hadn’t been hardwired to the RR function.
20
Kuz-Ram: Final comments Discussions with Prof José Sanchidrián of UPM (Madrid)
and Claude Cunningham have been extremely helpful in the development of this material.
Alex Spathis repeated comments on the mean to median issue spurred some of the work and a persistent RMRE reviewer helped hone my arguments.
Blast fragmentation data still has many secrets. By pooling such data and subjecting them to different analyses we can improve our prediction equations. Numerical simulations aren’t catching up for a while yet!
21


![Mean, Mode, Median[1]](https://img.pdfslide.net/doc/110x75/5462509daf7959fe1b8b57b8/mean-mode-median1-5584ae32b3357.jpg)


![Mean, Mode, Median[1]](https://img.pdfslide.net/doc/110x75/54625097af7959aa3d8b540f/mean-mode-median1-5584ae32b6452.jpg)