Embed Size (px)
Citation preview

This article was downloaded by: [University of Nebraska, Lincoln]On: 09 October 2014, At: 16:31Publisher: Taylor & FrancisInforma Ltd Registered in England and Wales Registered Number: 1072954 Registered office: Mortimer House,37-41 Mortimer Street, London W1T 3JH, UK
Ringing & MigrationPublication details, including instructions for authors and subscription information:http://www.tandfonline.com/loi/tram20
The migration seasons of birds as recorded atDungeness bird observatory in Southeast EnglandIan Newton a d , Anna Ekner b , David Walker c & Tim H. Sparks e fa NERC Centre for Ecology and Hydrology , Monks Wood, Abbots Ripton, Huntingdon,Cambridgeshire, PE28 2LS, UK E-mail:b Department of Behavioural Ecology , Adam Mickiewicz University , Umultowska 89,Poznań, 61–614, Polandc 11 RNSSS Cottages, Dungeness, Romney Marsh, Kent, TN29 9NA, UKd Old Mill, Mill Lane, Pickworth, Sleaford, Lincs, NG34 0TE, UKe NERC Centre for Ecology and Hydrology , Monks Wood, Abbots Ripton, Huntingdon,Cambridgeshire, PE28 2LS, UKf Institute of Zoology , Poznań University of Life Sciences , Wojska Polskiego 71 C, Poznań,60–625, PolandPublished online: 11 Apr 2011.
To cite this article: Ian Newton , Anna Ekner , David Walker & Tim H. Sparks (2010) The migration seasons ofbirds as recorded at Dungeness bird observatory in Southeast England, Ringing & Migration, 25:2, 71-87, DOI:10.1080/03078698.2010.9674420
To link to this article: http://dx.doi.org/10.1080/03078698.2010.9674420
PLEASE SCROLL DOWN FOR ARTICLE
Taylor & Francis makes every effort to ensure the accuracy of all the information (the “Content”) containedin the publications on our platform. However, Taylor & Francis, our agents, and our licensors make norepresentations or warranties whatsoever as to the accuracy, completeness, or suitability for any purpose of theContent. Any opinions and views expressed in this publication are the opinions and views of the authors, andare not the views of or endorsed by Taylor & Francis. The accuracy of the Content should not be relied upon andshould be independently verified with primary sources of information. Taylor and Francis shall not be liable forany losses, actions, claims, proceedings, demands, costs, expenses, damages, and other liabilities whatsoeveror howsoever caused arising directly or indirectly in connection with, in relation to or arising out of the use ofthe Content.
This article may be used for research, teaching, and private study purposes. Any substantial or systematicreproduction, redistribution, reselling, loan, sub-licensing, systematic supply, or distribution in anyform to anyone is expressly forbidden. Terms & Conditions of access and use can be found at http://www.tandfonline.com/page/terms-and-conditions

© 2010 British Trust for Ornithology
Ringing & Migration (2010) 25, 71–87
The migration seasons of birds as recorded at Dungeness Bird Observatory in southeast EnglandIAN NEWTON1,4*, ANNA EKNER2, DAVID WALKER3 and TIM H. SPARKS1,5
1NERC Centre for Ecology and Hydrology, Monks Wood, Abbots Ripton, Huntingdon, Cambridgeshire PE28 2LS, UK 2Department of Behavioural Ecology, Adam Mickiewicz University, Umultowska 89, 61-614 Poznań, Poland 311 RNSSS Cottages, Dungeness, Romney Marsh, Kent TN29 9NA, UK 4current address: Old Mill, Mill Lane, Pickworth, Sleaford, Lincs NG34 0TE, UK 5current address: Institute of Zoology, Poznań University of Life Sciences, Wojska Polskiego 71 C, 60-625 Poznań, Poland
This paper summarises the migration periods of birds at Dungeness Bird Observatory, Kent, southeast England, as calculated from daily counts conducted over an 18-year period. Mean spring migration dates for different species ranged between 6 February (Greenfinch Carduelis chloris) and 26 May (Reed Warbler Acrocephalus scirpaceus), and mean late summer/autumn dates between 11 August (Reed Warbler) and 27 November (Great Crested Grebe Podiceps cristatus). In general, species which arrived early in spring tended to depart late in autumn and vice versa. The overall average spring passage date for all species was 9 April and the overall autumn date 3 October. Long-distance migrants, wintering in sub-Saharan Africa, tended to arrive later and depart earlier, spending a shorter period in Britain than short-distance migrants wintering within Europe. Although the population levels of birds are higher in autumn than in spring, in some species the spring totals at Dungeness far exceeded their autumn totals. The annual cycles of the birds passing through Dungeness, as reflected in their migration dates, were centred not on the longest day, nor on the warmest, but roughly midway between the two.
Most recent interest in the migration dates of birds has been generated by concern over the impacts of climate change, and little attention has been paid to other aspects of migration dates. Our aim in this paper is to examine the migration seasons of various bird species that passed through Dungeness Bird Observatory (50.9°N, 1.0°E) during 1990–2007. Situated on the southeast corner of England, this Observatory is ideally sited to record the movements of birds in and out of Britain, as well as those passing through the English Channel. Moreover, the Observatory is permanently manned, and systematic records have been kept of all the birds recorded there on a daily basis over many years. Some of the findings are known in general terms but, to our knowledge, have not been quantified or examined in detail. Because the total study period is relatively short (16–18 years, depending on species), we will forgo in this paper discussion of any changes in migration dates that may have occurred within this period. Nevertheless, bear in mind that this study period included some of the warmest years on record for southeast England.
Several previous studies gave quantitative information on the seasonal occurrence of birds at British and Irish observation sites, including Cape Clear (Sharrock 1973), Lundy Island (Dymond 1980), Bardsey Island (Roberts 1985), Calf of Man (Cullen & Jennings 1986), Fair Isle (Dymond 1991) and North Ronaldsay (reported in Forrester & Andrews 2007). Other studies gave details from one or more Bird Observatories for particular groups of species (eg see Davis 1967 for Sylvia warblers at seven British Bird Observatories, Riddiford & Findley 1981 for 39 summer-visiting species at nine Observatories), or for individual species (for Common Redstart1 see Hope Jones 1975; for Ring Ouzel see Durman 1976; for Pied Flycatcher see Hope Jones et al 1977; for Black Redstart see Langslow 1977; for Reed and Sedge Warblers see Insley & Boswell 1978; for Blackcap see Langslow 1979). However, in none of these studies was any comparative statistical analysis made of the data presented. Similar information on seasonal occurrence is available for a number of Bird Observatories in continental Europe, as may be seen from their respective web sites.
* Correspondence author Email: [email protected]
1 Scientific names are given in Appendix 1 or, for species not listed in Appendix 1, at first mention in the text
Dow
nloa
ded
by [
Uni
vers
ity o
f N
ebra
ska,
Lin
coln
] at
16:
31 0
9 O
ctob
er 2
014

72 I. Newton et al
© 2010 British Trust for Ornithology, Ringing & Migration, 25, 71–87
METHODS
We used the daily totals of all the birds counted at Dungeness Bird Observatory during the 18 years 1990–2007. More than eight million birds were recorded in this period. However, in the first two years, some species were noted as present only, with no numbers given, so for these species only data for the years 1992–2007 were included. Each morning during the study period, weather permitting, all birds were counted within an approximate 2-km2 area, which included willow scrub, open shingle with patches of broom and gorse, and two gravel pits edged with additional willow scrub. The numbers counted on any particular day were a function of the numbers of new arrivals and the numbers remaining from previous days, which in migration seasons could not normally be distinguished. The count area did not change substantially during the study period, except that some of the bushes became larger (for more detailed description of the general area see Scott et al 1976). Throughout the period from March to October/November, ‘daily’ counts were made by the Warden and Assistant Warden, and these counts formed the basis for assessing the daily totals of each species present. During the winter months, only one person (the Warden) was there to make the counts, but far fewer birds were present then. The numbers of additional observers present at the Bird Observatory fluctuated greatly during the year, but their records, along with ringing results, were taken into account in assessing the daily totals of each species judged to have been present, and entered into the Observatory logbooks. It is the view of the Observatory Warden (DW) that fluctuations in observer numbers would not have influenced the recorded passage periods of different species, as documented here. The sea-watch counts refer to all observations of passing seabirds made during specified watch periods (using telescopes), and for some purposes (see below) these counts were expressed on a ‘birds per hour’ basis.
To assess the overall seasonal pattern in numbers of each species, the data for all 16–18 years were combined, and expressed as the average number of individuals seen per day in each five-day period (pentad). Only the 154 species recorded in at least 10 of the 18 years and averaging at least 10 birds in any one season were included in further analyses. Seven main patterns emerged:
Birds present mainly or entirely in the spring and/or 1. autumn migration seasons, with only occasional or no individuals recorded between these seasons, in summer and winter; a pattern shown by passage migrants to the area. Fifty-two species showed this type of pattern (Appendix 1), exemplified by the Spotted Flycatcher in Fig 1a.Birds present mainly during the migration seasons and 2. in smaller numbers in summer, but absent in winter; a
pattern with clearly defined migration seasons shown mainly by summer visitors to the area and beyond. Sixteen species showed this pattern (Appendix 1), exemplified by the Northern Wheatear in Fig 1b.Birds present mainly during the migration seasons and 3. in smaller numbers in winter, but entirely or largely absent in summer; a pattern with clearly defined migration seasons shown by winter visitors to the area and beyond. Thirty-eight species showed this pattern (Appendix 1), exemplified by the Redwing in Fig 1c. Birds present year-round, but with clearly defined 4. autumn and/or spring peaks during migration seasons. Twenty-six species showed this pattern (Appendix 1), exemplified by the Robin in Fig 1d.Birds present in summer only, but with no clearly 5. defined peaks during migration seasons. Six species showed this pattern (Appendix 1), exemplified by the Swift in Fig 1e.Birds present in winter only, but with no clearly defined 6. peaks during migration seasons. Eight species showed this pattern (Appendix 1), exemplified by the Red-throated Diver in Fig 1f. Birds present year-round, but with no clearly defined 7. migration seasons. Eight species showed this pattern (Appendix 1), exemplified by the Gannet in Fig 1g.
Only for the 132 species in the first four categories could one or both migration seasons be discerned from the counts. For the 52 species present only in migration seasons, such as the Spotted Flycatcher, these seasons could be clearly and unequivocally defined, enabling calculation of first, last, mean and peak dates for each year (Fig 1a). The remaining species were also present at times outside the migration seasons, making it hard to delimit these seasons precisely. We therefore adopted an arbitrary procedure for all species in categories 1–4, counting the first half of the year (1 January–30 June) as ‘spring’ and the second half of the year (1 July–31 December) as ‘autumn’. Peak migration dates for each species were then taken as the particular five-day period (pentad) when peak counts were recorded in each half of the year. This was done separately for each year, and standard deviations for each season were also estimated for each year and averaged (Appendix 1). Mean dates were calculated from the daily counts in each half of the year, and standard deviations of the overall means were again estimated from the separate means for individual years. Although, for most species, some daily counts would have fallen outside the migration seasons (referring to summer or winter residents), these counts usually involved relatively small numbers of individuals (note the log scale in Fig 1), and the overall mean dates for different species were highly correlated with the overall peak pentad dates (spring: r = 0.912; autumn: r = 0.880; both P < 0.001). In view of these
Dow
nloa
ded
by [
Uni
vers
ity o
f N
ebra
ska,
Lin
coln
] at
16:
31 0
9 O
ctob
er 2
014

Migration seasons of birds at Dungeness 73
© 2010 British Trust for Ornithology, Ringing & Migration, 25, 71–87
high correlations, most of the remaining analyses were conducted on mean dates alone.
For the remaining species (categories 5–7), mean and peak migration dates could not be calculated, but first or last spring and/or autumn dates could be calculated for all species present during only part of the year, whether summer or winter visitors or passage migrants. These dates are given in Appendix 1 for whichever species they could be calculated. Only for the eight species that were present year-round, with no clearly defined seasonal peaks, such as the Gannet, could no useful information on migration seasons be calculated, and these species are excluded from further consideration.
A record of time spent on sea-watch hours had also been kept. For seabirds only, we recalculated the above statistics based on the mean number of individuals of each species observed passing by per sea-watch hour (Appendix 2). For most species totals were much smaller than in the overall data (which included resting and feeding birds), and for seven species migration peaks that were clearly evident in the overall data were not apparent in the sea-watch
data. These seven species were therefore re-allocated to different groups in Appendix 2, and no migration peaks from sea-watch data were calculated: they were Northern Fulmar, Great Cormorant, European Shag, Glaucous Gull, Common Tern, Scaup and Common Goldeneye. For other seabird species, mean migration dates calculated from sea-watch data differed slightly from those calculated from the overall data. Our purpose in Appendix 2 is to present these sea-watch data in a way that they can be compared with similar data collected elsewhere (eg Cooke 2006), and unless stated otherwise, the remaining text is based on the overall data in Appendix 1.
RESULTS
General patterns The overall average spring migration date of all species was 9 April (day 99 from 1 January), and the overall autumn date 3 October (day 276) (Fig 2). However, great variation was apparent in the migration dates of different species,
Figure 1. Seven main seasonal patterns in species numbers recorded from daily counts at Dungeness Bird Observatory. (a) Species present in migration seasons only; eg Spotted Flycatcher. (b) Species present mainly during migration seasons and in smaller numbers in summer; eg Northern Wheatear. (c) Species present mainly during migration seasons and in smaller numbers in winter; eg Redwing. (d) Species present year round, with peaks in migration seasons; eg Robin. (e) Species present in summer only, with no clearly defined migration seasons; eg Swift. (f) Species present in winter only, with no clearly defined migration seasons; eg Red-throated Diver. (g) Species present year-round, with no clearly defined migration seasons; eg Gannet. Vertical scale represents mean daily abundance on a log scale; horizontal scale represents five-day periods (pentads) through the year.
Dow
nloa
ded
by [
Uni
vers
ity o
f N
ebra
ska,
Lin
coln
] at
16:
31 0
9 O
ctob
er 2
014

74 I. Newton et al
© 2010 British Trust for Ornithology, Ringing & Migration, 25, 71–87
with mean spring dates ranging between 6 February (day 37, Greenfinch) and 26 May (day 146, Reed Warbler), and mean autumn dates between 11 August (day 223, Reed Warbler) and 27 November (day 331, Great Crested Grebe). There was a broad correlation between spring and autumn dates: species which passed through Dungeness late in spring tended also to pass early in autumn, while species which passed through early in spring tended to pass late in autumn (r = -0.713, P < 0.001, Fig 3).
Other patterns were apparent across species. For example, the first spring date was correlated with the mean spring date (r = 0.719, P < 0.001, Fig 4), and the last autumn date was correlated with the mean autumn date (r = 0.703, P < 0.001, Fig 5). Furthermore, the standard deviation of mean spring date was correlated with the mean spring date (r = -0.468, P < 0.001, Fig 6), reflecting greater variation in the inter-annual arrival dates of early spring migrants than later ones. In contrast, the standard deviation of the mean autumn dates of different species was not significantly correlated with their mean autumn dates (r = 0.158, P = 0.081). However, the standard deviation of the mean spring date was correlated with the standard deviation of the mean autumn date (r = 0.377, P < 0.001).
In general, the arrival and departure dates of migrants at Dungeness reflected some well-known patterns among closely related species hitherto studied mainly by first arrival dates. For example, the three hirundine species arrived
(mean dates) in spring in order Sand Martin (day 126), Barn Swallow (day 132) and House Martin (day 138), and left in the same order (days 238, 262 and 266 respectively). In the last respect, they differed from the general trend among all species. Similarly, eight different warblers in the genera Phylloscopus, Sylvia and Acrocephalus arrived (mean dates) in the sequence: Chiffchaff (day 102), Willow Warbler (114), Blackcap (118), Sedge Warbler (129), Whitethroat (131), Garden Warbler (132), Lesser Whitethroat (134) and Reed Warbler (146). They left in the order Reed Warbler (223), Whitethroat (227), Sedge Warbler (233), Willow Warbler (234), Garden Warbler (245), Lesser Whitethroat (246), Blackcap (274) and Chiffchaff (276). Compared with the hirundines, these warbler species more closely approximated the overall pattern among all species, with the earliest to arrive being last to leave.
Reflecting another well-known pattern, long-distance migrants, wintering in sub-Saharan Africa, tended to arrive later and depart earlier, spending a shorter period in Britain than short-distance migrants that winter within Europe. This pattern is shown for passerines in Fig 7, but it also occurs in some other groups (Appendix 1). Most large bird species raise only one brood per year in Britain, but among passerines, almost every species would have time to raise more than one brood (or at least attempt a repeat nest if the first failed).
Annual cycle in relation to seasonal daylength and temperature changesFollowing Preston (1966), we calculated the midpoints (bisectrix dates) between mean autumn and spring migration dates of 108 bird species for which these dates could be reliably obtained. The average mid date for all
Figure 2. Distribution of species mean spring and autumn migration dates (upper), and the distribution of mid dates (bisectrix) between their mean spring and autumn migration dates (lower). Histograms are based on five-day intervals (pentads), with initial letter of months marking the approximate midpoint of each month. Overall mean dates are indicated by vertical dashed lines. Based on the 132 species for which mean autumn and/or spring migration dates could be calculated.
Figure 3. Relationship between mean spring and autumn migration dates for species recorded in both seasons. In general, species that passed through early in spring tended also to pass through late in autumn, and vice versa (r = -0.713, P < 0.001).
Dow
nloa
ded
by [
Uni
vers
ity o
f N
ebra
ska,
Lin
coln
] at
16:
31 0
9 O
ctob
er 2
014

Migration seasons of birds at Dungeness 75
© 2010 British Trust for Ornithology, Ringing & Migration, 25, 71–87
species combined fell on 7 July (day 188). These mid dates varied considerably between species (day 166–214), but all except one fell after the summer solstice. The bisectrix dates at Dungeness are shown in Fig 8 in relation to the seasonal changes in daylength (taken at London, c.50 km further north than Dungeness) and temperature (Central England series) recorded over the same period. As in the rest of the northern hemisphere, the longest day fell on 21 June (at London 16.6 hours), and the shortest on 21 December (at London 7.8 hours). The annual temperature cycle lagged more than a month behind the daylight cycle, with the hottest pentad falling, on average, in early August, and the coldest, on average, in late January. It is clear from Fig 7 that the annual cycles of the birds passing through Dungeness, as reflected in their migration dates, were centred not on the longest day nor on the warmest but about midway between.
In calculating the difference between mean spring and mean autumn passage dates, considerable variation was apparent between categories 1–4 in Appendix 1 (one-way ANOVA of difference on group category; F3, 104= 32.72, P < 0.001, all significantly different from one another using a Tukey multiple comparison). Passage migrants at Dungeness (category 1) showed a mean difference of 159 days (n = 35), summer visitors (category 2) of 123 days (n = 15), winter visitors (category 3) of 190 days (n = 34), residents/passage migrants (category 4) of 225 days (n = 21). For none of these categories were these periods likely to entirely reflect residence periods within Britain, because some individuals seen at Dungeness could have been on passage between breeding and wintering areas beyond Britain. The interval between mean spring and mean autumn peak dates for particular species varied between 77 days (Reed Warbler) and 282 days (Greenfinch).
Autumn and spring totalsAll species would be expected to have larger populations in autumn than in spring, as a result of summer breeding, and in most species counted at Dungeness the autumn count was indeed higher than the spring one. However, some species showed larger spring counts than autumn ones (Appendix 1). Species in which spring counts were more than twice as high as autumn counts included (in order of disparity): Bar-tailed Godwit (spring count 25.0× higher than autumn count), Garganey (15.0×), Whimbrel (13.9×), Glaucous Gull (10.0×), Jay (9.5×), Pomarine Skua (8.8×), Greylag Goose (8.5×), Shoveler (8.0×), Little Tern (7.1×), Razorbill (6.1×), Black-throated Diver (4.9×), Fulmar (4.8×), Common Scoter (4.5×), Scaup (4.5×), Brent Goose (3.7×), Great Crested Grebe (3.6×), Tufted Duck (3.6×), Velvet Scoter (3.4×), Red-breasted Merganser (3.1×), Eider (3.0×), Sanderling (2.6×), Knot (2.6×), Shag (2.4×), Oystercatcher (2.4×), Grey Plover (2.2×), Pintail
Figure 4. Relationship between the first spring date and the mean spring date for 51 species in which both dates could be calculated (r = 0.719, P < 0.001).
Figure 6. Relationship between the standard deviation of mean spring migration date and the mean spring migration date across species (r = -0.468, P < 0.001).
Figure 5. Relationship between last autumn date and mean autumn date for 59 species in which both dates could be calculated (r = 0.703, P < 0.001).
Dow
nloa
ded
by [
Uni
vers
ity o
f N
ebra
ska,
Lin
coln
] at
16:
31 0
9 O
ctob
er 2
014

76 I. Newton et al
© 2010 British Trust for Ornithology, Ringing & Migration, 25, 71–87
(2.1×), and Redshank (2.1×). All these species were water-birds or waders which presumably had mainly different routes or stopover behaviour in the two seasons. None of these species is likely to have been more detectable in spring than in autumn, so that the difference in counts reflected a genuine difference in seasonal occurrence. Some other species, generally considered as resident in Britain, also had noticeably higher peaks in spring than in autumn, a difference to which seasonal detectability may have contributed (Corn Bunting 12.1×, Red-legged Partridge 2.1×).
Some seabird species were virtually restricted to one time of year. Thus, Balearic Shearwaters were seen almost entirely in the period mid July to mid September, Sooty Shearwaters in the period August to November, Little Auks mainly in November, and Yellow-legged Gulls in the second half of the year (peaking in early August). Fulmars showed a unique pattern, in being largely absent for a post-breeding period from mid September to mid November, a pattern which was repeated at another sea-watch site on the Norfolk coast, and corresponded to the time when breeding colonies were deserted (Cooke 2006).
DISCUSSION
The advantage of the Dungeness data is that counts of both land-birds and seabirds were available year-round over a long period of years, rather than merely at recognised migration seasons. The position of this Observatory on the coast of southeast England meant that all migratory species breeding or wintering in Britain were likely to occur there, but so were conspecifics travelling to breeding areas further north or to wintering areas further south. It was therefore not possible to separate populations from different parts of Europe, and recorded migration dates are likely to have included breeders from a wider spread of latitude than Britain alone, which in turn is likely to have lengthened the migration seasons beyond those of British birds alone. Moreover, some of the individuals associated with breeding areas within Britain, but which do not breed at Dungeness, still passed through Dungeness (such as Spotted Flycatcher and Arctic Skua).
The midpoints between the mean spring and autumn migration periods of different species were clustered not around the longest day (21 June), nor around the warmest day (early August), but roughly midway between the two. This was not surprising if both daylength and temperature were the main factors influencing vegetation growth and bird food supplies. In general, species which arrived at Dungeness early in spring departed relatively late in autumn, and vice versa, but exceptions occurred. No species could arrive before its particular food became available in
Figure 7. Mean spring and autumn migration dates of various passerines at Dungeness shown separately for 11 short-distance migrants wintering within Europe (upper) and 15 long-distance migrants wintering in Africa south of the Sahara (lower). The mean spring and autumn dates for short-distance migrants were days 102 and 277 respectively, and for long-distance migrants days 128 and 245. Spring and autumn mean dates differed significantly between short-distance and long-distance migrants (spring: F1, 23 = 33.82, P < 0.001; autumn: F1, 24 = 57.98, P < 0.001). Histograms are based on five-day intervals (pentads), and overall means indicated by vertical dashed lines. Short-distance migrants included Skylark, Meadow Pipit, Grey Wagtail (autumn only), Pied/White Wagtail, Black Redstart, Stonechat, Ring Ouzel, Blackcap, Chiffchaff, Goldfinch and Linnet. Long-distance migrants included Sand Martin, Barn Swallow, House Martin, Tree Pipit, Yellow Wagtail, Common Redstart, Whinchat, Wheatear, Sedge Warbler, Reed Warbler, Lesser Whitethroat, Common Whitethroat, Garden Warbler, Willow Warbler and Spotted Flycatcher.
Figure 8. Daylength (hours) for London (solid line), mean daily Central England temperature 1990–2007 (ºC, dotted line) and distribution of mid dates between spring and autumn mean migration dates for 108 species at Dungeness.
Dow
nloa
ded
by [
Uni
vers
ity o
f N
ebra
ska,
Lin
coln
] at
16:
31 0
9 O
ctob
er 2
014

Migration seasons of birds at Dungeness 77
© 2010 British Trust for Ornithology, Ringing & Migration, 25, 71–87
spring, nor stay on longer than its food remained available in autumn. In fact, the presence of different summer-visiting species in Britain may have more or less coincided with the periods that their foods were most available here. Thus seed-eaters tended to arrive earlier and depart later than insectivores, and among the latter, hirundines feeding on aerial insects arrived earlier and departed later than the majority of warblers which depended on insects from developing leaves. However, it was also apparent that those species which wintered in sub-Saharan Africa arrived later and left earlier than those that wintered within Europe. Further work is needed to separate the roles of diet and migration distance in influencing the migration and residence periods of different migratory species in Britain, for almost certainly diet influences both wintering area and migration dates (Newton 2008).
The most accurate migration dates recorded here are likely to have derived from passage migrants: the 52 species that were seen at Dungeness only at migration times. The estimated mean migration dates for the remaining species were calculated as half-yearly means, so may have been affected to varying degrees by the numbers of birds seen outside migration seasons. Their effect is likely to have been trivial, however, because their numbers were very small compared to those counted within migration seasons. We judged this procedure the best for calculating mean migration dates from such count data, considering that the alternative would have entailed making separate subjective decisions on migration periods for each species.
The arrival and departure periods of land-bird migrants in Britain are well known to bird-watchers from their own observations, but the emphasis has generally been on first arrival and last departure dates because these are easiest to record (Lehikoinen et al 2004). Bird Observatory records provide some of the best available data on the seasonal patterns of migration from which mean or median dates and measures of spread can be calculated (Newton 2008). In future, the BirdTrack programme of the British Trust for Ornithology is likely to provide similar data for the whole of Britain, enabling the movements of different species through the country to be tracked each year (Baillie et al 2006). This should represent an improvement on site-specific data of the type we have analysed here.
Although the migration periods of land-bird migrants could be considered relatively well known, with records extending back many years, this is less true for seabirds, because systematic sea-watching is less common. As far as we are aware, the data presented here are the most extensive yet published for seabirds around Britain. Nevertheless, the patterns recorded at Dungeness seem broadly similar to those recorded elsewhere in southeast England. This is evident, for example, in the recent records from Holme
Bird Observatory on the North Norfolk coast (Cooke 2006), although not all species were well represented at both sites. As such records are assembled and analysed, it should become possible to build up a more complete picture of offshore seabird movements around Britain and Ireland.
Some of the bird-species that are generally regarded as resident within Britain were recorded as migrants at Dungeness. There were several reasons for this. First, some of the species that are resident in Britain appear at Dungeness as passage migrants or winter visitors from the continent. For some species this was evident not only from observations, but also from the plumage of trapped individuals. For example, almost all the Coal Tits trapped at Dungeness were of the continental race Periparus a. ater, rather than of the British race P. a. britannicus. Second, it is likely that many of the species regarded as resident in Britain are in fact partial migrants, with a small proportion of the British population undertaking regular migratory movements, as yet unsupported by ring recoveries. This may well account for the spring and autumn peaks at Dungeness of species such as Tree Sparrow and House Sparrow. Yet other species, such as Hobby and Tree Pipit, were recorded at Dungeness only as migrants even though they were nesting a few kilometres inland, there being little or no suitable habitat around Dungeness itself.
To our knowledge, no other study of migration seasons, as recorded at British Bird Observatories, has presented a comparative quantitative analysis of the data similar to ours. The main aim was to elucidate the patterns in migration dates across species at a particular well-studied site, and not to examine either geographical or temporal trends in migration dates. Nevertheless, previous published information indicate species-specific dates roughly similar to ours, but varying according to location and year, and with the spring arrival dates of many species having become earlier in recent years (Lehikoinen et al 2004). The earlier studies of migration dates recorded at British and Irish Bird Observatories, mentioned above, presented the data as histograms, showing the totals in five-day or 10-day periods through the year (or through most of the year), without giving means or standard deviations of seasonal peaks. Together with the difficulty of reading individual values from histogram axes, especially when plotted on a logarithmic scale, this makes it impossible to make meaningful comparisons with our data. In any case, assessing phenological time trends was not one of our aims, but it was evident that the status of several species at Dungeness has changed to some degree since 1974–78, the period considered by Riddiford & Findley (1981). For example, several species which were regular as migrants in 1974–78, such as Wryneck Jynx torquilla, Grasshopper
Dow
nloa
ded
by [
Uni
vers
ity o
f N
ebra
ska,
Lin
coln
] at
16:
31 0
9 O
ctob
er 2
014

78 I. Newton et al
© 2010 British Trust for Ornithology, Ringing & Migration, 25, 71–87
Warbler Locustella naevia, Wood Warbler Phylloscopus sibilatrix and Red-backed Shrike Lanius collurio, hardly occurred at all during 1990–2007, while the Black Redstart and Firecrest, seen only at migration times during 1974–78, were seen frequently in some summers and some winters respectively during 1990–2007, though no more than a few individuals at a time. Yet other species, such as Whinchat and Turtle Dove, were generally more abundant during 1974–78 than in 1990–2007, while others were much more often seen in summer during 1974–78 than in 1990–2007. These changes at Dungeness accord with known changes in the status of these species in Britain over the period concerned (www.bto.org/birdtrends/). The information collected over the decades at British Bird Observatories comprises some of the longest-running data sets available on the timing of bird migration, and would surely repay more detailed study.
ACKNOWLEDGEMENTSWe would like to thank all the Observatory personnel and visitors who contributed to this data set, and two anonymous referees for their helpful comments on the manuscript.
REFERENCES
Baillie, S.R., Balmer, D.E., Downie, I.S. & Wright, K.H.M. (2006) Migration watch: an internet survey to monitor spring migration in Britain and Ireland. Journal of Ornithology 147, 254–259.
Cooke, F. (2006) Sea watching at Holme Bird Observatory 2005. Norfolk Ornithologists’ Association Annual Report 2005, 61–66.
Cullen, J.P. & Jennings, P.P. (1986) Birds of the Isle of Man. Bridgeen Publications, Douglas.
Davis, P. (1967) Migration seasons of the Sylvia warblers at British Bird Observatories. Bird Study 14, 65–95.
Durman, R.F. (1976) Ring Ousel migration. Bird Study 23, 197–205.Dymond, J.N. (1980) The Birds of Lundy. Devon Birdwatching and
Preservation Society, Plymouth.Dymond, J.N. (1991) The Birds of Fair Isle. Fair Isle Bird
Observatory.Forrester, R.W. & Andrews, I.J. (2007) The Birds of Scotland. The
Scottish Ornithologists’ Club, Aberlady.Hope Jones, P. (1975) The migration of Redstarts through and from
Britain. Ringing & Migration 1, 12–17.Hope Jones, P., Mead, C.J. & Durman, R.F. (1977) The migration of
the Pied Flycatcher from and through Britain. Bird Study 24, 2–14.Insley, H. & Boswell, R.C. (1978) The timing of arrivals of Reed and
Sedge Warblers at south coast ringing sites during autumn passage. Ringing & Migration 2, 1–9.
Langslow, D.R. (1977) Movements of Black Redstarts between Britain and Europe in relation to occurrences at Observatories. Bird Study 24, 169–178.
Langslow, D.R. (1979) Movements of Blackcaps ringed in Britain and Ireland. Bird Study 26, 239–252.
Lehikoinen, E., Sparks, T.H. & Zalakevicius, M. (2004) Arrival and departure dates. Advances in Ecological Research 35, 1–31.
Newton, I. (2008) The Migration Ecology of Birds. Academic Press, London.
Preston, F.W. (1966) The mathematical representation of migration. Ecology 47, 375–392.
Riddiford, N. & Findley, P. (1981) Seasonal movements of summer migrants. BTO Guide 18. BTO, Tring.
Roberts, P. (1985) The Birds of Bardsey. Bardsey Bird and Field Observatory.
Scott, B., Cawkell, H. & Riddiford, N. (1976) Dungeness. In Bird Observatories in Britain and Ireland (ed R. Durman), pp 94–114. T. & A.D. Poyser, Berkhamsted.
Sharrock, J.T.R. (1973) The Natural History of Cape Clear Island. T. & A.D. Poyser, Berkhamsted.
(MS received 14 October 2009; accepted 19 January 2010)
Dow
nloa
ded
by [
Uni
vers
ity o
f N
ebra
ska,
Lin
coln
] at
16:
31 0
9 O
ctob
er 2
014

Migration seasons of birds at Dungeness 79
© 2010 British Trust for Ornithology, Ringing & Migration, 25, 71–87
A
B
C
D
E F
G
H
I J
K
L M
N
O
P
Q
R
S T
1.
Spri
ng a
nd/o
r autu
mn m
igra
tion p
eak
s, f
ew o
r no w
inte
r or
sum
mer
bir
ds
GRE
YLA
G G
OO
SE
18/1
3 21
2 49
22
10
6 6
18.5
4.
8 15
4 15
25
26
8 46
29
1 30
52
.9
3.1
307
38
185
Ans
er a
nser
C
AN
AD
A G
OO
SE
18/1
4 41
68
18
10
1 10
21
.0
3.8
139
21
30
256
22
257
22
48.6
0.
2 25
8 21
15
6 Br
anta
can
aden
sis
GA
DW
ALL
71
35
28
88
10
16.8
4.
9 13
3 16
64
25
9 32
29
7 21
57
.4
5.1
336
17
209
Ana
s str
eper
aPI
NTA
IL
266
21
21
75
12
15.4
3.
8 11
8 12
13
0 25
3 21
29
6 15
59
.6
4.1
338
17
222
Ana
s ac
uta
GA
RGA
NEY
18
/2
15
86
14
101
11
20.3
2.
9 12
2 16
1
Ana
s qu
erqu
edul
aBL
AC
K-TH
ROAT
ED D
IVER
96
27
34
111
5 23
.6
3.9
142
8 20
27
6 18
31
7 8
62.6
4.
0 34
7 12
20
6G
avia
arc
tica
SOO
TY S
HEA
RWAT
ER
4/18
0
47
247
19
277
11
55.1
3.
6 31
4 25
Puffi
nus
gris
eus
BALE
ARI
C S
HEA
RWAT
ER
9/15
15
18
21
3 22
23
8 13
44
.9
3.5
276
31Pu
ffinu
s m
aure
tani
cus
MA
RSH
HA
RRIE
R
5
18
22
3 13
25
8 9
51.1
4.
9 30
8 26
C
ircus
aer
ugin
osus
MER
LIN
40
17
16
81
7
14.9
5.
0 12
3 11
65
23
8 12
29
7 7
58.7
4.
9 35
2 12
21
6Fa
lco
colu
mba
rius
EURA
SIA
N H
OBB
Y
31
117
7 14
1 5
26.9
3.
1 17
0 10
16
20
5 24
25
3 14
48
.6
4.9
282
9 11
2Fa
lco
subb
uteo
PIED
AVO
CET
14
/10
31
84
21
103
15
16.3
3.
0 12
9 15
17
30
3 33
30
7 35
50
.8
0.5
310
37
204
Recu
rviro
stra
avos
etta
EURO
PEAN
GO
LDEN
PLO
VER
12
/18
6
73
23
3 24
27
5 19
55
.5
5.1
313
19Pl
uvia
lis a
pric
aria
BA
R-TA
ILED
GO
DW
IT
5,7
62
58
30
119
3 23
.8
1.4
143
11
230
229
28
259
24
51.4
3.
6 30
1 37
14
0Lim
osa
lapp
onic
aW
HIM
BREL
640
99
9 12
1 4
24.9
1.
6 14
9 13
46
19
6 11
22
9 9
46.3
3.
5 26
7 21
10
8N
umen
ius
phae
opus
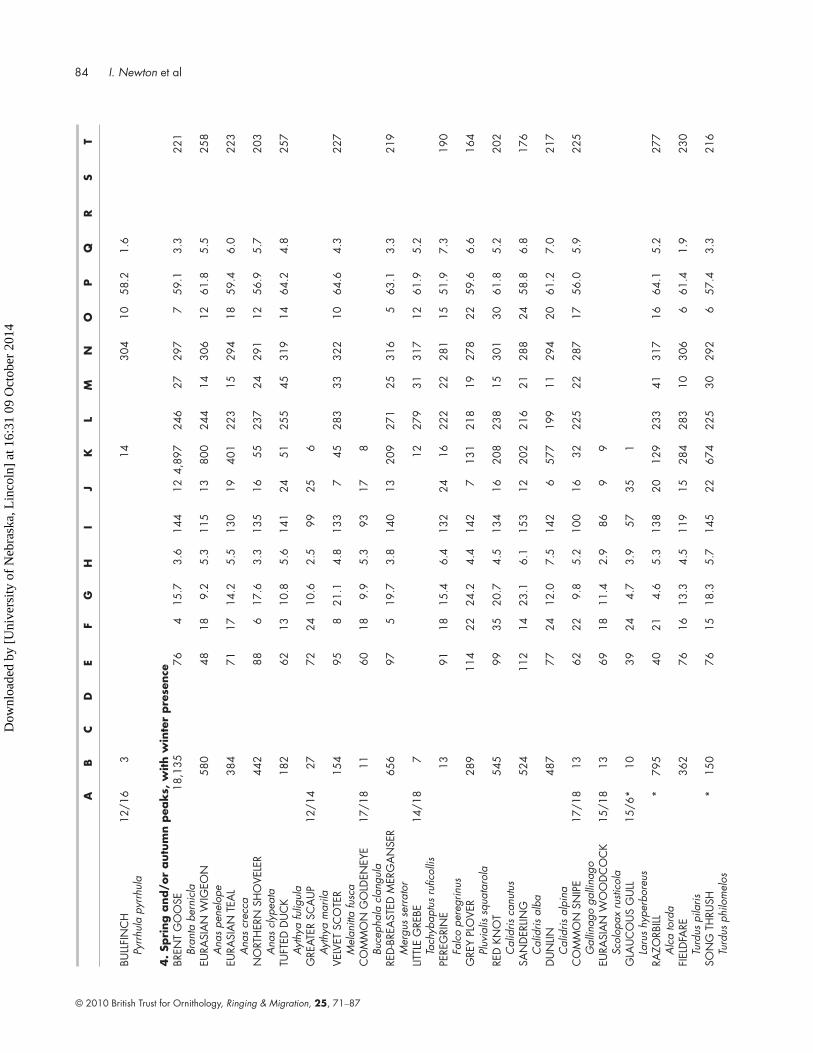
K:
Mea
n nu
mbe
r of b
irds
reco
rded
per
yea
r in
autu
mn
L:
Mea
n fir
st au
tum
n da
te (d
ay o
f yea
r)M
: SD
of p
revi
ous
colu
mn
N:
Mea
n av
erag
e au
tum
n da
te (d
ay o
f yea
r)O
: SD
of p
revi
ous
colu
mn
P:
Mea
n au
tum
n pe
ak p
enta
dQ
: M
ean
with
in-a
utum
n SD
(pen
tads
)R:
M
ean
last
autu
mn
date
(day
of y
ear)
S:
SD o
f pre
viou
s co
lum
nT:
D
iffer
ence
(day
s) b
etw
een
sprin
g an
d au
tum
n m
ean
date
s
A:
No.
of s
prin
g/au
tum
n ye
ars
of d
ata
(if n
ot 1
8/18
).
Spec
ies
mar
ked
by a
n as
teris
k ar
e ba
sed
on y
ears
199
2–20
07 (s
ee te
xt fo
r det
ails)
B:
Mea
n nu
mbe
r of b
irds
reco
rded
per
yea
r in
sprin
gC
: M
ean
first
sprin
g da
te (d
ay o
f yea
r) D
: SD
of p
revi
ous
colu
mn
E:
Mea
n av
erag
e sp
ring
date
(day
of y
ear)
F:
SD o
f pre
viou
s co
lum
nG
: M
ean
sprin
g pe
ak p
enta
dH
: M
ean
with
in-sp
ring
SD (p
enta
ds)
I:
Mea
n la
st sp
ring
date
(day
of y
ear)
J:
SD o
f pre
viou
s co
lum
n
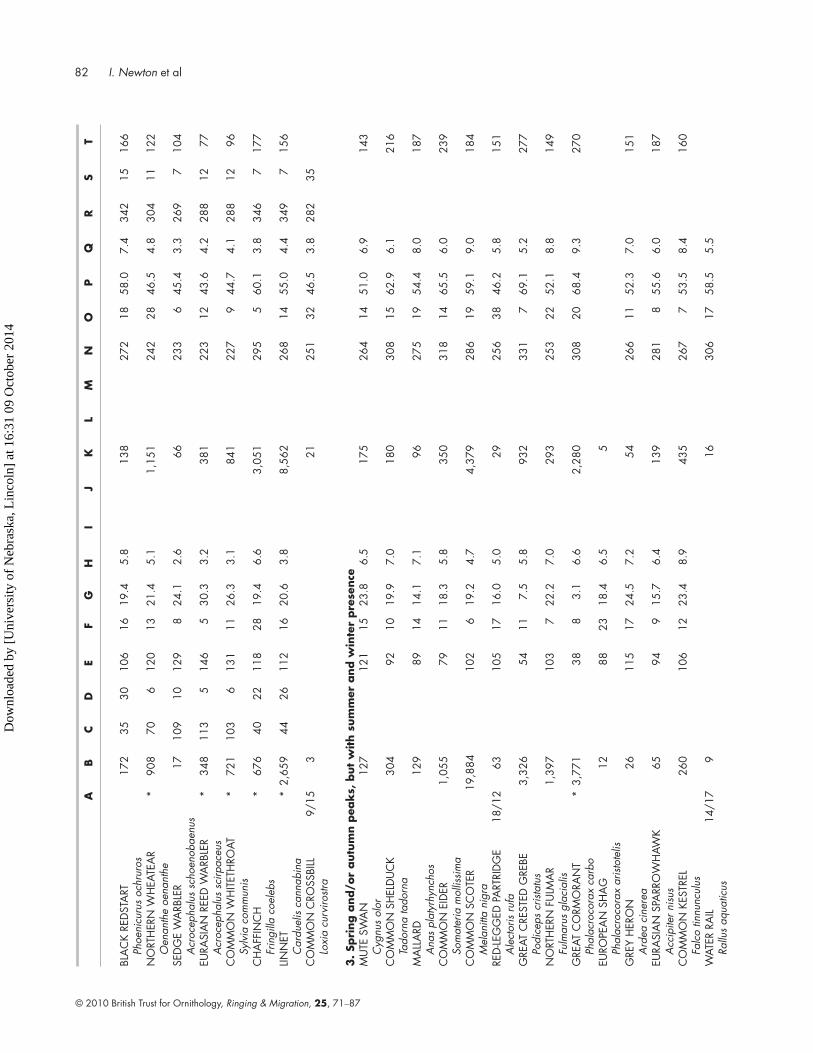
Appen
dix
1. A
sum
mar
y of
the
seve
n gr
oups
of b
irds
at D
unge
ness
Bird
Obs
erva
tory
199
0-–2
007.
Spe
cies
with
in g
roup
s ar
e ar
rang
ed in
taxo
nom
ic o
rder
.
Key
to c
olum
ns
Dow
nloa
ded
by [
Uni
vers
ity o
f N
ebra
ska,
Lin
coln
] at
16:
31 0
9 O
ctob
er 2
014

80 I. Newton et al
© 2010 British Trust for Ornithology, Ringing & Migration, 25, 71–87
CU
RLEW
302
27
19
95
8 19
.1
5.0
170
14
167
188
8 25
9 14
52
.4
6.2
332
17
165
Num
eniu
s ar
quat
aC
OM
MO
N S
AN
DPI
PER
9
13
196
12
224
8 44
.5
3.8
253
20
Act
itis
hypo
leuc
osC
OM
MO
N G
REEN
SHA
NK
17/1
6 4
15
209
16
235
10
46.4
3.
2 26
4 24
Tr
inga
neb
ular
iaPO
MA
RIN
E SK
UA
167
77
42
125
5 25
.6
1.8
142
6 19
23
8 23
27
5 25
53
.9
5.1
320
26
150
Ster
cora
rius
pom
arin
usA
RCTI
C S
KUA
273
63
36
119
2 23
.3
2.3
159
14
463
197
13
256
8 51
.3
4.0
323
19
137
Ster
cora
rius
para
sitic
usG
REAT
SKU
A
98
26
37
10
5 11
21
.6
4.7
153
17
120
210
18
273
11
54.4
5.
1 34
2 16
16
8St
erco
rariu
s sk
uaYE
LLO
W-LE
GG
ED G
ULL
11
/11*
16
31
51
12
0 30
10
.8
10.6
17
7 9
134
183
1 23
2 9
40.7
7.
3 34
9 15
11
2La
rus
mic
hahe
llis
BLA
CK
TERN
199
110
4 13
0 5
25.9
1.
9 16
3 15
1,1
20
197
12
241
7 49
.0
2.5
281
19
112
Chl
idon
ias
nige
rC
OM
MO
N K
ING
FISH
ER
5/18
1
15
228
25
273
19
48.7
5.
7 31
0 35
A
lced
o at
this
GRE
AT S
POTT
ED W
OO
DPEC
KER
17/1
7 11
19
21
55
18
6.
9 4.
9 90
29
89
20
6 15
27
8 12
53
.7
6.8
348
14
223
Den
droc
opos
maj
orH
OU
SE M
ART
IN
23
1 10
5 9
138
5 27
.6
2.5
172
9 21
,435
19
7 12
26
6 5
53.4
1.
7 30
8 7
128
Del
icho
n ur
bicu
mTR
EE P
IPIT
21
101
8 11
9 6
23.9
1.
1 13
7 10
14
4 22
0 9
254
8 51
.7
2.9
284
8 13
5A
nthu
s tri
vial
isRO
CK
PIPI
T 17
/18
6
56
26
4 21
29
3 5
58.6
2.
6 32
5 11
A
nthu
s pe
trosu
s YE
LLO
W W
AG
TAIL
15
7 97
7
121
3 24
.5
2.2
166
15 1
,828
18
8 8
240
3 48
.5
2.8
285
9 11
8M
otac
illa
flava
G
REY
WA
GTA
IL
7
14
7 21
3 21
26
7 4
53.4
3.
2 30
8 12
M
otac
illa
cine
rea
PIED
/WH
ITE
WA
GTA
IL
16/1
5 97
68
9
87
6 15
.2
2.5
127
18
474
233
25
285
4 53
.9
2.8
323
7 19
8M
otac
illa
alba
C
OM
MO
N R
EDST
ART
25
100
9 11
5 7
22.6
2.
0 13
4 11
87
22
1 16
25
8 6
51.8
3.
0 28
9 8
143
Phoe
nicu
rus
phoe
nicu
rus
WH
INC
HAT
16
116
6 12
6 5
24.9
1.
5 13
9 9
143
219
11
251
5 50
.2
2.7
289
14
125
Saxi
cola
rube
tra
RIN
G O
UZE
L
14
90
22
109
10
21.3
2.
0 12
3 13
11
2 26
4 16
28
3 15
56
.9
1.7
305
9 17
4Tu
rdus
torq
uatu
s BL
AC
KCA
P
52
82
30
118
7 23
.8
2.8
149
14
196
217
24
274
6 55
.4
3.6
333
17
157
Sylv
ia a
trica
pilla
G
ARD
EN W
ARB
LER
31
11
8 7
132
6 26
.0
2.0
149
11
50
215
12
245
14
47.7
4.
0 29
2 10
11
3Sy
lvia
bor
in
LESS
ER W
HIT
ETH
ROAT
66
115
5 13
4 6
25.4
3.
0 17
0 12
28
7 19
8 18
24
6 6
49.7
3.
4 28
7 17
11
1Sy
lvia
cur
ruca
C
HIF
FCH
AFF
557
11
18
102
8 19
.8
5.0
173
9 1,
528
197
20
276
3 54
.5
3.7
356
7 17
5Ph
yllo
scop
us c
olly
bita
A
B
C
D
E F
G
H
I J
K
L M
N
O
P
Q
R
S T
Dow
nloa
ded
by [
Uni
vers
ity o
f N
ebra
ska,
Lin
coln
] at
16:
31 0
9 O
ctob
er 2
014

Migration seasons of birds at Dungeness 81
© 2010 British Trust for Ornithology, Ringing & Migration, 25, 71–87
WILL
OW
WA
RBLE
R
521
88
4 11
4 6
22.9
2.
4 16
0 12
1,1
49
199
8 23
4 4
46.8
2.
7 28
7 15
11
9Ph
yllo
scop
us tr
ochi
lus
SPO
TTED
FLY
CAT
CH
ER
31
12
4 7
139
4 27
.8
1.7
156
9 52
23
0 5
253
5 50
.3
2.5
277
10
114
Mus
cica
pa s
triat
a PI
ED F
LYC
ATC
HER
5
48
22
0 7
244
7 49
.1
2.7
271
15
Fice
dula
hyp
oleu
ca
CO
AL
TIT
10/1
2 4
74
276
15
286
12
50.4
1.
6 30
2 13
Pe
ripar
us a
ter
JAY
12/5
19
12
7 15
13
5 11
18
.4
1.7
146
17
2
G
arru
lus
glan
dariu
s JA
CKD
AW
20
4 64
15
11
4 11
22
.7
5.0
161
9 28
9 24
2 22
29
1 7
59.9
2.
9 32
0 14
17
6C
orvu
s m
oned
ula
ROO
K
59
59
21
102
10
20.1
4.
8 15
1 18
89
23
5 30
28
3 9
56.1
3.
2 31
3 13
18
1C
orvu
s fru
gile
gus
TREE
SPA
RRO
W
47
91
37
12
4 14
24
.8
3.0
146
16
416
222
22
285
7 58
.3
3.8
318
7 16
1Pa
sser
mon
tanu
s BR
AM
BLIN
G
17/1
8 16
73
20
97
7
16.9
3.
0 11
9 14
33
0 27
3 7
299
6 59
.7
2.2
332
13
202
Frin
gilla
mon
tifrin
gilla
G
OLD
FIN
CH
*
587
15
20
119
5 23
.4
3.5
172
10 1
0,16
7 19
3 16
28
8 3
58.1
2.
5 35
4 8
169
Car
duel
is c
ardu
elis
SI
SKIN
66
37
27
82
19
15.6
4.
3 13
9 29
2,5
17
236
34
290
7 57
.6
3.0
344
17
209
Car
duel
is s
pinu
s RE
DPO
LL
13/1
2 12
76
30
10
8 13
16
.2
3.0
126
17
667
248
31
300
8 52
.7
2.6
337
11
192
Car
duel
is c
abar
et/fl
amm
ea
REED
BU
NTI
NG
*
571
32
21
119
9 18
.5
6.4
179
5 71
9 18
5 7
266
23
56.1
6.
0 34
0 11
14
7Em
beriz
a sc
hoen
iclu
s C
ORN
BU
NTI
NG
18
/17
115
94
36
133
17
27.2
2.
9 15
7 10
9
Embe
riza
cala
ndra
2.
Spri
ng a
nd/o
r autu
mn m
igra
tion p
eak
s, w
ith s
um
mer
pre
sence
LIT
TLE
TERN
542
104
5 12
5 3
25.1
1.
8
77
23
4 13
47
.9
3.9
267
15
109
Ster
nula
alb
ifron
sSA
ND
WIC
H T
ERN
*
7,17
5 64
15
11
6 5
21.8
3.
4
3,9
50
237
13
50.2
4.
8 31
4 20
12
1St
erna
san
dvic
ensi
sC
OM
MO
N T
ERN
* 1
5,19
4 89
5
132
8 25
.3
3.1
13
,773
23
1 8
48.1
4.
5 30
1 10
99
Ster
na h
irund
oA
RCTI
C T
ERN
*
586
98
25
121
7 24
.3
2.1
410
258
8 52
.3
4.1
305
19
137
Ster
na p
arad
isae
aEU
RASI
AN
CO
LLA
RED
DO
VE
48
52
25
12
0 7
25.3
5.
4
46
27
2 9
55.7
6.
1 31
5 12
15
1St
rept
opel
ia d
ecao
cto
EURO
PEA
N T
URT
LE D
OVE
60
117
14
141
7 28
.2
2.7
30
243
13
47.8
4.
2 27
7 12
10
2St
rept
opel
ia tu
rtur
SAN
D M
ART
IN
93
87
13
12
6 12
23
.9
4.1
14
,033
23
8 8
48.3
3.
2 28
9 12
11
2Ri
paria
ripa
riaSW
ALL
OW
2
,263
90
5
132
3 26
.7
2.9
55
,810
26
2 4
53.1
2.
7 31
8 8
130
Hiru
ndo
rusti
ca
A
B
C
D
E F
G
H
I J
K
L M
N
O
P
Q
R
S T
Dow
nloa
ded
by [
Uni
vers
ity o
f N
ebra
ska,
Lin
coln
] at
16:
31 0
9 O
ctob
er 2
014
82 I. Newton et al
© 2010 British Trust for Ornithology, Ringing & Migration, 25, 71–87
BLA
CK
RED
STA
RT
17
2 35
30
10
6 16
19
.4
5.8
138
272
18
58.0
7.
4 34
2 15
16
6Ph
oeni
curu
s oc
hrur
os
NO
RTH
ERN
WH
EATE
AR
* 90
8 70
6
120
13
21.4
5.
1
1,1
51
242
28
46.5
4.
8 30
4 11
12
2O
enan
the
oena
nthe
SED
GE
WA
RBLE
R
17
109
10
129
8 24
.1
2.6
66
233
6 45
.4
3.3
269
7 10
4A
croc
epha
lus
scho
enob
aenu
sEU
RASI
AN
REE
D W
ARB
LER
* 34
8 11
3 5
146
5 30
.3
3.2
381
223
12
43.6
4.
2 28
8 12
77
Acr
ocep
halu
s sc
irpac
eus
CO
MM
ON
WH
ITET
HRO
AT
* 72
1 10
3 6
131
11
26.3
3.
1
84
1
22
7 9
44.7
4.
1 28
8 12
96
Sylv
ia c
omm
unis
CH
AFF
INC
H
* 67
6 40
22
11
8 28
19
.4
6.6
3
,051
29
5 5
60.1
3.
8 34
6 7
177
Frin
gilla
coe
lebs
LINN
ET
* 2,
659
44
26
112
16
20.6
3.
8
8,5
62
268
14
55.0
4.
4 34
9 7
156
Car
duel
is c
anna
bina
C
OM
MO
N C
ROSS
BILL
9/
15
3
21
25
1 32
46
.5
3.8
282
35
Loxi
a cu
rviro
stra
3.
Spri
ng a
nd/o
r autu
mn p
eak
s, b
ut
with s
um
mer
and w
inte
r pre
sence
M
UTE
SW
AN
127
121
15
23.8
6.
5
17
5
26
4 14
51
.0
6.9
143
Cyg
nus
olor
CO
MM
ON
SH
ELD
UC
K
304
92
10
19.9
7.
0
18
0
30
8 15
62
.9
6.1
216
Tado
rna
tado
rna
MA
LLA
RD
12
9
89
14
14
.1
7.1
96
275
19
54.4
8.
0
18
7A
nas
plat
yrhy
ncho
sC
OM
MO
N E
IDER
1
,055
79
11
18
.3
5.8
350
318
14
65.5
6.
0
23
9So
mat
eria
mol
lissi
ma
CO
MM
ON
SC
OTE
R 19
,884
10
2 6
19.2
4.
7
4,3
79
286
19
59.1
9.
0
18
4M
elan
itta
nigr
aRE
D-LE
GG
ED P
ART
RID
GE
18/1
2 63
10
5 17
16
.0
5.0
29
256
38
46.2
5.
8
15
1A
lect
oris
rufa
GRE
AT C
REST
ED G
REBE
3
,326
54
11
7.
5 5.
8
93
2
33
1 7
69.1
5.
2
27
7Po
dice
ps c
rista
tus
NO
RTH
ERN
FU
LMA
R 1
,397
10
3 7
22.2
7.
0
29
3
25
3 22
52
.1
8.8
149
Fulm
arus
gla
cial
isG
REAT
CO
RMO
RAN
T *
3,77
1
38
8
3.1
6.6
2
,280
30
8 20
68
.4
9.3
270
Phal
acro
cora
x ca
rbo
EURO
PEA
N S
HA
G
12
88
23
18
.4
6.5
5
Ph
alac
roco
rax
aris
tote
lisG
REY
HER
ON
26
115
17
24.5
7.
2
54
26
6 11
52
.3
7.0
151
Ard
ea c
iner
eaEU
RASI
AN
SPA
RRO
WH
AWK
65
94
9
15.7
6.
4
13
9
28
1 8
55.6
6.
0
18
7A
ccip
iter n
isus
CO
MM
ON
KES
TREL
260
106
12
23.4
8.
9
43
5
26
7 7
53.5
8.
4
16
0Fa
lco
tinnu
ncul
usW
ATER
RA
IL 14
/17
9
16
30
6 17
58
.5
5.5
Rallu
s aq
uatic
us
A
B
C
D
E F
G
H
I J
K
L M
N
O
P
Q
R
S T
Dow
nloa
ded
by [
Uni
vers
ity o
f N
ebra
ska,
Lin
coln
] at
16:
31 0
9 O
ctob
er 2
014

Migration seasons of birds at Dungeness 83
© 2010 British Trust for Ornithology, Ringing & Migration, 25, 71–87
CO
MM
ON
MO
ORH
EN
17
2
89
19
14
.2
8.4
276
277
15
55.9
8.
3
18
8G
allin
ula
chlo
ropu
sC
OM
MO
N C
OO
T *
1,35
0
83
19
5.
3 9.
1
1,5
23
287
23
63.7
9.
1
20
4Fu
lica
atra
EURA
SIA
N O
YSTE
RCAT
CH
ER
* 1,
015
100
13
17.9
7.
1
43
1
27
9 28
59
.4
9.6
179
Hae
mat
opus
ostr
aleg
usRI
NG
ED P
LOVE
R
49
114
15
21.4
6.
2
62
23
9 10
48
.3
4.6
125
Cha
radr
ius
hiat
icul
aC
OM
MO
N R
EDSH
AN
K
19
114
22
23.3
4.
9
9
Trin
ga to
tanu
sLIT
TLE
GU
LL
55
2
10
3 19
21
.1
4.8
1
,332
27
8 13
58
.5
5.3
176
Hyd
roco
loeu
s m
inut
usLE
SSER
BLA
CK-
BAC
KED
GU
LL
* 61
6
88
28
17
.3
10.1
1,0
22
258
24
48.1
9.
0
17
0La
rus
fusc
usST
OC
K D
OVE
176
119
18
21.6
7.
4
1,1
52
296
13
62.0
5.
1
17
7C
olum
ba li
via
CO
MM
ON
WO
OD
PIG
EON
*
3,85
4
11
3 14
20
.0
5.4
4
,076
27
7 23
57
.5
6.3
165
Col
umba
pal
umbu
sG
REEN
WO
OD
PEC
KER
95
77
30
7.
9 7.
5
19
3
27
1 13
51
.6
7.9
194
Picu
s vi
ridis
SKYL
ARK
*
483
97
28
14.5
7.
2
1,3
15
282
29
61.3
5.
9
18
5A
laud
a ar
vens
isM
EAD
OW
PIP
IT
* 1,
602
88
8 16
.6
5.0
7
,481
27
1 2
54.0
4.
1
18
3A
nthu
s pr
aten
sis
WIN
TER
WRE
N
* 26
2
68
27
13
.5
6.3
613
297
18
59.7
6.
2
22
9Tr
oglo
dyte
s tro
glod
ytes
DU
NN
OC
K *
456
83
31
16.6
7.
5
45
5
27
3 16
53
.8
7.8
191
Prun
ella
mod
ular
isEU
ROPE
AN
RO
BIN
*
247
65
14
10.9
6.
9
1,6
05
293
14
58.8
5.
4
22
8Er
ithac
us ru
becu
laST
ON
ECH
AT
11
4
78
29
13
.8
5.9
221
282
18
56.3
5.
6
20
4Sa
xico
la to
rqua
tus
BLA
CKB
IRD
*
811
88
15
14.3
8.
0
1,6
19
295
20
60.4
6.
4
20
7Tu
rdus
mer
ula
BLU
E TI
T *
458
74
29
10.7
8.
3
78
8
27
9 15
56
.5
8.2
204
Cya
niste
s ca
erul
eus
GRE
AT T
IT
* 44
1
99
9
18.3
8.
1
62
3
27
0 14
51
.8
8.6
171
Paru
s m
ajor
MA
GPI
E *
503
79
11
12.9
8.
4
36
0
28
0 16
55
.8
9.3
200
Pica
pic
aC
ARR
ION
CRO
W
* 96
3
89
8
19.3
7.
3
65
2
28
4 14
58
.7
7.9
195
Cor
vus
coro
neC
OM
MO
N S
TARL
ING
* 1
1,70
4
10
0 20
22
.4
9.7
36
,582
28
8 33
61
.0
7.9
187
Stur
nus
vulg
aris
HO
USE
SPA
RRO
W
* 40
0
88
15
16
.2
9.2
613
272
17
54.6
7.
9
18
4Pa
sser
dom
estic
us
A
B
C
D
E F
G
H
I J
K
L M
N
O
P
Q
R
S T
Dow
nloa
ded
by [
Uni
vers
ity o
f N
ebra
ska,
Lin
coln
] at
16:
31 0
9 O
ctob
er 2
014
84 I. Newton et al
© 2010 British Trust for Ornithology, Ringing & Migration, 25, 71–87
BULL
FIN
CH
12
/16
3
14
30
4 10
58
.2
1.6
Pyrr
hula
pyr
rhul
a
4.
Spri
ng a
nd/o
r autu
mn p
eak
s, w
ith w
inte
r pre
sence
BR
ENT
GO
OSE
18
,135
76
4
15.7
3.
6 14
4 12
4,8
97
246
27
297
7 59
.1
3.3
221
Bran
ta b
erni
cla
EURA
SIA
N W
IGEO
N
58
0
48
18
9.
2 5.
3 11
5 13
80
0 24
4 14
30
6 12
61
.8
5.5
258
Ana
s pe
nelo
peEU
RASI
AN
TEA
L
384
71
17
14.2
5.
5 13
0 19
40
1 22
3 15
29
4 18
59
.4
6.0
223
Ana
s cr
ecca
NO
RTH
ERN
SH
OVE
LER
44
2
88
6
17.6
3.
3 13
5 16
55
23
7 24
29
1 12
56
.9
5.7
203
Ana
s cl
ypea
taTU
FTED
DU
CK
18
2
62
13
10
.8
5.6
141
24
51
255
45
319
14
64.2
4.
8
25
7A
ythy
a fu
ligul
aG
REAT
ER S
CA
UP
12/1
4 27
72
24
10
.6
2.5
99
25
6
A
ythy
a m
arila
VELV
ET S
CO
TER
15
4
95
8
21.1
4.
8 13
3 7
45
283
33
322
10
64.6
4.
3
22
7M
elan
itta
fusc
aC
OM
MO
N G
OLD
ENEY
E
17/1
8 11
60
18
9.
9 5.
3 93
17
8
Buce
phal
a cl
angu
laRE
D-B
REA
STED
MER
GA
NSE
R
656
97
5 19
.7
3.8
140
13
209
271
25
316
5 63
.1
3.3
219
Mer
gus
serr
ator
LITTL
E G
REBE
14
/18
7
12
27
9 31
31
7 12
61
.9
5.2
Tach
ybap
tus
rufic
ollis
PE
REG
RIN
E
13
91
18
15.4
6.
4 13
2 24
16
22
2 22
28
1 15
51
.9
7.3
190
Falc
o pe
regr
inus
GRE
Y PL
OVE
R
289
114
22
24.2
4.
4 14
2 7
131
218
19
278
22
59.6
6.
6
16
4Pl
uvia
lis s
quat
arol
aRE
D K
NO
T
545
99
35
20.7
4.
5 13
4 16
20
8 23
8 15
30
1 30
61
.8
5.2
202
Cal
idris
can
utus
SAN
DER
LING
524
112
14
23.1
6.
1 15
3 12
20
2 21
6 21
28
8 24
58
.8
6.8
176
Cal
idris
alb
aD
UN
LIN
48
7
77
24
12
.0
7.5
142
6 57
7 19
9 11
29
4 20
61
.2
7.0
217
Cal
idris
alp
ina
CO
MM
ON
SN
IPE
17/1
8 13
62
22
9.
8 5.
2 10
0 16
32
22
5 22
28
7 17
56
.0
5.9
225
Gal
linag
o ga
llina
goEU
RASI
AN
WO
OD
CO
CK
15/1
8 13
69
18
11
.4
2.9
86
9 9
Scol
opax
rusti
cola
G
LAU
CO
US
GU
LL
15/6
* 10
39
24
4.
7 3.
9 57
35
1
Laru
s hy
perb
oreu
s RA
ZORB
ILL
* 79
5
40
21
4.
6 5.
3 13
8 20
12
9 23
3 41
31
7 16
64
.1
5.2
277
Alc
a to
rda
FIEL
DFA
RE
36
2
76
16
13
.3
4.5
119
15
284
283
10
306
6 61
.4
1.9
230
Turd
us p
ilaris
SON
G T
HRU
SH
* 15
0
76
15
18
.3
5.7
145
22
674
225
30
292
6 57
.4
3.3
216
Turd
us p
hilo
mel
os
A
B
C
D
E F
G
H
I J
K
L M
N
O
P
Q
R
S T
Dow
nloa
ded
by [
Uni
vers
ity o
f N
ebra
ska,
Lin
coln
] at
16:
31 0
9 O
ctob
er 2
014

Migration seasons of birds at Dungeness 85
© 2010 British Trust for Ornithology, Ringing & Migration, 25, 71–87
RED
WIN
G
* 68
6
77
9
15.2
2.
8 11
9 19
93
5 27
3 8
293
19
58.9
2.
8
21
6Tu
rdus
ilia
cus
GO
LDC
REST
*
314
61
21
15.1
5.
0 11
8 18
1,4
16
246
15
298
10
59.8
3.
7
23
7Re
gulu
s re
gulu
sFI
REC
REST
105
68
15
13.4
5.
3 12
9 14
23
1 25
4 12
29
7 13
57
.8
4.3
229
Regu
lus
igni
capi
llaLO
NG
-TAILE
D T
IT
12/1
0 32
50
28
6.
9 2.
5 70
28
49
30
2 11
31
9 12
51
.5
2.6
269
Aeg
ithal
os c
auda
tus
GRE
ENFI
NC
H
* 97
7
37
22
2.
6 6.
6 16
3 17
7,7
36
210
22
319
39
59.9
3.
9
28
2C
ardu
elis
chl
oris
5.
Win
ter
pre
sence
, m
igra
tion p
eak
s not
dis
cern
ible
PO
CH
ARD
17
/15
22
89
31
25
280
35
Ayt
hya
ferin
aRE
D-T
HRO
ATED
DIV
ER
5,8
40
146
8 2,
069
252
31
Gav
ia s
tella
ta
TURN
STO
NE
60
2
14
2 11
74
6 21
1 12
A
rena
ria in
terp
res
ICEL
AN
D G
ULL
12
/2
10
95
44
0
La
rus
glau
coid
esC
OM
MO
N G
UILL
EMO
T * 1
2,29
2
17
0 13
2,7
72
195
21
Uria
aal
geLIT
TLE
AU
K 3/
17
0
36
29
8 22
A
lle a
lle
6.
Sum
mer
pre
sence
, m
igra
tion p
eak
s not
dis
cern
ible
MA
NX
SHEA
RWAT
ER
18/1
7 14
0 99
25
60
28
9 37
Pu
ffinu
s pu
ffinu
sM
EDIT
ERRA
NEA
N G
ULL
275
7 11
20
7
35
3 14
La
rus
mel
anoc
epha
lus
ROSE
ATE
TERN
15
/18
9
13
24
3 28
St
erna
dou
galli
iC
OM
MO
N C
UC
KOO
106
113
6
41
25
0 15
C
ucul
us c
anor
usSW
IFT
4,2
25
116
3
4,3
44
267
19
Apu
s ap
usW
OO
DLA
RK
12/1
8 2
15
333
17
Lullu
la a
rbor
eaM
ISTL
E TH
RUSH
33
42
33
78
325
17
Turd
us v
isci
voru
sYE
LLO
WH
AM
MER
*
429
49
24
210
317
21
Embe
riza
citri
nella
A
B
C
D
E F
G
H
I J
K
L M
N
O
P
Q
R
S T
Dow
nloa
ded
by [
Uni
vers
ity o
f N
ebra
ska,
Lin
coln
] at
16:
31 0
9 O
ctob
er 2
014

86 I. Newton et al
© 2010 British Trust for Ornithology, Ringing & Migration, 25, 71–87
1.
Spri
ng a
nd a
utu
mn m
igra
tion,
few
or
no w
inte
r or
sum
mer
bir
ds
SOO
TY S
HEA
RWAT
ER
4/18
0.
0
0.
1 24
6 17
27
5 11
55
.0
5.9
312
26
BALE
ARI
C S
HEA
RWAT
ER
9/15
<0
.1
<0.1
21
6 23
23
3 18
45
.4
6.1
272
18
BLA
CK-
THRO
ATED
DIV
ER
0.
1 31
39
10
2 16
21
.5
6.8
137
14
0.1
291
28
325
13
66.0
3.
0 34
4 17
22
3PO
MA
RIN
E SK
UA
0.1
82
42
117
27
24.2
2.
7 13
3 27
<0
.1
254
30
279
26
56.6
4.
4 31
0 31
16
2A
RCTI
C S
KUA
0.3
59
38
115
20
22.4
3.
8 14
8 21
1.
0 21
4 24
25
8 12
50
.8
4.0
317
25
142
GRE
AT S
KUA
0.1
23
36
95
21
19.1
7.
6 14
0 19
0.
2 22
9 37
27
8 28
55
.0
5.9
343
15
184
YELL
OW
-LEG
GED
GU
LL
11/1
1*
<0.1
10
9
73
35
20.0
13
.0
139
44
0.3
227
51
268
43
50.5
6.
5 34
8 17
19
5BL
AC
K TE
RN
0.
2 11
1 6
132
7 27
.6
2.9
147
13
1.5
219
19
247
10
49.7
2.
9 27
7 19
11
5
2.
Spri
ng a
nd a
utu
mn m
igra
tion p
eak
s, w
ith s
um
mer
pre
sence
LIT
TLE
TERN
0.5
106
7 12
7 4
26.6
2.
7
0.
1
23
9 17
48
.1
3.6
263
16
112
SAN
DW
ICH
TER
N
* 12
.6
71
10
116
11
23.9
4.
0
9.
3
24
7 14
48
.0
3.5
307
24
131
ARC
TIC
TER
N
* 0.
5 97
28
12
3 7
25.7
2.
9
1.
0
25
9 13
53
.1
3.7
298
26
136
3.S
pri
ng a
nd a
utu
mn m
igra
tion p
eak
s, b
ut
with s
um
mer
and w
inte
r pre
sence
C
OM
MO
N E
IDER
2.3
63
18
14.7
7.
2
1.
3
32
6 18
66
.5
5.5
263
CO
MM
ON
SC
OTE
R
25.0
94
17
18
.4
6.1
20.3
29
9 36
62
.3
7.9
205
GRE
AT C
REST
ED G
REBE
24.4
51
16
9.
1 5.
6
9.
1
34
0 6
69.3
4.
6
28
9LIT
TLE
GU
LL
0.
6
87
33
17
.7
6.8
2.4
283
26
57.4
5.
0
19
6LE
SSER
BLA
CK-
BAC
KED
GU
LL
* 2.
4
65
28
14
.1
8.1
3.2
279
31
53.1
8.
4
21
4
Appen
dix
2. A
sum
mar
y of
the
seab
irds
obse
rved
dur
ing
dedi
cate
d w
atch
es a
t Dun
gene
ss B
ird O
bser
vato
ry 1
990–
2007
. All
statis
tics
have
bee
n ba
sed
on b
irds
coun
ted
divi
ded
by
the
reco
rded
dur
atio
n of
sea
-wat
chin
g. S
peci
es w
ithin
gro
ups
are
arra
nged
in ta
xono
mic
ord
er. S
cien
tific
nam
es o
f spe
cies
and
a k
ey to
col
umns
are
giv
en in
App
endi
x 1.
7.
No d
isce
rnib
le p
att
ern,
pre
sent
all
yea
r G
AN
NET
*
7,89
4
11,5
62
Mor
us b
assa
nus
LAPW
ING
300
264
Vane
llus
vane
llus
BLA
CK-
LEG
GED
KIT
TIW
AKE
* 1
7,91
2
6,7
33Ri
ssa
trida
ctyl
aBL
AC
K-H
EAD
ED G
ULL
* 3
9,45
7
17,2
30
Chr
oico
ceph
alus
ridi
bund
usC
OM
MO
N G
ULL
* 1
5,52
5
3,0
47
Laru
s ca
nus
HER
RIN
G G
ULL
* 5
7,21
1
22,5
85
Laru
s ar
gent
atus
GRE
AT B
LAC
K-BA
CKE
D G
ULL
*
1352
9
10,5
15
Laru
s m
arin
usPI
ED W
AG
TAIL
45
4
64
0
M
otac
illa
alba
A
B
C
D
E F
G
H
I J
K
L M
N
O
P
Q
R
S T
A
B
C
D
E F
G
H
I J
K
L M
N
O
P
Q
R
S T
Dow
nloa
ded
by [
Uni
vers
ity o
f N
ebra
ska,
Lin
coln
] at
16:
31 0
9 O
ctob
er 2
014

Migration seasons of birds at Dungeness 87
© 2010 British Trust for Ornithology, Ringing & Migration, 25, 71–87
4.
Spri
ng a
nd a
utu
mn m
igra
tion p
eak
s, w
ith w
inte
r pre
sence
VE
LVET
SC
OTE
R
0.2
81
19
17.9
7.
5 12
9 14
0.
2 30
1 42
33
3 14
67
.3
8.3
251
RED
-BRE
AST
ED M
ERG
AN
SER
0.
8
88
11
20
.1
5.7
136
19
0.6
278
36
322
16
64.1
3.
3
23
4LIT
TLE
GRE
BE
14/1
8 <0
.1
0.1
290
35
324
17
64.5
5.
2
RA
ZORB
ILL
* 2.
2
33
18
5.
9 5.
6 12
9 19
0.
5 25
4 46
32
0 15
65
.7
6.4
287
5.
Win
ter
pre
sence
, m
igra
tion p
eak
s not
dis
cern
ible
SC
AU
P 12
/14
<0.1
93
30
<0
.1
CO
MM
ON
GO
LDEN
EYE
17
/18
<0.1
92
19
<0
.1
RED
-TH
ROAT
ED D
IVER
22.1
13
7 26
13
.9
274
29
EURO
PEA
N S
HA
G
<0
.1
115
35
<0.1
IC
ELA
ND
GU
LL
12/2
<0
.1
96
39
0.0
GLA
UC
OU
S G
ULL
15
/6*
<0.1
64
37
<0
.1
CO
MM
ON
GU
ILLEM
OT
* 53
.3
147
33
9.1
225
42
LITTL
E A
UK
3/17
0.
0
<0
.1
303
26
6.
Sum
mer
pre
sence
, m
igra
tion p
eak
s not
dis
cern
ible
M
AN
X SH
EARW
ATER
18
/17
0.2
108
10
0.1
281
27
MED
ITER
RAN
EAN
GU
LL
0.
5 10
16
0.
4
34
9 14
C
OM
MO
N T
ERN
*
22.4
89
4
35.6
29
5 17
RO
SEAT
E TE
RN
15/1
8 <0
.1
<0.1
25
4 25
7.
No d
isce
rnib
le p
att
ern,
pre
sent
all
yea
r N
ORT
HER
N F
ULM
AR
2.
5
0.
9
N
ORT
HER
N G
AN
NET
*
18.4
44
.6
GRE
AT C
ORM
ORA
NT
* 17
.2
16.2
BL
AC
K-LE
GG
ED K
ITTI
WA
KE
* 58
.3
30.2
BLA
CK-
HEA
DED
GU
LL
* 14
1.2
1
04.6
C
OM
MO
N G
ULL
*
54.8
17
.7
HER
RIN
G G
ULL
*
228.
0
125
.4
GRE
AT B
LAC
K-BA
CKE
D G
ULL
*
54.8
48
.6
A
B
C
D
E F
G
H
I J
K
L M
N
O
P
Q
R
S T
Dow
nloa
ded
by [
Uni
vers
ity o
f N
ebra
ska,
Lin
coln
] at
16:
31 0
9 O
ctob
er 2
014