Embed Size (px)
Citation preview

THE MILITARIZATION OF POLICE’S EYES, EARS, AND HANDS:
THE 1033 DEPARTMENT OF DEFENSE PROGRAM AND POLICE SAFETY OUTCOMES
A Thesis
submitted to the Faculty of the
Graduate School of Arts and Sciences
of Georgetown University
in partial fulfillment of the requirements for the
degree of
Master of Public Policy
By
Kevin Robert Carriere, B.A.
Washington DC
April 11, 2016

ii
Copyright 2016 by Kevin R. Carriere
All Rights Reserved

iii
THE MILITARIZATION OF POLICE’S EYES, EARS, AND HANDS:
THE 1033 DEPARTMENT OF DEFENSE PROGRAM AND POLICE SAFETY OUTCOMES
Kevin Robert Carriere, B.A.
Thesis Advisor: William Encinosa, Ph.D.
ABSTRACT
The current state of race relations in Baltimore, Ferguson, and New York have brought to light
the issues of police legitimacy and trust with police officers and the citizens they serve to protect.
The results of these conflicts have brought to light the militarization of local police, where
officers are being provided with unused equipment from the government’s war chest. But why
are these police being heavily armed? Is there truly a threat? Using data on police equipment
purchases provided by NPR and assaults on police officers provided by the FBI, this
investigation analyzes the effects of purchases on the count of assaults on police officers.
Negative binomial regressions on state-month level data shows that the compounded summation
of surveillance purchases have a negative, but substantively insignificant, effect on assaults
across both linear and quadratic models, while military grade weapons purchases exhibit a
significantly positive increase on the risk ratio of assaults under a quadratic model. Results are
discussed in light of psychology research on procedural justice and trust of law enforcement, and
implications for the policy arena are developed, recommending a decrease in the program’s use
in regards to weapon-based purchases. Future work continuing this analysis with stronger
controls, more data points, and other datasets are considered.

iv
TABLE OF CONTENTS
Chapter One: Introduction………………………………………………...…………………..1
Chapter Two: Institutional Background…………………………...…………………………..3
Chapter Three: Previous Research…………………………...…………………......................5
Chapter Four: Method…………………………...…………………………………………...11
Chapter Five: Results…………………………...……………………………………………18
Chapter Six: Discussion…………………………...…………………………………………21
Tables and Figures…………………………………………………………………...………24
References …………………………...……………………………………………………….28

1
CHAPTER ONE
INTRODUCTION
The image of two armored vehicles rolling down the streets of a small, 21,000 resident city,
made national news. The small city of Ferguson, Missouri, which had just became the next
headline in a string of police shootings, found itself facing swift condemnation on the police
department attempting to handle protests and riots. The Department of Defense, in a quick
statement, quickly recalled the vehicles. But still, the question remained – were those trucks
necessary? Were they helping to protect the officers or citizens? And if so – from what threat?
In 1996, Congress approved of the National Defense Authorization Act. A section of this
act, called the 1033 Program, authorized the Secretary of Defense to “transfer to Federal and
State agencies personal property of the Department of Defense, including small arms and
ammunition, that the Secretary determines is— (A) suitable for use by such agencies in counter-
drug activities; and (B) excess to the needs of the Department of Defense.”(S 153-2576a). This
program sanctioned the transfer of military grade equipment to local police for an extremely low
price – to the magnitude that a $733,000 mine-resistant, ambush protected vehicle sold to
Connecticut for $2,800 (Wofford, 2014).
And yet, Ferguson simply was a highlight to an overarching concern. Across the nation,
there are countless SWAT (Special Weapons and Tactics) forces, with 80% of cities between
25,000 and 50,000 people have a dedicated SWAT team which raid over 50,000 times a year
(Fund, 2014).These forces, first started by Los Angeles in 1967, were meant to combat the drug

2
trade and fight gangs and heavily armed suspects that an average officer may be unfit to handle,
such as at a college campus (Balko, 2013).
The actions in Ferguson, and now in Baltimore, Chicago, San Francisco – and too many
more to name – have motivated individuals to seek to find ways to keep both officers and
citizens more accountable for these interactions through the use of body cameras and more
observational-based, evidence-based actions. It has been shown that body cameras increase
trustworthiness of law enforcement (Press, 2014).
The following paper seeks to analyze the efforts by the Department of Defense to protect
its officers from harm through equipping them with military grade equipment. I will evaluate the
effect of purchasing both weapons and cameras, along with other tools, on the amount of police
assaults in following months. I will contextualize my examination under the presumption that
military equipment is visible to the average citizen and causes feelings of distrust and fear in the
average citizen, which will be backed by empirical evidence. After examining my results, I will
discuss the implication of the results and suggest some further avenues for research.

3
CHAPTER TWO:
INSTITUTIONAL BACKGROUND
The 1033 program is so named as it was the 1033rd section to the National Defense Authorization
Act in 1997, voted on by Congress in 1996. (Nat'l Defense Authorization Act for Fiscal Year
1997, Pub. L. No. 104-201, § 1033, 110 Stat. 2422, 2639^0 (codified at 10 U.S.C. § 2576a))
Prior to this, the National Defense Authorization Act of 1990 had provided the transfer program
strictly for “counter-drug activities” (Wofford, 2014) but, in 1996, this was amended to allow
transfers for all “ bona fide law enforcement purposes that assist in their arrest and apprehension
mission” (Agency, n.d.) The Department of Defense, through the Law Enforcement Support
Office (LESO) under the oversight of the Defense Logistics Agency, provides county, state, and
federal law enforcement officers with surplus equipment from the various wars. This is beyond
armored cars and land mines, but extend to undergarments, air conditioners, and sonar
equipment. Agencies are required to use the equipment within a calendar year, lest it be revoked
and sent back to the DLA (Walker, 2014).
Ferguson, a city with merely 21,000 residents, was able to have access to these military
grade tools (Walshe, 2014) even though some reports state that many states have no system in
place to examine the efficiency or amount of time the equipment is taken out (ACLU, 2014).
This image was most prevalent at the high of the Michael Brown protests in Ferguson, Missouri,
where police were facing peaceful protesters with assault rifles, armored trucks, and tear gas
(Swaine, 2015), and President Obama called on the Pentagon to remove the armored vehicles
from Ferguson.

4
And that is the state of the United States. Paramilitarization, or the increase in a military-
structured taskforces, has been on the rise in the United States since the 1980’s. As of the late
1990s, a survey found that ninety percent of police departments in cities over 50,000 citizens had
paramilitary units (Kraska, 2007). These task forces typical train with army and navy officers,
and many have stated that this trend is encouraging law enforcement to “view the inner-city
urban environment [as] a war zone” (Meeks, 2006, p. 36).
The question is – if law enforcement is preparing for a war in the urban environment, is
there evidence that this war exists? And, more importantly, are these purchases, in some way,
winning the war for the police? Or, is it the case that this growth in police power – the arming
and changing culture – is reducing tension, increasing conflict, and putting our law enforcement
in more danger and in closer proximity to civilians than they would otherwise? Most
importantly, does equipping our officers with surveillance equipment – equipment that could
provide them with a better understanding of the civilians in which they interact with and perhaps
increase the trustworthiness of police officers – reduce the violence against law enforcement?

5
CHAPTER THREE
PREVIOUS RESEARCH
While the discussion around the police-state and protection has gone on for quite some time
(Miller, 1996), most discussion around the rise in the power of the police in the United States has
been theoretical in nature. Of the work that is not theoretical, much of that work is qualitative
interviews with police officers, their experiences with coping with stress (Biggam, Power, &
MacDonald, 1997), feelings of invulnerability (Dorn & Brown, 2003), or general work hazards
(Brandl & Stroshine, 2012). However, as this issue has been developing over the last thirty years,
some research surrounding police, weapons, and assaults on officers does exist.
Research on Weapons
Analysis from North Carolina’s introduction of pepper spray, could not find any significance on
reducing police officer assaults back in 1993 (Ashcroft, Daniels, & Hart, 2003), while a 1998
study showed a decrease in assaults in Baltimore county, Maryland with the implementation of
pepper spray by 3.2 assaults per month (Kaminski, Edwards, & Johnson, 1998). A multinomial
logit model was run in which researchers found that OC only assisted in making an arrest easier
70.7% of the time (Kaminski, Edwards, & Johnson, 1999), which is significantly lower than
other estimates that range in the 90 to 100% range (Phillips, 1994; Robin, 1996).
Some researchers have likened this effect to the sound that is made when police arm
thesmelves with it – the “Velcro effect” (Kaminski, Edwards, & Johnson, 1998). In this way,
simply the threat of using the pepper spray was hypothesized to reduce the amount of assaults
against officers. Yet, some researchers question this conclusion. Buttle (2005), namely argues

6
that it is not simply the spray, but the appearance and décor of the officer that deters assaults. His
argument surrounds the notion that it “is the officer’s ability to appear competent and ready to
fight” (Buttle, 2005, p.133) that reduces assaults, as the carrying of a baton, of better uniforms,
of body armor – all provide, in some way, a sign to citizens that this person should not be
attacked.
Other work has examined the other classic, non-military based weapon – that of the taser,
or conducted energy device (CED). A logistic regression on five years of data comparing seven
departments that did use tasers and six departments that did not use tasers showed that those who
deployed CEDs saw reductions in officer injuries, suspect severe injuries, and injuries for both
officers and subjects that required some medical attention (Taylor & Woods, 2010). When
analyzing taser use in arrest-related deaths, researchers found that deployment of a taser
continued resistance in nearly 60% of cases, and that other force (most often physical) was
required before and after deployment (White et al., 2012). Other analysis of New York’s use of
the taser pointed towards that while nearly all suspects were engaged in some form of violent
behavior, just fewer than half of suspects were armed (White & Ready, 2010).
Assaults on Officers
Some research makes the claim that officers who are married are less likely to be killed than
officers who are single, and that this could be due to a change in decision making and risk
seeking by those with additional responsibilities (Kachurik, Ruiz, & Staub, 2013). More
interestingly, they also found that officers on the force for more years were more likely to be
killed than officers with fewer years. While the authors were not able to make sense of such a
result, it seems plausible to assume the more years one has been indoctrinated in a culture of

7
fear, the more likely they are to react in an aggressive or risk-adverse manner, which may risk
their own lives. Grennan’s (1987) research shows at least part of this idea to be true, in that
officers who have been involved in more prior firearm incidents were more likely to be injured
than those who had been involved in fewer incidents in the past. However, other research
showed that additional years of service on the force decreased the odds of injury for officers
significantly (Kaminski & Sorensen, 1995).
Much of research on officers surrounds what type of call is the most risky to take – which
call will most likely cause an injury to an officer. To this extent, Stanford & Mowry (1990)
found that while general disturbance calls were most likely to receive an assault, domestic
disturbance calls were the calls most likely to cause injury to officers, while others have found
the reverse to be true (Hirschel, Dean, & Lumb, 1994). Other research finds even different calls
as most dangerous (Ellis, Choi, & Blaus, 1993) to the extent it may be safest to assume all calls
are equally dangerous.
In an examination on assaults on Boston police officers, Kaminski, Jefferis, & Gu found
that a one standard deviation increase in resource deprivation in a given community block was
associated with a 31% increase in assaults on police (2003), with one standard deviation
increases on arrests and violence being associated with 60% and 40% increases in expected
assaults. An early OLS stepwise multiple regressions back in 1974 also showed that both
narcotics arrests and residential stability were the most powerful explanatory predictors when it
came to analyzing assaults on police (Regens, Meyer, Swanson, Chapman, & Wilson, 1974).
Other research supports the idea that having a partner in law enforcement present decreases the
amount of assaults an officer will face (Wilson, Brunk, & Meyer, 1990).

8
Prior research using the datasets that will be used in the presented research has been
limited in scope, but a first attempt at analyzing the data found no within state effect in the
protection of officers injuries, while also showing small, significant positive effects on assaults
with increase in transfers from the 1033 program (Wickes, 2015). Stewart & Oliver (2014) found
that initiatives in Texas involving homeland security were not significantly associated with threat
levels or incidents that required higher measures of security, but instead simply the amount of
security related grants a given police department received.
In general, research has shown a variety of communal based factors that contribute to the
safety of police officers. Some work has studied some of the equipment carried by officers –
pepper spray and tasers – but none of the work gets at the increase in military based equipment
and their protection (or tension) by the officers. Just as some researchers state that the symbol of
the uniform may send a message, so it may too send a message of distrust and conflict. As
officers are being more and more trained with Navy Seals, Army veterans, and being shown
images of brutal shootings, it may make sense why they are quick to draw a military-based
behavior out of a civilian based situation, especially if they are being equipped with battle-ready
surplus.
The Psychology of Procedural Justice and Trust of Officers
The previous literature provided evidence for the increase in military-grade weapons being given
to police officers, and that there is a growing understanding of the risks associated with being a
police officer. Some of these risks have attempted to be mitigated through equipping of pepper
spray, tasers, higher-grade uniforms, and weapons. However, this literature has failed to
acknowledge the other targets of these changes in policy – the citizens. Policing has moved from

9
“a focus on acting against crime which is in the process of occurring or on solving already
committed crimes to a proactive strategy of preventive measures aimed at deterring future
crimes” (Tyler, Jackson, & Mentovich, 2015, p.604). This preventive state causes concerns and
issues – police must be more suspicious and distrustful of citizens (could THEY commit a crime
in the next moment?) which was highlighted clearly in light of the controversy around New
York’s stop and frisk policy (Goldstein, 2013).
Across time, we have seen a decrease in the trust of police officers – 53% reported
having high confidence in police in 2014, a historic low since 1993 where it was 52% (Gallup,
2015). The question of trust – and through trust, legitimacy of authority, has been studied
frequently within the legal system (see Jackson et al., 2012, Jackson, Aziz, Bradford, & Tyler,
2013, Tyler & Jackson, 2014 for some examples). By approaching individuals with suspicion,
the police are perceived of being unfair and are not genuinely caring about the community’s
needs (Gau & Brunson, 2012), breaking relational bonds and risk damaging the identity of the
community as one of “us” to one of “us versus them” (Tyler & Lind, 1992). A sample of 1,603
individuals showed that feeling suspected by police was linked with negative beliefs of police
motives, lower legitimacy, and higher levels of disorder in the community (Tyler et al., 2015).
Examining the perceived procedural justice – or perceived fairness of the system - of individuals
has been found to be extremely predictive of support of the system and its legitimacy (Tyler,
2006) and are in general more compliant with orders (Tyler, 2009), and are more favorable in
outcomes even when it may not benefit them (van der Toorn, Tyler, & Jost, 2011). Those who
find the system to be non-legitimate are aggressive in their non-compliance and may strike out
against the officers.

10
There have been signs of technology that can mediate this growing division between
police officers and citizens in the implementation of body worn cameras on police officers. The
seminal randomized controlled trial that tested body worn cameras in the United States found
that use-of-force against citizens reduced by half compared to the control group in the Raitlo
Police Department (Ariel, Farrar, & Sutherland, 2014). Other studies found 50% less likelihood
to exhibit force when a camera was on (Henstock, 2015) and reduce false allegations against
officers (Grossman et al., 2015; White, 2014).
It could be the case that overall, there is a positive Velcro effect that protects officers.
This effect does not rule out the secondary case – that this effect, while working, may be at the
same time increasing the conflict in more subconscious, non-overt waysCitizens, who see
themselves facing a police force in heavier gear, using more advanced technology, and carrying
more heavy-caliber weapons – while fearing the retributive justice of the officers, are angered by
the procedural injustice of the officers.
This present study addresses these fundamental questions. While prior work has
examined how certain gear such as tasers or pepper spray has assisted police officers in their
arrests, or what contextual conditions are more likely to result in assaults against police, but very
little work has been done examining how assaults against officers is changing over time. Based
off work that shows decreases in assaults and reparations of trust when officers utilize body
cameras, this study examines the effect of both weapon and surveillance purchases on trust of
police officers, operationalized as the amount of assaults against police officers.

11
CHAPTER FOUR
METHOD
Data
National Public Radio received a dataset from the Department of Defense detailing out all
purchases made by states in conjunction with the ‘1033’ program (Rezvani, Pupovac, Eads, &
Fisher, 2014). Each transfer is listed by item-definition by state from 2006 through March of
2014. For purchases prior to 2006, we took all purchases reported by Open Virginia (Bowden,
2015) prior to January, 2006 and summed them as a baseline. See Appendix A for mean
transfers across states. The transfer dataset has 3,602 observations across 54 states, including
Virgin Islands, Guam, District of Columbia, and Puerto Rico.
The FBI complies officer assaults and injuries by month through the Uniform Crime
Report called the LEOKA data – or Law Enforcement Officers Killed or Assaulted data
(Uniform Crime Reporting Program Data: Police Employee (LEOKA) Data, 2012). This dataset,
which is released yearly, was combined together from 2006 until 2013. We are interested in two
outcome variables – total assaults on police officers, and assaults on officers who are called
towards civil disorder calls. Fifty-four states reported their assault data, including the District of
Columbia, Puerto Rico, Canal Zone, and Guam. However, Puerto Rico has no assault data
reported, even though it was included in the LEOKA reports. In total, across this 8-year span,
there were a total of 4,750 observations for 49 states-months.
Analytic Sample
Florida was removed from all subsequent analyses due to only having observations of
assaults in December. The Virgin Islands and Puerto Rico had no reported assault data, so they

12
are removed from all subsequent analyses. The Canal Zone had no reported purchases, so it was
also removed from all subsequent analyses. Missing months – in which a given state saw no
assaults against their officers reported, were filled in with zeroes, which is included in the above
count, however this is quite small (n=40). If a state was found to have a full year worth of zeroes,
these were set to missing. In total, after combining the data, there are a total of 5,340
observations across 49 states, with 3,387 state-month non-zero purchase observations and 4,652
state-month non-zero assault observations.
Variables
Outcome Variable: Assaults Against Police Officers
States report on assaults against police officers through the LEOKA dataset. Each county reports
on how many officers were assaulted and what type of call they were responding to. Categories
of possible calls include disturbance calls, burglaries, robberies, attempting arrest, civil disorders,
custody of prisoners, suspicious persons, ambush without warnings, mental derangement, traffic
stops or pursuits, and all other calls. Assaults were also coded as either assaulted by firearms,
knives, hands and feet, or other. Overarching the type of call, assaults were also counted on
whether or not each of the weapon used caused injury or not to the officer. This analysis focuses
on general assaults (a summation of all possible call categories) without regard to injury or not.
This variable – amount of assaults on officers by a given state during a given month – is a count
variable. Not only are these types of variables unable to be negative (There is no state in which a
negative amount of assaults could occur), but it also is on integer basis (no observation can be in
decimal points of assaults).

13
Independent Variables of Interest: Purchases of Weapons & Surveillance Equipment
As the LESO program offered items at an extremely reduced cost, equipment transfers will be
counted by quantity bought and shipped – not their cost. The unit then is a single purchase of
equipment in terms of the equipment itself. I will be analyzing the militarization of police
through two different indicators of police militarization – of material and of operational (Kraska,
2007). By material, I am indicating the general overt, visible qualities of militarization –
weapons, armored vehicles, and body armor. By operational militarization, I am describing
“patterns of activity modeled after the military such as in the areas of intelligence, supervision”
(Kraska, 2007, p.3) – that of sonar, radar, photographic equipment, and communication-based
devices. The NPR dataset provides these purchases in terms of their Federal Supply Class Name,
and the division of if they were indicated to be a purchase of a given category can be seen in
Appendix A and B.
However, equipment needs time to ship, unload, and be ideally trained in how best to use
the equipment. It also takes time for the public to notice the equipment, notice its increase in its
presence, and decide what to do about its existence. To account for this delay in effect, all
equipment purchases will be lagged six months in time. Because the equipment comes with a
“use it or lose it” attachment, we can assume that (a): the equipment has been used at least once
(and therefore, should have an effect) and (b): the equipment, having been used, stays with the
office and can be considered stockpiled over time.
Control Variables
Prior research (Kainski, Jefferis, & Gu, 2003) points out some of the most relevant
control variables - resources and crime rates. We can control for resource levels through mean

14
income, unemployment percentage, and poverty percentages. Those states that face lower
incomes, or higher unemployment and higher poverty, may already be aggressive against the
government and upset and untrustworthy of police officers, and this lack of trust may catalyze
frustration to aggression. Trust towards police officers is lowest in areas where crime rates are
high (Wilson, 1975). All of these controls may also be impacting the amount of transfers, as
higher crime rates may encourage police to arm themselves against the perceived threat. Beyond
that, a feeling of distrust may work both ways, in that those officers who receive less feelings of
trust may be untrusting of their fellow citizens, demanding more equipment to investigate and
protect themselves from the masses. Having a control for the per capita police officer rate may
be related to how many assaults are committed, and at the same time, may see more equipment
being bought for larger police departments.
There are issues with the data that must be addressed, so as for future research to
contemplate better strategies to handle examining such a question. Most state level data is taken
only during the census. Other attempts at finding data, including a better proportion of black
Americans, have only found limited success in the years 2010-2014 (U.S. Census Bureau, n.d.).
Crime rates could be found between the years of 1998-2012 (National Archive of Criminal
Justice, 2010). As noted, other data on the LESO 1033 Program exists and was used to create a
baseline category, but should be investigated to see differences overall between the NPR data
provided and its estimates, to see if one is providing different results than the other (Bowden,
2015). Overall, our control variables provide little within-state variation and are not perfectly
suited to handle within state examination. Due to this, we will present results from both the
between state regressions as well as fixed effect regressions, controlling for both time and state.

15
Analytic Strategy
To determine the association between assaults on officers and purchases by the state, we estimate
two across time negative binomial regression models (Greene, 1994, Paternoster, Brame,
Bachman, Sherman, 1997; Dietz et al., 2003). I use the negative binomial model, rather than an
ordinary least squares model, because of the discrete count outcomes of the dependent variable.
The negative binomial regression reports its coefficients in a difference in logs of expect counts,
such that a one unit increase in our predictor would provide a 𝛽 unit increase in logs of the
expected count. This coefficient can be transformed into an incidence rate ratio by taking the
exponential function and inserting the coefficients into the x. The provided coefficients, now in
IRR terms, will be the expected factored increase given an increase of one unit in our covariate.
The first model, using a six month lagged purchase to predict future assault rates, is provided
below.
𝑂𝑓𝑓𝑖𝑐𝑒𝑟 𝑆𝑎𝑓𝑒𝑡𝑦 𝑂𝑢𝑡𝑐𝑜𝑚𝑒𝑠𝑖𝑗
= 𝛽0 + 𝛽1(𝑊𝑒𝑎𝑝𝑜𝑛𝑠 𝑃𝑢𝑟𝑐ℎ𝑎𝑠𝑒𝑑)𝑖𝑡−6 + 𝛽2(𝑆𝑢𝑟𝑣𝑒𝑙𝑙𝑖𝑒𝑛𝑐𝑒 𝑃𝑢𝑟𝑐ℎ𝑎𝑠𝑒𝑑)𝑖𝑡−6
+ 𝛽3(𝑂𝑓𝑓𝑖𝑐𝑒𝑟 𝑅𝑎𝑡𝑒)𝑖𝑡 + 𝛽4(𝑉𝑖𝑜𝑙𝑒𝑛𝑡 𝐶𝑟𝑖𝑚𝑒 𝑅𝑎𝑡𝑒)𝑖
+ 𝛽5(𝑃𝑜𝑣𝑒𝑟𝑡𝑦 𝑅𝑎𝑡𝑒)𝑖𝑡 + 𝛽6(𝑀𝑖𝑠𝑐𝑒𝑙𝑙𝑎𝑛𝑒𝑜𝑢𝑠 𝐶𝑜𝑛𝑡𝑟𝑜𝑙 𝑉𝑎𝑟𝑖𝑎𝑏𝑙𝑒𝑠)𝑖𝑡
+ (𝑆𝑡𝑎𝑡𝑒 𝑎𝑛𝑑 𝑀𝑜𝑛𝑡ℎ 𝐹𝑖𝑥𝑒𝑑 𝐸𝑓𝑓𝑒𝑐𝑡𝑠) + 𝜖𝑖𝑗
In this equation, the total counts on a state i at time t is being predicted by a six-month prior
purchase of both weapons and surveillance equipment purchased in quantity of purchases. Crime
rate is the state crime rate in 2004, and officer rate is the amount of police officers for every
1,000 people in a given state at a given month. However, the purchases are not lost at the next
month. Instead, states are continually collecting and acquiring this equipment and therefore a
more meaningful measure of purchases is the compounded summation of purchases for each
state i at time t, which is shown in model two.

16
𝑂𝑓𝑓𝑖𝑐𝑒𝑟 𝑆𝑎𝑓𝑒𝑡𝑦 𝑂𝑢𝑡𝑐𝑜𝑚𝑒𝑠𝑖𝑗
= 𝛽0 + 𝛽1(𝑊𝑒𝑎𝑝𝑜𝑛𝑠 𝑆𝑡𝑜𝑐𝑘𝑝𝑖𝑙𝑒 𝑖𝑛 𝐻𝑢𝑛𝑑𝑟𝑒𝑑𝑠)𝑖𝑡−6
+ 𝛽2(𝑃ℎ𝑜𝑡𝑜 𝑆𝑡𝑜𝑐𝑘𝑝𝑖𝑙𝑒 𝑖𝑛 𝐻𝑢𝑛𝑑𝑟𝑒𝑑𝑠)𝑖𝑡−6 + 𝛽3(𝑂𝑓𝑓𝑖𝑐𝑒𝑟 𝑅𝑎𝑡𝑒)𝑖𝑡
+ 𝛽4(𝑉𝑖𝑜𝑙𝑒𝑛𝑡 𝐶𝑟𝑖𝑚𝑒 𝑅𝑎𝑡𝑒)𝑖𝑗
+ 𝛽5(𝑃𝑜𝑣𝑒𝑟𝑡𝑦 𝑅𝑎𝑡𝑒)𝑖𝑡 + 𝛽6(𝑀𝑖𝑠𝑐𝑒𝑙𝑙𝑎𝑛𝑒𝑜𝑢𝑠 𝐶𝑜𝑛𝑡𝑟𝑜𝑙 𝑉𝑎𝑟𝑖𝑎𝑏𝑙𝑒𝑠)𝑖𝑡
+ (𝑆𝑡𝑎𝑡𝑒 𝑎𝑛𝑑 𝑀𝑜𝑛𝑡ℎ 𝐹𝑖𝑥𝑒𝑑 𝐸𝑓𝑓𝑒𝑐𝑡𝑠) + 𝜖𝑖𝑗
Finally, there assumes to be a chance that the 1,000th stockpiled weapon does not have equal
effect as the 10,000th stockpiled weapon – that there are diminishing returns to continued
purchases. Adding the squared term of both weapons and photos into the model can examine if
there are marginal differences across purchases over time, which is modelled in model three.
𝑂𝑓𝑓𝑖𝑐𝑒𝑟 𝑆𝑎𝑓𝑒𝑡𝑦 𝑂𝑢𝑡𝑐𝑜𝑚𝑒𝑠𝑖𝑗
= 𝛽0 + 𝛽1(𝑊𝑒𝑎𝑝𝑜𝑛𝑠 𝑆𝑡𝑜𝑐𝑘𝑝𝑖𝑙𝑒 𝑖𝑛 𝐻𝑢𝑛𝑑𝑟𝑒𝑑𝑠)𝑖𝑡−6
+ 𝛽2(𝑊𝑒𝑎𝑝𝑜𝑛𝑠 𝑆𝑡𝑜𝑐𝑘𝑝𝑖𝑙𝑒 𝑖𝑛 𝐻𝑢𝑛𝑑𝑟𝑒𝑑𝑠 )2𝑖𝑡−6
+ 𝛽3(𝑃ℎ𝑜𝑡𝑜 𝑆𝑡𝑜𝑐𝑘𝑝𝑖𝑙𝑒 𝑖𝑛 𝐻𝑢𝑛𝑑𝑟𝑒𝑑𝑠)𝑖𝑡−6
+ 𝛽4(𝑃ℎ𝑜𝑡𝑜 𝑆𝑡𝑜𝑐𝑘𝑝𝑖𝑙𝑒 𝑖𝑛 𝐻𝑢𝑛𝑑𝑟𝑒𝑑𝑠)2𝑖𝑡−6
+ 𝛽5(𝑂𝑓𝑓𝑖𝑐𝑒𝑟 𝑅𝑎𝑡𝑒)𝑖𝑡
+ 𝛽6(𝑉𝑖𝑜𝑙𝑒𝑛𝑡 𝐶𝑟𝑖𝑚𝑒 𝑅𝑎𝑡𝑒)𝑖𝑗
+ 𝛽7(𝑃𝑜𝑣𝑒𝑟𝑡𝑦 𝑅𝑎𝑡𝑒)𝑖𝑡 + 𝛽8(𝑀𝑖𝑠𝑐𝑒𝑙𝑙𝑎𝑛𝑒𝑜𝑢𝑠 𝐶𝑜𝑛𝑡𝑟𝑜𝑙 𝑉𝑎𝑟𝑖𝑎𝑏𝑙𝑒𝑠)𝑖𝑡
+ (𝑆𝑡𝑎𝑡𝑒 𝑎𝑛𝑑 𝑀𝑜𝑛𝑡ℎ 𝐹𝑖𝑥𝑒𝑑 𝐸𝑓𝑓𝑒𝑐𝑡𝑠) + 𝜖𝑖𝑗
Data Processing
The data processing steps can be summarized as follows:
Read in all fifty four states of data provided by NPR. Combine them all together into one
larger dataset, where each row is a different purchase by a given county of a given state of a
given month and year. Based off of the federal supply class name, assign indicators to purchases
of weapon-based, surveillance based, or other categories of interest, including neither. Generate
the proper time variable, and then collapse the dataset, summing across each county of the same
state to produce observations for each state at a given month-year. Repeat for all states provided
by Open Virginia, but restricting data to prior 2006. Collapse by summation, ending with 50
states with baseline purchases prior to 2006, calling its time variable December of 2005.
Combine these 54 observations into NPR’s dataset.

17
Open the LEOKA datasets that fill the time series (from 06 to 2013). It shows a given
county’s reports from a state during a specific month. Generate variables based off summing the
breakdown of a given type of call the officer was out for (type of call broken down by assaulted
by gun, knife, hands or feet, other) to get total assaults on a given month for county. Reshape
and reform dataset so each row is a given state-month and variables read properly. Create a new
dataset with the controls taken from the LEOKA datasets. Create a meaned-county officer per
1000 rate per state, a summed total employees per state from each county, and a summed
population from each county per state. Repeat for each year and combine them into one dataset
with a variable indicating the month and year.
Read in the NPR dataset, the LEOKA dataset, as well as the controls dataset. Collapse
together by state-month-year and rename variables. Remove all observations past 2014 due to
lack of LEOKA data and remove Florida, Guam, District of Columbia, Canal Zone, Puerto Rico,
and Virgin Islands due to lack of LEOKA data. In the end, this leaves us with a total of 49 states,
across 97 months (December 2005 + 8 years of 12 months) for a total of 4,753 cases.

18
CHAPTER FIVE
RESULTS
Descriptive Statistics
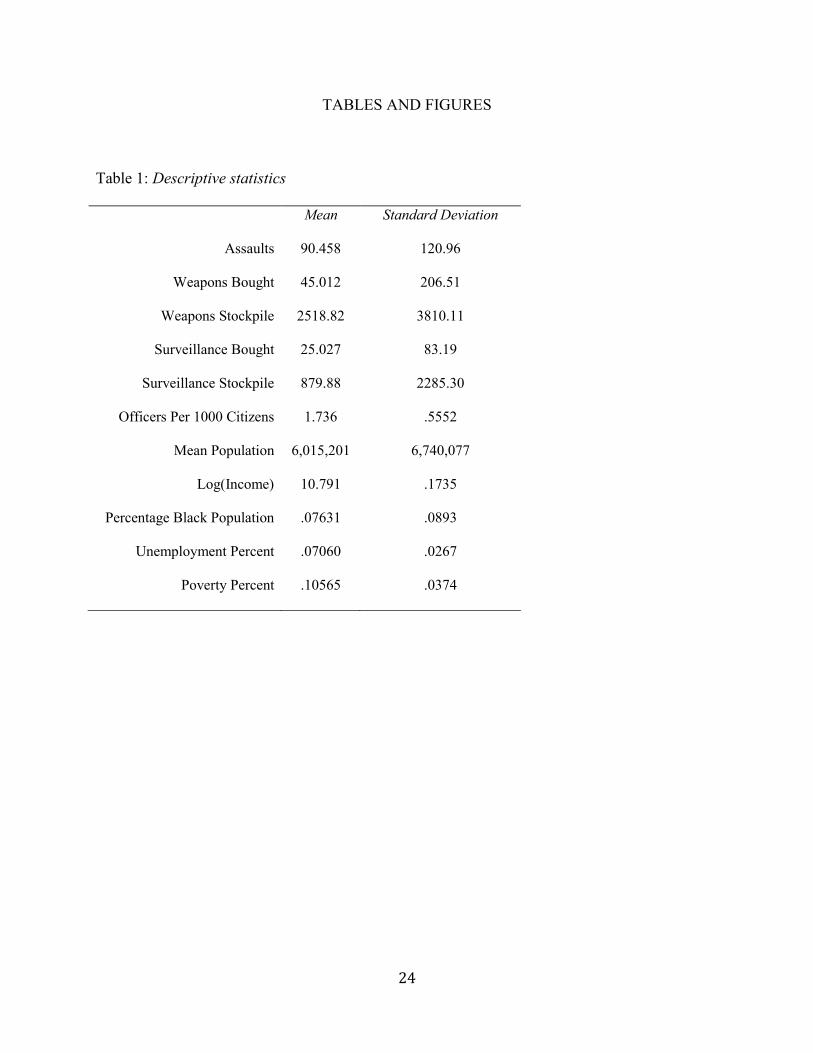
Table 1 gives descriptive statistics for our variables of interest. Across all states, an average of
ninety assaults were found per month with forty five weapons purchased and twenty-five
surveillance equipment purchased per month. Purchases broken down by state can be found on
Table 2. There are an average of 1.7 officers per one thousand citizens and an average state
population of around six million individuals. Our estimated population is underestimated, then,
as a more accurate average state population falls around the 6.3 million category. The average
natural logged income of the states is about 10.8, which falls within the national average.
Model one in Table 3 examines the effects of a six-month prior purchase on later outcomes of
assaults, without accounting for previous stockpiling of weapons. This is simply the effect of a
six-month prior purchase on contemporaneous assaults. The negative binomial regression shows
some significant effects on surveillance purchasing, such that an additional purchase of one
surveillance equipment would be expected to reduce the rate of assaults by a factor of .999. It is
note worthy that the direction and significance holds various across all fixed effect models. The
amount of officers is associated with large increases of assaults – an increase of 1 officer per
1,000 people is expected to increase the rate of assaults by a factor of 1.40.
However, purchases as stated are not simply used and put away – they can be continually
stockpiled by a given state across time. As noted, time zero is amount of stockpiled photos or
weapons as reported by the Open Virignia dataset, and any purchases past January 2006 are
counted through the NPR provided dataset. Model Two examines the effect of an additional

19
purchase of a weapon or photo cumulatively across time on assaults against police officers given
a six-month lag.
In all models, surveillance stockpile points to a decrease in assaults while weapons
stockpile is non-significant. An additional purchase of one hundred stockpiled weapons is
expected to decrease assault rate by a factor of .9976 within a given state and month. Weapon
purchases showed no effect on rate of assaults in any of the models. We see significance in all of
our control variables besides poverty. An increase in officers is predicted to increase the rate of
assaults against officers by a factor of 1.38. This is semi-logical, as more officers provide a
greater chance to be assaulted. However, one may assume that more officers provide back up and
more chances for a partner, which in the past have been shown to decrease assaults (Wilson,
Brunk, & Meyer, 1990). Proportion of the population is black was a significant negative
predictor of assaults. However, we are critical of the measurement error on this variable, with its
mean of 49 states stating 7% Black, where the more accurate measure is around 13.6% in the
United States (Census, 2010). As this variable seems to be underestimated, we can assume our
estimate is larger than it should be and may move towards zero if properly defined. Income has a
positive significant effect on assaults, which seems counter-intuitive and further research would
need to examine this, especially in light of the obvious questionable statistics of other control
variables. However, we can make a prediction. As higher income is correlated with higher tax
revenue for the state, and more tax revenue means more spending, it could be the case that this
revenue is paying for further trainings for police officers. This would be beneficial if the training
was for good purposes, but literature seems to indicate that training for these officers involves
training with the army (Meeks, 2006), perpetuating the view that citizens should be viewed as
the enemy, which promotes distrust. The lack of significance on poverty may also be connected

20
with the issue of trust and legitimacy, since those who are the lowest in the system have been
found to justify the fairness of the system as a means of cognitive dissonance from their position
(Jost, Legerwood, & Hardin, 2008).
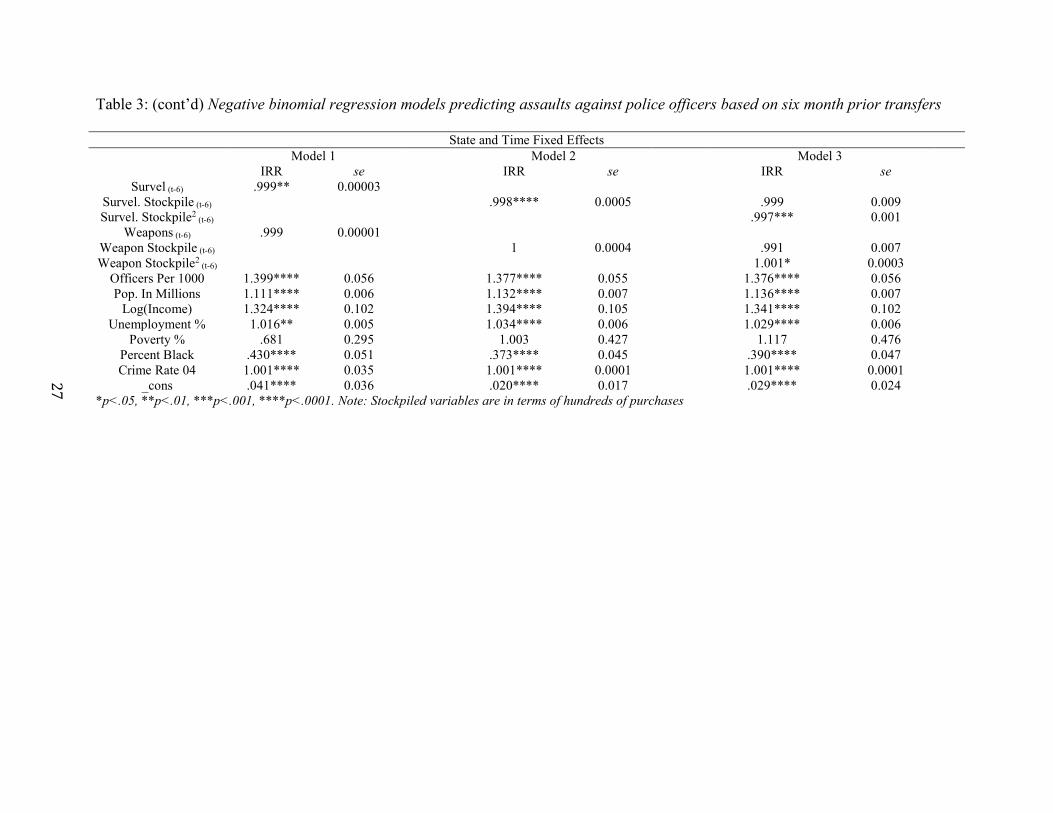
Finally, Model Three attempts to examine the effect of using a quadratic term within the
negative binomial analysis. In doing so, the linear terms lose their significance but the quadratic
terms become significant in both the time-fixed effects model as well as state and time fixed
effects models. The weapon stockpile is significantly increasing the risk of assaults as the
stockpile continues to grow, while surveillance continues to decrease assaults as the stockpiles
increase.

21
CHAPTER SIX
DISCUSSION
The results from this study provide us with two main implications – one, that weapons
are not influencing an individual’s analysis whether or not to retaliate against an officer in a
linear manner, while two, that surveillance equipment seems to decrease the number of assaults
against officers. However, it may not be the case there is no change in the analysis – simply just
a lack of change in outcomes. Officers are clearly utilizing this equipment (though prior work
showed also no effect in injury-based outcomes – see Wickes, 2015) and it is clearly visible to
the protesters, suspects, and citizens with whom the officers are interacting with. It could be the
case that individuals are seeing this additional equipment, and rejecting it as a boundary for
whether or not they should assault. This makes sense as assaults are showing a positive
relationship using a quadratic predictor of stockpiled weapons, in the sense that a smaller
stockpile may not upset an individual, but as the stockpile increases, so does the distrust of the
citizens facing the stockpile. Their additional feelings of injustice towards the overt display of
distrust from the officers may be causing them to rebel and fight back at equal if not higher rates.
Yet, it could also be the case that weapons are not decreasing assaults linearly because these
weapons are only being deployed for the individual SWAT teams of a given state – the original
intention of the law to crack down on drugs. However, the author relies on the anecdotal
evidence to discount this explanation as well as trends out of Texas that point to no correlation
between crime and requests of equipment (Stewart & Oliver, 2014).
Should we increase the purchases of surveillance equipment then? An advisement of yes
or no has major consequences. Some RCT’s have shown that police officers who wear body-
worn cameras find less complaints by citizens and report less force being used on their

22
interactions (Ariel, Farrar, & Sutherland, 2015) and suggest that a greater awareness of
procedural fairness may have been the mediating variable within this experimental condition.
But are purchases of communication and surveillance equivalent to body worn videos? It could
be the case that states that are purchasing this surveillance equipment are simply just disengaging
from their citizens – they are staying farther away, and it is the distance, not necessarily the
equipment itself, that is causing a reduction in assaults. If this were true, then the purchases are
not actively getting at the roots of procedural justice, but instead, are deflecting the situation
from ever occurring.
Future Directions
The first step of this research requires us to revisit the data in a multitude of ways. For
one, assault data from 2014 was just released by the FBI in March (United States Department of
Justice, 2014), and so that data should be added to the dataset. Secondly, data from the UCR may
be available to provide with accurate crime data on a state-year basis. If this is the case, then the
whole dataset should be re-created with this control variable and considerations to reduce to a
larger time analysis (every six months, or yearly) instead of by month. Finally, the results could
be substantiated with analysis from both sets of data individually, and various configurations of
combining the datasets. This method of using Open Virginia’s dataset to provide a baseline was
useful, but may be clearer if we let each dataset speak for itself.
This research track provides many further investigations. Much current work surrounding
procedural justice issues are based on experimentation or phone-survey manipulations (Tyler et
al., 2015, van der Toorn, Tyler, & Jost, 2011) . However, there are many larger, public datasets
that can be explored in relation to procedural justice. The World Value Survey (WVS, 2016)

23
could be examined to see how procedural justice perceptions have changed with the rise of
values shifting due to terrorism or a rise of right-wing authoritarianism and its links towards
militarization.
Conclusions
This work is a first attempt at looking at how the militarization of police officers may influence
the relations between officers and citizens in a non-linear manner. My analysis showed
consistent results that increasing purchases of surveillance equipment can lead to decrease rates
of assaults against officers, and that an increase of purchases of military-grade weapons can lead
to an increase rate of assaults in a quadratic shaped model. Further analyses should be conducted
to understand these effects, but they point to both a tension between citizen and law enforcement
and a possible avenue towards reconciliation. I hesitate to recommend complete investment into
surveillance, lest we devolve into a completely watched society. However, this work continues to
build onto the scholarship of procedural justice, and warns of the effects of purchasing too many
weapons without full consideration of their perceived status in the United States.
24
TABLES AND FIGURES
Table 1: Descriptive statistics
Mean Standard Deviation
Assaults 90.458 120.96
Weapons Bought 45.012 206.51
Weapons Stockpile 2518.82 3810.11
Surveillance Bought 25.027 83.19
Surveillance Stockpile 879.88 2285.30
Officers Per 1000 Citizens 1.736 .5552
Mean Population 6,015,201 6,740,077
Log(Income) 10.791 .1735
Percentage Black Population .07631 .0893
Unemployment Percent .07060 .0267
Poverty Percent .10565 .0374

25
Table 2: Mean Quantity of Weapons Bought on 1033 Program Across 97 Months
Alabama Alaska Arizona Arkansas California
1659.633 10.87156 1320.073 57.55046 6025.651
(3740.696) (32.48022) (2743.117) (118.6774) (13985.98)
Colorado Connecticut Delaware Georgia Hawaii
4052844 47.6422 335.4312 1881.651 0.16667
(0.6767155) (143.476) (796.4859) (3582.19) (.6767155)
Idaho Illinois Indiana Iowa Kansas
66.3211 409.5138 587.4312 22.51376 22.08257
(143.476) (776.4859) (1392.611) (55.91787) (58.0329)
Kentucky Louisiana Maine Maryland Massachusetts
550.2294 118.6972 155.3853 116.6697 76.43119
(1203.703) (285.6517) (450.4577) (245.7805) (137.9234)
Michigan Minnesota Mississippi Missouri Montana
1186.789 96.81651 29.6789 169.7156 45.90826
(2449.611) (181.7414) (88.99248) (334.8442) (176.2868)
Nebraska Nevada New Hampshire New Jersey New Mexico
27.14679 90.99083 53.97248 200.3211 88.13761
(131.3298) (178.5495) (143.2101) (685.3719) (202.9357)
New York North Carolina North Dakota Ohio Oklahoma
160.7615 327.1193 18.36697 961.3028 251.2752
(583.2513) (648.1651) (61.56112) (1661.808) (844.0874)
Oregon Pennsylvania Rhode Island South Carolina South Dakota
76.27253 356.1101 182.3761 374.3028 19.0367
(155.8602) (1354.446) (650.7641) (598.5956) (49.35171)
Tennessee Texas Utah Vermont Virginia
467.9725 4551.44 121.2202 3.055046 147.7431
(870.27237) (8863.921) (313.4804) (12.04147) (262.497)
Washington West Virginia Wisconsin Wyoming 655.7064 256.0459 202.7523 27.0487
(2209.44) (663.1323) (420.0377) (67.70188)

26
Table 3: Negative binomial regression models predicting assaults against police officers based on six month prior transfers
State Fixed Effects
Model 1 Model 2 Model 3
IRR se IRR se IRR se
Surveillance (t-6) .999** 0.00003
Survel. Stockpile (t-6) .999* 0.0005 .997 0.001
Survel. Stockpile2 (t-6) .999 0.0001
Weapons (t-6) 1 0.00001
Weapon Stockpile (t-6) 1 0.0004 .992 0.0007
Weapon Stockpile2 (t-6) 1 3.01e-06
Officers Per 1000 1.457**** 0.057 1.433**** 0.057 1.44**** 0.058
Pop. In Millions 1.095**** 0.004 1.101**** 0.005 1.103**** 0.006
Log(Income) 1.299**** 0.071 1.226**** 0.069 1.210*** 0.069
Unemployment % 1.003 0.003 1.006* 0.003 1.006 0.003
Poverty % 1.104 0.212 .986 0.191 .994 0.196
Percent Black .373**** 0.045 .349**** 0.043 .357**** 0.044
Crime Rate 04 1.001**** 0.0001 1.001**** 0.0001 1.001**** 0.0001
_cons .049**** 0.029 .091**** 0.055 .105**** 0.065
*p<.05, **p<.01, ***p<.001, ****p<.0001. Note: Stockpiled variables are in terms of hundreds of purchases
Time Fixed Effects
Model 1 Model 2 Model 3
IRR se IRR se IRR se
Survel (t-6) .999** 3e-
Survel. Stockpile (t-6) .998**** 0.0005 .997 0.0009
Survel. Stockpile2 (t-6) .998* 0.0001
Weapons (t-6) .999 0.00001
Weapon Stockpile (t-6) 1 0.0004 .991 0.0007
Weapon Stockpile2 (t-6) 1.001* 2.97e-06
Officers Per 1000 1.412**** 0.055 1.395**** 0.055 1.395**** 0.056
Pop. In Millions 1.111**** 0.006 1.130**** 0.0007 1.132**** 0.007
Log(Income) 1.324**** 0.103 1.393**** 0.105 1.342**** 0.103
Unemployment % 1.016** 0.005 1.034**** 0.006 1.029**** 0.006
Poverty % .672 0.292 .991 0.425 1.098**** 0.471
Percent Black .433**** 0.051 .376**** 0.045 .392**** 0.047
Crime Rate 04 1.001**** 0.0001 1.001**** 0.0001 1.001**** 0.0001
_cons .044**** 0.039 .022**** 0.018 .0312**** 0.0269
*p<.05, **p<.01, ***p<.001, ****p<.0001. Note: Stockpiled variables are in terms of hundreds of purchases.
27
Table 3: (cont’d) Negative binomial regression models predicting assaults against police officers based on six month prior transfers
State and Time Fixed Effects
Model 1 Model 2 Model 3
IRR se IRR se IRR se
Survel (t-6) .999** 0.00003
Survel. Stockpile (t-6) .998**** 0.0005 .999 0.009
Survel. Stockpile2 (t-6) .997*** 0.001
Weapons (t-6) .999 0.00001
Weapon Stockpile (t-6) 1 0.0004 .991 0.007
Weapon Stockpile2 (t-6) 1.001* 0.0003
Officers Per 1000 1.399**** 0.056 1.377**** 0.055 1.376**** 0.056
Pop. In Millions 1.111**** 0.006 1.132**** 0.007 1.136**** 0.007
Log(Income) 1.324**** 0.102 1.394**** 0.105 1.341**** 0.102
Unemployment % 1.016** 0.005 1.034**** 0.006 1.029**** 0.006
Poverty % .681 0.295 1.003 0.427 1.117 0.476
Percent Black .430**** 0.051 .373**** 0.045 .390**** 0.047
Crime Rate 04 1.001**** 0.035 1.001**** 0.0001 1.001**** 0.0001
_cons .041**** 0.036 .020**** 0.017 .029**** 0.024
*p<.05, **p<.01, ***p<.001, ****p<.0001. Note: Stockpiled variables are in terms of hundreds of purchases

28
Table 4: Federal Supply Class Names for Surveillance Equipment
Antennas, Waveguide, and Related Equipment
Amplifiers
Cable, Cord, and Wire Assemblies: Communication Equipment
Cameras, Motion Picture
Cameras, Still Picture
Camouflage and Deception Equipment
Communication Training Devices
Communications Security Equipment and Components
Fiber Optics Accessories and Supplies
Fiber Optic Cables
Fiber Optic Conductors
Fiber Optic Interconnectors
Fiber Optic Kits and Sets
Hazard-Detecting Instruments and Apparatus
Headsets, Handsets, Microphones and Speakers
Intercommunication and Public Address Systems, Except Airborne
Intercommunication and Public Address Systems, Airborne
Mini and Micro Computer Control Devices
Miscellaneous Alarm, Signal, and Security Detection Systems
Miscellaneous Communication Equipment
Miscellaneous Power Transmission Equipment
Navigational Instruments
Night Vision Equipment, Emitted and Reflected Radiation
Office Information System Equipment
Office Type Sound Recording and Reproducing Machines
Ophthalmic Instruments, Equipment, and Supplies
Optical Instruments, Test Equipment, Components and Accessories
Optical Sighting and Ranging Equipment
Optoelectronic Devices and Associated Hardware
Other Cryptologic Equipment and Components
Photographic Developing and Finishing Equipment
Phonographs, Radios, and Television Sets: Home-Type
Photographic Equipment and Accessories
Photographic Projection Equipment
Photographic Sets, Kits, and Outfits
Photographic Supplies
Radar Equipment, Airborne
Radar Equipment, Except Airborne
Radio and Television Communication Equipment, Except Airborne
Radio and Television Communication Equipment, Airborne
Radio Navigation Equipment, Airborne
Radio Navigation Equipment, Except Airborne
Relays and Solenoids
Sound Recording and Reproducing Equipment
Shipboard Alarm and Signals Systems
Telephone and Telegraph Equipment
Teletype and Facsimile Equipment
Traffic and Transit Signal Systems
Video Recording and Reproducing Equipment
Visible and Invisible Light Communication Equipment
Visible Record Equipment
Underwater Sound Equipment
X-Ray Equipment and Supplies: Medical, Dental, Veterinary

29
Table 5: Federal Supply Class Names for Weapon Purchases
Combat, Assault, and Tactical Vehicles, Tracked
Combat, Assault, and Tactical Vehicles, Wheeled
A collection of items, which are used for a specific purpose.
Armament Training Devices
Armor, Personal
Guided Missile Handling and Servicing Equipment
Guided Missile Maintenance, Repair, and Checkout Specialized Equipment
Guns, 75 mm through 125 mm
Guns, over 125 mm through 150 mm Includes Breech Mechanisms, Power Drives; Gun Shields.
Guns, over 30 mm up to 75 mm
Guns, through 30 mm
Hardware, Weapon System
Land Mines
Launchers, Guided Missile
Miscellaneous Weapons
Munitions items-systems that are not held by the soldier but are deployed for future activation.
Torpedo Maintenance, Repair, and Checkout Specialized Equipment
Weapons Maintenance and Repair Shop Specialized Equipment
Weapons Systems Specific Vehicular Accessories

30
REFERENCES
ACLU. (2014). War comes home the excessive militarization of american policing. American
Civil Liberties Union, 1-98.
Agency, D. L. (n.d.). 1033 Program FAQS. Retrieved from
http://www.dla.mil/DispositionServices/Offers/Reutilization/LawEnforcement/ProgramF
AQs.aspx
Ariel, B., Farrar, W. A., & Sutherland, A. (2014). The Effect of Police Body-Worn Cameras on
Use of Force and Citizens’ Complaints Against the Police: A Randomized Controlled
Trial. Journal of Quantitative Criminology J Quant Criminol, 31(3), 509-535.
Ariel, B., Farrar, W. A., & Sutherland, A. (2015). The Effect of Police Body-Worn Cameras on
Use of Force and Citizens’ Complaints Against the Police: A Randomized Controlled
Trial. Journal of Quantitative Criminology J Quant Criminol, 31(3), 509-535.
Ashcroft, J., Daniels, D. J., & Hart, S. V. (2003). The Effectiveness and Safety of Pepper
Spray (pp. 1-19, Rep. No. NCJ 195739). Washington, DC: National Institute of Justice.
Balko, R. (2013). Rise of the warrior cop: The militarization of America's police forces.
PublicAffairs.
Biggam, F. H., Power, K. G., & Macdonald, R. R. (1997). Coping With The Occupational
Stressors Of Police Work: A Study Of Scottish Officers. Stress Medicine Stress
Med., 13(2), 109-115.
Bowden, J. A., II. (2015). LESO 1033 - Open Virginia. Retrieved March 20, 2016, from
http://data.openva.com/dataset/leso-1033
Brandl, S. G., & Stroshine, M. S. (2003). Toward an Understanding of the Physical Hazards of
Police Work. Police Quarterly, 6(2), 172-191.

31
Buttle, J. W. (2005). Unravelling the ‘Velcro Effect’: Is deterring assaults against the police
indicative of a more aggressive style of policing? International Journal of Police Science
& Management,8(2), 133-142.
Dorn, L., & Brown, B. (2003). Making sense of invulnerability at work—a qualitative study of
police drivers. Safety Science, 41(10), 837-859.
Ellis, D., Choi, A., & Blaus, C. (1993). Injuries to police officers attending domestic
disturbances: An empirical study. Canadian Journal of Criminology, 35, 149-168.
Excess personal property: Sale or donation for law enforcement activities, § 153-2576a (1997).
Fund, J. (2014, April 18). The United States of SWAT? Retrieved from
http://www.nationalreview.com/article/376053/united-states-swat-john-fund
Gallup. (2015). Confidence in Institutions. Retrieved from
http://www.gallup.com/poll/1597/confidence-institutions.aspx
Gau, J. M., & Brunson, R. K. (2010). Procedural Justice and Order Maintenance Policing: A
Study of Inner‐City Young Men’s Perceptions of Police Legitimacy. Justice
Quarterly, 27(2), 255-279.
Goldstein, J. (2013, August 12). Judge Rejects New York’s Stop-and-Frisk Policy. New York
Times. Retrieved from http://www.nytimes.com/2013/08/13/nyregion/stop-and-frisk-
practice-violated-rights-judge-rules.html
Greene, W. H. (1994). Negative binomial with censoring, truncation, and sample selection. NYU
Working Paper No. EC 94-10, 179-197. doi:10.1017/cbo9780511811852.011
Grennan, S. A. (1987). Findings on the Role of Officer Gender in Violent Encounters with
Citizens. Journal of Police Science and Administration, 15(1), 78-85.
Grossman, L., Owens, C., Finn, W., Mann, D., Davies, T., & L, B. (2015). Police, Camera,
Evidence: Londons Cluster Randomised Controlled Trial of Body Worn Video (Rep.).
Retrieved https://ippsr.msu.edu/research/police-camera-evidence-londons-cluster-
randomised-controlled-trial-body-worn-video

32
Henstock, D. (2015). Testing the Effects of Body Worn Video on Police Use of Force during
Arrest: A Randomised Controlled Trial (Master's thesis, Wolfson College) (pp. 1-107).
Applied Criminology and Police Management.
Hirschel, J. D., Dean, C. W., & Lumb, R. C. (1994). The relative contribution of domestic
violence to assault and injury of police officers. Justice Quarterly, 11(1), 99-117.
Jackson, J., Bradford, B., Hough, M., Myhill, A., Quinton, P., & Tyler, T. R. (2012). Why do
People Comply with the Law?: Legitimacy and the Influence of Legal
Institutions. British Journal of Criminology, 52(6), 1051-1071.
Jackson, J., Huq, A. Z., Bradford, B., & Tyler, T. R. (2013). Monopolizing force? Police
legitimacy and public attitudes toward the acceptability of violence. Psychology, Public
Policy, and Law,19(4), 479-497.
Jost, J. T., Ledgerwood, A., & Hardin, C. D. (2008). Shared Reality, System Justification, and
the Relational Basis of Ideological Beliefs. Social Pers Psych Compass Social and
Personality Psychology Compass, 2(1), 171-186.
Justice, O. O. (n.d.). Research on Body-Worn Cameras and Law Enforcement. Retrieved from
http://www.nij.gov/topics/law-enforcement/technology/pages/body-worn-cameras.aspx
Kachurik, S., Ruiz, J., & Staub, M. (2013). Police officers killed on duty: A different
view. International Journal of Police Science & Management, 15(2), 114-124.
Kaminski, R. J., & Sorensen, D. W. (1995). A multivariate analysis of individual, situational and
environmental factors associated with police assault injuries. American Journal of
Police, 14(3/4), 3-48.
Kaminski, R. J., Edwards, S. M., & Johnson, J. W. (1998). The Deterrent Effects of Oleoresin
Capsicum On Assaults Against Police: Testing the Velcro-Effect Hypothesis. Police
Quarterly, 1(2), 1-20.
Kaminski, R. J., Edwards, S. M., & Johnson, J. W. (1999). Assessing the incapacitative effects of
pepper spray during resistive encounters with the police. Policing Policing: An
International Journal of Police Strategies & Management, 22(1), 7-30.

33
Kaminski, R. J., Jefferis, E., & Gu, J. (2003). Community Correlates of Serious Assaults on
Police. Police Quarterly, 6(2), 119-149.
Kraska, P. B. (2007). Militarization and Policing--Its Relevance to 21st Century
Police. Policing, 1(4), 501-513.
Meeks, D. (2006). Police Militarization in Urban Areas: The Obscure War Against the
Underclass. The Black Scholar, 35(4), 33-41.
Miller, R. L. (1996). Drug warriors and their prey: From police power to police state. Westport,
CT: Praeger.
National Archive of Criminal Justice. (2010, March). Uniform Crime Reporting Statistics.
Retrieved March 20, 2016, from
http://www.ucrdatatool.gov/Search/Crime/State/RunCrimeStatebyState.cfm
National Defense Authorization Act for Fiscal Year 1996, § 110 (1996).
Paternoster, R., Brame, R., Bachman, R., & Sherman, L. W. (1997). Do Fair Procedures Matter?
The Effect of Procedural Justice on Spouse Assault. Law & Society Review, 31(1), 163-
204.
Phillips, S. W. (1994). Oleoresin Capsicum in Buffalo (pp. 1-24, Rep. No. TR-04-95). Buffalo,
NY: Canadian Police Research Centre.
Press, T. A. (2014, December 1). Police need body cameras to build trust with public, Obama
says. Retrieved from
http://www.nola.com/crime/index.ssf/2014/12/obama_police_body_cameras.html
Regens, J., Meyer, C., Swanson, C., Chapman, S., & Wilson, L. (1974). An Analysis of Assaults
on Municipal Police Officers in 46 South Central Cities (pp. 1-23, Rep. No. NCJ
027932). Oklahoma, MI: Bureau of Government Research.
Rezvani, A., Pupovac, J., Eads, D., & Fisher, T. (2014, September 3). MRAPs and bayonets:
What we know about the Pentagon's 1033 Program. NPR. Retrieved from
http://www.npr.org/2014/09/02/342494225/mraps-and-bayonets-what-we-know-about-
the-pentagons-1033-program

34
Robin, G. (1996). The elusive and illuminating search for less-than-lethal alternative to deadly
force. Police Forum, 62, 1-8.
Stanford, R., & Mowry, B. L. (1990). Domestic Disturbance Danger Rate. Journal of Police
Science and Administration, 17(4), 244-249.
Stewart, D. M., & Oliver, W. M. (2014). The Adoption of Homeland Security Initiatives in
Texas Police Departments: A Contextual Perspective. Criminal Justice Review, 1-19.
Swaine, J. (2015, August 11). Ferguson forced to return Humvees as US military gear still flows
to local police. Retrieved from http://www.theguardian.com/us-
news/2015/aug/11/ferguson-protests-police-militarization-humvees
Taylor, B., & Woods, D. J. (2010). Injuries to Officers and Suspects in Police Use-of-Force
Cases: A Quasi-Experimental Evaluation. Police Quarterly.
Toorn, J. V., Tyler, T. R., & Jost, J. T. (2011). More than fair: Outcome dependence, system
justification, and the perceived legitimacy of authority figures. Journal of Experimental
Social Psychology,47(1), 127-138.
Tyler, T. R., & Jackson, J. (2014). Popular legitimacy and the exercise of legal authority:
Motivating compliance, cooperation, and engagement. Psychology, Public Policy, and
Law, 20(1), 78-95.
Tyler, T. R., & Lind, E. A. (1992). A Relational Model of Authority in Groups. Advances in
Experimental Social Psychology Advances in Experimental Social Psychology Volume
25, 115-191.
Tyler, T. R. (2006). Why people obey the law: Procedural justice, legitimacy, and compliance.
Princeton, NJ: Princeton University Press.
Tyler, T. R. (2009). Legitimacy and criminal justice: The benefits of self-regulation. Yale Law
School Legal Scholarship Repository, 307-359.
Tyler, T. R., Jackson, J., & Mentovich, A. (2015). The Consequences of Being an Object of
Suspicion: Potential Pitfalls of Proactive Police Contact. Journal of Empirical Legal
Studies, 12(4), 602-636.

35
Uniform Crime Reporting Program Data: Police Employee (LEOKA) Data, 2011. (2011). ICPSR
Data Holdings. doi:10.3886/icpsr34584
United States Department of Justice. (2014, March 24). Uniform Crime Reporting Program Data:
Police Employee (LEOKA) Data, 2014 (ICPSR 36395). Retrieved from
https://www.icpsr.umich.edu/icpsrweb/ICPSR/studies/36395
U.S. Census Bureau. (n.d.). County Characteristics Datasets: Annual County Resident Population
Estimates by Age, Sex, Race, and Hispanic Origin: April 1, 2010 to July 1, 2014. U.S.
Department of Commerce. Retrieved from
http://www.census.gov/popest/data/counties/asrh/2014/CC-EST2014-ALLDATA.html
Walker, R. (2014, August 15). US police go military with 1033 program | Americas | DW.COM |
15.08.2014. Retrieved from http://www.dw.com/en/us-police-go-military-with-1033-
program/a-17857709
Walshe, S. (2014, August 14). Ferguson is what happens when white suburban cops get weapons
of war. Retrieved from
http://www.theguardian.com/commentisfree/2014/aug/14/ferguson-cops-military-
weapons-michael-brown-shooting-protests
White, M. D., & Ready, J. (2010). The Impact of the Taser on Suspect Resistance: Identifying
Predictors of Effectiveness. Crime & Delinquency, 56(1), 70-102.
White, M. D. (2014). Police officer body worn cameras - Accessing the evidence (Rep. No. GS-
23F-9755H). Retrieved
https://www.ncjrs.gov/App/Publications/abstract.aspx?ID=270041
White, M. D., Ready, J., Riggs, C., Dawes, D. M., Hinz, A., & Ho, J. D. (2012). An Incident-
Level Profile of TASER Device Deployments in Arrest-Related Deaths. Police
Quarterly, 16(1), 85-112.
Wickes, G. C. (2015). Demystifying "Militarization": A partial analysis of the impact of the U.S.
Department of Defense's "1033" equipment transfer program on police officer safety
outcomes(Unpublished master's thesis). Georgetown University.
36
Wilson, J. Q. (1975). Thinking about crime. New York: Basic Books.
Wilson, L. A., Brunk, G. G., & Meyer, C. K. (1990). Situational effects in police officer assaults
- the case of patrol unit size. Police Journal, 63(3), 260-271.
Wofford, T. (2014, August 13). How America’s Police Became an Army: The 1033 Program.
Retrieved from http://www.newsweek.com/how-americas-police-became-army-1033-
program-264537
WVS. (2016). World Value Survey. Retrieved from http://www.worldvaluessurvey.org/