Embed Size (px)
Citation preview

Astronomy & Astrophysics manuscript no. aanda ©ESO 2022January 24, 2022
The Milky Way’s middle-aged inner ringShola M. Wylie1 ?, Jonathan P. Clarke1 , and Ortwin E. Gerhard1
Max-Planck-Institut fur Extraterrestrische Physik, Gießenbachstraße, D-85748 Garching, Germany
Received-; accepted -
ABSTRACT
Aims. We investigate the metallicity, age, and orbital anatomy of the inner Milky Way, specifically focussing on the outer bar region.Methods. We integrated a sample of apogee DR16 inner Galaxy stars in a state of the art bar-bulge potential with a slow pattern speedand investigated the link between the resulting orbits and their [Fe/H] and ages. By superimposing the orbits, we built density, [Fe/H],and age maps of the inner Milky Way, which we divided further using the orbital parameters eccentricity, |Xmax|, and |Zmax|.Results. We find that at low heights from the Galactic plane, the Galactic bar gradually transitions into a radially thick, verticallythin, elongated inner ring with average solar [Fe/H]. This inner ring is mainly composed of stars with AstroNN ages between 4 and 9Gyr with a peak in age between 6 and 8 Gyr, making the average age of the ring ∼6 Gyr. The vertical thickness of the ring decreasesmarkedly towards younger ages. We also find very large L4 Lagrange orbits that have average solar to super-solar metallicities andintermediate ages. Lastly, we confirm a clear X-shape in the [Fe/H] and density distributions at large Galactic heights.Conclusions. The orbital structure obtained for the apogee stars reveals that the Milky Way hosts an inner ring-like structure betweenthe planar bar and corotation. This structure is on average metal rich, intermediately aged, and enhances the horizontal metallicitygradient along the bar’s major axis.
Key words. Galaxy: bulge, disk, structure, abundances, kinematics and dynamics, evolution
1. Introduction
From previous Galactic bulge studies, we know that the stars inthe outer regions of the Galactic bar are on average more metalrich and younger in comparison to the stars in the central bulge(Bovy et al. 2019; Hasselquist et al. 2020; Queiroz et al. 2020).This difference leads to a pronounced horizontal metallicity gra-dient along the bar’s major axis (Wylie et al. 2021). The MilkyWay (MW) is not unique in this structure; bars with ends that aremore metal rich and/or younger than their central regions havebeen observed in a few other galaxies as well (Seidel et al. 2016),including M31 (Gajda et al. 2021).
This gradient structure has several possible origins, one ofwhich is that the bulge and bar were formed from dynamicalinstabilities of coexisting discs with differing scale lengths andmetallicities (Fragkoudi et al. 2018; Wylie et al. 2021). In thisscenario, the most metal-poor discs dominate in the very centralregions due to their shorter scale lengths, while the more metal-rich discs dominate in the outer regions, resulting in a positivehorizontal metallicity gradient. However the MW’s horizontalgradient is likely too steep to be fully explained by this scenario,suggesting that additional mechanisms are at work. To investi-gate this further, we built density, [Fe/H], and age orbital mapsfor a sample of inner Galaxy stars from apogee1 DR16, for whichthese parameters along with their positional and 3D kinematicinformation are available from the ASPCAP2, AstroNN, andGaia DR2 catalogues (García Pérez et al. 2016; Gaia Collabora-tion et al. 2018; Leung & Bovy 2019; Mackereth et al. 2019). Weintegrated the orbits of these stars in a realistic MW bar-bulgepotential from Portail et al. (2017a, hereafter P17) which was
? [email protected] Apache Point Observatory Galactic Evolution Experiment2 APOGEE Stellar Parameter and Chemical Abundance Pipeline
fit to MW star count data derived from the VVV, UKIDSS, and2MASS surveys3 (Saito et al. 2012; Lucas et al. 2008; Skrutskieet al. 2006) by Wegg & Gerhard (2013) and Wegg et al. (2015),and to kinematic data from the BRAVA, ARGOS, and OGLE4
surveys (Kunder et al. 2012; Ness et al. 2013; Rattenbury et al.2007). The favoured model from P17 had a slow pattern speedof Ωb = 39 ± 3.5 km s−1 kpc−1 which puts the corotation radiusof the bar at slightly over 6 kpc. More recent dynamical studiesof both the stellar kinematics in the bar and resonant stars in thesolar neighbourhood have found similar or slightly slower valuesof Ωb (e.g. Bovy et al. 2019; Binney 2020; Chiba & Schönrich2021; Li et al. 2021; Clarke & Gerhard 2021).
As we later see, a mechanism to enhance the horizontal gra-dient in the bar is an inner ring between 4-6 kpc along the bar’smajor axis. This has also been seen in some galaxy models incosmological simulations (Fragkoudi et al. 2020). Inner rings areobserved in a substantial fraction of barred disc galaxies (Kor-mendy 1979; Buta & Combes 1996; Comerón et al. 2014) andtend to be preferentially aligned with the bar. Inner rings ob-served at optical wavelengths generally contain star-forming re-gions (Buta 1995) and are thought to form from the collectionof gas around the bar’s 4:1 resonance (Schwarz 1984; Buta &Combes 1996). Passive rings which no longer form stars can bethicker than active rings, but they are generally seen in earliertype galaxies (≥ Sab, Comerón 2013).
This paper is structured as follows: In Sect.2 we explain, inmore detail, the sample of stars we used, the potential we inte-grated them in, and the assumptions we made. We also comparethe distributions of the apogee stars in heliocentric velocity space
3 Vista Variables in the Via Lactea, UKIRT Infrared Deep Sky Survey,Two Micron All Sky Survey4 Bulge Radial Velocity Assay, Abundances and Radial velocity Galac-tic Origins Survey, Optical Gravitational Lensing Experiment
Article number, page 1 of 8
arX
iv:2
110.
0365
8v2
[as
tro-
ph.G
A]
21
Jan
2022

A&A proofs: manuscript no. aanda
−4 0 4
X (kpc)
−4
0
4Y
(kp
c)
−15
−10
−5
0
µ∗ l
(mas
yr−
1)
Bar
−10
−5
0
5
µb
(mas
yr−
1)
−10 0 10 20
l (deg)
−2
0
2
vL
OS
(10
2km
s−1)
Ring
0 20 40
l (deg)
100
101
102
log(N
ap
o)
105 106 107
log(Nmod)
105 106
log(Nmod)
Fig. 1. Comparisons of the model particles and apogee stars. Top: Barframe density distributions of the model particles (red contours) andapogee stars, both restricted to |b| < 13° and RGC < 7 kpc. The straightgrey lines mark sight lines at longitudes of 0°, ±15°, ±30°, and ±45°and the red star shows the Sun’s position. Bottom: Comparison of theheliocentric velocity distributions of model particles (2D histograms)and apogee stars (red points) with |b| < 3° in the bar region (left column,black ellipse in the top plot) and in a nearby section of a ring around thebar (right column, black arc in the top plot). Dashed and solid lines givethe running means of the model and apogee distributions, respectively.
to predictions from the dynamical model used to generate the po-tential to check that they are consistent. In Sect.3 we show den-sity maps for the model and the apogee stellar orbits, and [Fe/H]and age maps for the apogee orbits selected using spatial sym-metry and orbital eccentricity criteria. We end in Sect.4 with adiscussion of our results and our conclusions.
2. Data and methods
In this work we used stars from the apogee DR16 catalogue(Majewski 2016). For each star, we obtained its [Fe/H] andline-of-sight velocity from the ASPCAP pipeline (García Pérez
et al. 2016; Holtzman et al. 2018; Jönsson et al. 2020) andits RA and Dec proper motions from the Gaia DR2 Cata-logue (Gaia Collaboration et al. 2018). Additionally, we ob-tained a spectrophotometric distance and age for each star fromthe AstroNN catalogue (Leung & Bovy 2019; Mackereth et al.2019). We restricted the sample of stars to those in the apogeemain sample (EXTRATARG flag= 0) with valid ASPCAP[Fe/H], effective temperatures (Teff), surface gravities (log(g)),and [Mg/Fe]. As quality cuts, we also required S/N> 60, AS-PCAP Teff > 3200 K, AstroNN distance errors less than 20%,0 ≤ AstroNN age (Gyr) < 12, and no Star_Bad flag set (23rdbit of ASPCAPFLAG = 0). For the analysis of this work requir-ing the AstroNN ages, we restricted the stars to only those withAstroNN log(g) errors <0.2 dex to remove dwarf stars and As-troNN [Fe/H] > −0.5 dex as recommend by Bovy et al. (2019).Lastly, to focus on the inner MW, we made a spatial cut, re-quiring the stars to have cylindrical distances from the Galacticcentre (GC) RGC < 7 kpc and absolute latitudes (|b|) < 13°. Thisleaves 32, 536 stars in our sample (26,416 in the age sample).We found that when we restricted our sample further by requir-ing the stars to have RA and Dec proper motion errors less than0.5 mas yr−1 and distance errors less than 10% (removes ∼9, 000stars), our main results essentially remained unchanged.
We integrated the orbits of our apogee sample in the ro-tating potential of one of the P17 dynamical bar models. P17adapted these models using the made-to-measure method, suchthat they fitted the red clump density from the VVV, UKIDSS,and 2MASS surveys and the stellar kinematics from the BRAVA,OGLE, and ARGOS surveys. They assumed a bar angle φ =28° and the Sun’s distance from the GC R0 = 8.2 kpc. The darkmatter potential was also adapted during these fits. For the resultsof the work here, we used the P17 model with a pattern speedΩb = 37.5 km s−1 kpc−1, their central disc mass Mc = 2 × 10⁹
M, and mass to red clump star number of 1000 M, as it hasprovided a good match to both the bulge proper motions (Clarkeet al. 2019) and inner Galaxy gas flows (Li et al. 2021). Asa test, we also integrated the apogee stars in P17 models withΩb = 35 km s−1 kpc−1 and Ωb = 40 km s−1 kpc−1, finding that achange in the pattern speed results in quantitative changes to theshapes of the structures we found; however, the main results ofthe paper remain unchanged.
For the orbit integration, we used the inbuilt leap frog in-tegration algorithm (drift-kick-drift with an adaptive time step)of the NMAGIC code (de Lorenzi et al. 2007), integrating ourapogee sample for 2 Gyr and saving each orbit’s trajectory every1 Myr. When transforming the apogee stars to the bar frame andthe model to the heliocentric frame, we took φ = 28° and theSun’s position and 3D velocities to be (RGC, Z)=(8.178 kpc,20.8 pc) and (Vφ,, Vr,, Vz,) = (248.54km s−1, 11.1km s−1,7.25km s−1), respectively (Schönrich et al. 2010; Bennett &Bovy 2019; Gravity Collaboration et al. 2019; Reid & Brunthaler2020). We define the bar frame such that X and Y are along themajor and minor axes of the bar, respectively, with the Sun atnegative X and Y (see red star in the top plot of Fig.1). As anadditional test, we transformed the apogee stars to the bar frameassuming φ = 25° and reran the orbit integration. We found thatwhile there were minor differences in the details, there were nomajor differences in our results.
In the top plot of Fig.1, we show the bar frame density dis-tributions of the model particles and all apogee stars used inthis work. The apogee survey’s spatial selection function (SF)is clearly visible. We therefore checked that the heliocentric ve-locity distributions, that is the longitude and latitude proper mo-tion (µ∗l and µb) and line-of-sight velocity (vLOS ) distributions,
Article number, page 2 of 8

Shola M. Wylie et al.: The Milky Way’s middle-aged inner ring
−1 0 1 2
log(Nmod)-n
−1 0 1 2
log(Napo)−0.3 −0.2 −0.1 0.0
[Fe/H]apo (dex)5.5 6.5 7.5 8.5
Ageapo (Gyr)
Fig. 2. Orbital maps of the model and the apogee stars at different heights above the plane, using only Y-symmetric orbits with −1 ≤ [Fe/H] (dex) <0.5. Left two columns: Density maps built from the superposition of the model (left) and apogee stellar (right) orbits. The model density map hasbeen normalised to a similar scale as the apogee density map using the factor n. Right two columns: Mean [Fe/H] (left) and AstroNN age (right)apogee orbital maps. The top panels show the orbital maps of the stars closer to the plane. In all plots, the red star marks the position of the Sun,while the white dashed lines mark sight lines at the following longitudes: 0°, ±15°, ±30°, and ±45°. The red contours in the apogeemaps show thespecific density levels that were chosen to highlight important features and to guide the eye. The apogee SF has not been corrected for.
are consistent for apogee stars and model particles selected fromsimilar spatial regions in the bar frame. The bottom plots of Fig.1show this comparison for stars with |b| < 3° in the bar and anadjacent section of a ring around the bar, respectively. Here wedefine the bar as an ellipse orientated along X in the bar frame,with a major axis length and an axis ratio of 4 kpc and 0.4, re-spectively. The ring section is defined as the region between twoellipses with major axes of 4 and 6 kpc and with X<−4 kpc andY<0 kpc (see the top plot of Fig.1). This region is well populatedby apogee stars. Fig.1 shows that the model particles and apogeestars generally overlap in heliocentric phase space when selectedfrom similar bar frame spatial regions, and that their mean veloc-ities at each longitude, when well populated, also generally agree(also see Fig. 19 of P17 comparing apogee DR12 with a similarmodel). The model’s standard deviations of the three heliocen-tric velocities at each longitude agree with those of apogee in thebar region, and they are hotter by about 20% in the ring region.We note that the model was not fit to kinematic data in the planarbar region.
3. Results
In Fig.2 we show the orbital maps built for the model particlesand the apogee stars. We restricted the orbits in Fig.2 to thosethat are Y-symmetric (i.e. that spend near-equal amounts of timeon both sides of the Y-axis.) This cut mainly removed L4 andL5 Lagrange orbits, centred at (X,Y) = (0,∼ ± 6) kpc, whichare strongly affected by the apogee spatial SF (discussed later).In the left two columns of Fig.2, we reconstructed the densitydistributions at low and high |Z| (top and bottom rows, respec-tively), traced by the model particles (first column) and apogeestars (second column), by superimposing the orbits of each in the
model potential and treating the orbital time steps as individualstars.
Close to the plane, we see a bar that is roughly 4-5.5 kpclong in both density distributions. As is expected, due to the lackof SF corrections to the apogee data and to likely residual dif-ferences between the model and the MW, the two bars do notcompletely agree. The apogee orbital bar has shallower densitygradients along its major and minor axes and ansae that are notseen in the model. Interestingly, the apogee orbital bar appearsto have a similar structure to that of the metal-rich stars in thePortail et al. (2017b) chemodynamical model (same potential asthe P17 model with Ωb = 40 km s−1 kpc−1), while our model’sorbital bar looks very similar to their model’s full face on pro-jection (shown in their Figs. 1 and 8). At larger heights fromthe plane, the bars in the model and from the apogee orbits bothbecome more elliptical and in better agreement with each other.The X-shape of the bulge is visible in both density maps as twopeaks in the density along the bar’s major axis. These plots showthat the model and the apogee orbits generally agree on the struc-ture of the bar-bulge region, differing only in part of the detailedsubstructure.
The right two columns of Fig.2 show the bulge’s [Fe/H] andAstroNN age distributions built from the superposition of theapogee orbits weighted by their respective densities in each bin.Close to the plane, and in both the [Fe/H] and age maps, cleargradients are seen along the major axis of the bar. In [Fe/H],there is a positive horizontal gradient (∼0.041 dex kpc−1) at low|Z| along the bar’s major axis such that the GC is more [Fe/H]poor than the bar ends, illustrating, in terms of the orbits, thehorizontal gradient measured by Wylie et al. (2021, their Fig.19).The age gradient along the major axis is negative such that the
Article number, page 3 of 8

A&A proofs: manuscript no. aanda
−8−6−4−2
02468
-0.7
5>
[Fe/
H]>
-1Y
(kp
c)
Ecc< 0.4
−8−6−4−2
02468
-0.5>
[Fe/
H]>
-0.7
5Y
(kp
c)
−8−6−4−2
02468
-0.2
5>
[Fe/
H]>
-0.5
Y(k
pc)
−8−6−4−2
02468
0>
[Fe/
H]>
-0.2
5Y
(kp
c)
−8−6−4−2
02468
0.2
5>
[Fe/
H]>
0Y
(kp
c)
−8−6−4−20 2 4 6 8
X (kpc)
−8−6−4−2
02468
0.5>
[Fe/
H]>
0.2
5Y
(kp
c)
Ecc≥ 0.4
−8−6−4−20 2 4 6 8
X (kpc)
−8−6−4−2
02468
2>
Age>
0Y
(kp
c)
Ecc< 0.4
−8−6−4−2
02468
4>
Age>
2Y
(kp
c)−8−6−4−2
02468
6>
Age>
4Y
(kp
c)
−8−6−4−2
02468
8>
Age>
6Y
(kp
c)
−8−6−4−2
02468
10>
Age>
8Y
(kp
c)
−8−6−4−20 2 4 6 8
X (kpc)
−8−6−4−2
02468
12>
Age>
10
Y(k
pc)
Ecc≥ 0.4
−8−6−4−20 2 4 6 8
X (kpc)
0%
10%
20%
30%
40%
50%
Fra
ctio
n
[Fe/H] Age
Fig. 3. Fraction of stars (orbital time steps) along Y-symmetric apogee orbits with |Z| < 0.75 kpc, in different [Fe/H] and age bins that constitutethe disc, ring, and bar. The black curves show the orbital density maps built from all disc and ring stars (Ecc < 0.4) and all bar stars (Ecc ≥ 0.4).The fraction at each position of stars in each [Fe/H] and age bin (rows) composing each structure is shown by the colour. For other plot details seeFig.2.
stars at the ends of the bar are on average younger than the starsat the GC.
In both parameter maps, we see an elliptical ‘inner’ ringaround the bar at low |Z| (and weakly at higher |Z| in [Fe/H]).This ring is solar in mean [Fe/H] and has a mean age of approx-imately 6 Gyr. At larger heights the stars become, on average,more [Fe/H] poor and older due to the vertical gradients in thebulge. In the [Fe/H] map, we see two peaks in [Fe/H] along thebar’s major axis at ±1.5 kpc. These peaks are due to the X-shapeof the boxy/peanut (b/p) bulge (readers are invited to comparealso Figs. 16 and 17 in Wylie et al. 2021).
To investigate the structures seen in Fig.2 further, we dividedthe orbits into bins of [Fe/H] and age, and by low and high cylin-drical eccentricity, defined as follows:
Ecc =max(RGC) −min(RGC)max(RGC) + min(RGC)
. (1)
While the exact eccentricity cut is somewhat arbitrary, we havechosen it at Ecc=0.4 such that it approximately extracts the[Fe/H] rich ring that we see in Fig.2. The density distributionsof the resulting low (< 0.4) and high (≥ 0.4) eccentricity orbitsare shown as black contours in Fig.3. The ring and the disc areclearly visible in the low eccentricity distribution. The ring is
Article number, page 4 of 8
Shola M. Wylie et al.: The Milky Way’s middle-aged inner ring
Total
0.10
0.14
0.18
0.22
0.26
0.30
0.34
0.38
Med
ian|Z|(
kp
c)
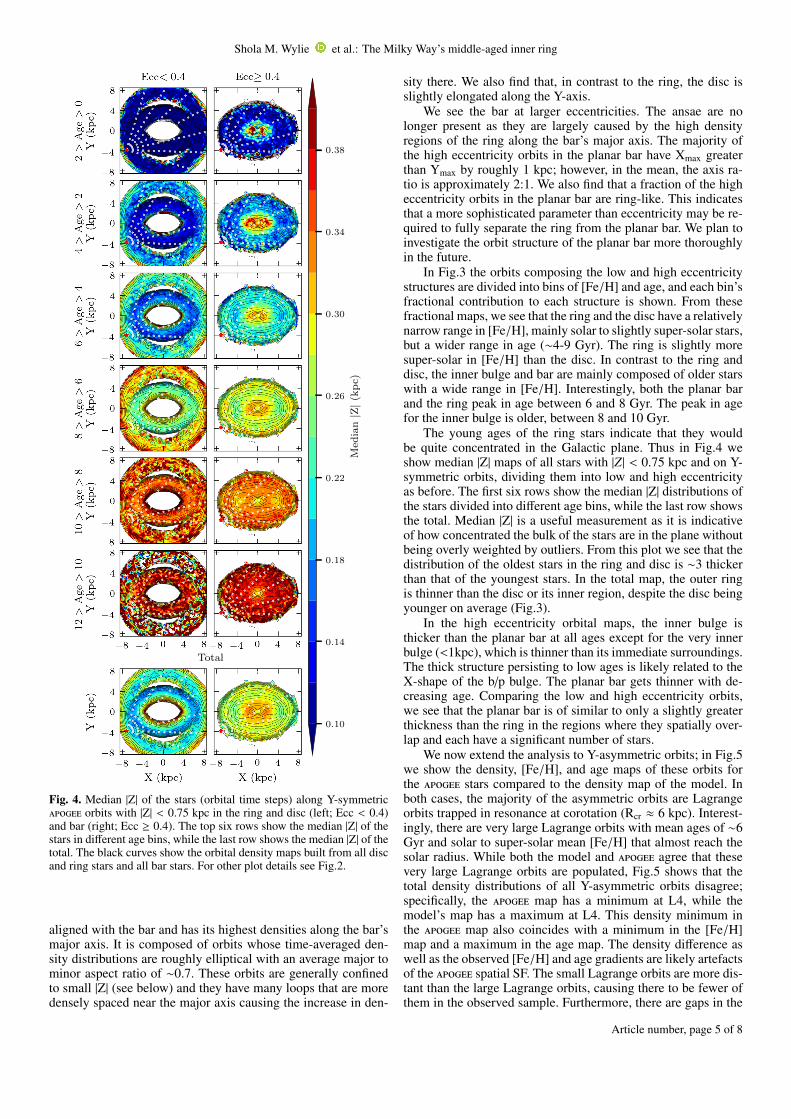
Fig. 4. Median |Z| of the stars (orbital time steps) along Y-symmetricapogee orbits with |Z| < 0.75 kpc in the ring and disc (left; Ecc < 0.4)and bar (right; Ecc ≥ 0.4). The top six rows show the median |Z| of thestars in different age bins, while the last row shows the median |Z| of thetotal. The black curves show the orbital density maps built from all discand ring stars and all bar stars. For other plot details see Fig.2.
aligned with the bar and has its highest densities along the bar’smajor axis. It is composed of orbits whose time-averaged den-sity distributions are roughly elliptical with an average major tominor aspect ratio of ∼0.7. These orbits are generally confinedto small |Z| (see below) and they have many loops that are moredensely spaced near the major axis causing the increase in den-
sity there. We also find that, in contrast to the ring, the disc isslightly elongated along the Y-axis.
We see the bar at larger eccentricities. The ansae are nolonger present as they are largely caused by the high densityregions of the ring along the bar’s major axis. The majority ofthe high eccentricity orbits in the planar bar have Xmax greaterthan Ymax by roughly 1 kpc; however, in the mean, the axis ra-tio is approximately 2:1. We also find that a fraction of the higheccentricity orbits in the planar bar are ring-like. This indicatesthat a more sophisticated parameter than eccentricity may be re-quired to fully separate the ring from the planar bar. We plan toinvestigate the orbit structure of the planar bar more thoroughlyin the future.
In Fig.3 the orbits composing the low and high eccentricitystructures are divided into bins of [Fe/H] and age, and each bin’sfractional contribution to each structure is shown. From thesefractional maps, we see that the ring and the disc have a relativelynarrow range in [Fe/H], mainly solar to slightly super-solar stars,but a wider range in age (∼4-9 Gyr). The ring is slightly moresuper-solar in [Fe/H] than the disc. In contrast to the ring anddisc, the inner bulge and bar are mainly composed of older starswith a wide range in [Fe/H]. Interestingly, both the planar barand the ring peak in age between 6 and 8 Gyr. The peak in agefor the inner bulge is older, between 8 and 10 Gyr.
The young ages of the ring stars indicate that they wouldbe quite concentrated in the Galactic plane. Thus in Fig.4 weshow median |Z| maps of all stars with |Z| < 0.75 kpc and on Y-symmetric orbits, dividing them into low and high eccentricityas before. The first six rows show the median |Z| distributions ofthe stars divided into different age bins, while the last row showsthe total. Median |Z| is a useful measurement as it is indicativeof how concentrated the bulk of the stars are in the plane withoutbeing overly weighted by outliers. From this plot we see that thedistribution of the oldest stars in the ring and disc is ∼3 thickerthan that of the youngest stars. In the total map, the outer ringis thinner than the disc or its inner region, despite the disc beingyounger on average (Fig.3).
In the high eccentricity orbital maps, the inner bulge isthicker than the planar bar at all ages except for the very innerbulge (<1kpc), which is thinner than its immediate surroundings.The thick structure persisting to low ages is likely related to theX-shape of the b/p bulge. The planar bar gets thinner with de-creasing age. Comparing the low and high eccentricity orbits,we see that the planar bar is of similar to only a slightly greaterthickness than the ring in the regions where they spatially over-lap and each have a significant number of stars.
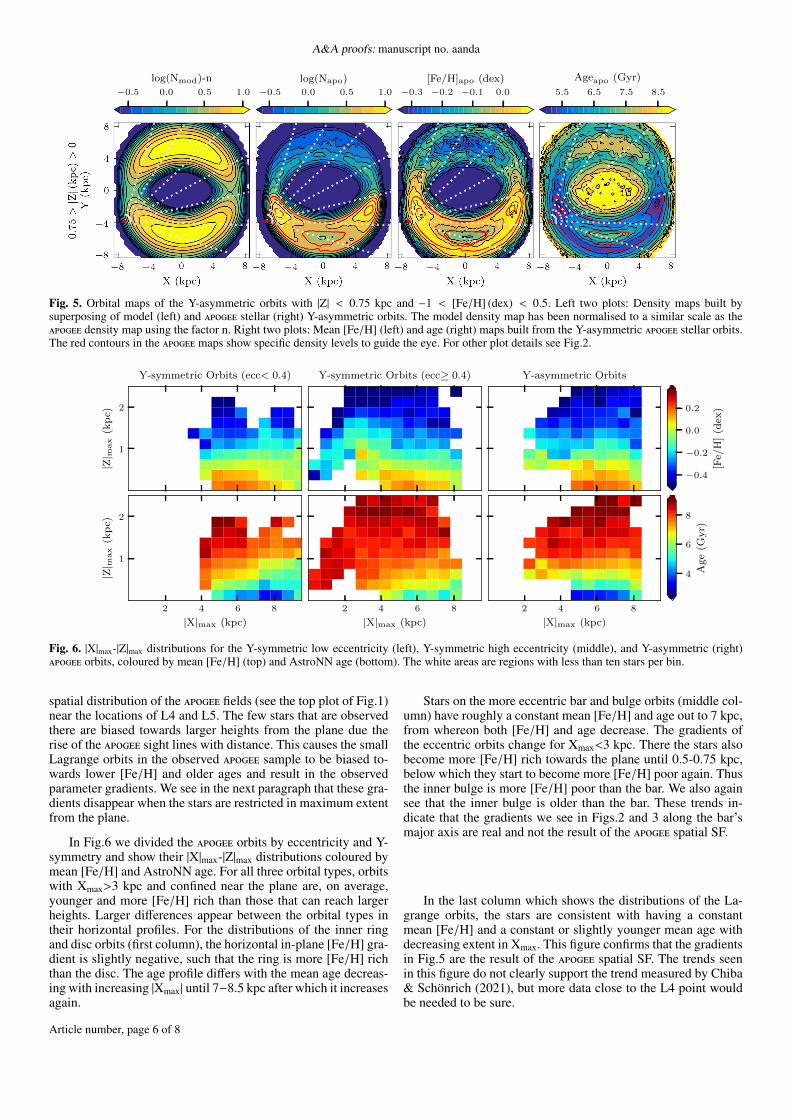
We now extend the analysis to Y-asymmetric orbits; in Fig.5we show the density, [Fe/H], and age maps of these orbits forthe apogee stars compared to the density map of the model. Inboth cases, the majority of the asymmetric orbits are Lagrangeorbits trapped in resonance at corotation (Rcr ≈ 6 kpc). Interest-ingly, there are very large Lagrange orbits with mean ages of ∼6Gyr and solar to super-solar mean [Fe/H] that almost reach thesolar radius. While both the model and apogee agree that thesevery large Lagrange orbits are populated, Fig.5 shows that thetotal density distributions of all Y-asymmetric orbits disagree;specifically, the apogee map has a minimum at L4, while themodel’s map has a maximum at L4. This density minimum inthe apogee map also coincides with a minimum in the [Fe/H]map and a maximum in the age map. The density difference aswell as the observed [Fe/H] and age gradients are likely artefactsof the apogee spatial SF. The small Lagrange orbits are more dis-tant than the large Lagrange orbits, causing there to be fewer ofthem in the observed sample. Furthermore, there are gaps in the
Article number, page 5 of 8
A&A proofs: manuscript no. aanda
−0.5 0.0 0.5 1.0
log(Nmod)-n
−0.5 0.0 0.5 1.0
log(Napo)−0.3 −0.2 −0.1 0.0
[Fe/H]apo (dex)5.5 6.5 7.5 8.5
Ageapo (Gyr)
Fig. 5. Orbital maps of the Y-asymmetric orbits with |Z| < 0.75 kpc and −1 < [Fe/H] (dex) < 0.5. Left two plots: Density maps built bysuperposing of model (left) and apogee stellar (right) Y-asymmetric orbits. The model density map has been normalised to a similar scale as theapogee density map using the factor n. Right two plots: Mean [Fe/H] (left) and age (right) maps built from the Y-asymmetric apogee stellar orbits.The red contours in the apogee maps show specific density levels to guide the eye. For other plot details see Fig.2.
1
2
|Z| m
ax
(kp
c)
Y-symmetric Orbits (ecc< 0.4) Y-symmetric Orbits (ecc≥ 0.4) Y-asymmetric Orbits
2 4 6 8
|X|max (kpc)
1
2
|Z| m
ax
(kp
c)
2 4 6 8
|X|max (kpc)
2 4 6 8
|X|max (kpc)
−0.4
−0.2
0.0
0.2
[Fe/
H]
(dex
)
4
6
8
Age
(Gyr)
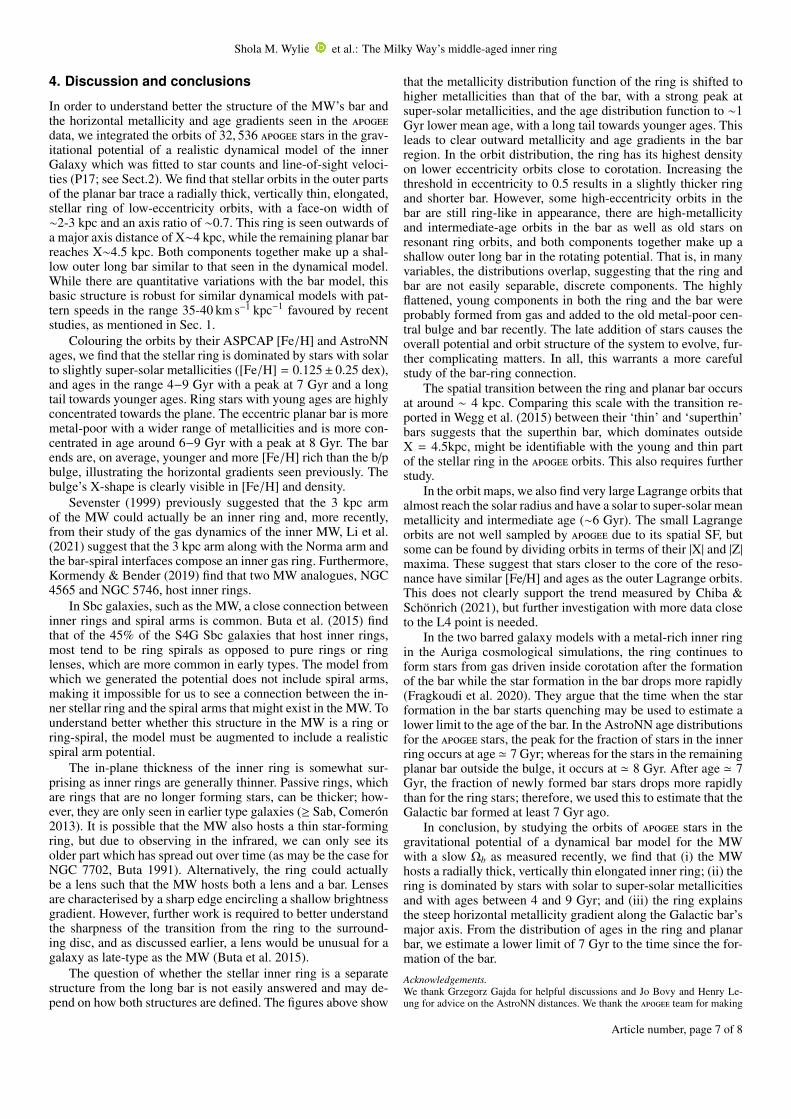
Fig. 6. |X|max-|Z|max distributions for the Y-symmetric low eccentricity (left), Y-symmetric high eccentricity (middle), and Y-asymmetric (right)apogee orbits, coloured by mean [Fe/H] (top) and AstroNN age (bottom). The white areas are regions with less than ten stars per bin.
spatial distribution of the apogee fields (see the top plot of Fig.1)near the locations of L4 and L5. The few stars that are observedthere are biased towards larger heights from the plane due therise of the apogee sight lines with distance. This causes the smallLagrange orbits in the observed apogee sample to be biased to-wards lower [Fe/H] and older ages and result in the observedparameter gradients. We see in the next paragraph that these gra-dients disappear when the stars are restricted in maximum extentfrom the plane.
In Fig.6 we divided the apogee orbits by eccentricity and Y-symmetry and show their |X|max-|Z|max distributions coloured bymean [Fe/H] and AstroNN age. For all three orbital types, orbitswith Xmax>3 kpc and confined near the plane are, on average,younger and more [Fe/H] rich than those that can reach largerheights. Larger differences appear between the orbital types intheir horizontal profiles. For the distributions of the inner ringand disc orbits (first column), the horizontal in-plane [Fe/H] gra-dient is slightly negative, such that the ring is more [Fe/H] richthan the disc. The age profile differs with the mean age decreas-ing with increasing |Xmax| until 7−8.5 kpc after which it increasesagain.
Stars on the more eccentric bar and bulge orbits (middle col-umn) have roughly a constant mean [Fe/H] and age out to 7 kpc,from whereon both [Fe/H] and age decrease. The gradients ofthe eccentric orbits change for Xmax<3 kpc. There the stars alsobecome more [Fe/H] rich towards the plane until 0.5-0.75 kpc,below which they start to become more [Fe/H] poor again. Thusthe inner bulge is more [Fe/H] poor than the bar. We also againsee that the inner bulge is older than the bar. These trends in-dicate that the gradients we see in Figs.2 and 3 along the bar’smajor axis are real and not the result of the apogee spatial SF.
In the last column which shows the distributions of the La-grange orbits, the stars are consistent with having a constantmean [Fe/H] and a constant or slightly younger mean age withdecreasing extent in Xmax. This figure confirms that the gradientsin Fig.5 are the result of the apogee spatial SF. The trends seenin this figure do not clearly support the trend measured by Chiba& Schönrich (2021), but more data close to the L4 point wouldbe needed to be sure.
Article number, page 6 of 8
Shola M. Wylie et al.: The Milky Way’s middle-aged inner ring
4. Discussion and conclusions
In order to understand better the structure of the MW’s bar andthe horizontal metallicity and age gradients seen in the apogeedata, we integrated the orbits of 32, 536 apogee stars in the grav-itational potential of a realistic dynamical model of the innerGalaxy which was fitted to star counts and line-of-sight veloci-ties (P17; see Sect.2). We find that stellar orbits in the outer partsof the planar bar trace a radially thick, vertically thin, elongated,stellar ring of low-eccentricity orbits, with a face-on width of∼2-3 kpc and an axis ratio of ∼0.7. This ring is seen outwards ofa major axis distance of X∼4 kpc, while the remaining planar barreaches X∼4.5 kpc. Both components together make up a shal-low outer long bar similar to that seen in the dynamical model.While there are quantitative variations with the bar model, thisbasic structure is robust for similar dynamical models with pat-tern speeds in the range 35-40 km s−1 kpc−1 favoured by recentstudies, as mentioned in Sec. 1.
Colouring the orbits by their ASPCAP [Fe/H] and AstroNNages, we find that the stellar ring is dominated by stars with solarto slightly super-solar metallicities ([Fe/H] = 0.125± 0.25 dex),and ages in the range 4−9 Gyr with a peak at 7 Gyr and a longtail towards younger ages. Ring stars with young ages are highlyconcentrated towards the plane. The eccentric planar bar is moremetal-poor with a wider range of metallicities and is more con-centrated in age around 6−9 Gyr with a peak at 8 Gyr. The barends are, on average, younger and more [Fe/H] rich than the b/pbulge, illustrating the horizontal gradients seen previously. Thebulge’s X-shape is clearly visible in [Fe/H] and density.
Sevenster (1999) previously suggested that the 3 kpc armof the MW could actually be an inner ring and, more recently,from their study of the gas dynamics of the inner MW, Li et al.(2021) suggest that the 3 kpc arm along with the Norma arm andthe bar-spiral interfaces compose an inner gas ring. Furthermore,Kormendy & Bender (2019) find that two MW analogues, NGC4565 and NGC 5746, host inner rings.
In Sbc galaxies, such as the MW, a close connection betweeninner rings and spiral arms is common. Buta et al. (2015) findthat of the 45% of the S4G Sbc galaxies that host inner rings,most tend to be ring spirals as opposed to pure rings or ringlenses, which are more common in early types. The model fromwhich we generated the potential does not include spiral arms,making it impossible for us to see a connection between the in-ner stellar ring and the spiral arms that might exist in the MW. Tounderstand better whether this structure in the MW is a ring orring-spiral, the model must be augmented to include a realisticspiral arm potential.
The in-plane thickness of the inner ring is somewhat sur-prising as inner rings are generally thinner. Passive rings, whichare rings that are no longer forming stars, can be thicker; how-ever, they are only seen in earlier type galaxies (≥ Sab, Comerón2013). It is possible that the MW also hosts a thin star-formingring, but due to observing in the infrared, we can only see itsolder part which has spread out over time (as may be the case forNGC 7702, Buta 1991). Alternatively, the ring could actuallybe a lens such that the MW hosts both a lens and a bar. Lensesare characterised by a sharp edge encircling a shallow brightnessgradient. However, further work is required to better understandthe sharpness of the transition from the ring to the surround-ing disc, and as discussed earlier, a lens would be unusual for agalaxy as late-type as the MW (Buta et al. 2015).
The question of whether the stellar inner ring is a separatestructure from the long bar is not easily answered and may de-pend on how both structures are defined. The figures above show
that the metallicity distribution function of the ring is shifted tohigher metallicities than that of the bar, with a strong peak atsuper-solar metallicities, and the age distribution function to ∼1Gyr lower mean age, with a long tail towards younger ages. Thisleads to clear outward metallicity and age gradients in the barregion. In the orbit distribution, the ring has its highest densityon lower eccentricity orbits close to corotation. Increasing thethreshold in eccentricity to 0.5 results in a slightly thicker ringand shorter bar. However, some high-eccentricity orbits in thebar are still ring-like in appearance, there are high-metallicityand intermediate-age orbits in the bar as well as old stars onresonant ring orbits, and both components together make up ashallow outer long bar in the rotating potential. That is, in manyvariables, the distributions overlap, suggesting that the ring andbar are not easily separable, discrete components. The highlyflattened, young components in both the ring and the bar wereprobably formed from gas and added to the old metal-poor cen-tral bulge and bar recently. The late addition of stars causes theoverall potential and orbit structure of the system to evolve, fur-ther complicating matters. In all, this warrants a more carefulstudy of the bar-ring connection.
The spatial transition between the ring and planar bar occursat around ∼ 4 kpc. Comparing this scale with the transition re-ported in Wegg et al. (2015) between their ‘thin’ and ‘superthin’bars suggests that the superthin bar, which dominates outsideX = 4.5kpc, might be identifiable with the young and thin partof the stellar ring in the apogee orbits. This also requires furtherstudy.
In the orbit maps, we also find very large Lagrange orbits thatalmost reach the solar radius and have a solar to super-solar meanmetallicity and intermediate age (∼6 Gyr). The small Lagrangeorbits are not well sampled by apogee due to its spatial SF, butsome can be found by dividing orbits in terms of their |X| and |Z|maxima. These suggest that stars closer to the core of the reso-nance have similar [Fe/H] and ages as the outer Lagrange orbits.This does not clearly support the trend measured by Chiba &Schönrich (2021), but further investigation with more data closeto the L4 point is needed.
In the two barred galaxy models with a metal-rich inner ringin the Auriga cosmological simulations, the ring continues toform stars from gas driven inside corotation after the formationof the bar while the star formation in the bar drops more rapidly(Fragkoudi et al. 2020). They argue that the time when the starformation in the bar starts quenching may be used to estimate alower limit to the age of the bar. In the AstroNN age distributionsfor the apogee stars, the peak for the fraction of stars in the innerring occurs at age ' 7 Gyr; whereas for the stars in the remainingplanar bar outside the bulge, it occurs at ' 8 Gyr. After age ' 7Gyr, the fraction of newly formed bar stars drops more rapidlythan for the ring stars; therefore, we used this to estimate that theGalactic bar formed at least 7 Gyr ago.
In conclusion, by studying the orbits of apogee stars in thegravitational potential of a dynamical bar model for the MWwith a slow Ωb as measured recently, we find that (i) the MWhosts a radially thick, vertically thin elongated inner ring; (ii) thering is dominated by stars with solar to super-solar metallicitiesand with ages between 4 and 9 Gyr; and (iii) the ring explainsthe steep horizontal metallicity gradient along the Galactic bar’smajor axis. From the distribution of ages in the ring and planarbar, we estimate a lower limit of 7 Gyr to the time since the for-mation of the bar.
Acknowledgements.We thank Grzegorz Gajda for helpful discussions and Jo Bovy and Henry Le-ung for advice on the AstroNN distances. We thank the apogee team for making
Article number, page 7 of 8

A&A proofs: manuscript no. aanda
the apogee DR16 catalogue publicly available. Funding for the Sloan Digital SkySurvey IV has been provided by the Alfred P. Sloan Foundation, the U.S. Depart-ment of Energy Office of Science, and the Participating Institutions. This workhas made use of data from the European Space Agency (ESA) mission Gaia(https://www.cosmos.esa.int/gaia), processed by the Gaia Data Process-ing and Analysis Consortium (DPAC, https://www.cosmos.esa.int/web/gaia/dpac/consortium). Funding for the DPAC has been provided by na-tional institutions, in particular the institutions participating in the Gaia Mul-tilateral Agreement.
ORCID iDs
S.M. Wylie https://orcid.org/0000-0001-9116-6767J.P. Clarke https://orcid.org/0000-0002-2243-178XO.E. Gerhard https://orcid.org/0000-0003-3333-0033
ReferencesBennett, M. & Bovy, J. 2019, MNRAS, 482, 1417Binney, J. 2020, Monthly Notices of the Royal Astronomical Society, 495, 895Bovy, J., Leung, H. W., Hunt, J. A. S., et al. 2019, MNRAS, 490, 4740Buta, R. 1991, ApJ, 370, 130Buta, R. 1995, ApJS, 96, 39Buta, R. & Combes, F. 1996, Fund. Cosmic Phys., 17, 95Buta, R. J., Sheth, K., Athanassoula, E., et al. 2015, ApJS, 217, 32Chiba, R. & Schönrich, R. 2021, MNRAS, 505, 2412Clarke, J. & Gerhard, O. 2021, arXiv e-prints, arXiv:2107.10875Clarke, J. P., Wegg, C., Gerhard, O., et al. 2019, MNRAS, 489, 3519Comerón, S. 2013, A&A, 555, L4Comerón, S., Salo, H., Laurikainen, E., et al. 2014, A&A, 562, A121de Lorenzi, F., Debattista, V. P., Gerhard, O., & Sambhus, N. 2007, MNRAS,
376, 71Fragkoudi, F., Di Matteo, P., Haywood, M., et al. 2018, A&A, 616, A180Fragkoudi, F., Grand, R. J. J., Pakmor, R., et al. 2020, MNRAS, 494, 5936Gaia Collaboration, Brown, A. G. A., Vallenari, A., et al. 2018, A&A, 616, A1Gajda, G., Gerhard, O., Blaña, M., et al. 2021, A&A, 647, A131García Pérez, A. E., Prieto, C. A., Holtzman, J. A., et al. 2016, AJ, 151, 144Gravity Collaboration, Abuter, R., Amorim, A., et al. 2019, A&A, 625, L10Hasselquist, S., Zasowski, G., Feuillet, D. K., et al. 2020, ApJ, 901, 109Holtzman, J. A., Hasselquist, S., Shetrone, M., et al. 2018, AJ, 156, 125Jönsson, H., Holtzman, J. A., Allende Prieto, C., et al. 2020, AJ, 160, 120Kormendy, J. 1979, ApJ, 227, 714Kormendy, J. & Bender, R. 2019, ApJ, 872, 106Kunder, A., Koch, A., Rich, R. M., et al. 2012, AJ, 143, 57Leung, H. W. & Bovy, J. 2019, MNRAS, 489, 2079Li, Z., Shen, J., Gerhard, O., & Clarke, J. P. 2021, arXiv e-prints,
arXiv:2103.10342Lucas, P. W., Hoare, M. G., Longmore, A., et al. 2008, MNRAS, 391, 136Mackereth, J. T., Bovy, J., Leung, H. W., et al. 2019, MNRAS, 489, 176Majewski, S. 2016, Astronomische Nachrichten, 337, 863Ness, M., Freeman, K., Athanassoula, E., et al. 2013, MNRAS, 432, 2092Portail, M., Gerhard, O., Wegg, C., & Ness, M. 2017a, MNRAS, 465, 1621Portail, M., Wegg, C., Gerhard, O., & Ness, M. 2017b, MNRAS, 470, 1233Queiroz, A. B. A., Chiappini, C., Perez-Villegas, A., et al. 2020, arXiv e-prints,
arXiv:2007.12915Rattenbury, N. J., Mao, S., Debattista, V. P., et al. 2007, MNRAS, 378, 1165Reid, M. J. & Brunthaler, A. 2020, ApJ, 892, 39Saito, R. K., Hempel, M., Minniti, D., et al. 2012, A&A, 537, A107Schönrich, R., Binney, J., & Dehnen, W. 2010, MNRAS, 403, 1829Schwarz, M. P. 1984, MNRAS, 209, 93Seidel, M. K., Falcón-Barroso, J., Martínez-Valpuesta, I., et al. 2016, MNRAS,
460, 3784Sevenster, M. N. 1999, MNRAS, 310, 629Skrutskie, M. F., Cutri, R. M., Stiening, R., et al. 2006, The Astronomical Jour-
nal, 131, 1163Wegg, C. & Gerhard, O. 2013, MNRAS, 435, 1874Wegg, C., Gerhard, O., & Portail, M. 2015, MNRAS, 450, 4050Wylie, S. M., Gerhard, O. E., Ness, M. K., et al. 2021, A&A, 653, A143
Article number, page 8 of 8