Embed Size (px)
Citation preview
The Minnesota Utility Data Book
A Reference Guide to Minnesota Electric and Natural-Gas Utilities
1965-2009
This document is made available electronically by the Minnesota Legislative Reference Library as part of an ongoing digital archiving project. http://www.leg.state.mn.us/lrl/lrl.asp
1
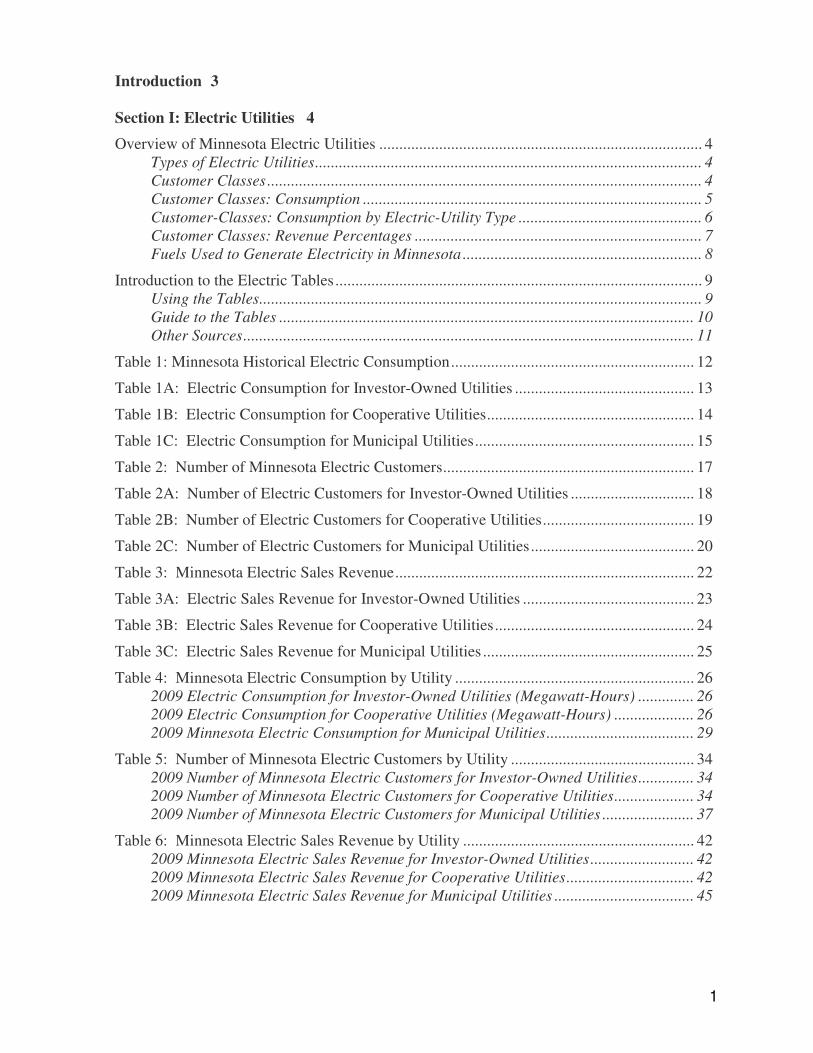
Introduction 3
Section I: Electric Utilities 4
Overview of Minnesota Electric Utilities ................................................................................. 4 Types of Electric Utilities ................................................................................................. 4
Customer Classes ............................................................................................................. 4
Customer Classes: Consumption ..................................................................................... 5
Customer-Classes: Consumption by Electric-Utility Type .............................................. 6
Customer Classes: Revenue Percentages ........................................................................ 7
Fuels Used to Generate Electricity in Minnesota ............................................................ 8
Introduction to the Electric Tables ............................................................................................ 9 Using the Tables ............................................................................................................... 9
Guide to the Tables ........................................................................................................ 10
Other Sources ................................................................................................................. 11
Table 1: Minnesota Historical Electric Consumption ............................................................. 12
Table 1A: Electric Consumption for Investor-Owned Utilities ............................................. 13
Table 1B: Electric Consumption for Cooperative Utilities .................................................... 14
Table 1C: Electric Consumption for Municipal Utilities ....................................................... 15
Table 2: Number of Minnesota Electric Customers ............................................................... 17
Table 2A: Number of Electric Customers for Investor-Owned Utilities ............................... 18
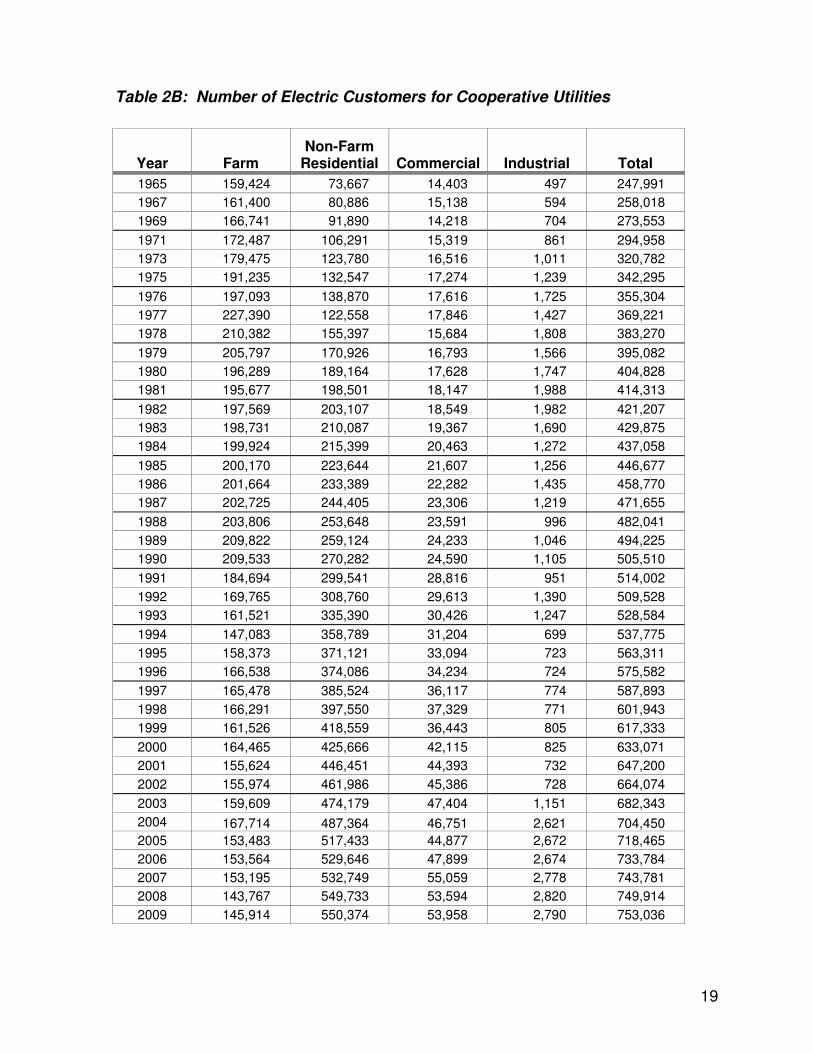
Table 2B: Number of Electric Customers for Cooperative Utilities ...................................... 19
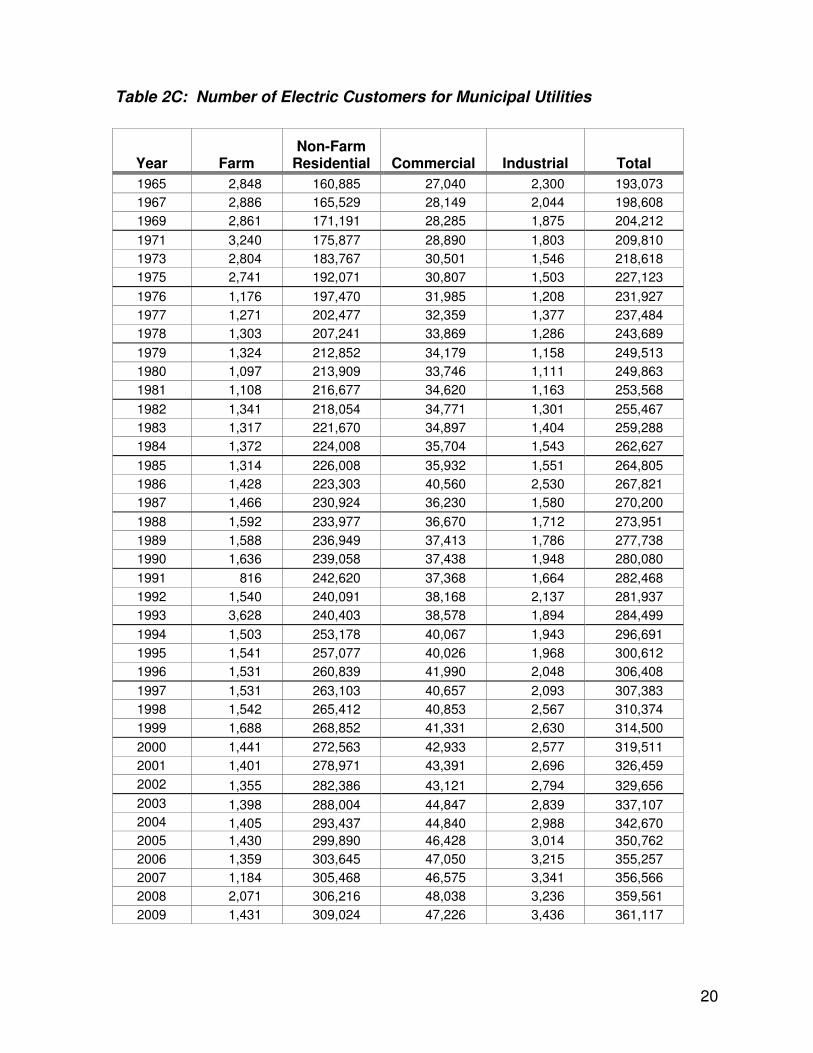
Table 2C: Number of Electric Customers for Municipal Utilities ......................................... 20
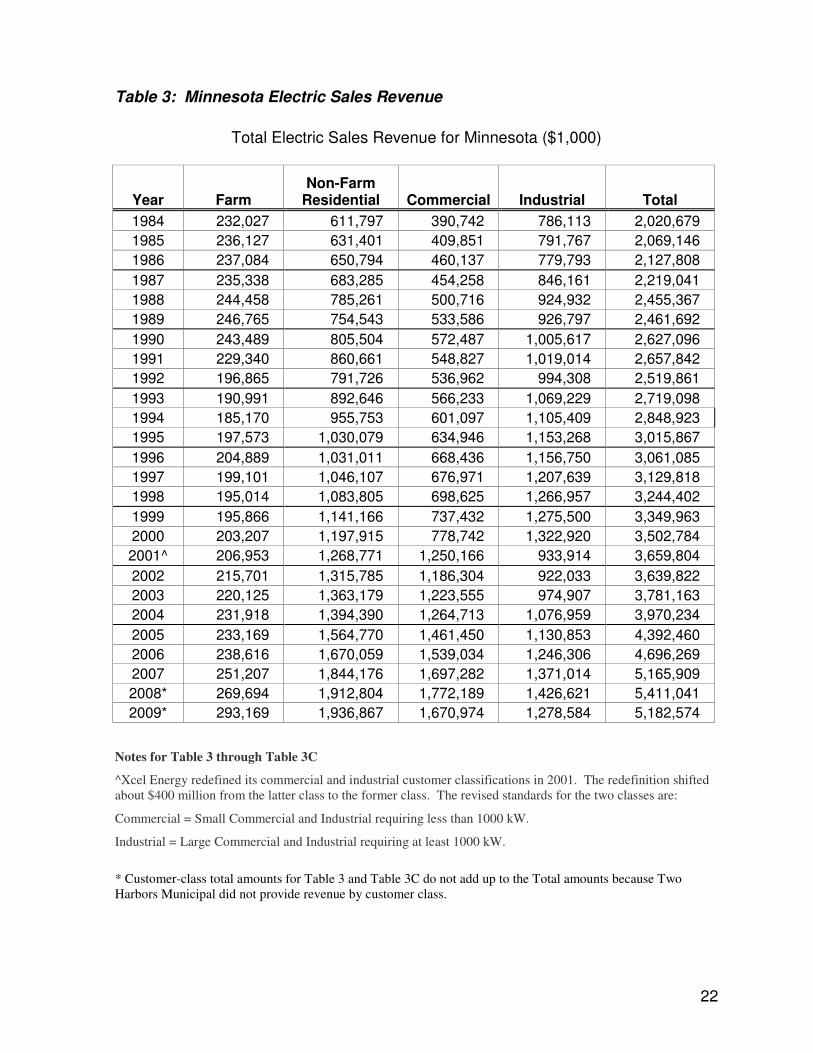
Table 3: Minnesota Electric Sales Revenue ........................................................................... 22
Table 3A: Electric Sales Revenue for Investor-Owned Utilities ........................................... 23
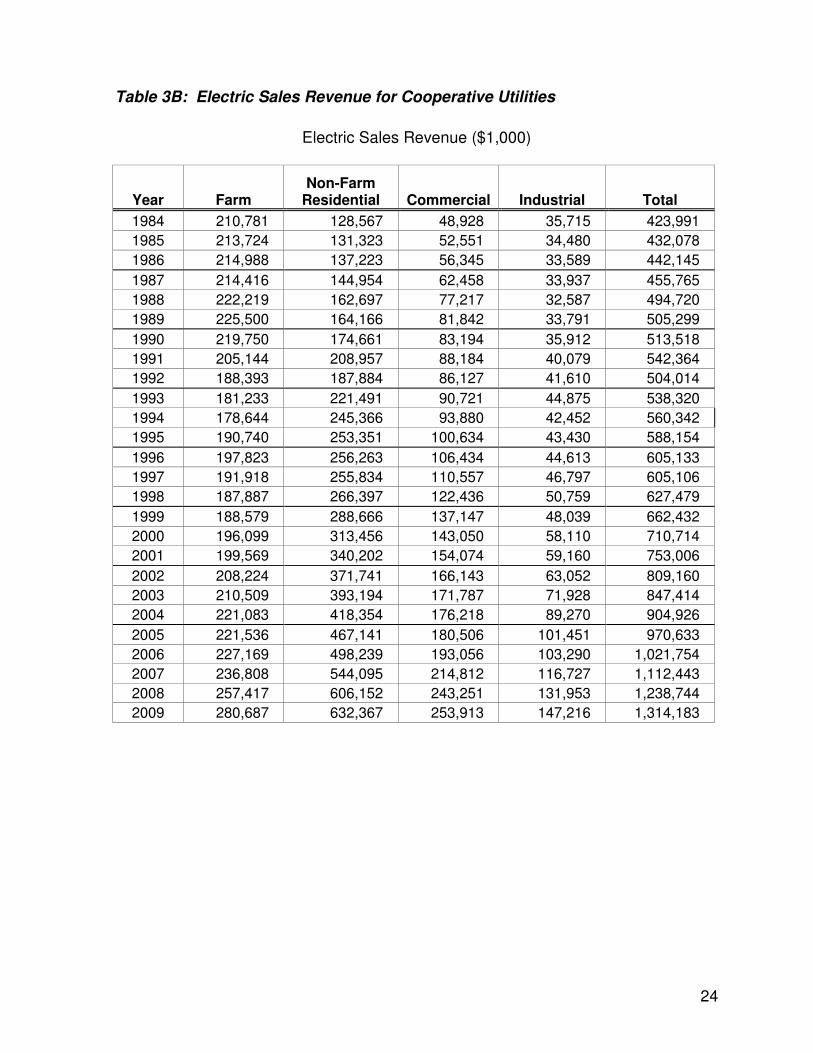
Table 3B: Electric Sales Revenue for Cooperative Utilities .................................................. 24
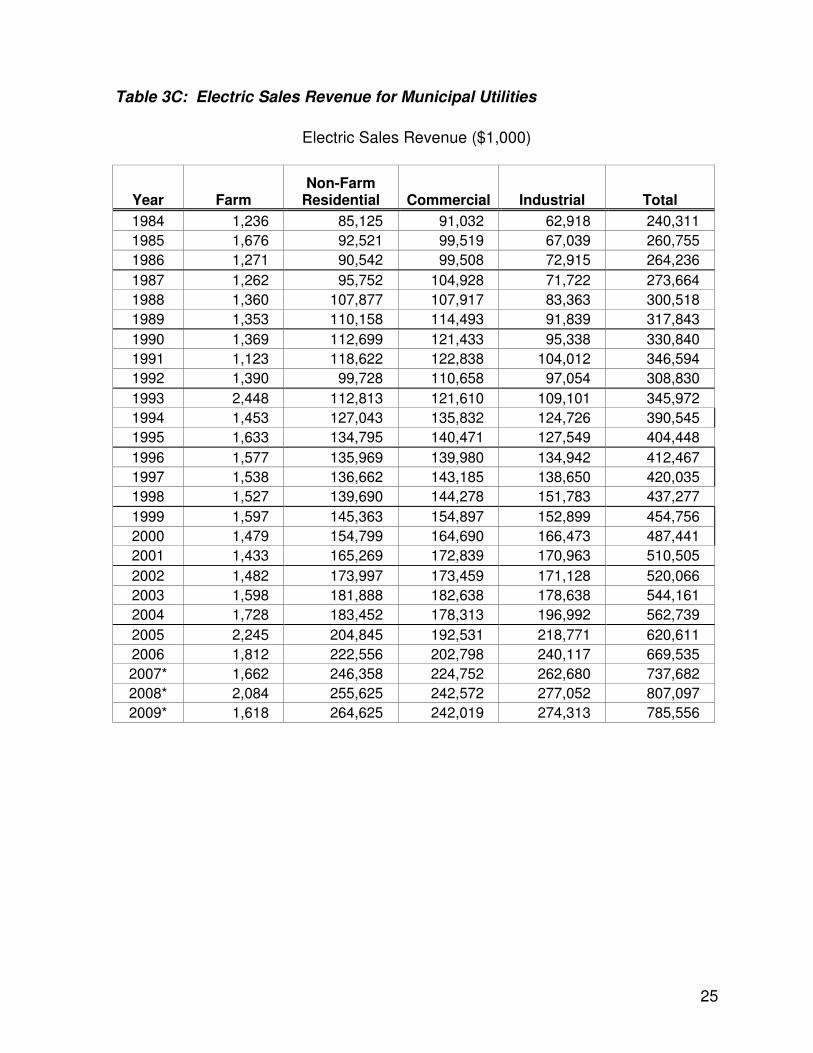
Table 3C: Electric Sales Revenue for Municipal Utilities ..................................................... 25
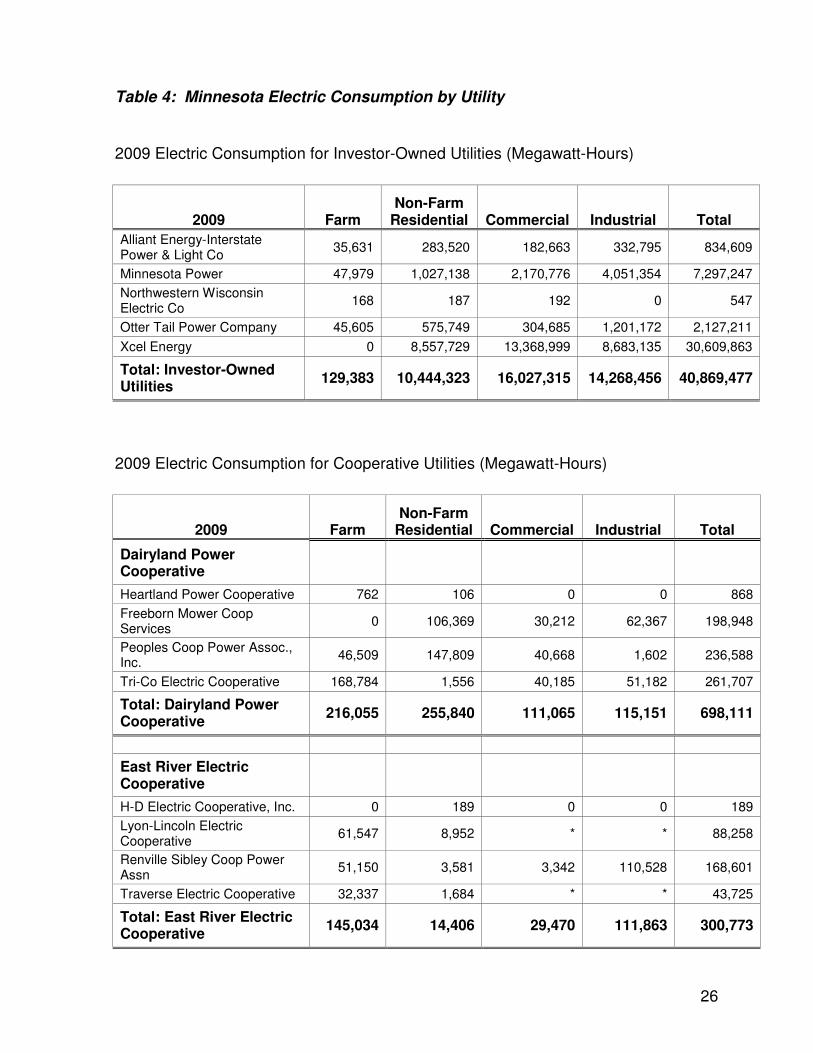
Table 4: Minnesota Electric Consumption by Utility ............................................................ 26 2009 Electric Consumption for Investor-Owned Utilities (Megawatt-Hours) .............. 26
2009 Electric Consumption for Cooperative Utilities (Megawatt-Hours) .................... 26
2009 Minnesota Electric Consumption for Municipal Utilities ..................................... 29
Table 5: Number of Minnesota Electric Customers by Utility .............................................. 34 2009 Number of Minnesota Electric Customers for Investor-Owned Utilities .............. 34
2009 Number of Minnesota Electric Customers for Cooperative Utilities .................... 34
2009 Number of Minnesota Electric Customers for Municipal Utilities ....................... 37
Table 6: Minnesota Electric Sales Revenue by Utility .......................................................... 42 2009 Minnesota Electric Sales Revenue for Investor-Owned Utilities .......................... 42
2009 Minnesota Electric Sales Revenue for Cooperative Utilities ................................ 42
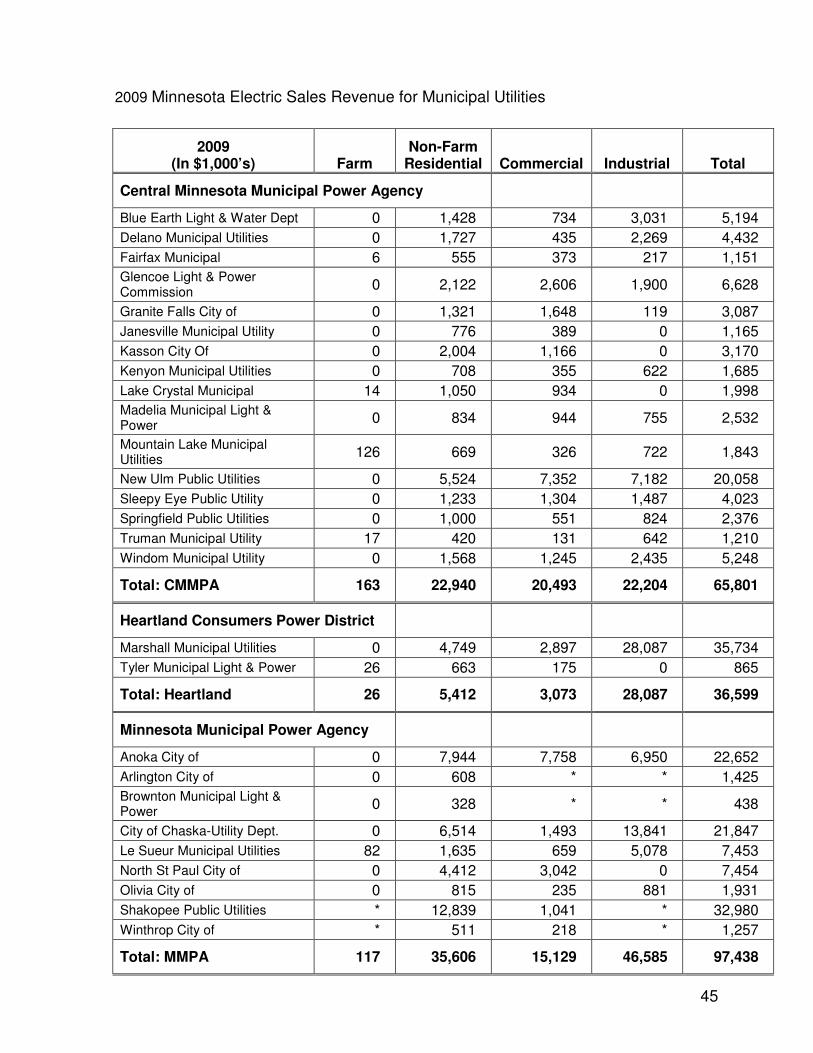
2009 Minnesota Electric Sales Revenue for Municipal Utilities ................................... 45
2
Table 7: Minnesota Residential Electric Space Heating Customers ...................................... 50 2009 Minnesota Electric Space Heating Customers for Investor-Owned Utilities ....... 50
2009 Minnesota Electric Space Heating Customers for Cooperative Utilities ............. 50
2009 Minnesota Electric Space Heating Customers for Municipal Utilities ................. 53
Table 8: Minnesota Electric Consumption by County ........................................................... 57
Table 9: Utility-Owned Electric Generating Plants Serving Minnesota ................................ 60
Table 10: Net Generation and Fuel Consumption for Utility-Owned Electric Generating Plants Serving Minnesota ......................................... 92 Section II: Natural Gas Utilities 133
Overview ............................................................................................................................... 133 Types of Natural-Gas Utilities ..................................................................................... 133
Relative Size of Regulated Utilities .............................................................................. 133
Natural-Gas Deliveries by Customer Class in 2009 .................................................... 134
Trends in Natural-Gas Consumption by Customer Class, 1965-2009 ........................ 135
Introduction to the Natural Gas Tables ................................................................................. 136 Use per Residential Customer ...................................................................................... 136
Other Sources ............................................................................................................... 137
Table 11: Total Minnesota Historical Natural Gas Consumption ........................................ 138
Table 12: Number of Minnesota Natural Gas Customers .................................................... 141
Table 13: Minnesota Natural Gas Consumption by Company ............................................ 143
Table 14: Minnesota Natural Gas Customers by Company ................................................. 145
Table 15: Minnesota Natural Gas Revenue by Company .................................................... 147 Section III: Attachments 150
General Notes on Data .......................................................................................................... 150
Glossary of Terms and Abbreviations................................................................................... 151
3
Introduction The Minnesota Department of Commerce regulates the financial services industries and promotes and implements policies regarding energy and telecommunications. We work with other state agencies to provide education, information and programs to the public and work to enhance Minnesota's environment and quality of life. This report is one tool in that process.
The Minnesota Utility Data Book (or Data Book) compiles information reported by electric and natural-gas utilities serving Minnesota. Most of Minnesota's energy use occurs through service provided by various investor-owned, cooperative and municipal and private utilities. To track energy trends, the Minnesota Department of Commerce’s Division of Energy Resources uses data in its Regional Energy Information System (REIS), which contains information collected through Minnesota Rules parts 7610.0100 to 7610.1130.
The 2009 Minnesota Utility Data Book provides aggregate information reported by Minnesota utilities through 2009. It also provides data reported by individual companies for the year 2009.
The tables in this report may use certain assumptions that are not obvious to the reader. Where feasible, this report lists assumptions at the end of tables or in the General Notes on Data section.
Staff members contributing to the preparation of this report include Steve Loomis, Theresa Staples, and Dr. Marlon Griffing. If you have any questions about the report, please contact Marlon Griffing at 651-297-3900.
We hope that the 2009 Minnesota Utility Data Book will promote discussion, inquiries and interest about energy consumed through Minnesota's natural-gas and electric utilities. To obtain this report in an alternative format (i.e., large print, Braille, CD-ROM), please see our website at http://www.commerce.state.mn.us or call our Energy Information Center at 651-296-5175. If you are outside the Twin Cities area, please dial 1-800-657-3710. Our TAM toll free number is 1-800-657-3599. The Information Center may also be contacted through e-mail at: [email protected].
4
Section I: Electric Utilities
Overview of Minnesota Electric Utilities
Minnesota’s electric utilities are classified as investor-owned utilities (IOUs), cooperative utilities (co-ops), or municipal utilities (munis). The Minnesota Public Utilities Commission regulates the rates of all IOUs. Co-ops’ and munis’ rates are not regulated by the state unless they choose such regulation (see Minn. Stat. §216B.01). Dakota Electric Association is the only utility that has chosen such regulation. Otherwise, municipal utilities are effectively regulated by the residents of the municipalities which own and operate them, and cooperative electric associations are presently effectively regulated and controlled by the membership under the provisions of Minn. Stat. §308A, which addresses cooperatives.
Types of Electric Utilities
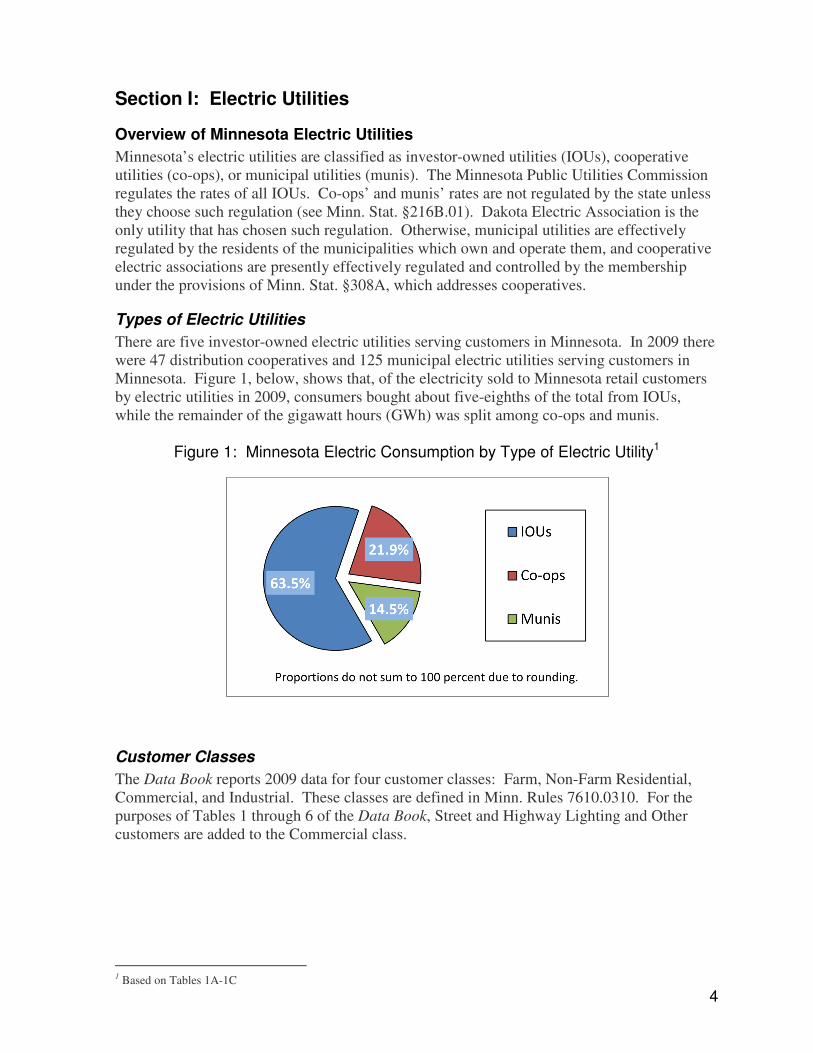
There are five investor-owned electric utilities serving customers in Minnesota. In 2009 there were 47 distribution cooperatives and 125 municipal electric utilities serving customers in Minnesota. Figure 1, below, shows that, of the electricity sold to Minnesota retail customers by electric utilities in 2009, consumers bought about five-eighths of the total from IOUs, while the remainder of the gigawatt hours (GWh) was split among co-ops and munis.
Figure 1: Minnesota Electric Consumption by Type of Electric Utility1
Customer Classes
The Data Book reports 2009 data for four customer classes: Farm, Non-Farm Residential, Commercial, and Industrial. These classes are defined in Minn. Rules 7610.0310. For the purposes of Tables 1 through 6 of the Data Book, Street and Highway Lighting and Other customers are added to the Commercial class.
1 Based on Tables 1A-1C
5
Customer Classes: Consumption
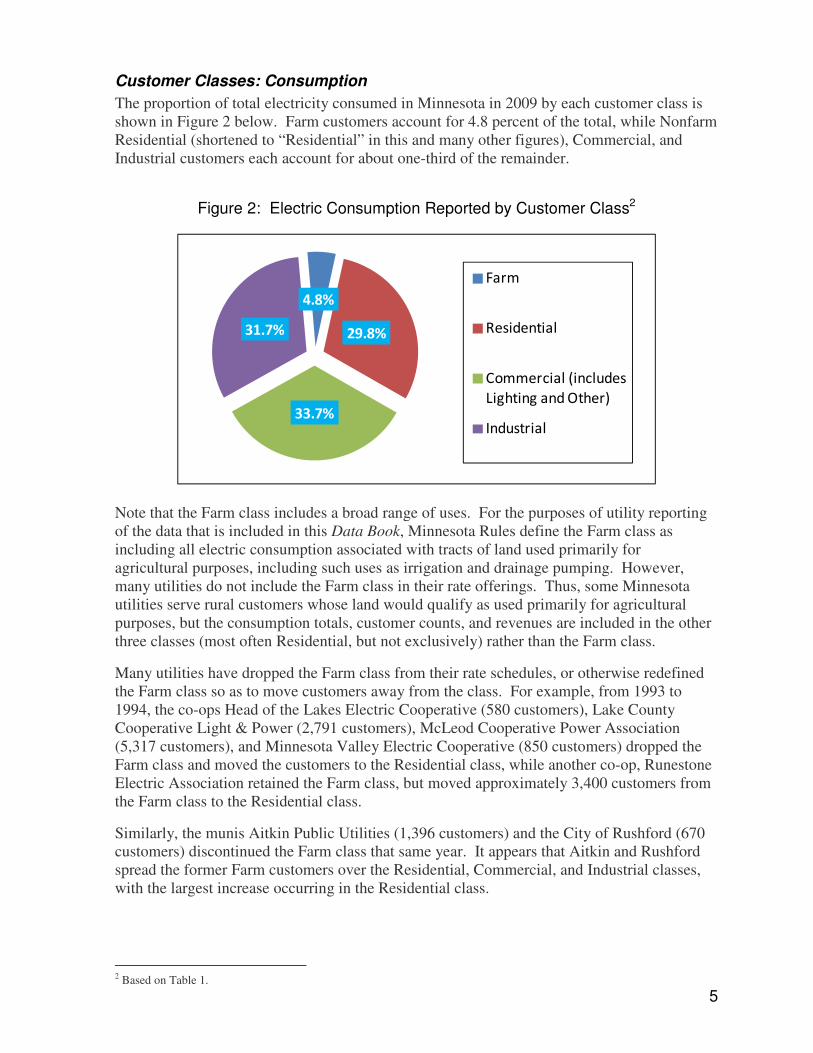
The proportion of total electricity consumed in Minnesota in 2009 by each customer class is shown in Figure 2 below. Farm customers account for 4.8 percent of the total, while Nonfarm Residential (shortened to “Residential” in this and many other figures), Commercial, and Industrial customers each account for about one-third of the remainder.
Figure 2: Electric Consumption Reported by Customer Class2
4.8%
29.8%
33.7%
31.7%
Farm
Residential
Commercial (includes
Lighting and Other)
Industrial
Note that the Farm class includes a broad range of uses. For the purposes of utility reporting of the data that is included in this Data Book, Minnesota Rules define the Farm class as including all electric consumption associated with tracts of land used primarily for agricultural purposes, including such uses as irrigation and drainage pumping. However, many utilities do not include the Farm class in their rate offerings. Thus, some Minnesota utilities serve rural customers whose land would qualify as used primarily for agricultural purposes, but the consumption totals, customer counts, and revenues are included in the other three classes (most often Residential, but not exclusively) rather than the Farm class.
Many utilities have dropped the Farm class from their rate schedules, or otherwise redefined the Farm class so as to move customers away from the class. For example, from 1993 to 1994, the co-ops Head of the Lakes Electric Cooperative (580 customers), Lake County Cooperative Light & Power (2,791 customers), McLeod Cooperative Power Association (5,317 customers), and Minnesota Valley Electric Cooperative (850 customers) dropped the Farm class and moved the customers to the Residential class, while another co-op, Runestone Electric Association retained the Farm class, but moved approximately 3,400 customers from the Farm class to the Residential class.
Similarly, the munis Aitkin Public Utilities (1,396 customers) and the City of Rushford (670 customers) discontinued the Farm class that same year. It appears that Aitkin and Rushford spread the former Farm customers over the Residential, Commercial, and Industrial classes, with the largest increase occurring in the Residential class.
2 Based on Table 1.

6
Lastly, Minnesota Power's (MP) customer data for 1994 reflects the number of meters, rather than customers. This change caused all of MP’s customer-class counts to increase. Meanwhile, MP also reclassified several Farm customers to the Residential class. In 1994, MP’s Farm consumption dropped from 76,700 megawatt hours (MWH) to 34,700 MWh, contributing to a 42,000 MWh decline in Farm class consumption.
All these factors combined caused a drop in the Farm class of about 14,000 customers in 1994. The change in customer numbers also caused net shifts in consumption and revenues away from the Farm class. Thus, the Farm class decline of 16,000 customers in 1994 reflected in Table 2 was due mostly to administrative reasons rather than an actual drop in customers.
Further illustrating the inconsistency of the Farm class, in 1995 the total number of customers in the class rose about 11,000 from 1994’s total. Two sources of this rebound for the Farm class were Carlton County Cooperative Power & Light moving from 0 to nearly 6,000 Farm customers and Wild Rice Electric Cooperative going from 0 to more than 9,000 Farm customers. In both cases, these increases were accompanied by corresponding decreases in the Residential class.
Changes in other classes also have occurred over the historical period covered by the Data
Book. Notably, Xcel Energy changed the definitions of its Commercial and Industrial customer classes in 2001. This change caused about 6,000 customers, 8,000 GWh, and $400 million in revenues to shift from the Industrial to the Commercial class. Therefore, the numbers reported for consumption, customers, and revenues for individual utilities, customer classes, and electric utility types from one year to the next are not always strictly comparable for tracking changes in the categories.
Customer-Classes: Consumption by Electric-Utility Type
Figure 3 below shows the 2009 percentages of each utility type’s total consumption in the various Minnesota customer classes. As noted above, some utilities have eliminated the Farm class as a category separate from residential or commercial customers. Cooperative utilities have been more likely to retain the Farm class as a separate class.
Figure 3: 2009 Customer-Class Consumption Percentages by Utility Type3
0.3%
25.6%
39.2%34.9%
21.0%
42.5%
20.9%
15.7%
0.2%
29.2% 28.9%
41.7%
0.0%
10.0%
20.0%
30.0%
40.0%
50.0%
Farm Residential Commercial Industrial
IOUs
Co-ops
Munis
3 Based on Tables 1A-1C.
7
In 2009, Residential customers account for a large share of co-op consumption. For IOUs, the Commercial and Industrial classes are the leading consumers, whereas the Industrial class is the top consumption class among munis.
Customer Classes: Revenue Percentages
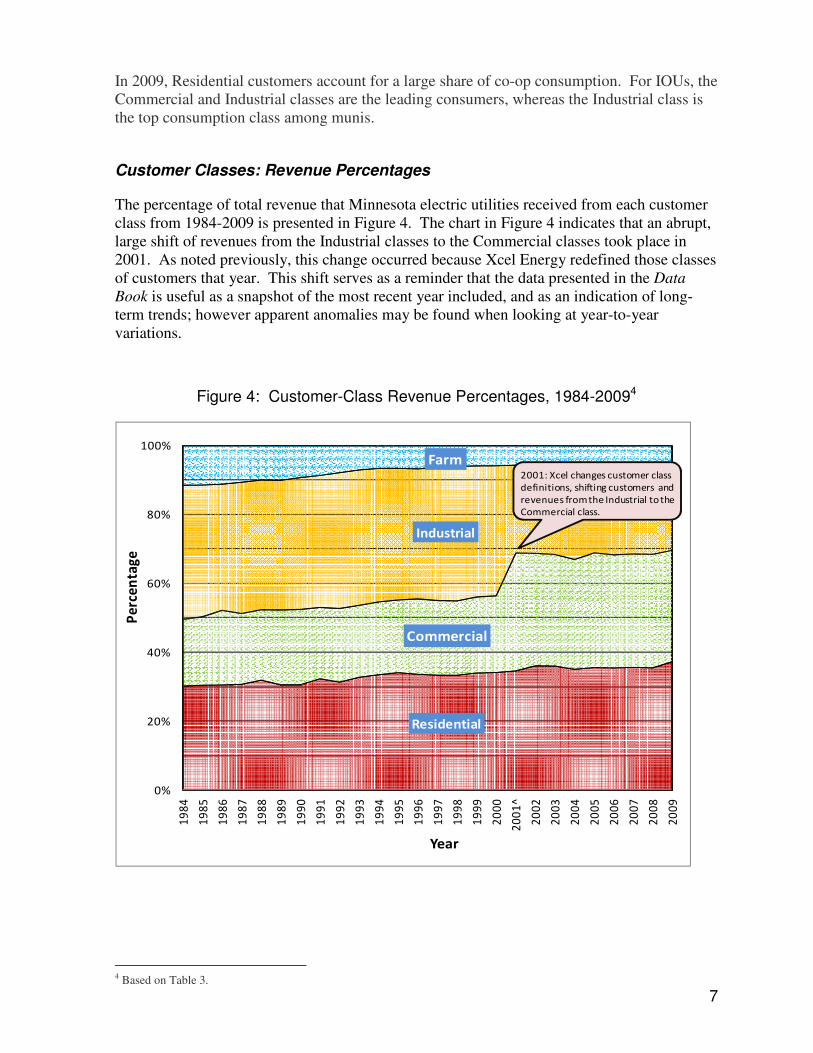
The percentage of total revenue that Minnesota electric utilities received from each customer class from 1984-2009 is presented in Figure 4. The chart in Figure 4 indicates that an abrupt, large shift of revenues from the Industrial classes to the Commercial classes took place in 2001. As noted previously, this change occurred because Xcel Energy redefined those classes of customers that year. This shift serves as a reminder that the data presented in the Data
Book is useful as a snapshot of the most recent year included, and as an indication of long-term trends; however apparent anomalies may be found when looking at year-to-year variations.
Figure 4: Customer-Class Revenue Percentages, 1984-20094
Residential
Commercial
Industrial
Farm
0%
20%
40%
60%
80%
100%
19
84
19
85
19
86
19
87
19
88
19
89
19
90
19
91
19
92
19
93
19
94
19
95
19
96
19
97
19
98
19
99
20
00
20
01
^
20
02
20
03
20
04
20
05
20
06
20
07
20
08
20
09
Pe
rce
nta
ge
Year
2001: Xcel changes customer class
definitions, shifting customers and
revenues from the Industrial to the
Commercial class.
4 Based on Table 3.

8
Fuels Used to Generate Electricity
Figures 5a-5e illustrate the consumption of selected fuels (nuclear fuel is excluded) for the generation of electricity from plants owned by public utilities serving Minnesota. Each data time series indicates how the volume of a particular fuel has changed over the period 1999-2009. The energy derived from a unit of each fuel is not incorporated into the time series. Therefore, no conclusions should be drawn concerning the relative importance of each fuel in generating Minnesota electricity.
Figures 5a-5e: Minnesota Electricity Generation by Selected Fuels, 1999-20095
38
40
42
44
46
48
50
1999 2001 2003 2005 2007 2009
Mil
lio
n T
on
s
Figure 5a: Coal
0
25
50
1999 2001 2003 2005 2007 2009M
illi
on
s M
CF
Figure 5b: Natural Gas
0
20
40
60
1999 2001 2003 2005 2007 2009
Mil
lio
nG
all
on
s
Figure 5c: Fuel Oil #2
(includes diesel)
0
1
2
3
4
1999 2001 2003 2005 2007 2009
Mil
lio
n G
all
on
s
Figure 5d: Fuel Oil #6
0.8
1.0
1.2
1.4
1.6
1.8
1999 2001 2003 2005 2007 2009
Mil
lio
n T
on
s
Figure 5e: Other
(e.g., wood, tires)
5 Based on Table 10 in the 1999-2009 Data Books.
9
Introduction to the Electric Tables
The tables in this section provide both aggregate and individual company information reported by electric utilities serving Minnesota.
Using the Tables
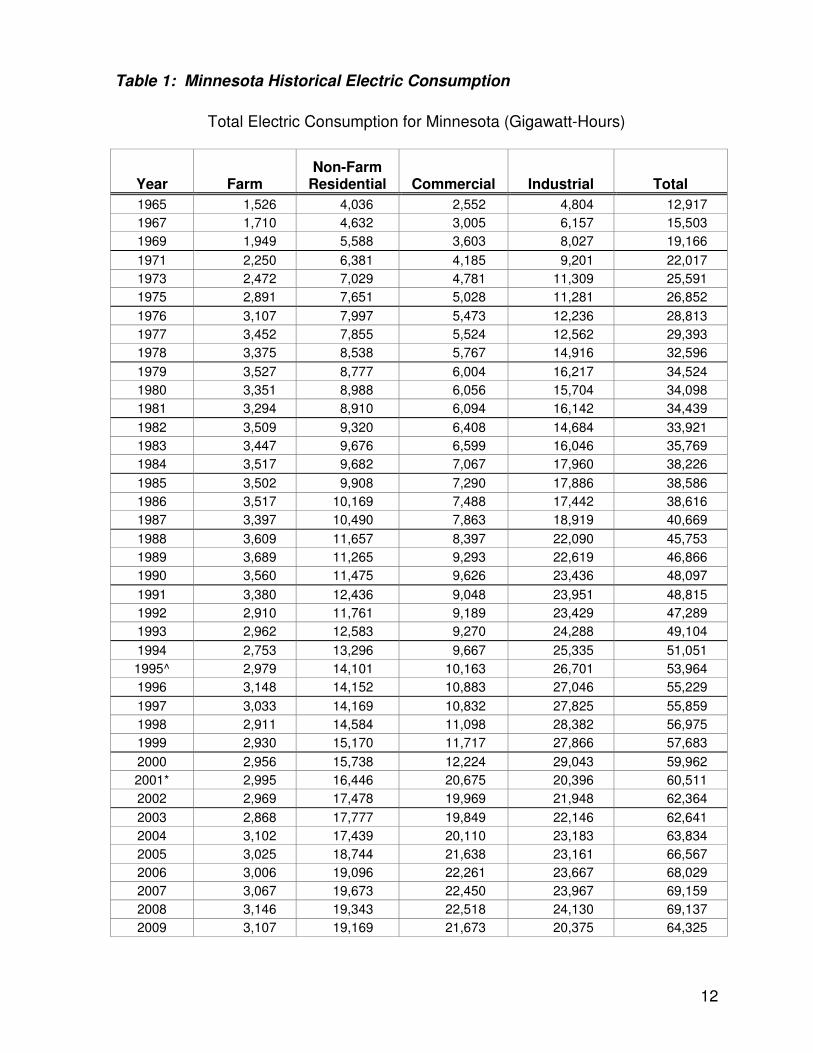
The 2009 Data Book can be used in many ways. Readers can employ the various tables as they are, or perform their own analysis using the data in new combinations or with other data. For example, the historical consumption of electricity for Residential customers is one of the data time series reported in Table 1 (see page 12). The 2009 aggregate value for this customer class is slightly lower than the 2008 value. Using Residential customer numbers from Table 2 (see page 16) to calculate class per-capita consumption, the result indicates that Residential consumption dropped from 9.03 megawatt hours (MWh) in 2008 to 8.92 MWh in 2009.
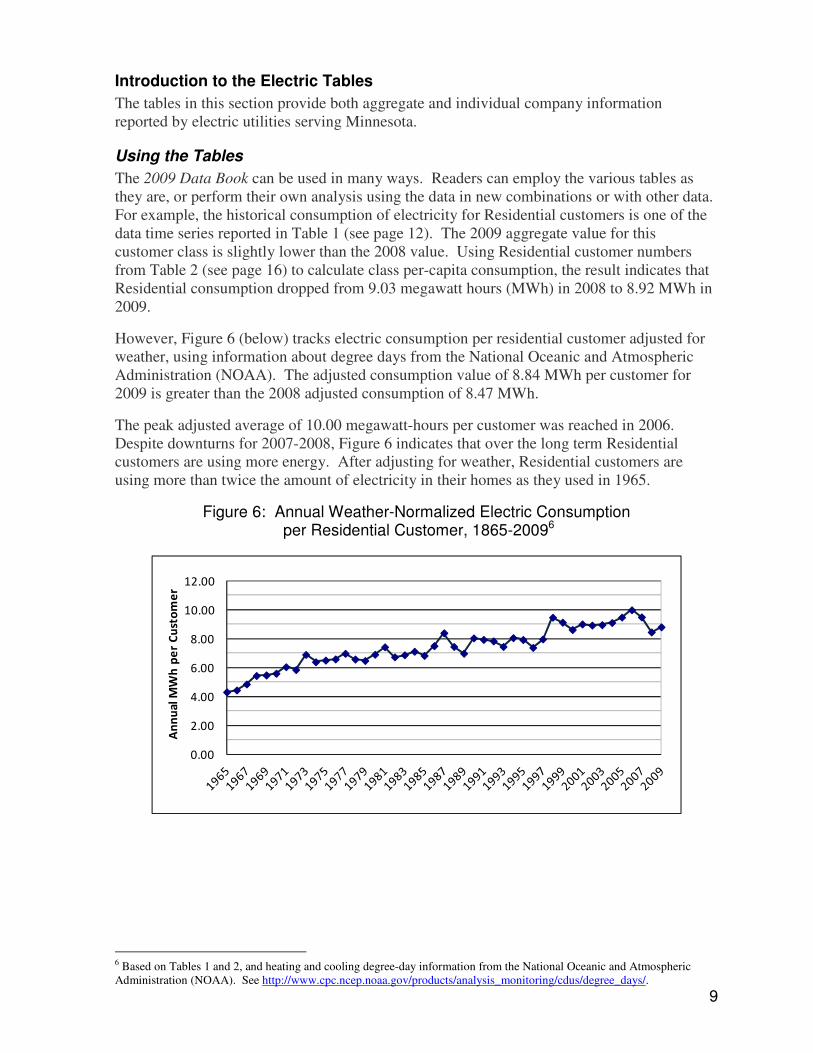
However, Figure 6 (below) tracks electric consumption per residential customer adjusted for weather, using information about degree days from the National Oceanic and Atmospheric Administration (NOAA). The adjusted consumption value of 8.84 MWh per customer for 2009 is greater than the 2008 adjusted consumption of 8.47 MWh.
The peak adjusted average of 10.00 megawatt-hours per customer was reached in 2006. Despite downturns for 2007-2008, Figure 6 indicates that over the long term Residential customers are using more energy. After adjusting for weather, Residential customers are using more than twice the amount of electricity in their homes as they used in 1965.
Figure 6: Annual Weather-Normalized Electric Consumption per Residential Customer, 1865-20096
0.00
2.00
4.00
6.00
8.00
10.00
12.00
An
nu
al
MW
h p
er
Cu
sto
me
r
6 Based on Tables 1 and 2, and heating and cooling degree-day information from the National Oceanic and Atmospheric Administration (NOAA). See http://www.cpc.ncep.noaa.gov/products/analysis_monitoring/cdus/degree_days/.
10
Guide to the Tables
Tables 1 through 3 provide overall electric consumption, numbers of electric customers and electric revenues in Minnesota, respectively. These tables also show this information for the general types of companies: investor-owned utilities, cooperative utilities, and municipal utilities. Tables 4 through 6 provide 2009 electric consumption, numbers of electric customers, and electric revenues reported by each electric utility serving Minnesota.
Table 7 presents data on residential space heating reported by each electric utility serving Minnesota. Table 8 lists utility megawatt-hours sold at retail to Minnesota customers by county and each county’s consumption and population rank (1 represents the highest total consumption/population and 87 represents the lowest).
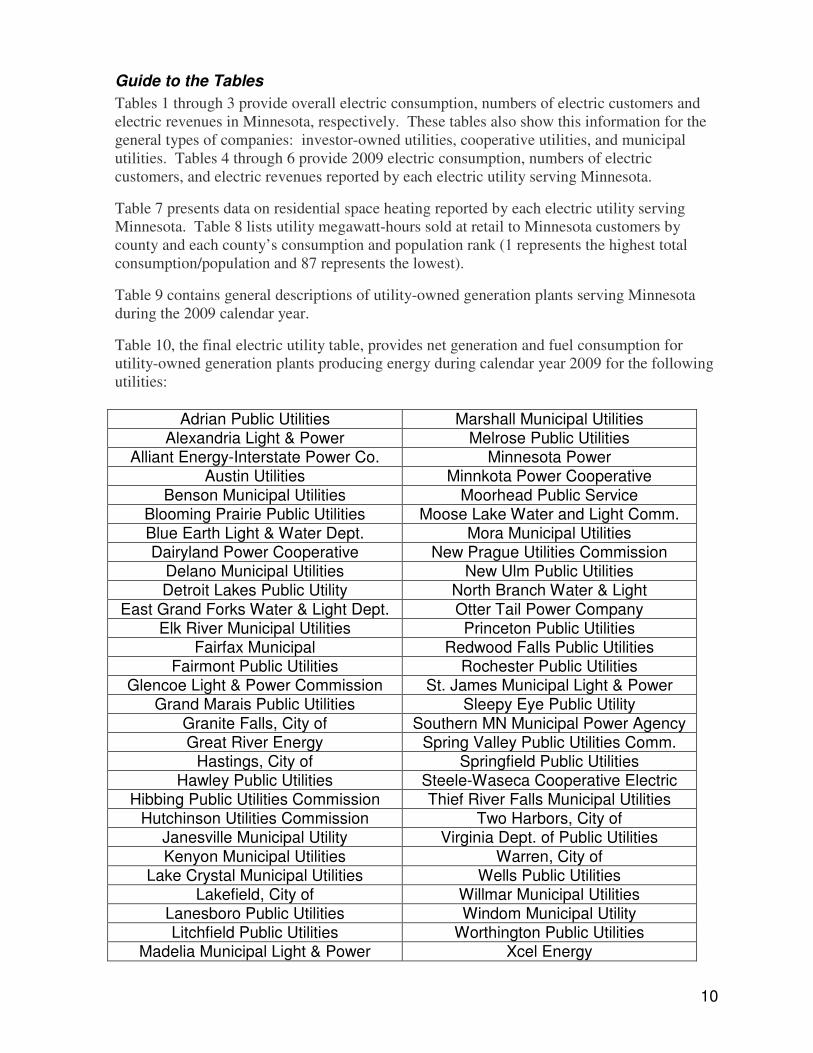
Table 9 contains general descriptions of utility-owned generation plants serving Minnesota during the 2009 calendar year.
Table 10, the final electric utility table, provides net generation and fuel consumption for utility-owned generation plants producing energy during calendar year 2009 for the following utilities:
Adrian Public Utilities Marshall Municipal Utilities Alexandria Light & Power Melrose Public Utilities
Alliant Energy-Interstate Power Co. Minnesota Power Austin Utilities Minnkota Power Cooperative
Benson Municipal Utilities Moorhead Public Service Blooming Prairie Public Utilities Moose Lake Water and Light Comm. Blue Earth Light & Water Dept. Mora Municipal Utilities Dairyland Power Cooperative New Prague Utilities Commission
Delano Municipal Utilities New Ulm Public Utilities Detroit Lakes Public Utility North Branch Water & Light
East Grand Forks Water & Light Dept. Otter Tail Power Company Elk River Municipal Utilities Princeton Public Utilities
Fairfax Municipal Redwood Falls Public Utilities Fairmont Public Utilities Rochester Public Utilities
Glencoe Light & Power Commission St. James Municipal Light & Power Grand Marais Public Utilities Sleepy Eye Public Utility
Granite Falls, City of Southern MN Municipal Power Agency Great River Energy Spring Valley Public Utilities Comm.
Hastings, City of Springfield Public Utilities Hawley Public Utilities Steele-Waseca Cooperative Electric
Hibbing Public Utilities Commission Thief River Falls Municipal Utilities Hutchinson Utilities Commission Two Harbors, City of
Janesville Municipal Utility Virginia Dept. of Public Utilities Kenyon Municipal Utilities Warren, City of
Lake Crystal Municipal Utilities Wells Public Utilities Lakefield, City of Willmar Municipal Utilities
Lanesboro Public Utilities Windom Municipal Utility Litchfield Public Utilities Worthington Public Utilities
Madelia Municipal Light & Power Xcel Energy

11
Other Sources
The United States Energy Information Administration (EIA) has additional information about Minnesota electricity generation and consumption. The following link will take you to the Minnesota profile page: http://www.eia.gov/state/?sid=MN.
Note: The EIA collects data for utility facilities in Minnesota, whereas the Department data in the Data Book reflects all activity at facilities operated by utilities serving Minnesota, whether or not the facilities are located in Minnesota. Thus, EIA data and data from the Data Book may not correspond to one another even though they may appear to measure the same item.
12
Table 1: Minnesota Historical Electric Consumption
Total Electric Consumption for Minnesota (Gigawatt-Hours)
Year Farm Non-Farm
Residential Commercial Industrial Total
1965 1,526 4,036 2,552 4,804 12,917
1967 1,710 4,632 3,005 6,157 15,503
1969 1,949 5,588 3,603 8,027 19,166
1971 2,250 6,381 4,185 9,201 22,017
1973 2,472 7,029 4,781 11,309 25,591
1975 2,891 7,651 5,028 11,281 26,852
1976 3,107 7,997 5,473 12,236 28,813
1977 3,452 7,855 5,524 12,562 29,393
1978 3,375 8,538 5,767 14,916 32,596
1979 3,527 8,777 6,004 16,217 34,524
1980 3,351 8,988 6,056 15,704 34,098
1981 3,294 8,910 6,094 16,142 34,439
1982 3,509 9,320 6,408 14,684 33,921
1983 3,447 9,676 6,599 16,046 35,769
1984 3,517 9,682 7,067 17,960 38,226
1985 3,502 9,908 7,290 17,886 38,586
1986 3,517 10,169 7,488 17,442 38,616
1987 3,397 10,490 7,863 18,919 40,669
1988 3,609 11,657 8,397 22,090 45,753
1989 3,689 11,265 9,293 22,619 46,866
1990 3,560 11,475 9,626 23,436 48,097
1991 3,380 12,436 9,048 23,951 48,815
1992 2,910 11,761 9,189 23,429 47,289
1993 2,962 12,583 9,270 24,288 49,104
1994 2,753 13,296 9,667 25,335 51,051
1995^ 2,979 14,101 10,163 26,701 53,964
1996 3,148 14,152 10,883 27,046 55,229
1997 3,033 14,169 10,832 27,825 55,859
1998 2,911 14,584 11,098 28,382 56,975
1999 2,930 15,170 11,717 27,866 57,683
2000 2,956 15,738 12,224 29,043 59,962
2001* 2,995 16,446 20,675 20,396 60,511
2002 2,969 17,478 19,969 21,948 62,364
2003 2,868 17,777 19,849 22,146 62,641
2004 3,102 17,439 20,110 23,183 63,834
2005 3,025 18,744 21,638 23,161 66,567
2006 3,006 19,096 22,261 23,667 68,029
2007 3,067 19,673 22,450 23,967 69,159
2008 3,146 19,343 22,518 24,130 69,137
2009 3,107 19,169 21,673 20,375 64,325

13
Table 1A: Electric Consumption for Investor-Owned Utilities
Electric Consumption (Gigawatt-Hours)
Year Farm Non-Farm
Residential Commercial Industrial Total
1965 207 3,076 1,734 4,360 9,378
1967 224 3,521 2,049 5,660 11,455
1969 238 4,236 2,469 7,392 14,335
1971 257 4,760 2,842 8,378 16,237
1973 267 5,156 3,178 10,318 18,920
1975 286 5,527 3,280 10,199 19,291
1976 294 5,709 3,548 11,046 20,597
1977 301 5,662 3,570 11,227 20,760
1978 298 5,881 3,726 13,487 23,391
1979 314 5,985 3,867 14,697 24,862
1980 317 6,085 3,961 14,120 24,482
1981 345 5,960 3,980 14,473 24,758
1982 361 6,208 4,244 12,915 23,728
1983 354 6,497 4,298 14,198 25,347
1984 358 6,464 4,550 16,053 27,425
1985 352 6,593 4,697 15,909 27,551
1986 350 6,777 4,804 15,298 27,229
1987 334 6,989 5,025 16,710 29,058
1988 347 7,786 5,365 19,664 33,162
1989 339 7,401 6,117 20,067 33,925
1990 344 7,445 6,257 20,818 34,864
1991 359 7,842 5,592 21,089 34,882
1992 116 7,442 5,712 20,425 33,695
1993 119 7,817 5,687 21,061 34,684
1994 77 8,065 5,952 21,886 35,981
1995 78 8,615 6,218 23,099 38,009
1996 78 8,520 6,811 23,231 38,640
1997 76 8,511 6,634 23,768 38,989
1998 74 8,764 6,699 23,993 39,531
1999 75 9,038 6,852 23,494 39,459
2000 74 9,372 7,279 24,270 40,995
2001* 76 9,654 15,516 15,598 40,843
2002 73 10,185 14,650 17,005 41,912
2003 108 10,210 14,479 16,978 41,774
2004 118 9,977 14,791 17,643 42,530
2005 121 10,615 16,228 17,259 44,223
2006 119 10,654 16,624 17,487 44,884
2007 119 10,969 16,733 17,593 45,415
2008 122 10,587 16,676 17,822 45,208
2009 129 10,444 16,027 14,268 40,869
14
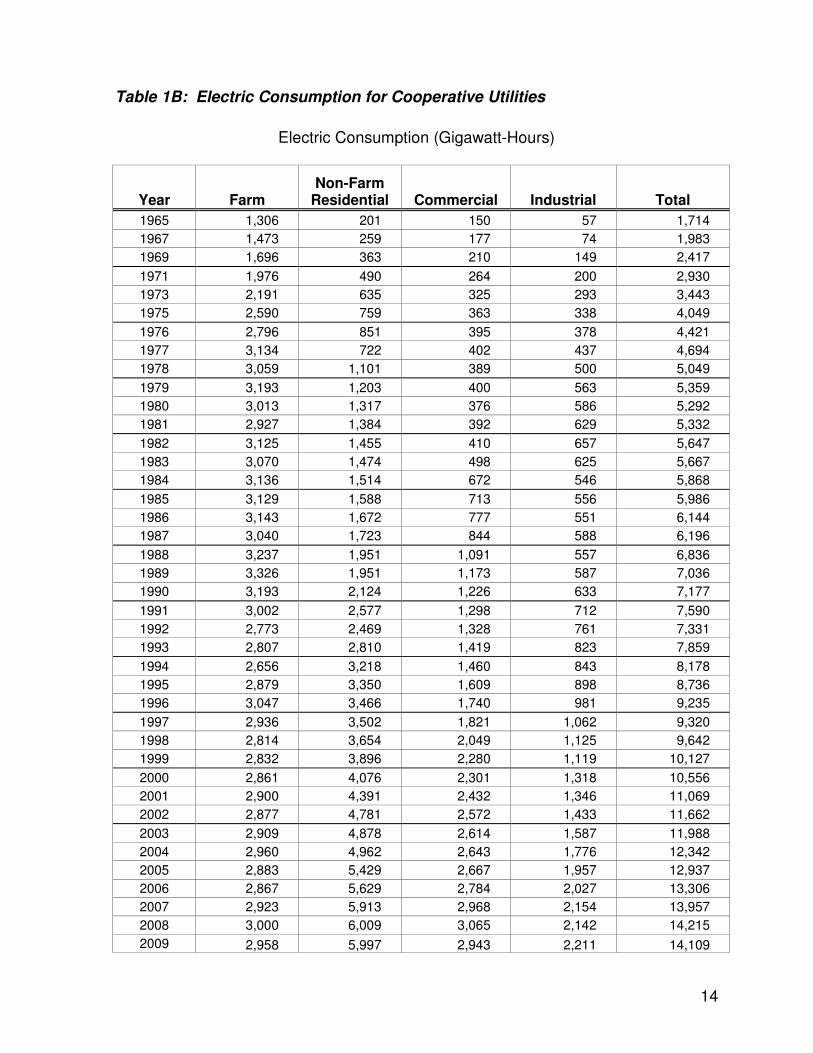
Table 1B: Electric Consumption for Cooperative Utilities
Electric Consumption (Gigawatt-Hours)
Year Farm Non-Farm
Residential Commercial Industrial Total
1965 1,306 201 150 57 1,714
1967 1,473 259 177 74 1,983
1969 1,696 363 210 149 2,417
1971 1,976 490 264 200 2,930
1973 2,191 635 325 293 3,443
1975 2,590 759 363 338 4,049
1976 2,796 851 395 378 4,421
1977 3,134 722 402 437 4,694
1978 3,059 1,101 389 500 5,049
1979 3,193 1,203 400 563 5,359
1980 3,013 1,317 376 586 5,292
1981 2,927 1,384 392 629 5,332
1982 3,125 1,455 410 657 5,647
1983 3,070 1,474 498 625 5,667
1984 3,136 1,514 672 546 5,868
1985 3,129 1,588 713 556 5,986
1986 3,143 1,672 777 551 6,144
1987 3,040 1,723 844 588 6,196
1988 3,237 1,951 1,091 557 6,836
1989 3,326 1,951 1,173 587 7,036
1990 3,193 2,124 1,226 633 7,177
1991 3,002 2,577 1,298 712 7,590
1992 2,773 2,469 1,328 761 7,331
1993 2,807 2,810 1,419 823 7,859
1994 2,656 3,218 1,460 843 8,178
1995 2,879 3,350 1,609 898 8,736
1996 3,047 3,466 1,740 981 9,235
1997 2,936 3,502 1,821 1,062 9,320
1998 2,814 3,654 2,049 1,125 9,642
1999 2,832 3,896 2,280 1,119 10,127
2000 2,861 4,076 2,301 1,318 10,556
2001 2,900 4,391 2,432 1,346 11,069
2002 2,877 4,781 2,572 1,433 11,662
2003 2,909 4,878 2,614 1,587 11,988
2004 2,960 4,962 2,643 1,776 12,342
2005 2,883 5,429 2,667 1,957 12,937
2006 2,867 5,629 2,784 2,027 13,306
2007 2,923 5,913 2,968 2,154 13,957
2008 3,000 6,009 3,065 2,142 14,215
2009 2,958 5,997 2,943 2,211 14,109
15
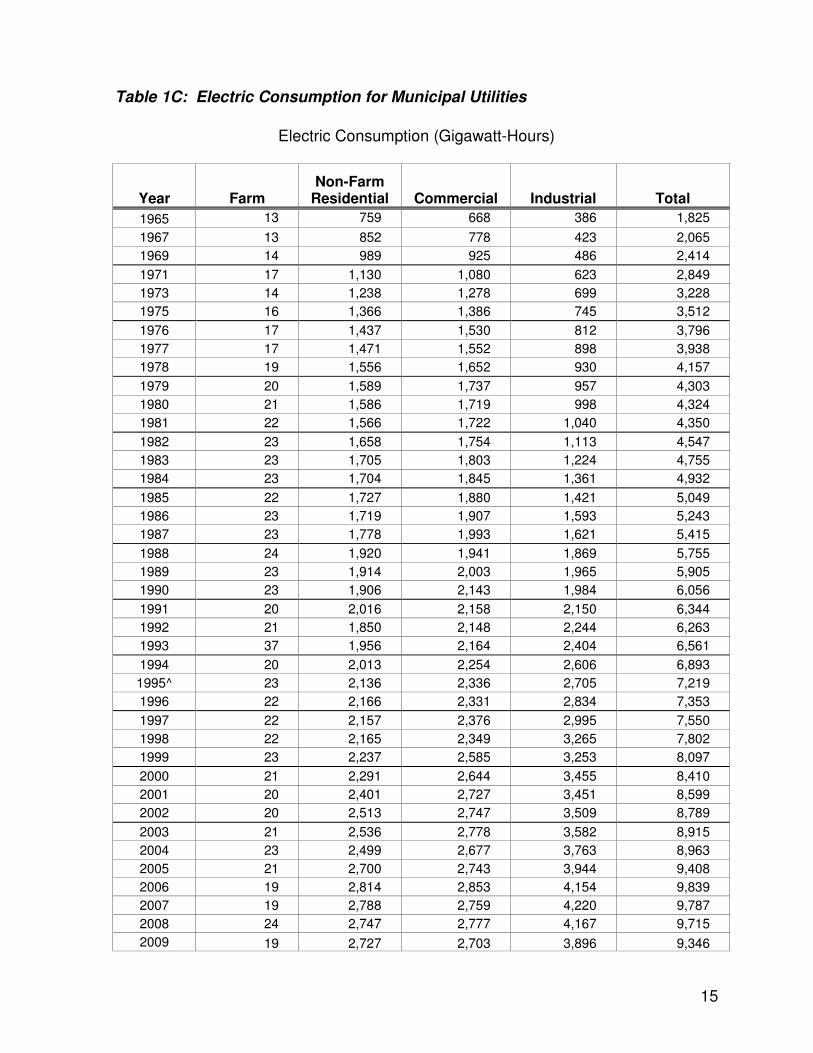
Table 1C: Electric Consumption for Municipal Utilities
Electric Consumption (Gigawatt-Hours)
Year Farm Non-Farm
Residential Commercial Industrial Total
1965 13 759 668 386 1,825
1967 13 852 778 423 2,065
1969 14 989 925 486 2,414
1971 17 1,130 1,080 623 2,849
1973 14 1,238 1,278 699 3,228
1975 16 1,366 1,386 745 3,512
1976 17 1,437 1,530 812 3,796
1977 17 1,471 1,552 898 3,938
1978 19 1,556 1,652 930 4,157
1979 20 1,589 1,737 957 4,303
1980 21 1,586 1,719 998 4,324
1981 22 1,566 1,722 1,040 4,350
1982 23 1,658 1,754 1,113 4,547
1983 23 1,705 1,803 1,224 4,755
1984 23 1,704 1,845 1,361 4,932
1985 22 1,727 1,880 1,421 5,049
1986 23 1,719 1,907 1,593 5,243
1987 23 1,778 1,993 1,621 5,415
1988 24 1,920 1,941 1,869 5,755
1989 23 1,914 2,003 1,965 5,905
1990 23 1,906 2,143 1,984 6,056
1991 20 2,016 2,158 2,150 6,344
1992 21 1,850 2,148 2,244 6,263
1993 37 1,956 2,164 2,404 6,561
1994 20 2,013 2,254 2,606 6,893
1995^ 23 2,136 2,336 2,705 7,219
1996 22 2,166 2,331 2,834 7,353
1997 22 2,157 2,376 2,995 7,550
1998 22 2,165 2,349 3,265 7,802
1999 23 2,237 2,585 3,253 8,097
2000 21 2,291 2,644 3,455 8,410
2001 20 2,401 2,727 3,451 8,599
2002 20 2,513 2,747 3,509 8,789
2003 21 2,536 2,778 3,582 8,915
2004 23 2,499 2,677 3,763 8,963
2005 21 2,700 2,743 3,944 9,408
2006 19 2,814 2,853 4,154 9,839
2007 19 2,788 2,759 4,220 9,787
2008 24 2,747 2,777 4,167 9,715
2009 19 2,727 2,703 3,896 9,346

16
Notes for Table 1 through Table 1C
^For 1995, Barnesville Municipal Electric reported total consumption, not consumption by customer class.
*Xcel Energy redefined its commercial and industrial customer classifications in 2001.
Commercial = Small Commercial and Industrial requiring less than 1000 kW.
Industrial = Large Commercial and Industrial requiring at least 1000 kW.
17
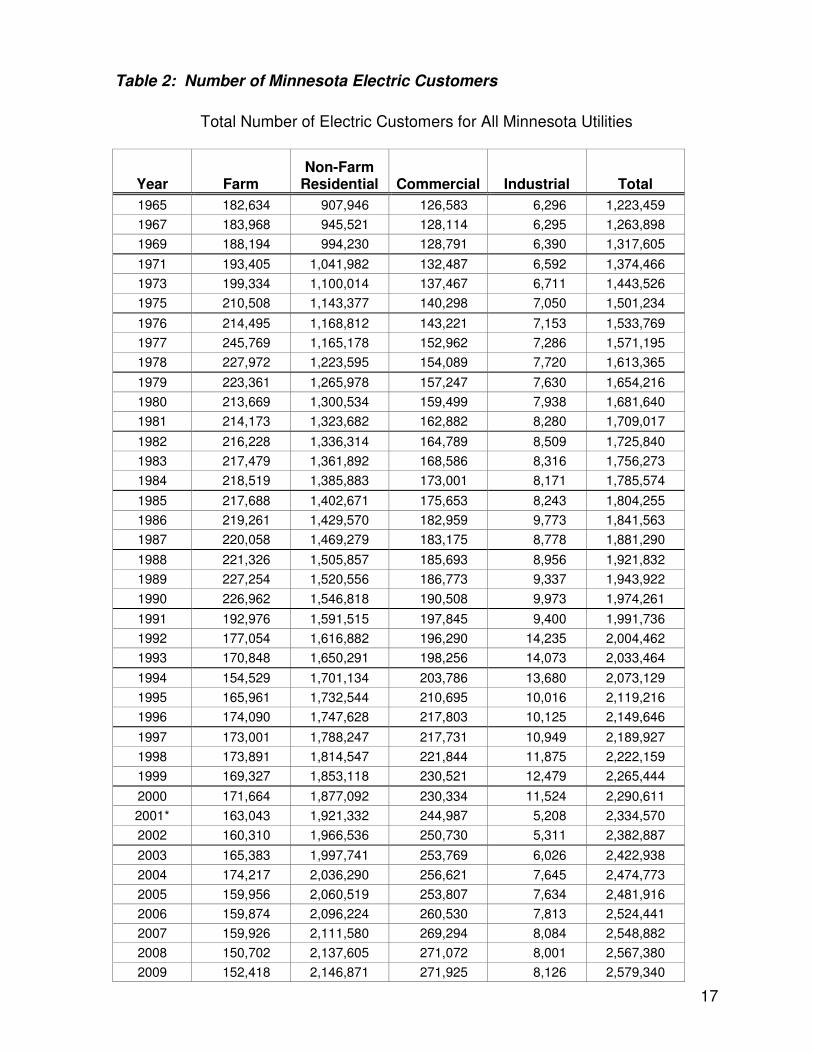
Table 2: Number of Minnesota Electric Customers
Total Number of Electric Customers for All Minnesota Utilities
Year Farm Non-Farm
Residential Commercial Industrial Total
1965 182,634 907,946 126,583 6,296 1,223,459
1967 183,968 945,521 128,114 6,295 1,263,898
1969 188,194 994,230 128,791 6,390 1,317,605
1971 193,405 1,041,982 132,487 6,592 1,374,466
1973 199,334 1,100,014 137,467 6,711 1,443,526
1975 210,508 1,143,377 140,298 7,050 1,501,234
1976 214,495 1,168,812 143,221 7,153 1,533,769
1977 245,769 1,165,178 152,962 7,286 1,571,195
1978 227,972 1,223,595 154,089 7,720 1,613,365
1979 223,361 1,265,978 157,247 7,630 1,654,216
1980 213,669 1,300,534 159,499 7,938 1,681,640
1981 214,173 1,323,682 162,882 8,280 1,709,017
1982 216,228 1,336,314 164,789 8,509 1,725,840
1983 217,479 1,361,892 168,586 8,316 1,756,273
1984 218,519 1,385,883 173,001 8,171 1,785,574
1985 217,688 1,402,671 175,653 8,243 1,804,255
1986 219,261 1,429,570 182,959 9,773 1,841,563
1987 220,058 1,469,279 183,175 8,778 1,881,290
1988 221,326 1,505,857 185,693 8,956 1,921,832
1989 227,254 1,520,556 186,773 9,337 1,943,922
1990 226,962 1,546,818 190,508 9,973 1,974,261
1991 192,976 1,591,515 197,845 9,400 1,991,736
1992 177,054 1,616,882 196,290 14,235 2,004,462
1993 170,848 1,650,291 198,256 14,073 2,033,464
1994 154,529 1,701,134 203,786 13,680 2,073,129
1995 165,961 1,732,544 210,695 10,016 2,119,216
1996 174,090 1,747,628 217,803 10,125 2,149,646
1997 173,001 1,788,247 217,731 10,949 2,189,927
1998 173,891 1,814,547 221,844 11,875 2,222,159
1999 169,327 1,853,118 230,521 12,479 2,265,444
2000 171,664 1,877,092 230,334 11,524 2,290,611
2001* 163,043 1,921,332 244,987 5,208 2,334,570
2002 160,310 1,966,536 250,730 5,311 2,382,887
2003 165,383 1,997,741 253,769 6,026 2,422,938
2004 174,217 2,036,290 256,621 7,645 2,474,773
2005 159,956 2,060,519 253,807 7,634 2,481,916
2006 159,874 2,096,224 260,530 7,813 2,524,441
2007 159,926 2,111,580 269,294 8,084 2,548,882
2008 150,702 2,137,605 271,072 8,001 2,567,380
2009 152,418 2,146,871 271,925 8,126 2,579,340
18
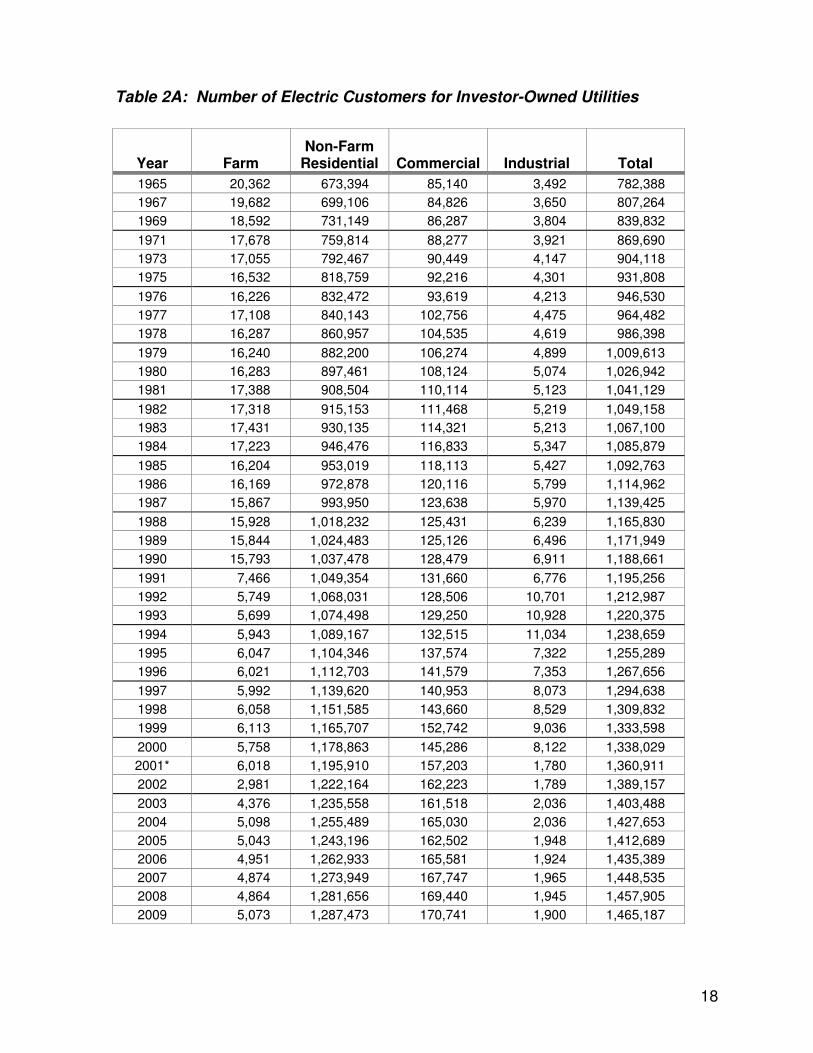
Table 2A: Number of Electric Customers for Investor-Owned Utilities
Year Farm Non-Farm
Residential Commercial Industrial Total
1965 20,362 673,394 85,140 3,492 782,388
1967 19,682 699,106 84,826 3,650 807,264
1969 18,592 731,149 86,287 3,804 839,832
1971 17,678 759,814 88,277 3,921 869,690
1973 17,055 792,467 90,449 4,147 904,118
1975 16,532 818,759 92,216 4,301 931,808
1976 16,226 832,472 93,619 4,213 946,530
1977 17,108 840,143 102,756 4,475 964,482
1978 16,287 860,957 104,535 4,619 986,398
1979 16,240 882,200 106,274 4,899 1,009,613
1980 16,283 897,461 108,124 5,074 1,026,942
1981 17,388 908,504 110,114 5,123 1,041,129
1982 17,318 915,153 111,468 5,219 1,049,158
1983 17,431 930,135 114,321 5,213 1,067,100
1984 17,223 946,476 116,833 5,347 1,085,879
1985 16,204 953,019 118,113 5,427 1,092,763
1986 16,169 972,878 120,116 5,799 1,114,962
1987 15,867 993,950 123,638 5,970 1,139,425
1988 15,928 1,018,232 125,431 6,239 1,165,830
1989 15,844 1,024,483 125,126 6,496 1,171,949
1990 15,793 1,037,478 128,479 6,911 1,188,661
1991 7,466 1,049,354 131,660 6,776 1,195,256
1992 5,749 1,068,031 128,506 10,701 1,212,987
1993 5,699 1,074,498 129,250 10,928 1,220,375
1994 5,943 1,089,167 132,515 11,034 1,238,659
1995 6,047 1,104,346 137,574 7,322 1,255,289
1996 6,021 1,112,703 141,579 7,353 1,267,656
1997 5,992 1,139,620 140,953 8,073 1,294,638
1998 6,058 1,151,585 143,660 8,529 1,309,832
1999 6,113 1,165,707 152,742 9,036 1,333,598
2000 5,758 1,178,863 145,286 8,122 1,338,029
2001* 6,018 1,195,910 157,203 1,780 1,360,911
2002 2,981 1,222,164 162,223 1,789 1,389,157
2003 4,376 1,235,558 161,518 2,036 1,403,488
2004 5,098 1,255,489 165,030 2,036 1,427,653
2005 5,043 1,243,196 162,502 1,948 1,412,689
2006 4,951 1,262,933 165,581 1,924 1,435,389
2007 4,874 1,273,949 167,747 1,965 1,448,535
2008 4,864 1,281,656 169,440 1,945 1,457,905
2009 5,073 1,287,473 170,741 1,900 1,465,187
19
Table 2B: Number of Electric Customers for Cooperative Utilities
Year Farm Non-Farm
Residential Commercial Industrial Total
1965 159,424 73,667 14,403 497 247,991
1967 161,400 80,886 15,138 594 258,018
1969 166,741 91,890 14,218 704 273,553
1971 172,487 106,291 15,319 861 294,958
1973 179,475 123,780 16,516 1,011 320,782
1975 191,235 132,547 17,274 1,239 342,295
1976 197,093 138,870 17,616 1,725 355,304
1977 227,390 122,558 17,846 1,427 369,221
1978 210,382 155,397 15,684 1,808 383,270
1979 205,797 170,926 16,793 1,566 395,082
1980 196,289 189,164 17,628 1,747 404,828
1981 195,677 198,501 18,147 1,988 414,313
1982 197,569 203,107 18,549 1,982 421,207
1983 198,731 210,087 19,367 1,690 429,875
1984 199,924 215,399 20,463 1,272 437,058
1985 200,170 223,644 21,607 1,256 446,677
1986 201,664 233,389 22,282 1,435 458,770
1987 202,725 244,405 23,306 1,219 471,655
1988 203,806 253,648 23,591 996 482,041
1989 209,822 259,124 24,233 1,046 494,225
1990 209,533 270,282 24,590 1,105 505,510
1991 184,694 299,541 28,816 951 514,002
1992 169,765 308,760 29,613 1,390 509,528
1993 161,521 335,390 30,426 1,247 528,584
1994 147,083 358,789 31,204 699 537,775
1995 158,373 371,121 33,094 723 563,311
1996 166,538 374,086 34,234 724 575,582
1997 165,478 385,524 36,117 774 587,893
1998 166,291 397,550 37,329 771 601,943
1999 161,526 418,559 36,443 805 617,333
2000 164,465 425,666 42,115 825 633,071
2001 155,624 446,451 44,393 732 647,200
2002 155,974 461,986 45,386 728 664,074
2003 159,609 474,179 47,404 1,151 682,343
2004 167,714 487,364 46,751 2,621 704,450
2005 153,483 517,433 44,877 2,672 718,465
2006 153,564 529,646 47,899 2,674 733,784
2007 153,195 532,749 55,059 2,778 743,781
2008 143,767 549,733 53,594 2,820 749,914
2009 145,914 550,374 53,958 2,790 753,036
20
Table 2C: Number of Electric Customers for Municipal Utilities
Year Farm Non-Farm
Residential Commercial Industrial Total
1965 2,848 160,885 27,040 2,300 193,073
1967 2,886 165,529 28,149 2,044 198,608
1969 2,861 171,191 28,285 1,875 204,212
1971 3,240 175,877 28,890 1,803 209,810
1973 2,804 183,767 30,501 1,546 218,618
1975 2,741 192,071 30,807 1,503 227,123
1976 1,176 197,470 31,985 1,208 231,927
1977 1,271 202,477 32,359 1,377 237,484
1978 1,303 207,241 33,869 1,286 243,689
1979 1,324 212,852 34,179 1,158 249,513
1980 1,097 213,909 33,746 1,111 249,863
1981 1,108 216,677 34,620 1,163 253,568
1982 1,341 218,054 34,771 1,301 255,467
1983 1,317 221,670 34,897 1,404 259,288
1984 1,372 224,008 35,704 1,543 262,627
1985 1,314 226,008 35,932 1,551 264,805
1986 1,428 223,303 40,560 2,530 267,821
1987 1,466 230,924 36,230 1,580 270,200
1988 1,592 233,977 36,670 1,712 273,951
1989 1,588 236,949 37,413 1,786 277,738
1990 1,636 239,058 37,438 1,948 280,080
1991 816 242,620 37,368 1,664 282,468
1992 1,540 240,091 38,168 2,137 281,937
1993 3,628 240,403 38,578 1,894 284,499
1994 1,503 253,178 40,067 1,943 296,691
1995 1,541 257,077 40,026 1,968 300,612
1996 1,531 260,839 41,990 2,048 306,408
1997 1,531 263,103 40,657 2,093 307,383
1998 1,542 265,412 40,853 2,567 310,374
1999 1,688 268,852 41,331 2,630 314,500
2000 1,441 272,563 42,933 2,577 319,511
2001 1,401 278,971 43,391 2,696 326,459
2002 1,355 282,386 43,121 2,794 329,656
2003 1,398 288,004 44,847 2,839 337,107
2004 1,405 293,437 44,840 2,988 342,670
2005 1,430 299,890 46,428 3,014 350,762
2006 1,359 303,645 47,050 3,215 355,257
2007 1,184 305,468 46,575 3,341 356,566
2008 2,071 306,216 48,038 3,236 359,561
2009 1,431 309,024 47,226 3,436 361,117

21
Notes for Table 2 through Table 2C
*Xcel Energy redefined its commercial and industrial customer classifications in 2001.
Commercial = Small Commercial and Industrial requiring less than 1000 kW.
Industrial = Large Commercial and Industrial requiring at least 1000 kW.
22
Table 3: Minnesota Electric Sales Revenue
Total Electric Sales Revenue for Minnesota ($1,000)
Year Farm Non-Farm
Residential Commercial Industrial Total
1984 232,027 611,797 390,742 786,113 2,020,679
1985 236,127 631,401 409,851 791,767 2,069,146
1986 237,084 650,794 460,137 779,793 2,127,808
1987 235,338 683,285 454,258 846,161 2,219,041
1988 244,458 785,261 500,716 924,932 2,455,367
1989 246,765 754,543 533,586 926,797 2,461,692
1990 243,489 805,504 572,487 1,005,617 2,627,096
1991 229,340 860,661 548,827 1,019,014 2,657,842
1992 196,865 791,726 536,962 994,308 2,519,861
1993 190,991 892,646 566,233 1,069,229 2,719,098
1994 185,170 955,753 601,097 1,105,409 2,848,923
1995 197,573 1,030,079 634,946 1,153,268 3,015,867
1996 204,889 1,031,011 668,436 1,156,750 3,061,085
1997 199,101 1,046,107 676,971 1,207,639 3,129,818
1998 195,014 1,083,805 698,625 1,266,957 3,244,402
1999 195,866 1,141,166 737,432 1,275,500 3,349,963
2000 203,207 1,197,915 778,742 1,322,920 3,502,784
2001^ 206,953 1,268,771 1,250,166 933,914 3,659,804
2002 215,701 1,315,785 1,186,304 922,033 3,639,822
2003 220,125 1,363,179 1,223,555 974,907 3,781,163
2004 231,918 1,394,390 1,264,713 1,076,959 3,970,234
2005 233,169 1,564,770 1,461,450 1,130,853 4,392,460
2006 238,616 1,670,059 1,539,034 1,246,306 4,696,269
2007 251,207 1,844,176 1,697,282 1,371,014 5,165,909
2008* 269,694 1,912,804 1,772,189 1,426,621 5,411,041
2009* 293,169 1,936,867 1,670,974 1,278,584 5,182,574
Notes for Table 3 through Table 3C
^Xcel Energy redefined its commercial and industrial customer classifications in 2001. The redefinition shifted about $400 million from the latter class to the former class. The revised standards for the two classes are:
Commercial = Small Commercial and Industrial requiring less than 1000 kW.
Industrial = Large Commercial and Industrial requiring at least 1000 kW.
* Customer-class total amounts for Table 3 and Table 3C do not add up to the Total amounts because Two Harbors Municipal did not provide revenue by customer class.

23
Table 3A: Electric Sales Revenue for Investor-Owned Utilities
Electric Sales Revenue ($1,000)
Year Farm Non-Farm
Residential Commercial Industrial Total
1984 20,009 398,105 250,782 687,480 1,356,377
1985 20,727 407,556 257,782 690,248 1,376,313
1986 20,825 423,028 304,285 673,289 1,421,426
1987 19,660 442,578 286,873 740,501 1,489,613
1988 20,878 514,687 315,582 808,983 1,660,130
1989 19,912 480,220 337,250 801,167 1,638,549
1990 22,370 518,143 367,859 874,366 1,782,738
1991 23,072 533,082 337,806 874,923 1,768,884
1992 7,082 504,114 340,177 855,644 1,707,017
1993 7,311 558,342 353,902 915,252 1,834,806
1994 5,073 583,344 371,386 938,232 1,898,036
1995 5,200 641,934 393,842 982,290 2,023,264
1996 5,489 638,779 422,022 977,195 2,043,486
1997 5,645 653,611 423,229 1,022,192 2,104,678
1998 5,600 677,718 431,912 1,064,415 2,179,645
1999 5,528 707,299 445,387 1,074,562 2,232,775
2000 5,630 729,660 471,002 1,098,337 2,304,628
2001^ 5,951 763,300 923,252 703,791 2,396,294
2002 5,995 770,046 846,702 687,852 2,310,596
2003 8,019 788,096 869,130 724,342 2,389,588
2004 9,107 792,583 910,181 790,697 2,502,569
2005 6,929 854,294 1,064,233 748,199 2,673,655
2006 9,636 949,265 1,143,180 902,899 3,004,980
2007 9,589 1,056,061 1,258,527 991,607 3,315,784
2008 10,193 1,051,026 1,286,366 1,017,615 3,365,200
2009 10,864 1,039,875 1,175,041 857,055 3,082,834
24
Table 3B: Electric Sales Revenue for Cooperative Utilities
Electric Sales Revenue ($1,000)
Year Farm Non-Farm
Residential Commercial Industrial Total
1984 210,781 128,567 48,928 35,715 423,991
1985 213,724 131,323 52,551 34,480 432,078
1986 214,988 137,223 56,345 33,589 442,145
1987 214,416 144,954 62,458 33,937 455,765
1988 222,219 162,697 77,217 32,587 494,720
1989 225,500 164,166 81,842 33,791 505,299
1990 219,750 174,661 83,194 35,912 513,518
1991 205,144 208,957 88,184 40,079 542,364
1992 188,393 187,884 86,127 41,610 504,014
1993 181,233 221,491 90,721 44,875 538,320
1994 178,644 245,366 93,880 42,452 560,342
1995 190,740 253,351 100,634 43,430 588,154
1996 197,823 256,263 106,434 44,613 605,133
1997 191,918 255,834 110,557 46,797 605,106
1998 187,887 266,397 122,436 50,759 627,479
1999 188,579 288,666 137,147 48,039 662,432
2000 196,099 313,456 143,050 58,110 710,714
2001 199,569 340,202 154,074 59,160 753,006
2002 208,224 371,741 166,143 63,052 809,160
2003 210,509 393,194 171,787 71,928 847,414
2004 221,083 418,354 176,218 89,270 904,926
2005 221,536 467,141 180,506 101,451 970,633
2006 227,169 498,239 193,056 103,290 1,021,754
2007 236,808 544,095 214,812 116,727 1,112,443
2008 257,417 606,152 243,251 131,953 1,238,744
2009 280,687 632,367 253,913 147,216 1,314,183
25
Table 3C: Electric Sales Revenue for Municipal Utilities
Electric Sales Revenue ($1,000)
Year Farm Non-Farm
Residential Commercial Industrial Total
1984 1,236 85,125 91,032 62,918 240,311
1985 1,676 92,521 99,519 67,039 260,755
1986 1,271 90,542 99,508 72,915 264,236
1987 1,262 95,752 104,928 71,722 273,664
1988 1,360 107,877 107,917 83,363 300,518
1989 1,353 110,158 114,493 91,839 317,843
1990 1,369 112,699 121,433 95,338 330,840
1991 1,123 118,622 122,838 104,012 346,594
1992 1,390 99,728 110,658 97,054 308,830
1993 2,448 112,813 121,610 109,101 345,972
1994 1,453 127,043 135,832 124,726 390,545
1995 1,633 134,795 140,471 127,549 404,448
1996 1,577 135,969 139,980 134,942 412,467
1997 1,538 136,662 143,185 138,650 420,035
1998 1,527 139,690 144,278 151,783 437,277
1999 1,597 145,363 154,897 152,899 454,756
2000 1,479 154,799 164,690 166,473 487,441
2001 1,433 165,269 172,839 170,963 510,505
2002 1,482 173,997 173,459 171,128 520,066
2003 1,598 181,888 182,638 178,638 544,161
2004 1,728 183,452 178,313 196,992 562,739
2005 2,245 204,845 192,531 218,771 620,611
2006 1,812 222,556 202,798 240,117 669,535
2007* 1,662 246,358 224,752 262,680 737,682
2008* 2,084 255,625 242,572 277,052 807,097
2009* 1,618 264,625 242,019 274,313 785,556
26
Table 4: Minnesota Electric Consumption by Utility
2009 Electric Consumption for Investor-Owned Utilities (Megawatt-Hours)
2009 Farm Non-Farm
Residential Commercial Industrial Total
Alliant Energy-Interstate Power & Light Co
35,631 283,520 182,663 332,795 834,609
Minnesota Power 47,979 1,027,138 2,170,776 4,051,354 7,297,247
Northwestern Wisconsin Electric Co
168 187 192 0 547
Otter Tail Power Company 45,605 575,749 304,685 1,201,172 2,127,211
Xcel Energy 0 8,557,729 13,368,999 8,683,135 30,609,863
Total: Investor-Owned Utilities
129,383 10,444,323 16,027,315 14,268,456 40,869,477
2009 Electric Consumption for Cooperative Utilities (Megawatt-Hours)
2009 Farm Non-Farm
Residential Commercial Industrial Total
Dairyland Power Cooperative
Heartland Power Cooperative 762 106 0 0 868
Freeborn Mower Coop Services
0 106,369 30,212 62,367 198,948
Peoples Coop Power Assoc., Inc.
46,509 147,809 40,668 1,602 236,588
Tri-Co Electric Cooperative 168,784 1,556 40,185 51,182 261,707
Total: Dairyland Power Cooperative
216,055 255,840 111,065 115,151 698,111
East River Electric Cooperative
H-D Electric Cooperative, Inc. 0 189 0 0 189
Lyon-Lincoln Electric Cooperative
61,547 8,952 * * 88,258
Renville Sibley Coop Power Assn
51,150 3,581 3,342 110,528 168,601
Traverse Electric Cooperative 32,337 1,684 * * 43,725
Total: East River Electric Cooperative
145,034 14,406 29,470 111,863 300,773
27
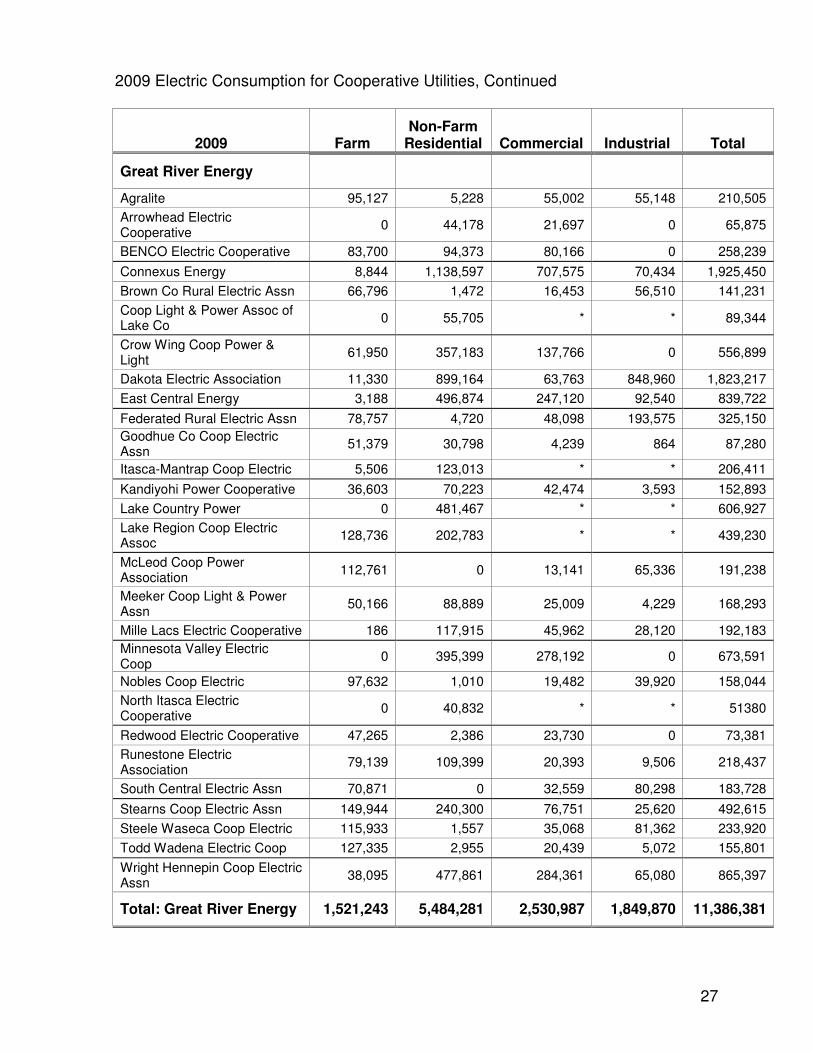
2009 Electric Consumption for Cooperative Utilities, Continued
2009 Farm Non-Farm
Residential Commercial Industrial Total
Great River Energy
Agralite 95,127 5,228 55,002 55,148 210,505
Arrowhead Electric Cooperative
0 44,178 21,697 0 65,875
BENCO Electric Cooperative 83,700 94,373 80,166 0 258,239
Connexus Energy 8,844 1,138,597 707,575 70,434 1,925,450
Brown Co Rural Electric Assn 66,796 1,472 16,453 56,510 141,231
Coop Light & Power Assoc of Lake Co
0 55,705 * * 89,344
Crow Wing Coop Power & Light
61,950 357,183 137,766 0 556,899
Dakota Electric Association 11,330 899,164 63,763 848,960 1,823,217
East Central Energy 3,188 496,874 247,120 92,540 839,722
Federated Rural Electric Assn 78,757 4,720 48,098 193,575 325,150
Goodhue Co Coop Electric Assn
51,379 30,798 4,239 864 87,280
Itasca-Mantrap Coop Electric 5,506 123,013 * * 206,411
Kandiyohi Power Cooperative 36,603 70,223 42,474 3,593 152,893
Lake Country Power 0 481,467 * * 606,927
Lake Region Coop Electric Assoc
128,736 202,783 * * 439,230
McLeod Coop Power Association
112,761 0 13,141 65,336 191,238
Meeker Coop Light & Power Assn
50,166 88,889 25,009 4,229 168,293
Mille Lacs Electric Cooperative 186 117,915 45,962 28,120 192,183
Minnesota Valley Electric Coop
0 395,399 278,192 0 673,591
Nobles Coop Electric 97,632 1,010 19,482 39,920 158,044
North Itasca Electric Cooperative
0 40,832 * * 51380
Redwood Electric Cooperative 47,265 2,386 23,730 0 73,381
Runestone Electric Association
79,139 109,399 20,393 9,506 218,437
South Central Electric Assn 70,871 0 32,559 80,298 183,728
Stearns Coop Electric Assn 149,944 240,300 76,751 25,620 492,615
Steele Waseca Coop Electric 115,933 1,557 35,068 81,362 233,920
Todd Wadena Electric Coop 127,335 2,955 20,439 5,072 155,801
Wright Hennepin Coop Electric Assn
38,095 477,861 284,361 65,080 865,397
Total: Great River Energy 1,521,243 5,484,281 2,530,987 1,849,870 11,386,381
28
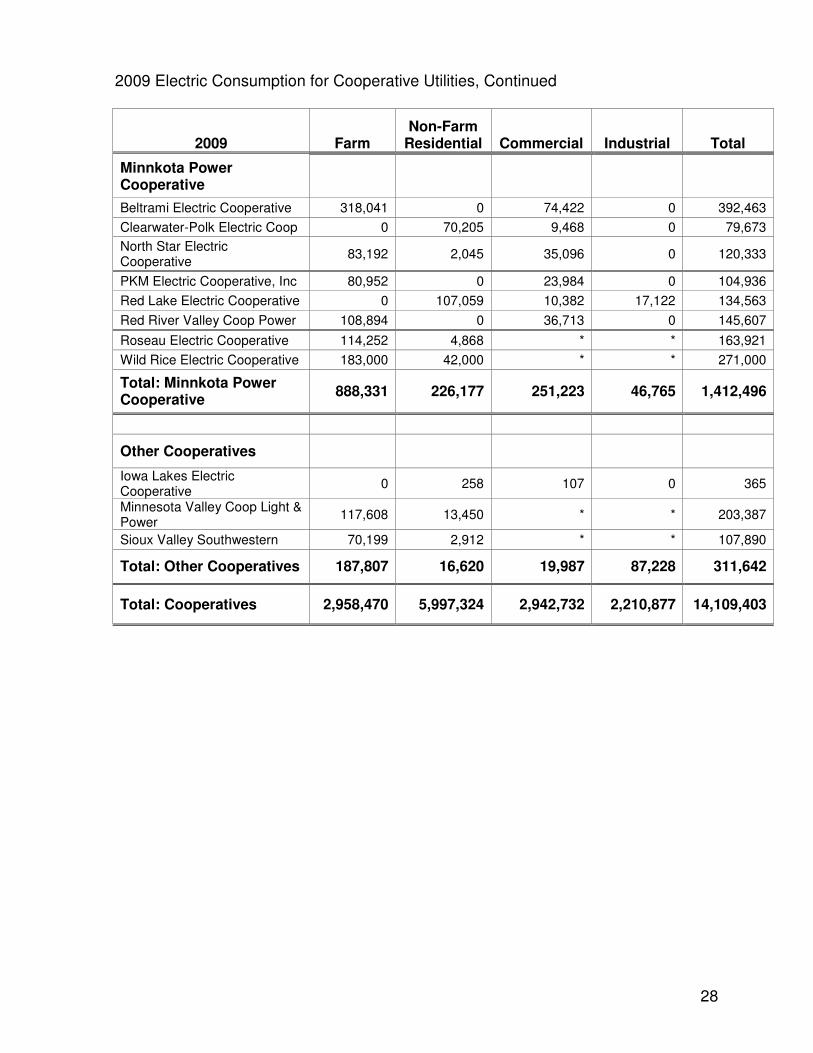
2009 Electric Consumption for Cooperative Utilities, Continued
2009 Farm Non-Farm
Residential Commercial Industrial Total
Minnkota Power Cooperative
Beltrami Electric Cooperative 318,041 0 74,422 0 392,463
Clearwater-Polk Electric Coop 0 70,205 9,468 0 79,673
North Star Electric Cooperative
83,192 2,045 35,096 0 120,333
PKM Electric Cooperative, Inc 80,952 0 23,984 0 104,936
Red Lake Electric Cooperative 0 107,059 10,382 17,122 134,563
Red River Valley Coop Power 108,894 0 36,713 0 145,607
Roseau Electric Cooperative 114,252 4,868 * * 163,921
Wild Rice Electric Cooperative 183,000 42,000 * * 271,000
Total: Minnkota Power Cooperative
888,331 226,177 251,223 46,765 1,412,496
Other Cooperatives
Iowa Lakes Electric Cooperative
0 258 107 0 365
Minnesota Valley Coop Light & Power
117,608 13,450 * * 203,387
Sioux Valley Southwestern 70,199 2,912 * * 107,890
Total: Other Cooperatives 187,807 16,620 19,987 87,228 311,642
Total: Cooperatives 2,958,470 5,997,324 2,942,732 2,210,877 14,109,403
29
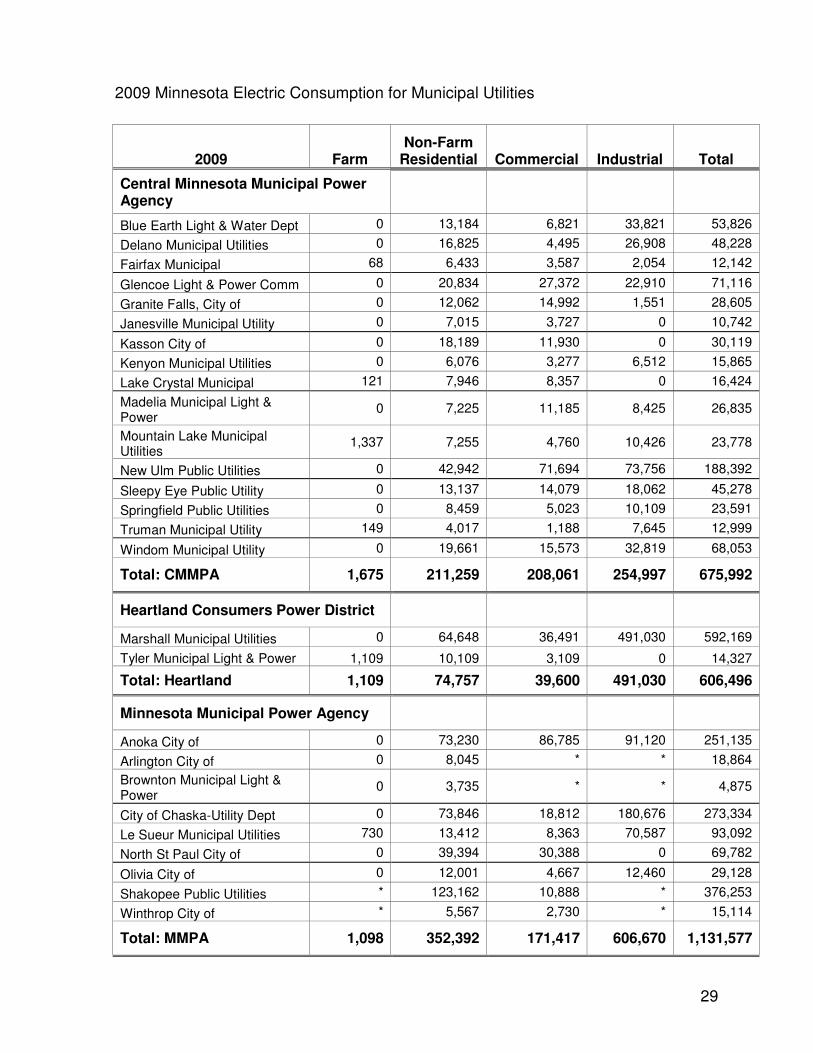
2009 Minnesota Electric Consumption for Municipal Utilities
2009 Farm Non-Farm
Residential Commercial Industrial Total
Central Minnesota Municipal Power Agency
Blue Earth Light & Water Dept 0 13,184 6,821 33,821 53,826
Delano Municipal Utilities 0 16,825 4,495 26,908 48,228
Fairfax Municipal 68 6,433 3,587 2,054 12,142
Glencoe Light & Power Comm 0 20,834 27,372 22,910 71,116
Granite Falls, City of 0 12,062 14,992 1,551 28,605
Janesville Municipal Utility 0 7,015 3,727 0 10,742
Kasson City of 0 18,189 11,930 0 30,119
Kenyon Municipal Utilities 0 6,076 3,277 6,512 15,865
Lake Crystal Municipal 121 7,946 8,357 0 16,424
Madelia Municipal Light & Power
0 7,225 11,185 8,425 26,835
Mountain Lake Municipal Utilities
1,337 7,255 4,760 10,426 23,778
New Ulm Public Utilities 0 42,942 71,694 73,756 188,392
Sleepy Eye Public Utility 0 13,137 14,079 18,062 45,278
Springfield Public Utilities 0 8,459 5,023 10,109 23,591
Truman Municipal Utility 149 4,017 1,188 7,645 12,999
Windom Municipal Utility 0 19,661 15,573 32,819 68,053
Total: CMMPA 1,675 211,259 208,061 254,997 675,992
Heartland Consumers Power District
Marshall Municipal Utilities 0 64,648 36,491 491,030 592,169
Tyler Municipal Light & Power 1,109 10,109 3,109 0 14,327
Total: Heartland 1,109 74,757 39,600 491,030 606,496
Minnesota Municipal Power Agency
Anoka City of 0 73,230 86,785 91,120 251,135
Arlington City of 0 8,045 * * 18,864
Brownton Municipal Light & Power
0 3,735 * * 4,875
City of Chaska-Utility Dept 0 73,846 18,812 180,676 273,334
Le Sueur Municipal Utilities 730 13,412 8,363 70,587 93,092
North St Paul City of 0 39,394 30,388 0 69,782
Olivia City of 0 12,001 4,667 12,460 29,128
Shakopee Public Utilities * 123,162 10,888 * 376,253
Winthrop City of * 5,567 2,730 * 15,114
Total: MMPA 1,098 352,392 171,417 606,670 1,131,577
30
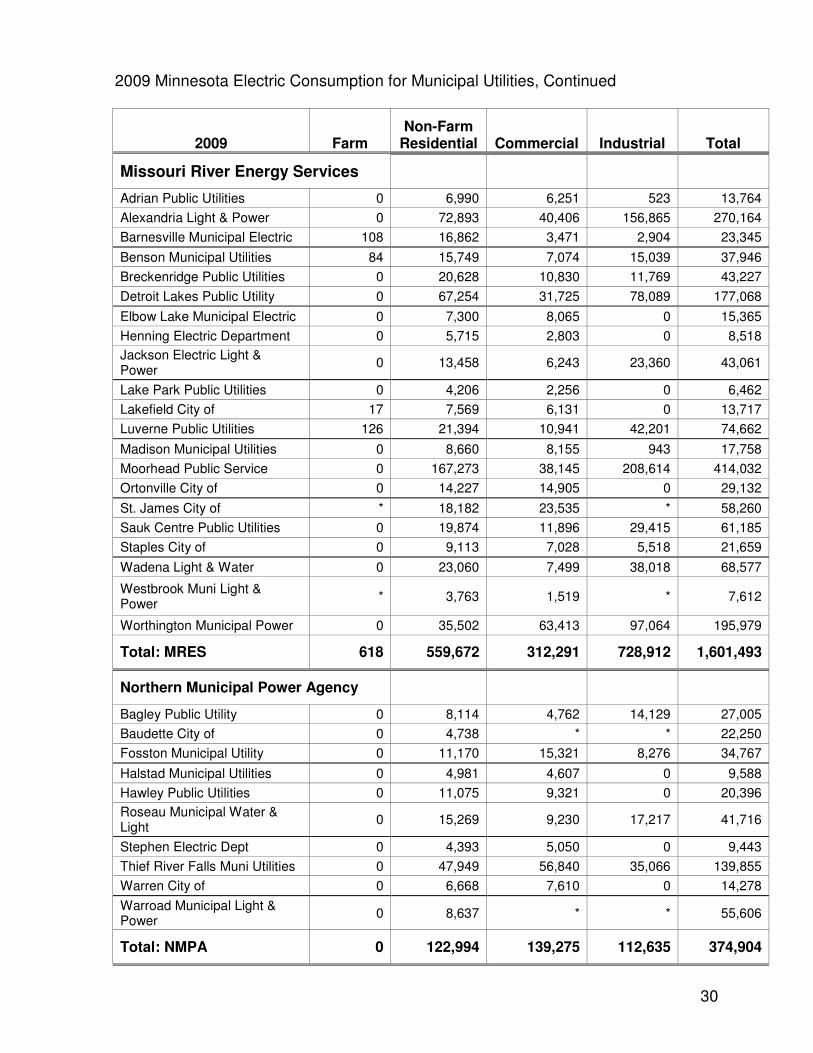
2009 Minnesota Electric Consumption for Municipal Utilities, Continued
2009 Farm Non-Farm
Residential Commercial Industrial Total
Missouri River Energy Services
Adrian Public Utilities 0 6,990 6,251 523 13,764
Alexandria Light & Power 0 72,893 40,406 156,865 270,164
Barnesville Municipal Electric 108 16,862 3,471 2,904 23,345
Benson Municipal Utilities 84 15,749 7,074 15,039 37,946
Breckenridge Public Utilities 0 20,628 10,830 11,769 43,227
Detroit Lakes Public Utility 0 67,254 31,725 78,089 177,068
Elbow Lake Municipal Electric 0 7,300 8,065 0 15,365
Henning Electric Department 0 5,715 2,803 0 8,518
Jackson Electric Light & Power
0 13,458 6,243 23,360 43,061
Lake Park Public Utilities 0 4,206 2,256 0 6,462
Lakefield City of 17 7,569 6,131 0 13,717
Luverne Public Utilities 126 21,394 10,941 42,201 74,662
Madison Municipal Utilities 0 8,660 8,155 943 17,758
Moorhead Public Service 0 167,273 38,145 208,614 414,032
Ortonville City of 0 14,227 14,905 0 29,132
St. James City of * 18,182 23,535 * 58,260
Sauk Centre Public Utilities 0 19,874 11,896 29,415 61,185
Staples City of 0 9,113 7,028 5,518 21,659
Wadena Light & Water 0 23,060 7,499 38,018 68,577
Westbrook Muni Light & Power
* 3,763 1,519 * 7,612
Worthington Municipal Power 0 35,502 63,413 97,064 195,979
Total: MRES 618 559,672 312,291 728,912 1,601,493
Northern Municipal Power Agency
Bagley Public Utility 0 8,114 4,762 14,129 27,005
Baudette City of 0 4,738 * * 22,250
Fosston Municipal Utility 0 11,170 15,321 8,276 34,767
Halstad Municipal Utilities 0 4,981 4,607 0 9,588
Hawley Public Utilities 0 11,075 9,321 0 20,396
Roseau Municipal Water & Light
0 15,269 9,230 17,217 41,716
Stephen Electric Dept 0 4,393 5,050 0 9,443
Thief River Falls Muni Utilities 0 47,949 56,840 35,066 139,855
Warren City of 0 6,668 7,610 0 14,278
Warroad Municipal Light & Power
0 8,637 * * 55,606
Total: NMPA 0 122,994 139,275 112,635 374,904
31
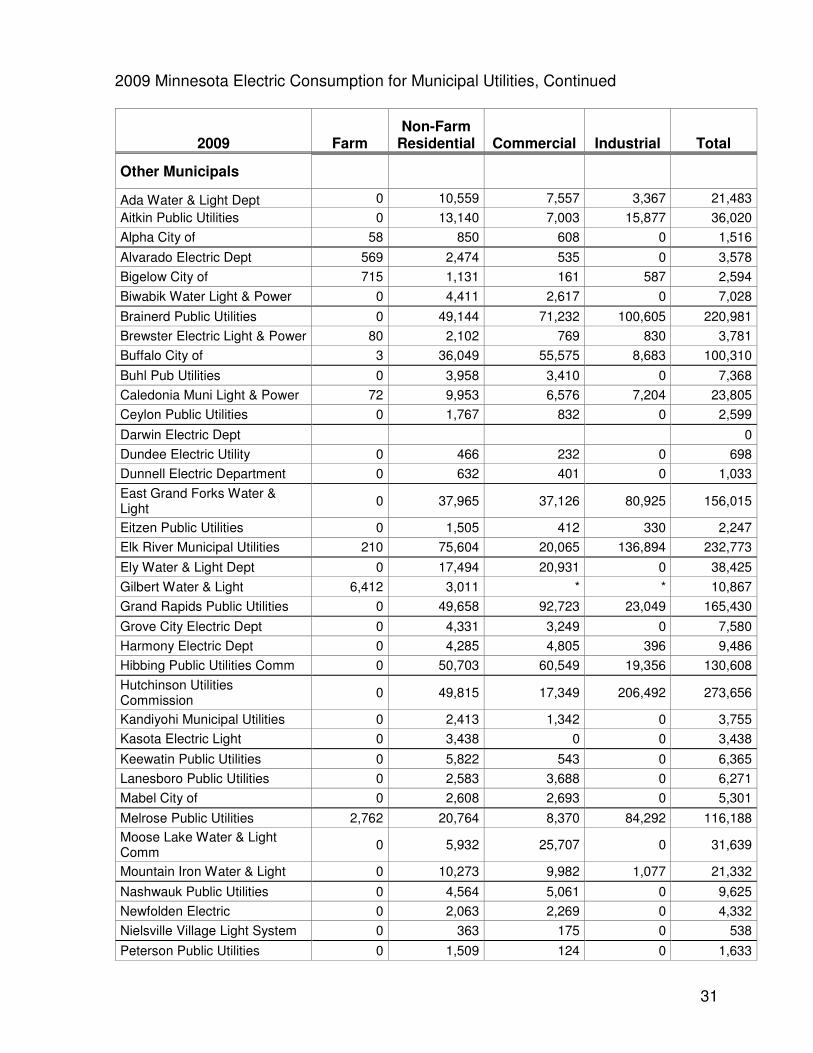
2009 Minnesota Electric Consumption for Municipal Utilities, Continued
2009 Farm Non-Farm
Residential Commercial Industrial Total
Other Municipals
Ada Water & Light Dept 0 10,559 7,557 3,367 21,483
Aitkin Public Utilities 0 13,140 7,003 15,877 36,020
Alpha City of 58 850 608 0 1,516
Alvarado Electric Dept 569 2,474 535 0 3,578
Bigelow City of 715 1,131 161 587 2,594
Biwabik Water Light & Power 0 4,411 2,617 0 7,028
Brainerd Public Utilities 0 49,144 71,232 100,605 220,981
Brewster Electric Light & Power 80 2,102 769 830 3,781
Buffalo City of 3 36,049 55,575 8,683 100,310
Buhl Pub Utilities 0 3,958 3,410 0 7,368
Caledonia Muni Light & Power 72 9,953 6,576 7,204 23,805
Ceylon Public Utilities 0 1,767 832 0 2,599
Darwin Electric Dept 0
Dundee Electric Utility 0 466 232 0 698
Dunnell Electric Department 0 632 401 0 1,033
East Grand Forks Water & Light
0 37,965 37,126 80,925 156,015
Eitzen Public Utilities 0 1,505 412 330 2,247
Elk River Municipal Utilities 210 75,604 20,065 136,894 232,773
Ely Water & Light Dept 0 17,494 20,931 0 38,425
Gilbert Water & Light 6,412 3,011 * * 10,867
Grand Rapids Public Utilities 0 49,658 92,723 23,049 165,430
Grove City Electric Dept 0 4,331 3,249 0 7,580
Harmony Electric Dept 0 4,285 4,805 396 9,486
Hibbing Public Utilities Comm 0 50,703 60,549 19,356 130,608
Hutchinson Utilities Commission
0 49,815 17,349 206,492 273,656
Kandiyohi Municipal Utilities 0 2,413 1,342 0 3,755
Kasota Electric Light 0 3,438 0 0 3,438
Keewatin Public Utilities 0 5,822 543 0 6,365
Lanesboro Public Utilities 0 2,583 3,688 0 6,271
Mabel City of 0 2,608 2,693 0 5,301
Melrose Public Utilities 2,762 20,764 8,370 84,292 116,188
Moose Lake Water & Light Comm
0 5,932 25,707 0 31,639
Mountain Iron Water & Light 0 10,273 9,982 1,077 21,332
Nashwauk Public Utilities 0 4,564 5,061 0 9,625
Newfolden Electric 0 2,063 2,269 0 4,332
Nielsville Village Light System 0 363 175 0 538
Peterson Public Utilities 0 1,509 124 0 1,633
32
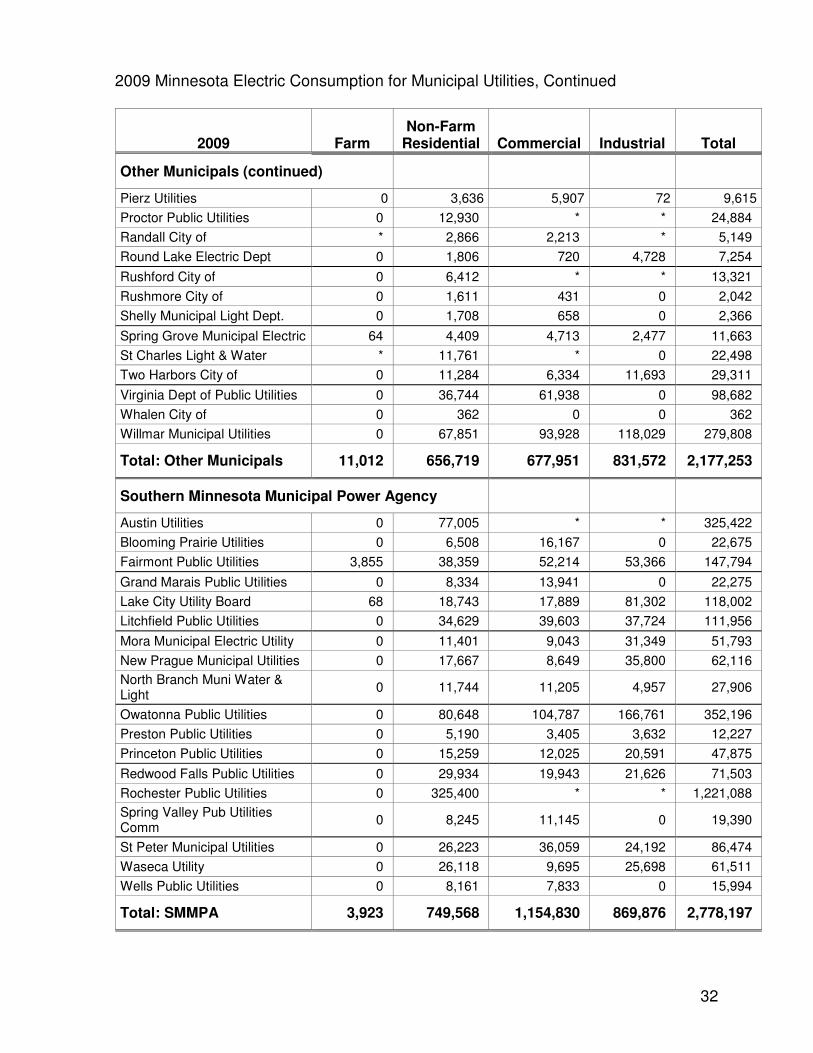
2009 Minnesota Electric Consumption for Municipal Utilities, Continued
2009 Farm Non-Farm
Residential Commercial Industrial Total
Other Municipals (continued)
Pierz Utilities 0 3,636 5,907 72 9,615
Proctor Public Utilities 0 12,930 * * 24,884
Randall City of * 2,866 2,213 * 5,149
Round Lake Electric Dept 0 1,806 720 4,728 7,254
Rushford City of 0 6,412 * * 13,321
Rushmore City of 0 1,611 431 0 2,042
Shelly Municipal Light Dept. 0 1,708 658 0 2,366
Spring Grove Municipal Electric 64 4,409 4,713 2,477 11,663
St Charles Light & Water * 11,761 * 0 22,498
Two Harbors City of 0 11,284 6,334 11,693 29,311
Virginia Dept of Public Utilities 0 36,744 61,938 0 98,682
Whalen City of 0 362 0 0 362
Willmar Municipal Utilities 0 67,851 93,928 118,029 279,808
Total: Other Municipals 11,012 656,719 677,951 831,572 2,177,253
Southern Minnesota Municipal Power Agency
Austin Utilities 0 77,005 * * 325,422
Blooming Prairie Utilities 0 6,508 16,167 0 22,675
Fairmont Public Utilities 3,855 38,359 52,214 53,366 147,794
Grand Marais Public Utilities 0 8,334 13,941 0 22,275
Lake City Utility Board 68 18,743 17,889 81,302 118,002
Litchfield Public Utilities 0 34,629 39,603 37,724 111,956
Mora Municipal Electric Utility 0 11,401 9,043 31,349 51,793
New Prague Municipal Utilities 0 17,667 8,649 35,800 62,116
North Branch Muni Water & Light
0 11,744 11,205 4,957 27,906
Owatonna Public Utilities 0 80,648 104,787 166,761 352,196
Preston Public Utilities 0 5,190 3,405 3,632 12,227
Princeton Public Utilities 0 15,259 12,025 20,591 47,875
Redwood Falls Public Utilities 0 29,934 19,943 21,626 71,503
Rochester Public Utilities 0 325,400 * * 1,221,088
Spring Valley Pub Utilities Comm
0 8,245 11,145 0 19,390
St Peter Municipal Utilities 0 26,223 36,059 24,192 86,474
Waseca Utility 0 26,118 9,695 25,698 61,511
Wells Public Utilities 0 8,161 7,833 0 15,994
Total: SMMPA 3,923 749,568 1,154,830 869,876 2,778,197
33
2009 Minnesota Electric Consumption for Municipal Utilities, Continued
2009 Farm Non-Farm
Residential Commercial Industrial Total
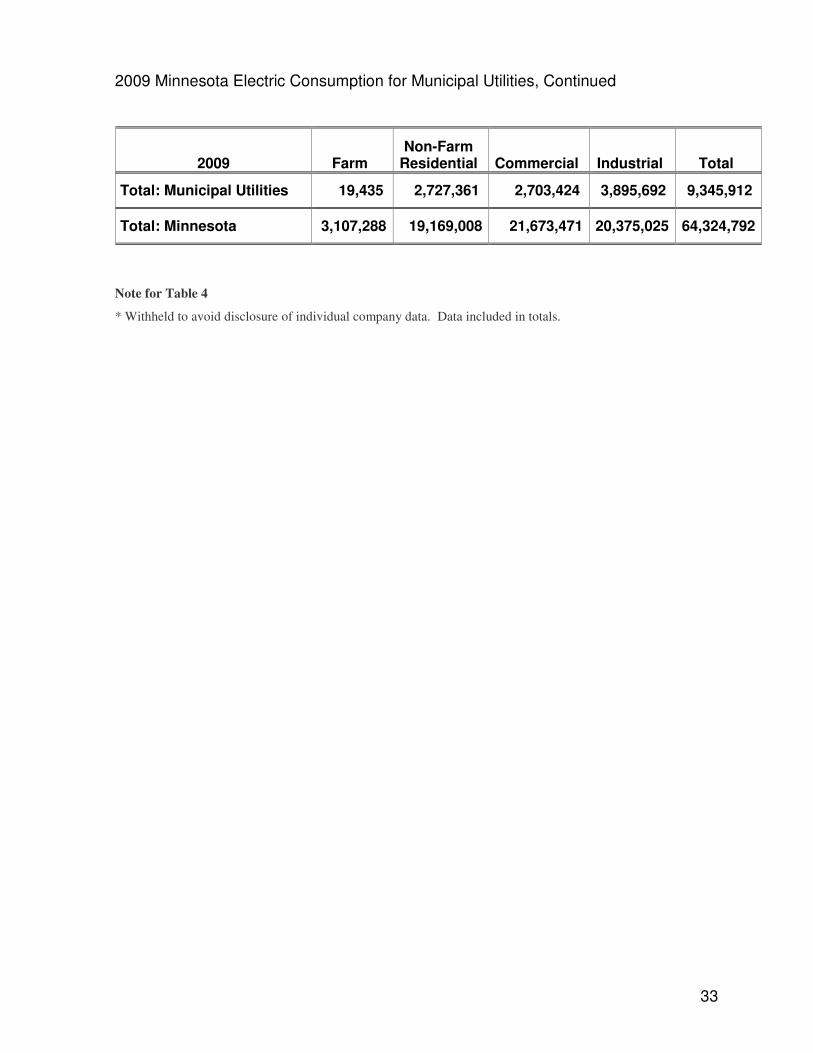
Total: Municipal Utilities 19,435 2,727,361 2,703,424 3,895,692 9,345,912
Total: Minnesota 3,107,288 19,169,008 21,673,471 20,375,025 64,324,792
Note for Table 4
* Withheld to avoid disclosure of individual company data. Data included in totals.
34
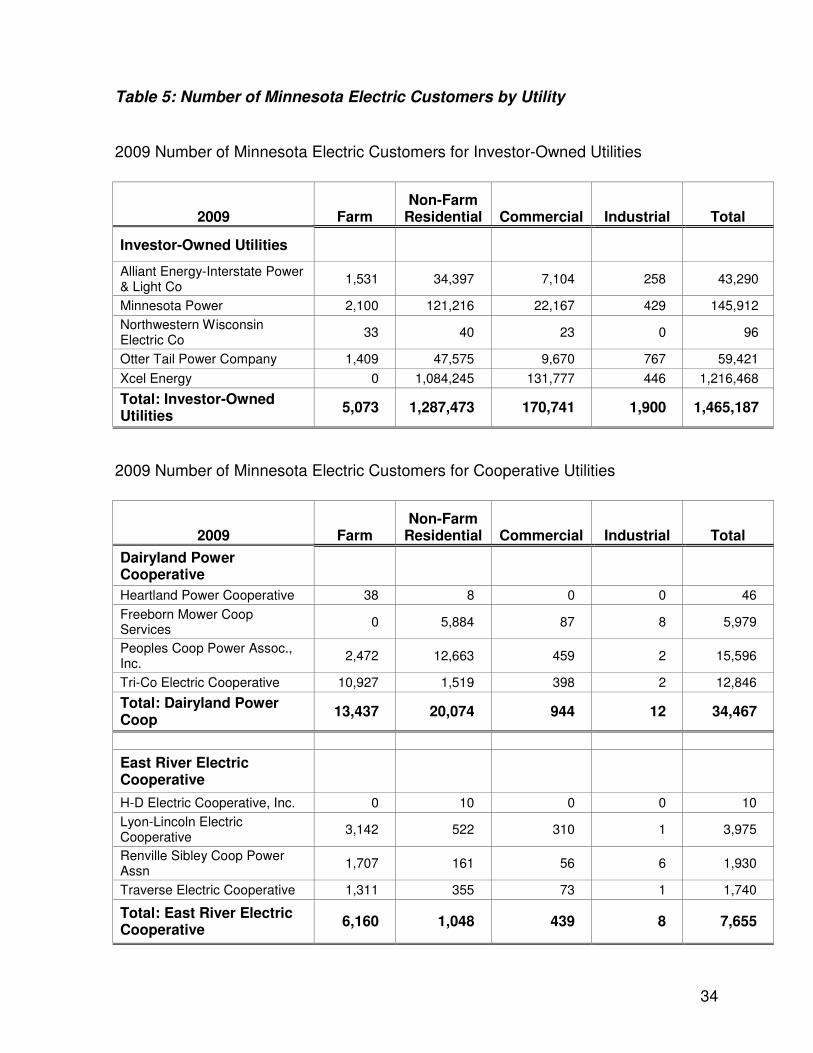
Table 5: Number of Minnesota Electric Customers by Utility
2009 Number of Minnesota Electric Customers for Investor-Owned Utilities
2009 Farm Non-Farm
Residential Commercial Industrial Total
Investor-Owned Utilities
Alliant Energy-Interstate Power & Light Co
1,531 34,397 7,104 258 43,290
Minnesota Power 2,100 121,216 22,167 429 145,912
Northwestern Wisconsin Electric Co
33 40 23 0 96
Otter Tail Power Company 1,409 47,575 9,670 767 59,421
Xcel Energy 0 1,084,245 131,777 446 1,216,468
Total: Investor-Owned Utilities
5,073 1,287,473 170,741 1,900 1,465,187
2009 Number of Minnesota Electric Customers for Cooperative Utilities
2009 Farm Non-Farm
Residential Commercial Industrial Total
Dairyland Power Cooperative
Heartland Power Cooperative 38 8 0 0 46
Freeborn Mower Coop Services
0 5,884 87 8 5,979
Peoples Coop Power Assoc., Inc.
2,472 12,663 459 2 15,596
Tri-Co Electric Cooperative 10,927 1,519 398 2 12,846
Total: Dairyland Power Coop
13,437 20,074 944 12 34,467
East River Electric Cooperative H-D Electric Cooperative, Inc. 0 10 0 0 10
Lyon-Lincoln Electric Cooperative
3,142 522 310 1 3,975
Renville Sibley Coop Power Assn
1,707 161 56 6 1,930
Traverse Electric Cooperative 1,311 355 73 1 1,740
Total: East River Electric Cooperative
6,160 1,048 439 8 7,655
35
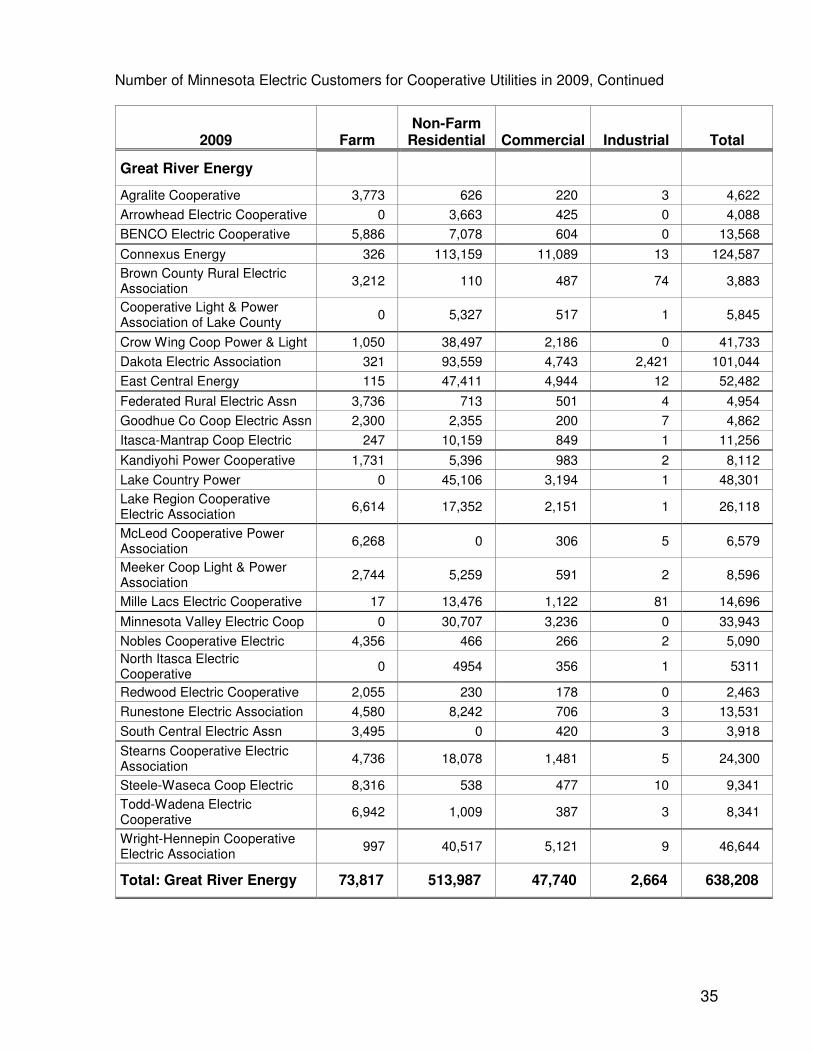
Number of Minnesota Electric Customers for Cooperative Utilities in 2009, Continued
2009 Farm Non-Farm
Residential Commercial Industrial Total
Great River Energy
Agralite Cooperative 3,773 626 220 3 4,622
Arrowhead Electric Cooperative 0 3,663 425 0 4,088
BENCO Electric Cooperative 5,886 7,078 604 0 13,568
Connexus Energy 326 113,159 11,089 13 124,587
Brown County Rural Electric Association
3,212 110 487 74 3,883
Cooperative Light & Power Association of Lake County
0 5,327 517 1 5,845
Crow Wing Coop Power & Light 1,050 38,497 2,186 0 41,733
Dakota Electric Association 321 93,559 4,743 2,421 101,044
East Central Energy 115 47,411 4,944 12 52,482
Federated Rural Electric Assn 3,736 713 501 4 4,954
Goodhue Co Coop Electric Assn 2,300 2,355 200 7 4,862
Itasca-Mantrap Coop Electric 247 10,159 849 1 11,256
Kandiyohi Power Cooperative 1,731 5,396 983 2 8,112
Lake Country Power 0 45,106 3,194 1 48,301
Lake Region Cooperative Electric Association
6,614 17,352 2,151 1 26,118
McLeod Cooperative Power Association
6,268 0 306 5 6,579
Meeker Coop Light & Power Association
2,744 5,259 591 2 8,596
Mille Lacs Electric Cooperative 17 13,476 1,122 81 14,696
Minnesota Valley Electric Coop 0 30,707 3,236 0 33,943
Nobles Cooperative Electric 4,356 466 266 2 5,090
North Itasca Electric Cooperative
0 4954 356 1 5311
Redwood Electric Cooperative 2,055 230 178 0 2,463
Runestone Electric Association 4,580 8,242 706 3 13,531
South Central Electric Assn 3,495 0 420 3 3,918
Stearns Cooperative Electric Association
4,736 18,078 1,481 5 24,300
Steele-Waseca Coop Electric 8,316 538 477 10 9,341
Todd-Wadena Electric Cooperative
6,942 1,009 387 3 8,341
Wright-Hennepin Cooperative Electric Association
997 40,517 5,121 9 46,644
Total: Great River Energy 73,817 513,987 47,740 2,664 638,208
36
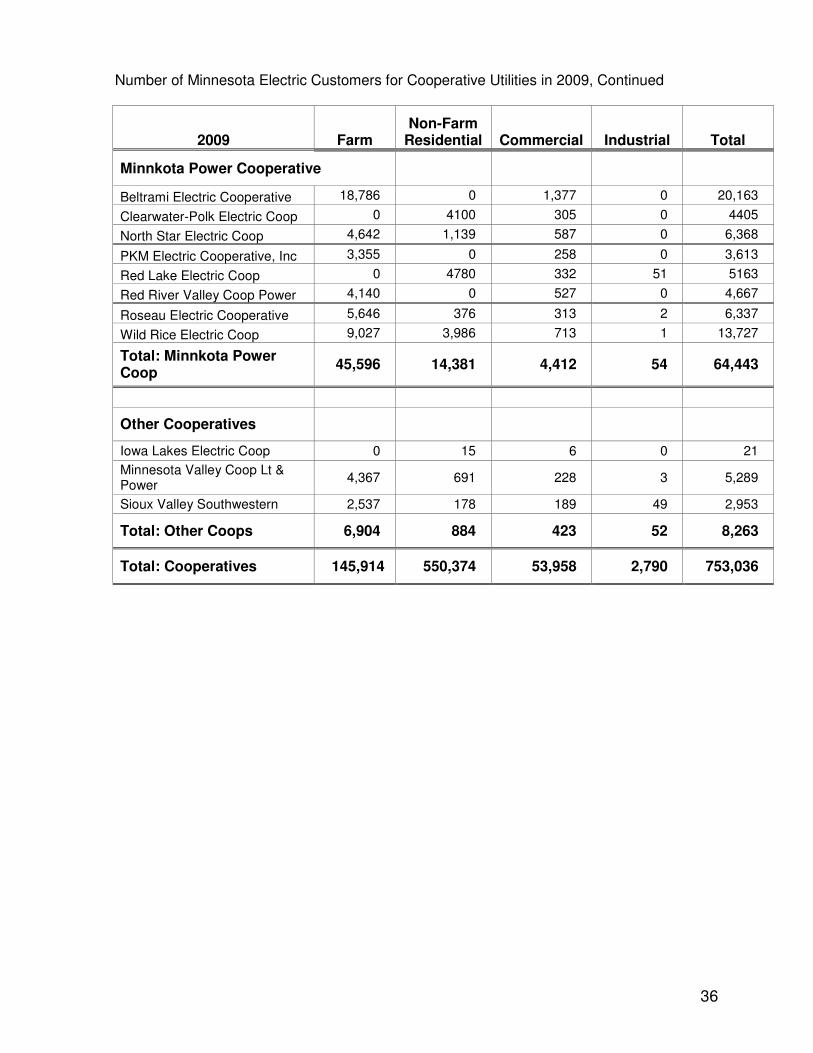
Number of Minnesota Electric Customers for Cooperative Utilities in 2009, Continued
2009 Farm Non-Farm
Residential Commercial Industrial Total
Minnkota Power Cooperative
Beltrami Electric Cooperative 18,786 0 1,377 0 20,163
Clearwater-Polk Electric Coop 0 4100 305 0 4405
North Star Electric Coop 4,642 1,139 587 0 6,368
PKM Electric Cooperative, Inc 3,355 0 258 0 3,613
Red Lake Electric Coop 0 4780 332 51 5163
Red River Valley Coop Power 4,140 0 527 0 4,667
Roseau Electric Cooperative 5,646 376 313 2 6,337
Wild Rice Electric Coop 9,027 3,986 713 1 13,727
Total: Minnkota Power Coop
45,596 14,381 4,412 54 64,443
Other Cooperatives
Iowa Lakes Electric Coop 0 15 6 0 21
Minnesota Valley Coop Lt & Power
4,367 691 228 3 5,289
Sioux Valley Southwestern 2,537 178 189 49 2,953
Total: Other Coops 6,904 884 423 52 8,263
Total: Cooperatives 145,914 550,374 53,958 2,790 753,036
37
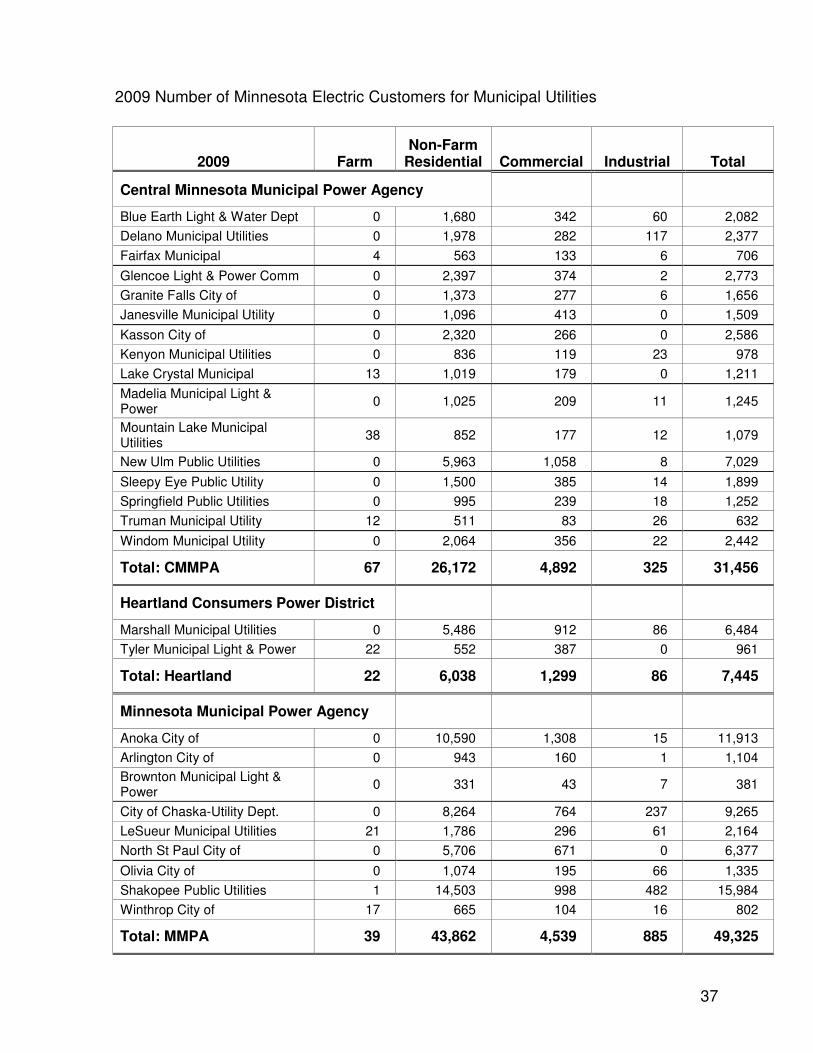
2009 Number of Minnesota Electric Customers for Municipal Utilities
2009 Farm Non-Farm
Residential Commercial Industrial Total
Central Minnesota Municipal Power Agency
Blue Earth Light & Water Dept 0 1,680 342 60 2,082
Delano Municipal Utilities 0 1,978 282 117 2,377
Fairfax Municipal 4 563 133 6 706
Glencoe Light & Power Comm 0 2,397 374 2 2,773
Granite Falls City of 0 1,373 277 6 1,656
Janesville Municipal Utility 0 1,096 413 0 1,509
Kasson City of 0 2,320 266 0 2,586
Kenyon Municipal Utilities 0 836 119 23 978
Lake Crystal Municipal 13 1,019 179 0 1,211
Madelia Municipal Light & Power
0 1,025 209 11 1,245
Mountain Lake Municipal Utilities
38 852 177 12 1,079
New Ulm Public Utilities 0 5,963 1,058 8 7,029
Sleepy Eye Public Utility 0 1,500 385 14 1,899
Springfield Public Utilities 0 995 239 18 1,252
Truman Municipal Utility 12 511 83 26 632
Windom Municipal Utility 0 2,064 356 22 2,442
Total: CMMPA 67 26,172 4,892 325 31,456
Heartland Consumers Power District
Marshall Municipal Utilities 0 5,486 912 86 6,484
Tyler Municipal Light & Power 22 552 387 0 961
Total: Heartland 22 6,038 1,299 86 7,445
Minnesota Municipal Power Agency
Anoka City of 0 10,590 1,308 15 11,913
Arlington City of 0 943 160 1 1,104
Brownton Municipal Light & Power
0 331 43 7 381
City of Chaska-Utility Dept. 0 8,264 764 237 9,265
LeSueur Municipal Utilities 21 1,786 296 61 2,164
North St Paul City of 0 5,706 671 0 6,377
Olivia City of 0 1,074 195 66 1,335
Shakopee Public Utilities 1 14,503 998 482 15,984
Winthrop City of 17 665 104 16 802
Total: MMPA 39 43,862 4,539 885 49,325
38
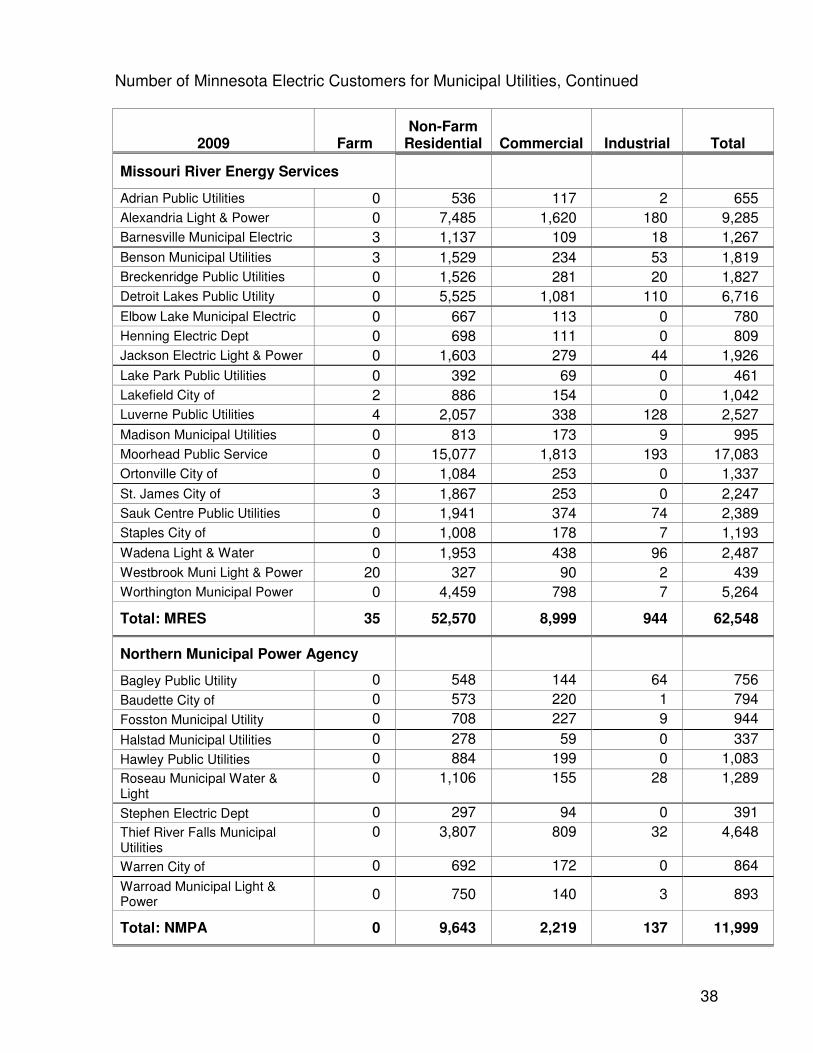
Number of Minnesota Electric Customers for Municipal Utilities, Continued
2009 Farm Non-Farm
Residential Commercial Industrial Total
Missouri River Energy Services
Adrian Public Utilities 0 536 117 2 655
Alexandria Light & Power 0 7,485 1,620 180 9,285
Barnesville Municipal Electric 3 1,137 109 18 1,267
Benson Municipal Utilities 3 1,529 234 53 1,819
Breckenridge Public Utilities 0 1,526 281 20 1,827
Detroit Lakes Public Utility 0 5,525 1,081 110 6,716
Elbow Lake Municipal Electric 0 667 113 0 780
Henning Electric Dept 0 698 111 0 809
Jackson Electric Light & Power 0 1,603 279 44 1,926
Lake Park Public Utilities 0 392 69 0 461
Lakefield City of 2 886 154 0 1,042
Luverne Public Utilities 4 2,057 338 128 2,527
Madison Municipal Utilities 0 813 173 9 995
Moorhead Public Service 0 15,077 1,813 193 17,083
Ortonville City of 0 1,084 253 0 1,337
St. James City of 3 1,867 253 0 2,247
Sauk Centre Public Utilities 0 1,941 374 74 2,389
Staples City of 0 1,008 178 7 1,193
Wadena Light & Water 0 1,953 438 96 2,487
Westbrook Muni Light & Power 20 327 90 2 439
Worthington Municipal Power 0 4,459 798 7 5,264
Total: MRES 35 52,570 8,999 944 62,548
Northern Municipal Power Agency
Bagley Public Utility 0 548 144 64 756
Baudette City of 0 573 220 1 794
Fosston Municipal Utility 0 708 227 9 944
Halstad Municipal Utilities 0 278 59 0 337
Hawley Public Utilities 0 884 199 0 1,083
Roseau Municipal Water & Light
0 1,106 155 28 1,289
Stephen Electric Dept 0 297 94 0 391
Thief River Falls Municipal Utilities
0 3,807 809 32 4,648
Warren City of 0 692 172 0 864
Warroad Municipal Light & Power
0 750 140 3 893
Total: NMPA 0 9,643 2,219 137 11,999
39
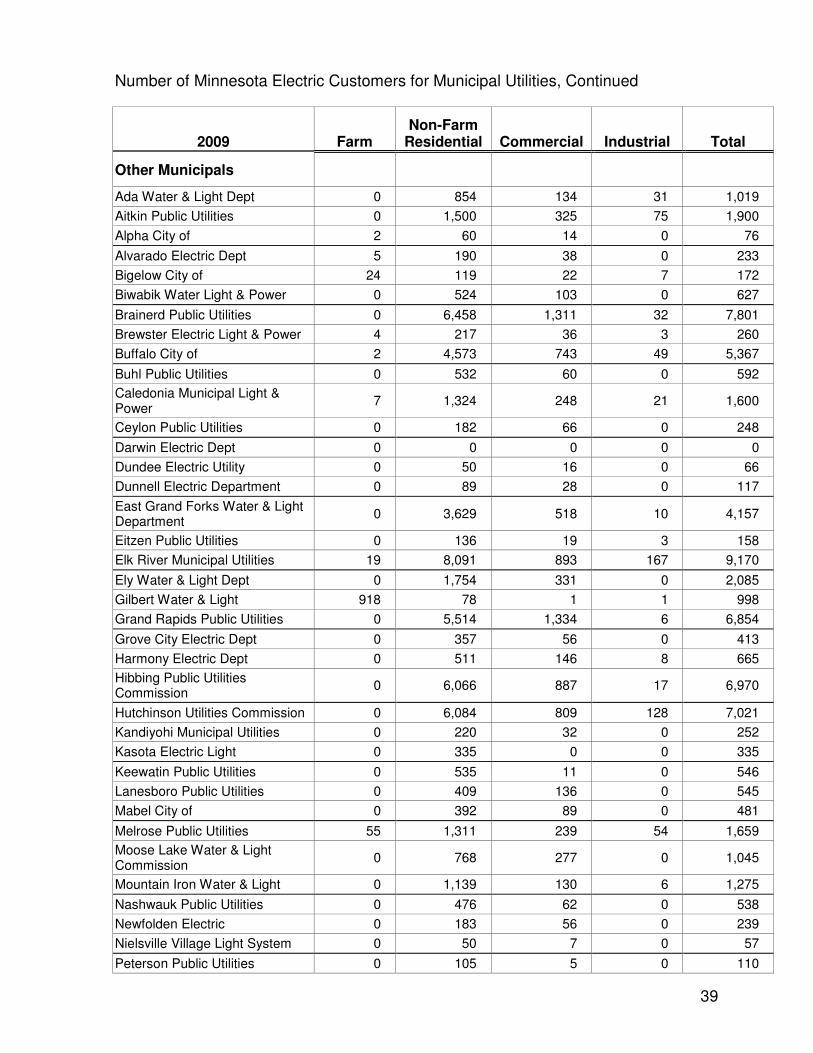
Number of Minnesota Electric Customers for Municipal Utilities, Continued
2009 Farm Non-Farm
Residential Commercial Industrial Total
Other Municipals
Ada Water & Light Dept 0 854 134 31 1,019
Aitkin Public Utilities 0 1,500 325 75 1,900
Alpha City of 2 60 14 0 76
Alvarado Electric Dept 5 190 38 0 233
Bigelow City of 24 119 22 7 172
Biwabik Water Light & Power 0 524 103 0 627
Brainerd Public Utilities 0 6,458 1,311 32 7,801
Brewster Electric Light & Power 4 217 36 3 260
Buffalo City of 2 4,573 743 49 5,367
Buhl Public Utilities 0 532 60 0 592
Caledonia Municipal Light & Power
7 1,324 248 21 1,600
Ceylon Public Utilities 0 182 66 0 248
Darwin Electric Dept 0 0 0 0 0
Dundee Electric Utility 0 50 16 0 66
Dunnell Electric Department 0 89 28 0 117
East Grand Forks Water & Light Department
0 3,629 518 10 4,157
Eitzen Public Utilities 0 136 19 3 158
Elk River Municipal Utilities 19 8,091 893 167 9,170
Ely Water & Light Dept 0 1,754 331 0 2,085
Gilbert Water & Light 918 78 1 1 998
Grand Rapids Public Utilities 0 5,514 1,334 6 6,854
Grove City Electric Dept 0 357 56 0 413
Harmony Electric Dept 0 511 146 8 665
Hibbing Public Utilities Commission
0 6,066 887 17 6,970
Hutchinson Utilities Commission 0 6,084 809 128 7,021
Kandiyohi Municipal Utilities 0 220 32 0 252
Kasota Electric Light 0 335 0 0 335
Keewatin Public Utilities 0 535 11 0 546
Lanesboro Public Utilities 0 409 136 0 545
Mabel City of 0 392 89 0 481
Melrose Public Utilities 55 1,311 239 54 1,659
Moose Lake Water & Light Commission
0 768 277 0 1,045
Mountain Iron Water & Light 0 1,139 130 6 1,275
Nashwauk Public Utilities 0 476 62 0 538
Newfolden Electric 0 183 56 0 239
Nielsville Village Light System 0 50 7 0 57
Peterson Public Utilities 0 105 5 0 110
40
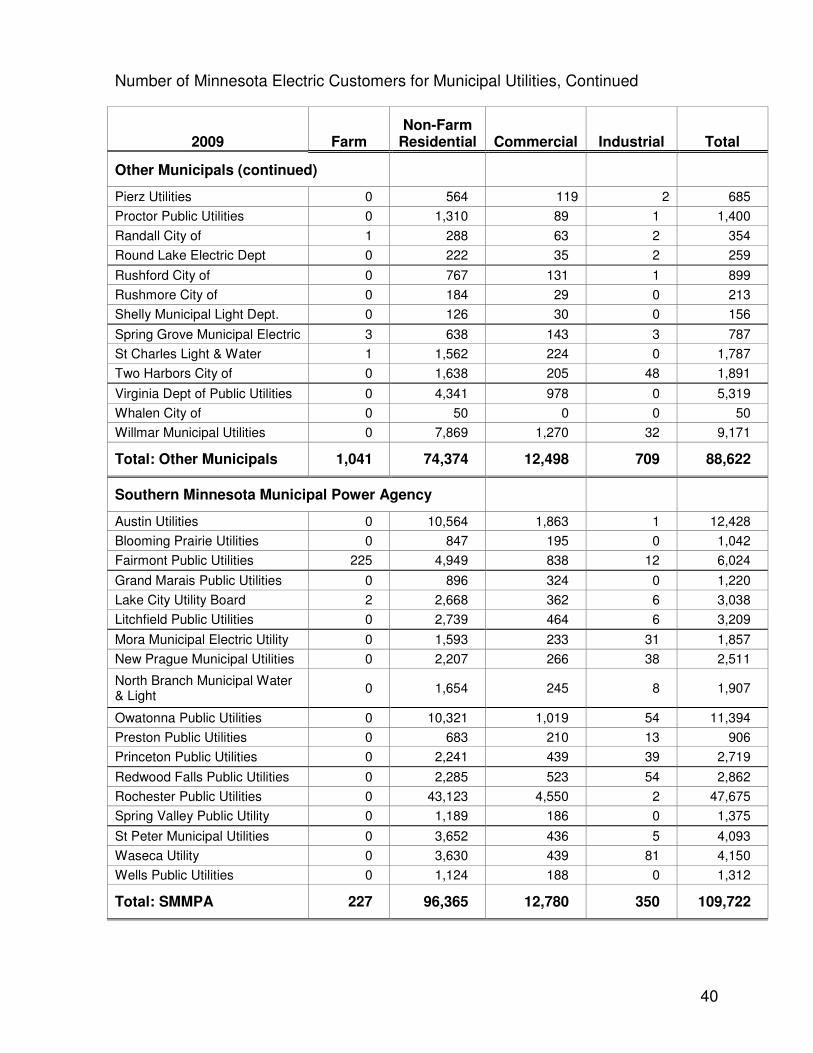
Number of Minnesota Electric Customers for Municipal Utilities, Continued
2009 Farm Non-Farm
Residential Commercial Industrial Total
Other Municipals (continued)
Pierz Utilities 0 564 119 2 685
Proctor Public Utilities 0 1,310 89 1 1,400
Randall City of 1 288 63 2 354
Round Lake Electric Dept 0 222 35 2 259
Rushford City of 0 767 131 1 899
Rushmore City of 0 184 29 0 213
Shelly Municipal Light Dept. 0 126 30 0 156
Spring Grove Municipal Electric 3 638 143 3 787
St Charles Light & Water 1 1,562 224 0 1,787
Two Harbors City of 0 1,638 205 48 1,891
Virginia Dept of Public Utilities 0 4,341 978 0 5,319
Whalen City of 0 50 0 0 50
Willmar Municipal Utilities 0 7,869 1,270 32 9,171
Total: Other Municipals 1,041 74,374 12,498 709 88,622
Southern Minnesota Municipal Power Agency
Austin Utilities 0 10,564 1,863 1 12,428
Blooming Prairie Utilities 0 847 195 0 1,042
Fairmont Public Utilities 225 4,949 838 12 6,024
Grand Marais Public Utilities 0 896 324 0 1,220
Lake City Utility Board 2 2,668 362 6 3,038
Litchfield Public Utilities 0 2,739 464 6 3,209
Mora Municipal Electric Utility 0 1,593 233 31 1,857
New Prague Municipal Utilities 0 2,207 266 38 2,511
North Branch Municipal Water & Light
0 1,654 245 8 1,907
Owatonna Public Utilities 0 10,321 1,019 54 11,394
Preston Public Utilities 0 683 210 13 906
Princeton Public Utilities 0 2,241 439 39 2,719
Redwood Falls Public Utilities 0 2,285 523 54 2,862
Rochester Public Utilities 0 43,123 4,550 2 47,675
Spring Valley Public Utility 0 1,189 186 0 1,375
St Peter Municipal Utilities 0 3,652 436 5 4,093
Waseca Utility 0 3,630 439 81 4,150
Wells Public Utilities 0 1,124 188 0 1,312
Total: SMMPA 227 96,365 12,780 350 109,722
41
Number of Minnesota Electric Customers for Municipal Utilities, Continued
2009 Farm Non-Farm
Residential Commercial Industrial Total
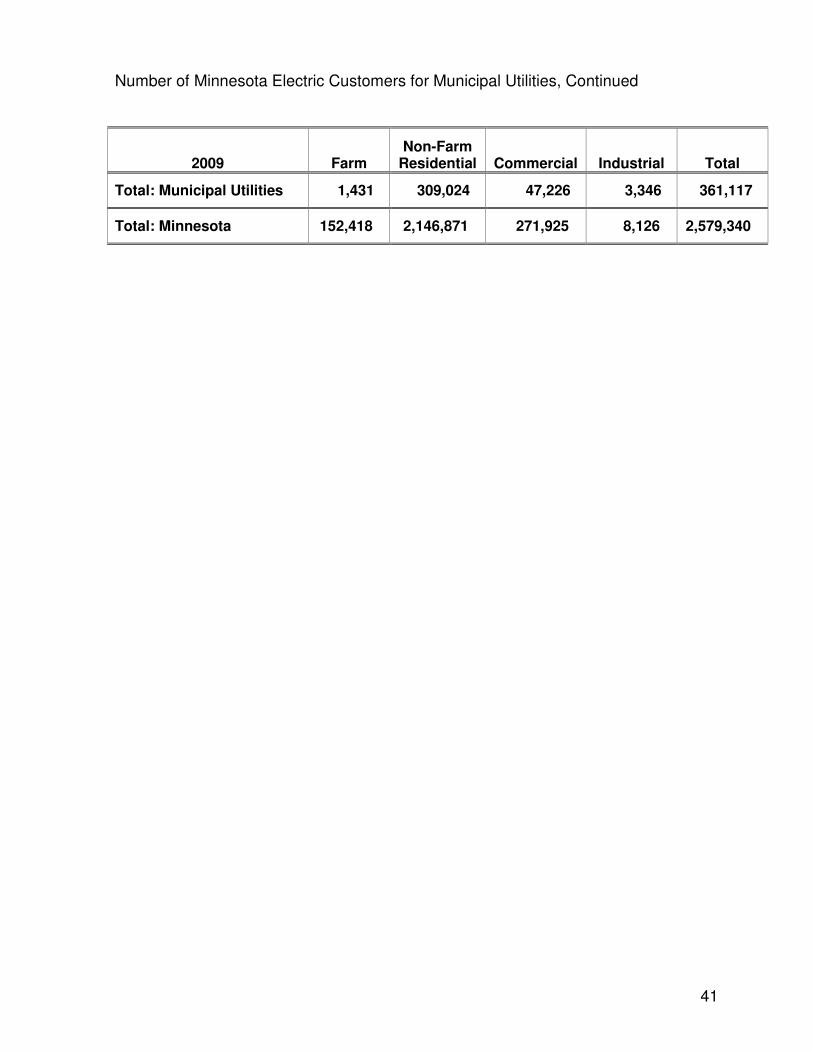
Total: Municipal Utilities 1,431 309,024 47,226 3,346 361,117
Total: Minnesota 152,418 2,146,871 271,925 8,126 2,579,340
42
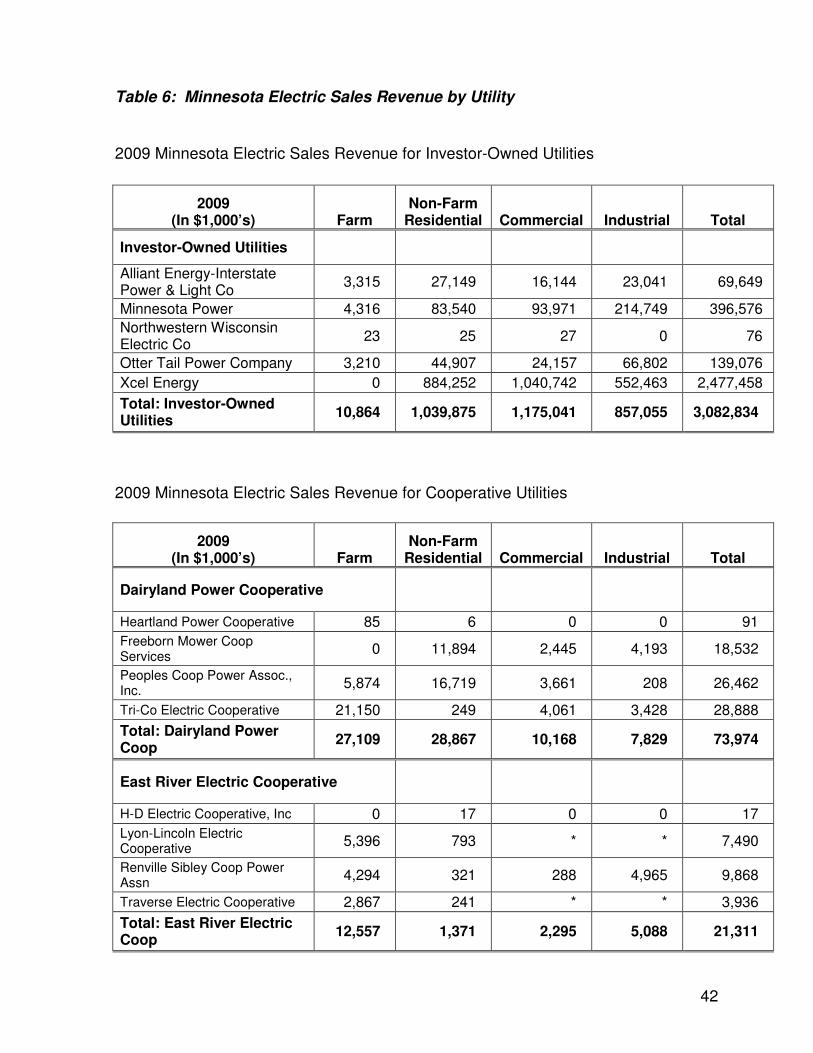
Table 6: Minnesota Electric Sales Revenue by Utility
2009 Minnesota Electric Sales Revenue for Investor-Owned Utilities
2009 (In $1,000’s) Farm
Non-Farm Residential Commercial Industrial Total
Investor-Owned Utilities
Alliant Energy-Interstate Power & Light Co
3,315 27,149 16,144 23,041 69,649
Minnesota Power 4,316 83,540 93,971 214,749 396,576
Northwestern Wisconsin Electric Co
23 25 27 0 76
Otter Tail Power Company 3,210 44,907 24,157 66,802 139,076
Xcel Energy 0 884,252 1,040,742 552,463 2,477,458
Total: Investor-Owned Utilities
10,864 1,039,875 1,175,041 857,055 3,082,834
2009 Minnesota Electric Sales Revenue for Cooperative Utilities
2009 (In $1,000’s) Farm
Non-Farm Residential Commercial Industrial Total
Dairyland Power Cooperative
Heartland Power Cooperative 85 6 0 0 91
Freeborn Mower Coop Services
0 11,894 2,445 4,193 18,532
Peoples Coop Power Assoc., Inc.
5,874 16,719 3,661 208 26,462
Tri-Co Electric Cooperative 21,150 249 4,061 3,428 28,888
Total: Dairyland Power Coop
27,109 28,867 10,168 7,829 73,974
East River Electric Cooperative
H-D Electric Cooperative, Inc 0 17 0 0 17
Lyon-Lincoln Electric Cooperative
5,396 793 * * 7,490
Renville Sibley Coop Power Assn
4,294 321 288 4,965 9,868
Traverse Electric Cooperative 2,867 241 * * 3,936
Total: East River Electric Coop
12,557 1,371 2,295 5,088 21,311
43
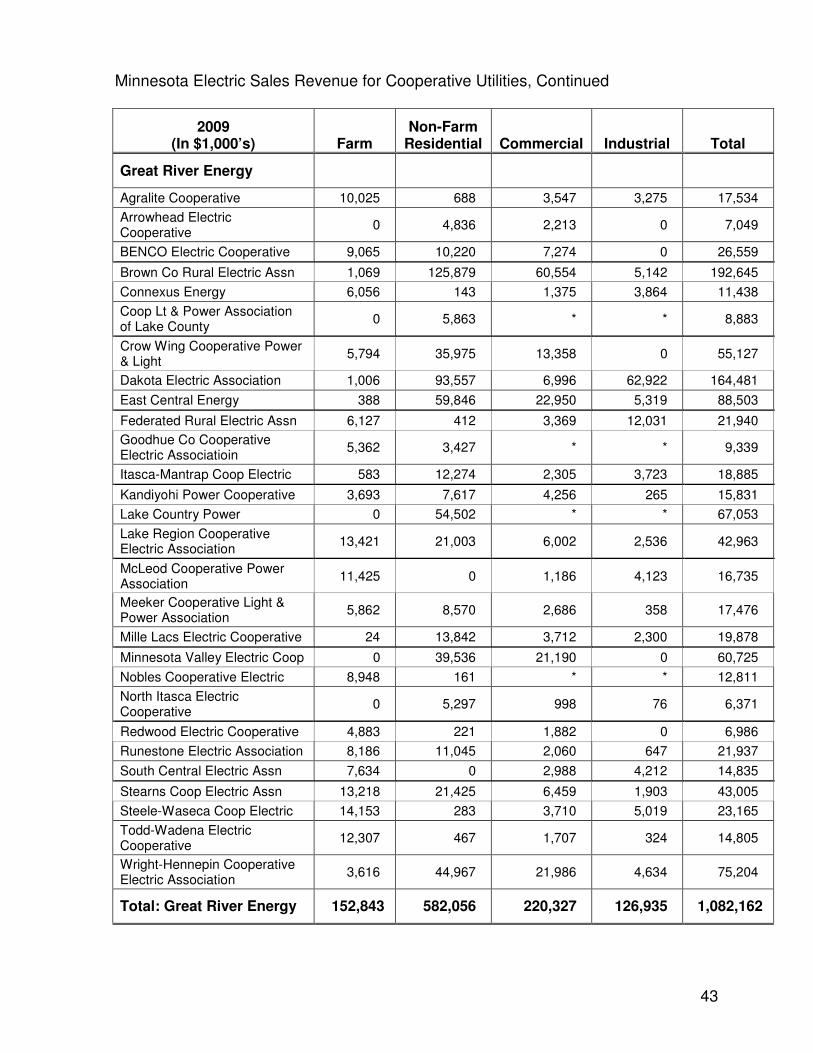
Minnesota Electric Sales Revenue for Cooperative Utilities, Continued
2009 (In $1,000’s) Farm
Non-Farm Residential Commercial Industrial Total
Great River Energy
Agralite Cooperative 10,025 688 3,547 3,275 17,534
Arrowhead Electric Cooperative
0 4,836 2,213 0 7,049
BENCO Electric Cooperative 9,065 10,220 7,274 0 26,559
Brown Co Rural Electric Assn 1,069 125,879 60,554 5,142 192,645
Connexus Energy 6,056 143 1,375 3,864 11,438
Coop Lt & Power Association of Lake County
0 5,863 * * 8,883
Crow Wing Cooperative Power & Light
5,794 35,975 13,358 0 55,127
Dakota Electric Association 1,006 93,557 6,996 62,922 164,481
East Central Energy 388 59,846 22,950 5,319 88,503
Federated Rural Electric Assn 6,127 412 3,369 12,031 21,940
Goodhue Co Cooperative Electric Associatioin
5,362 3,427 * * 9,339
Itasca-Mantrap Coop Electric 583 12,274 2,305 3,723 18,885
Kandiyohi Power Cooperative 3,693 7,617 4,256 265 15,831
Lake Country Power 0 54,502 * * 67,053
Lake Region Cooperative Electric Association
13,421 21,003 6,002 2,536 42,963
McLeod Cooperative Power Association
11,425 0 1,186 4,123 16,735
Meeker Cooperative Light & Power Association
5,862 8,570 2,686 358 17,476
Mille Lacs Electric Cooperative 24 13,842 3,712 2,300 19,878
Minnesota Valley Electric Coop 0 39,536 21,190 0 60,725
Nobles Cooperative Electric 8,948 161 * * 12,811
North Itasca Electric Cooperative
0 5,297 998 76 6,371
Redwood Electric Cooperative 4,883 221 1,882 0 6,986
Runestone Electric Association 8,186 11,045 2,060 647 21,937
South Central Electric Assn 7,634 0 2,988 4,212 14,835
Stearns Coop Electric Assn 13,218 21,425 6,459 1,903 43,005
Steele-Waseca Coop Electric 14,153 283 3,710 5,019 23,165
Todd-Wadena Electric Cooperative
12,307 467 1,707 324 14,805
Wright-Hennepin Cooperative Electric Association
3,616 44,967 21,986 4,634 75,204
Total: Great River Energy 152,843 582,056 220,327 126,935 1,082,162
44
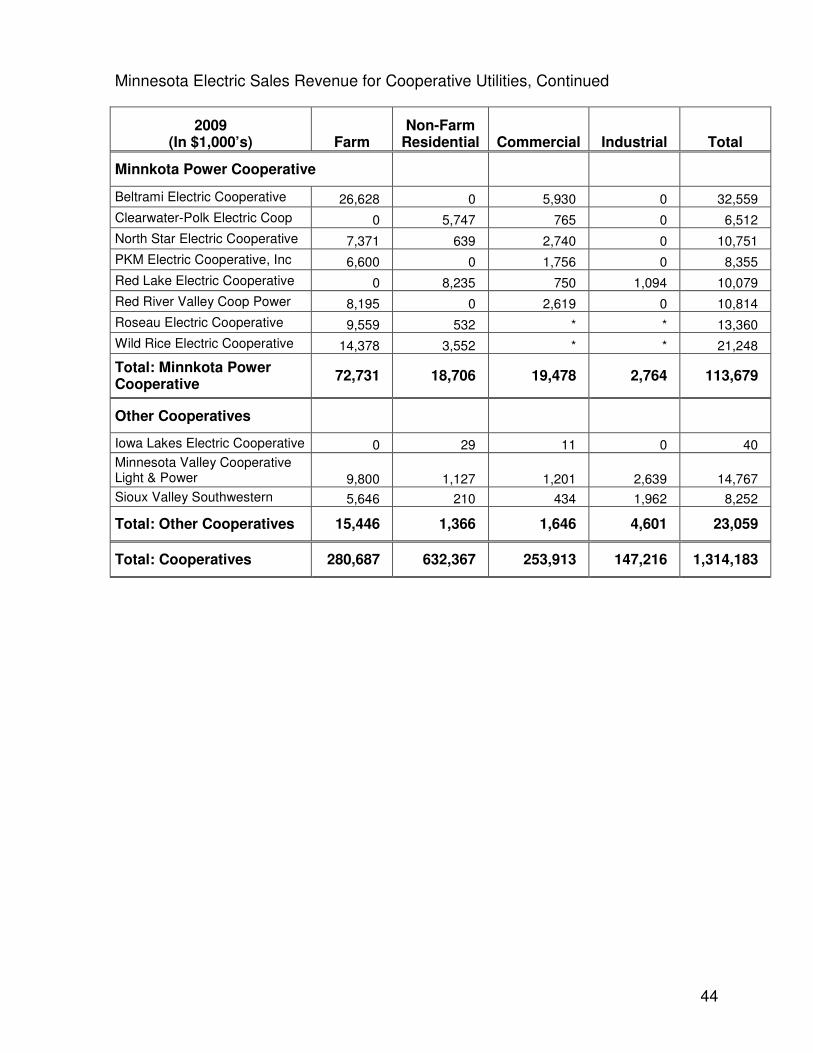
Minnesota Electric Sales Revenue for Cooperative Utilities, Continued
2009 (In $1,000’s) Farm
Non-Farm Residential Commercial Industrial Total
Minnkota Power Cooperative
Beltrami Electric Cooperative 26,628 0 5,930 0 32,559
Clearwater-Polk Electric Coop 0 5,747 765 0 6,512
North Star Electric Cooperative 7,371 639 2,740 0 10,751
PKM Electric Cooperative, Inc 6,600 0 1,756 0 8,355
Red Lake Electric Cooperative 0 8,235 750 1,094 10,079
Red River Valley Coop Power 8,195 0 2,619 0 10,814
Roseau Electric Cooperative 9,559 532 * * 13,360
Wild Rice Electric Cooperative 14,378 3,552 * * 21,248
Total: Minnkota Power Cooperative
72,731 18,706 19,478 2,764 113,679
Other Cooperatives
Iowa Lakes Electric Cooperative 0 29 11 0 40
Minnesota Valley Cooperative Light & Power 9,800 1,127 1,201 2,639 14,767
Sioux Valley Southwestern 5,646 210 434 1,962 8,252
Total: Other Cooperatives 15,446 1,366 1,646 4,601 23,059
Total: Cooperatives 280,687 632,367 253,913 147,216 1,314,183
45
2009 Minnesota Electric Sales Revenue for Municipal Utilities
2009 (In $1,000’s) Farm
Non-Farm Residential Commercial Industrial Total
Central Minnesota Municipal Power Agency
Blue Earth Light & Water Dept 0 1,428 734 3,031 5,194
Delano Municipal Utilities 0 1,727 435 2,269 4,432
Fairfax Municipal 6 555 373 217 1,151
Glencoe Light & Power Commission
0 2,122 2,606 1,900 6,628
Granite Falls City of 0 1,321 1,648 119 3,087
Janesville Municipal Utility 0 776 389 0 1,165
Kasson City Of 0 2,004 1,166 0 3,170
Kenyon Municipal Utilities 0 708 355 622 1,685
Lake Crystal Municipal 14 1,050 934 0 1,998
Madelia Municipal Light & Power
0 834 944 755 2,532
Mountain Lake Municipal Utilities
126 669 326 722 1,843
New Ulm Public Utilities 0 5,524 7,352 7,182 20,058
Sleepy Eye Public Utility 0 1,233 1,304 1,487 4,023
Springfield Public Utilities 0 1,000 551 824 2,376
Truman Municipal Utility 17 420 131 642 1,210
Windom Municipal Utility 0 1,568 1,245 2,435 5,248
Total: CMMPA 163 22,940 20,493 22,204 65,801
Heartland Consumers Power District
Marshall Municipal Utilities 0 4,749 2,897 28,087 35,734
Tyler Municipal Light & Power 26 663 175 0 865
Total: Heartland 26 5,412 3,073 28,087 36,599
Minnesota Municipal Power Agency
Anoka City of 0 7,944 7,758 6,950 22,652
Arlington City of 0 608 * * 1,425
Brownton Municipal Light & Power
0 328 * * 438
City of Chaska-Utility Dept. 0 6,514 1,493 13,841 21,847
Le Sueur Municipal Utilities 82 1,635 659 5,078 7,453
North St Paul City of 0 4,412 3,042 0 7,454
Olivia City of 0 815 235 881 1,931
Shakopee Public Utilities * 12,839 1,041 * 32,980
Winthrop City of * 511 218 * 1,257
Total: MMPA 117 35,606 15,129 46,585 97,438
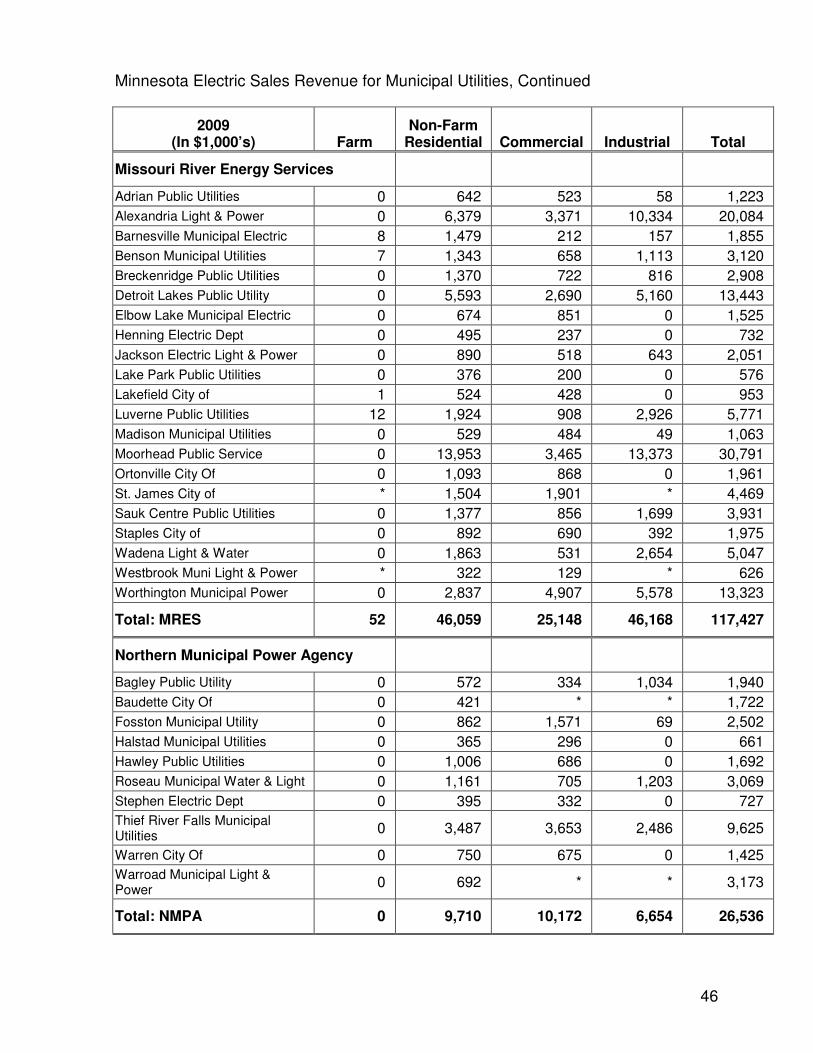
46
Minnesota Electric Sales Revenue for Municipal Utilities, Continued
2009 (In $1,000’s) Farm
Non-Farm Residential Commercial Industrial Total
Missouri River Energy Services
Adrian Public Utilities 0 642 523 58 1,223
Alexandria Light & Power 0 6,379 3,371 10,334 20,084
Barnesville Municipal Electric 8 1,479 212 157 1,855
Benson Municipal Utilities 7 1,343 658 1,113 3,120
Breckenridge Public Utilities 0 1,370 722 816 2,908
Detroit Lakes Public Utility 0 5,593 2,690 5,160 13,443
Elbow Lake Municipal Electric 0 674 851 0 1,525
Henning Electric Dept 0 495 237 0 732
Jackson Electric Light & Power 0 890 518 643 2,051
Lake Park Public Utilities 0 376 200 0 576
Lakefield City of 1 524 428 0 953
Luverne Public Utilities 12 1,924 908 2,926 5,771
Madison Municipal Utilities 0 529 484 49 1,063
Moorhead Public Service 0 13,953 3,465 13,373 30,791
Ortonville City Of 0 1,093 868 0 1,961
St. James City of * 1,504 1,901 * 4,469
Sauk Centre Public Utilities 0 1,377 856 1,699 3,931
Staples City of 0 892 690 392 1,975
Wadena Light & Water 0 1,863 531 2,654 5,047
Westbrook Muni Light & Power * 322 129 * 626
Worthington Municipal Power 0 2,837 4,907 5,578 13,323
Total: MRES 52 46,059 25,148 46,168 117,427
Northern Municipal Power Agency
Bagley Public Utility 0 572 334 1,034 1,940
Baudette City Of 0 421 * * 1,722
Fosston Municipal Utility 0 862 1,571 69 2,502
Halstad Municipal Utilities 0 365 296 0 661
Hawley Public Utilities 0 1,006 686 0 1,692
Roseau Municipal Water & Light 0 1,161 705 1,203 3,069
Stephen Electric Dept 0 395 332 0 727
Thief River Falls Municipal Utilities
0 3,487 3,653 2,486 9,625
Warren City Of 0 750 675 0 1,425
Warroad Municipal Light & Power
0 692 * * 3,173
Total: NMPA 0 9,710 10,172 6,654 26,536
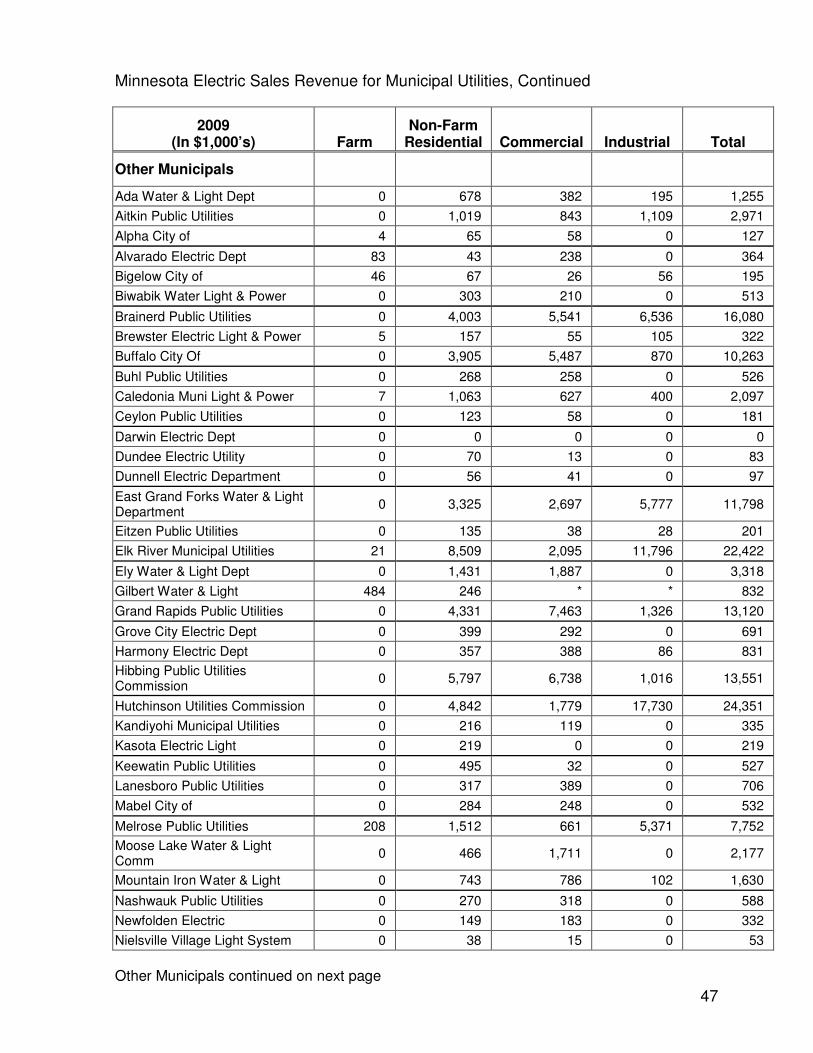
47
Minnesota Electric Sales Revenue for Municipal Utilities, Continued
2009 (In $1,000’s) Farm
Non-Farm Residential Commercial Industrial Total
Other Municipals
Ada Water & Light Dept 0 678 382 195 1,255
Aitkin Public Utilities 0 1,019 843 1,109 2,971
Alpha City of 4 65 58 0 127
Alvarado Electric Dept 83 43 238 0 364
Bigelow City of 46 67 26 56 195
Biwabik Water Light & Power 0 303 210 0 513
Brainerd Public Utilities 0 4,003 5,541 6,536 16,080
Brewster Electric Light & Power 5 157 55 105 322
Buffalo City Of 0 3,905 5,487 870 10,263
Buhl Public Utilities 0 268 258 0 526
Caledonia Muni Light & Power 7 1,063 627 400 2,097
Ceylon Public Utilities 0 123 58 0 181
Darwin Electric Dept 0 0 0 0 0
Dundee Electric Utility 0 70 13 0 83
Dunnell Electric Department 0 56 41 0 97
East Grand Forks Water & Light Department
0 3,325 2,697 5,777 11,798
Eitzen Public Utilities 0 135 38 28 201
Elk River Municipal Utilities 21 8,509 2,095 11,796 22,422
Ely Water & Light Dept 0 1,431 1,887 0 3,318
Gilbert Water & Light 484 246 * * 832
Grand Rapids Public Utilities 0 4,331 7,463 1,326 13,120
Grove City Electric Dept 0 399 292 0 691
Harmony Electric Dept 0 357 388 86 831
Hibbing Public Utilities Commission
0 5,797 6,738 1,016 13,551
Hutchinson Utilities Commission 0 4,842 1,779 17,730 24,351
Kandiyohi Municipal Utilities 0 216 119 0 335
Kasota Electric Light 0 219 0 0 219
Keewatin Public Utilities 0 495 32 0 527
Lanesboro Public Utilities 0 317 389 0 706
Mabel City of 0 284 248 0 532
Melrose Public Utilities 208 1,512 661 5,371 7,752
Moose Lake Water & Light Comm
0 466 1,711 0 2,177
Mountain Iron Water & Light 0 743 786 102 1,630
Nashwauk Public Utilities 0 270 318 0 588
Newfolden Electric 0 149 183 0 332
Nielsville Village Light System 0 38 15 0 53
Other Municipals continued on next page
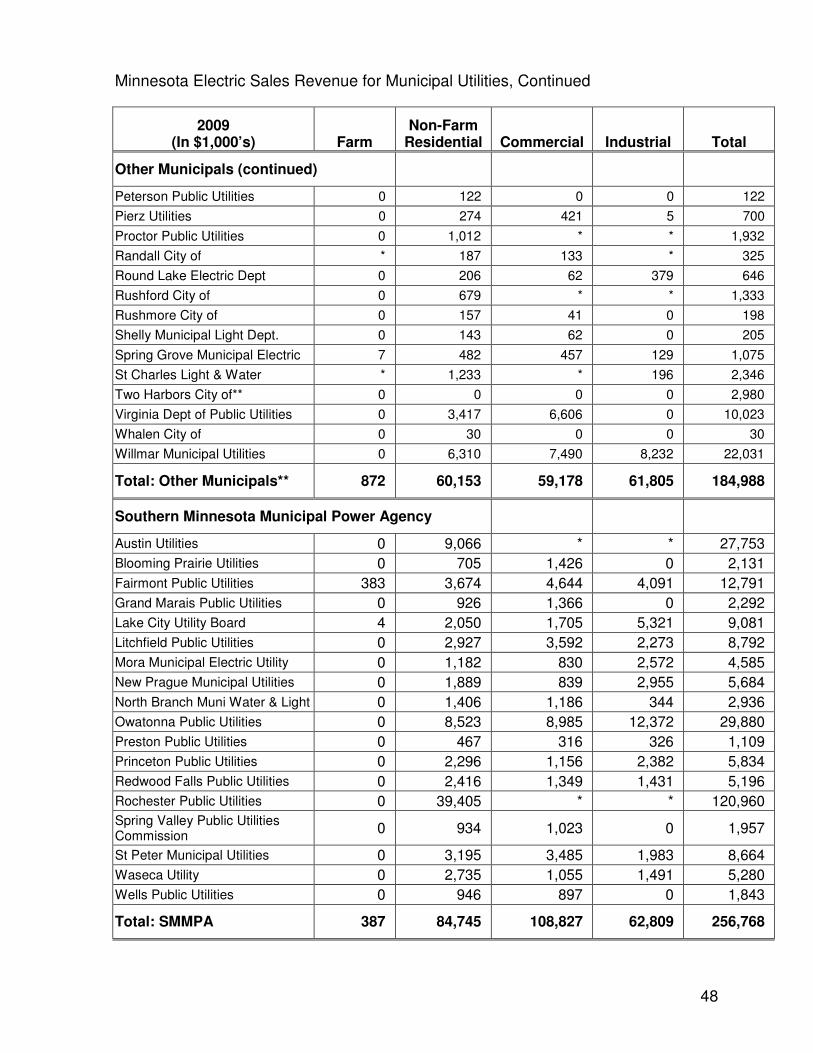
48
Minnesota Electric Sales Revenue for Municipal Utilities, Continued
2009 (In $1,000’s) Farm
Non-Farm Residential Commercial Industrial Total
Other Municipals (continued)
Peterson Public Utilities 0 122 0 0 122
Pierz Utilities 0 274 421 5 700
Proctor Public Utilities 0 1,012 * * 1,932
Randall City of * 187 133 * 325
Round Lake Electric Dept 0 206 62 379 646
Rushford City of 0 679 * * 1,333
Rushmore City of 0 157 41 0 198
Shelly Municipal Light Dept. 0 143 62 0 205
Spring Grove Municipal Electric 7 482 457 129 1,075
St Charles Light & Water * 1,233 * 196 2,346
Two Harbors City of** 0 0 0 0 2,980
Virginia Dept of Public Utilities 0 3,417 6,606 0 10,023
Whalen City of 0 30 0 0 30
Willmar Municipal Utilities 0 6,310 7,490 8,232 22,031
Total: Other Municipals** 872 60,153 59,178 61,805 184,988
Southern Minnesota Municipal Power Agency
Austin Utilities 0 9,066 * * 27,753
Blooming Prairie Utilities 0 705 1,426 0 2,131
Fairmont Public Utilities 383 3,674 4,644 4,091 12,791
Grand Marais Public Utilities 0 926 1,366 0 2,292
Lake City Utility Board 4 2,050 1,705 5,321 9,081
Litchfield Public Utilities 0 2,927 3,592 2,273 8,792
Mora Municipal Electric Utility 0 1,182 830 2,572 4,585
New Prague Municipal Utilities 0 1,889 839 2,955 5,684
North Branch Muni Water & Light 0 1,406 1,186 344 2,936
Owatonna Public Utilities 0 8,523 8,985 12,372 29,880
Preston Public Utilities 0 467 316 326 1,109
Princeton Public Utilities 0 2,296 1,156 2,382 5,834
Redwood Falls Public Utilities 0 2,416 1,349 1,431 5,196
Rochester Public Utilities 0 39,405 * * 120,960
Spring Valley Public Utilities Commission
0 934 1,023 0 1,957
St Peter Municipal Utilities 0 3,195 3,485 1,983 8,664
Waseca Utility 0 2,735 1,055 1,491 5,280
Wells Public Utilities 0 946 897 0 1,843
Total: SMMPA 387 84,745 108,827 62,809 256,768
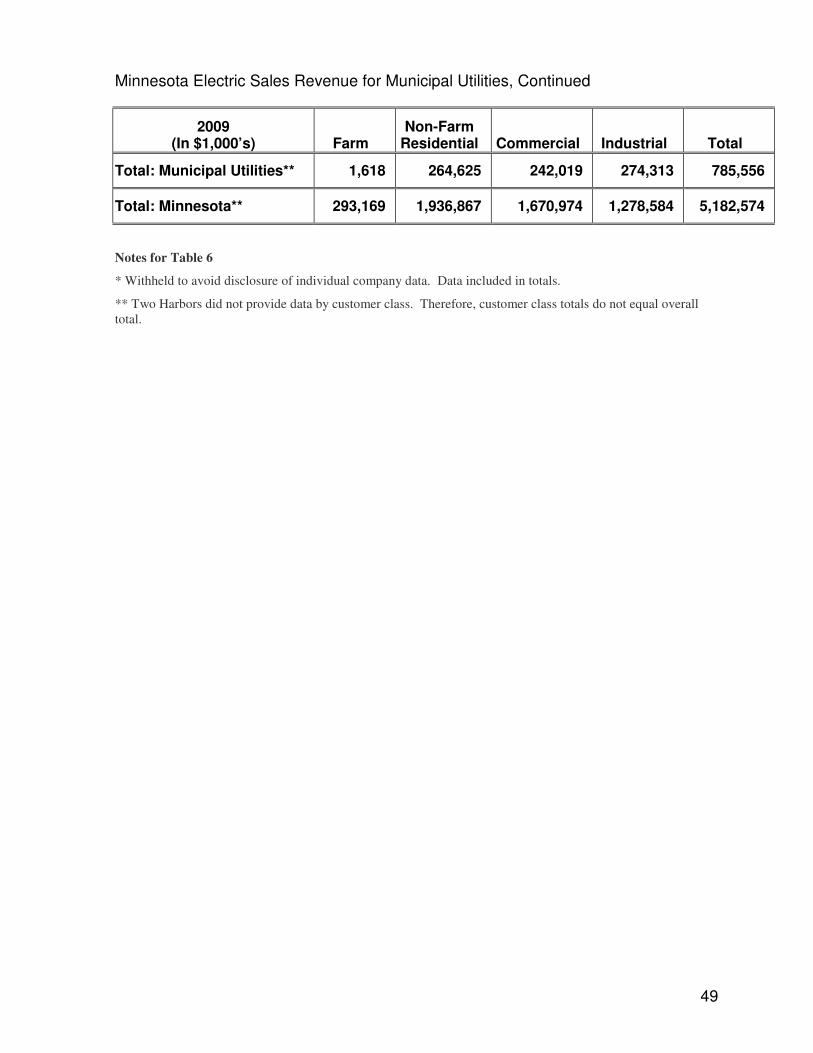
49
Minnesota Electric Sales Revenue for Municipal Utilities, Continued
2009 (In $1,000’s) Farm
Non-Farm Residential Commercial Industrial Total
Total: Municipal Utilities** 1,618 264,625 242,019 274,313 785,556
Total: Minnesota** 293,169 1,936,867 1,670,974 1,278,584 5,182,574
Notes for Table 6
* Withheld to avoid disclosure of individual company data. Data included in totals.
** Two Harbors did not provide data by customer class. Therefore, customer class totals do not equal overall total.
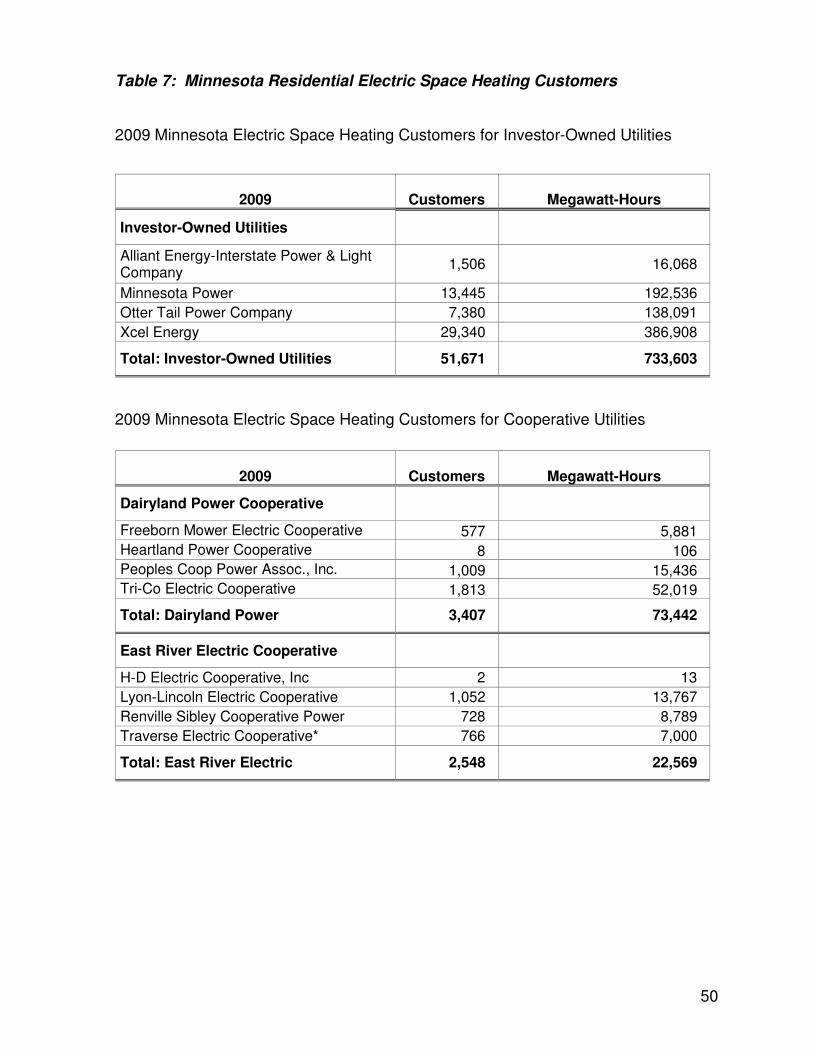
50
Table 7: Minnesota Residential Electric Space Heating Customers
2009 Minnesota Electric Space Heating Customers for Investor-Owned Utilities
2009 Customers Megawatt-Hours
Investor-Owned Utilities
Alliant Energy-Interstate Power & Light Company
1,506 16,068
Minnesota Power 13,445 192,536
Otter Tail Power Company 7,380 138,091
Xcel Energy 29,340 386,908
Total: Investor-Owned Utilities 51,671 733,603
2009 Minnesota Electric Space Heating Customers for Cooperative Utilities
2009 Customers Megawatt-Hours
Dairyland Power Cooperative
Freeborn Mower Electric Cooperative 577 5,881
Heartland Power Cooperative 8 106
Peoples Coop Power Assoc., Inc. 1,009 15,436
Tri-Co Electric Cooperative 1,813 52,019
Total: Dairyland Power 3,407 73,442
East River Electric Cooperative
H-D Electric Cooperative, Inc 2 13
Lyon-Lincoln Electric Cooperative 1,052 13,767
Renville Sibley Cooperative Power 728 8,789
Traverse Electric Cooperative* 766 7,000
Total: East River Electric 2,548 22,569
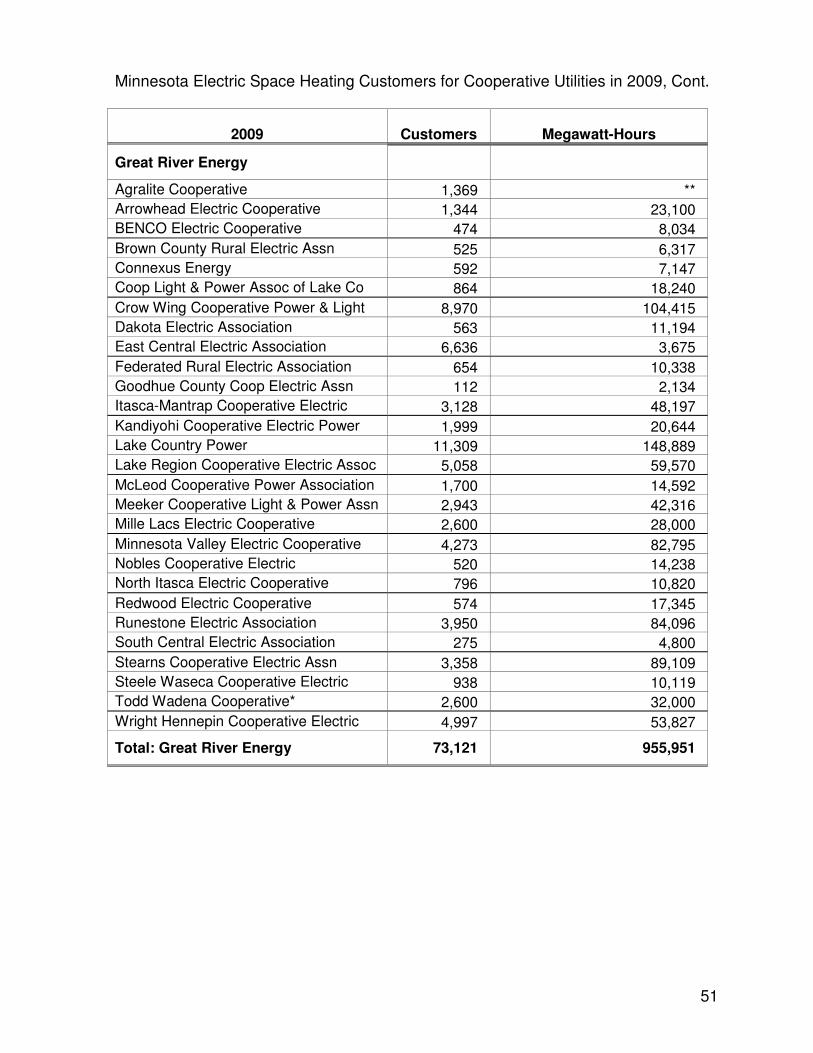
51
Minnesota Electric Space Heating Customers for Cooperative Utilities in 2009, Cont.
2009 Customers Megawatt-Hours
Great River Energy
Agralite Cooperative 1,369 **
Arrowhead Electric Cooperative 1,344 23,100
BENCO Electric Cooperative 474 8,034
Brown County Rural Electric Assn 525 6,317
Connexus Energy 592 7,147
Coop Light & Power Assoc of Lake Co 864 18,240
Crow Wing Cooperative Power & Light 8,970 104,415
Dakota Electric Association 563 11,194
East Central Electric Association 6,636 3,675
Federated Rural Electric Association 654 10,338
Goodhue County Coop Electric Assn 112 2,134
Itasca-Mantrap Cooperative Electric 3,128 48,197
Kandiyohi Cooperative Electric Power 1,999 20,644
Lake Country Power 11,309 148,889
Lake Region Cooperative Electric Assoc 5,058 59,570
McLeod Cooperative Power Association 1,700 14,592
Meeker Cooperative Light & Power Assn 2,943 42,316
Mille Lacs Electric Cooperative 2,600 28,000
Minnesota Valley Electric Cooperative 4,273 82,795
Nobles Cooperative Electric 520 14,238
North Itasca Electric Cooperative 796 10,820
Redwood Electric Cooperative 574 17,345
Runestone Electric Association 3,950 84,096
South Central Electric Association 275 4,800
Stearns Cooperative Electric Assn 3,358 89,109
Steele Waseca Cooperative Electric 938 10,119
Todd Wadena Cooperative* 2,600 32,000
Wright Hennepin Cooperative Electric 4,997 53,827
Total: Great River Energy 73,121 955,951
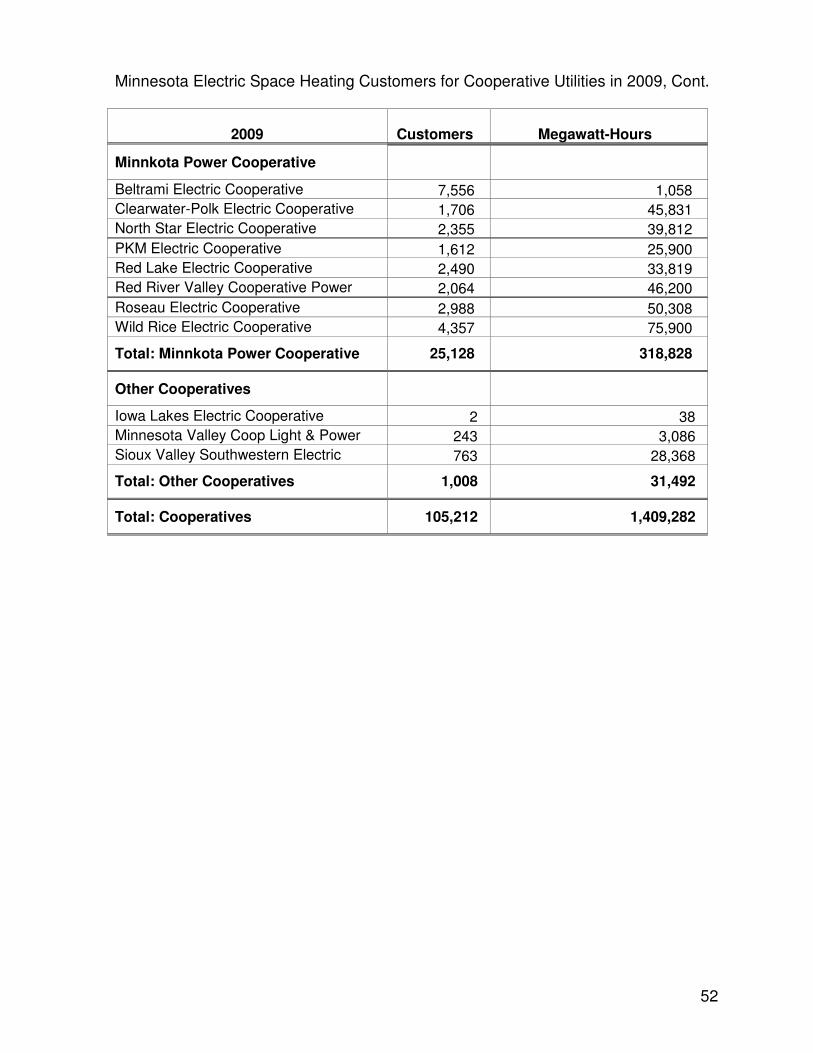
52
Minnesota Electric Space Heating Customers for Cooperative Utilities in 2009, Cont.
2009 Customers Megawatt-Hours
Minnkota Power Cooperative
Beltrami Electric Cooperative 7,556 1,058
Clearwater-Polk Electric Cooperative 1,706 45,831
North Star Electric Cooperative 2,355 39,812
PKM Electric Cooperative 1,612 25,900
Red Lake Electric Cooperative 2,490 33,819
Red River Valley Cooperative Power 2,064 46,200
Roseau Electric Cooperative 2,988 50,308
Wild Rice Electric Cooperative 4,357 75,900
Total: Minnkota Power Cooperative 25,128 318,828
Other Cooperatives
Iowa Lakes Electric Cooperative 2 38
Minnesota Valley Coop Light & Power 243 3,086
Sioux Valley Southwestern Electric 763 28,368
Total: Other Cooperatives 1,008 31,492
Total: Cooperatives 105,212 1,409,282
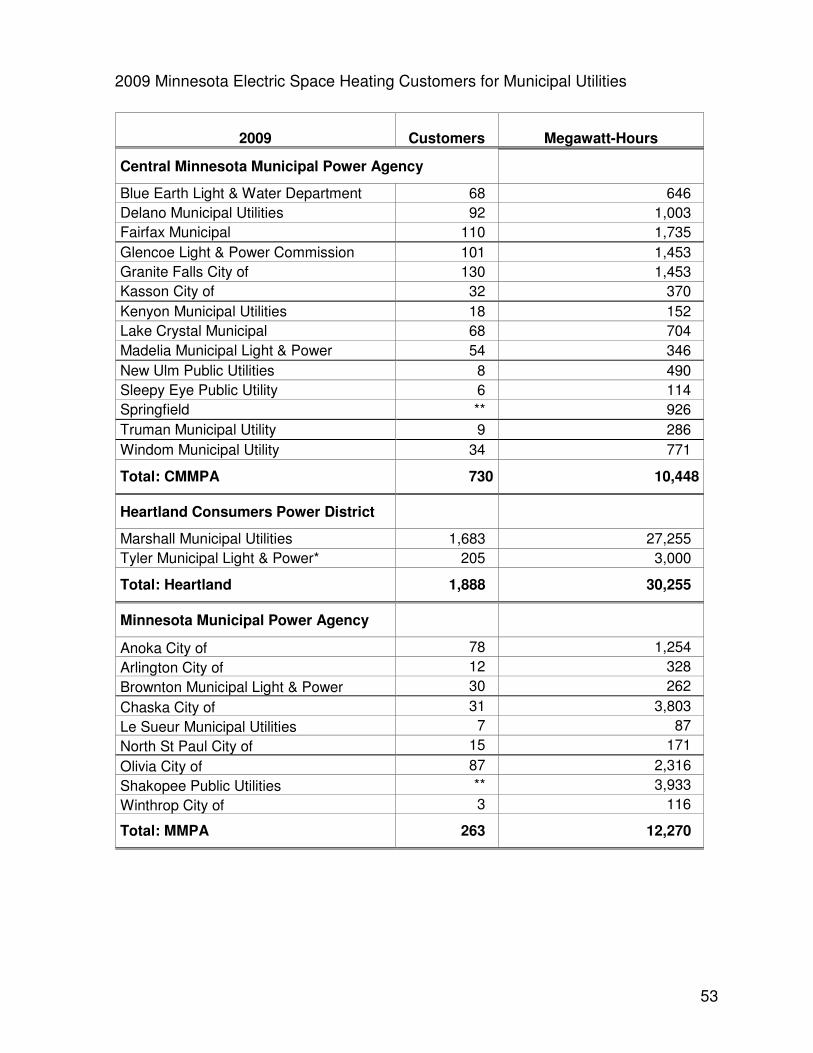
53
2009 Minnesota Electric Space Heating Customers for Municipal Utilities
2009 Customers Megawatt-Hours
Central Minnesota Municipal Power Agency
Blue Earth Light & Water Department 68 646
Delano Municipal Utilities 92 1,003
Fairfax Municipal 110 1,735
Glencoe Light & Power Commission 101 1,453
Granite Falls City of 130 1,453
Kasson City of 32 370
Kenyon Municipal Utilities 18 152
Lake Crystal Municipal 68 704
Madelia Municipal Light & Power 54 346
New Ulm Public Utilities 8 490
Sleepy Eye Public Utility 6 114
Springfield ** 926
Truman Municipal Utility 9 286
Windom Municipal Utility 34 771
Total: CMMPA 730 10,448
Heartland Consumers Power District
Marshall Municipal Utilities 1,683 27,255
Tyler Municipal Light & Power* 205 3,000
Total: Heartland 1,888 30,255
Minnesota Municipal Power Agency
Anoka City of 78 1,254
Arlington City of 12 328
Brownton Municipal Light & Power 30 262
Chaska City of 31 3,803
Le Sueur Municipal Utilities 7 87
North St Paul City of 15 171
Olivia City of 87 2,316
Shakopee Public Utilities ** 3,933
Winthrop City of 3 116
Total: MMPA 263 12,270
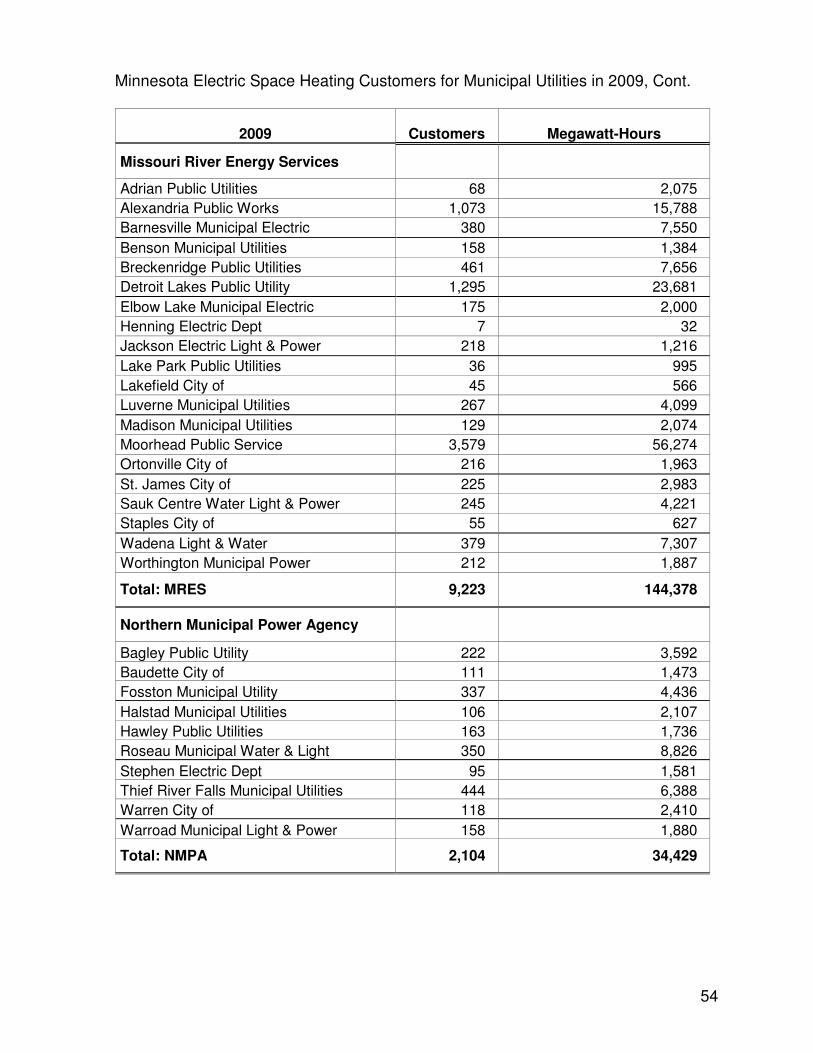
54
Minnesota Electric Space Heating Customers for Municipal Utilities in 2009, Cont.
2009 Customers Megawatt-Hours
Missouri River Energy Services
Adrian Public Utilities 68 2,075
Alexandria Public Works 1,073 15,788
Barnesville Municipal Electric 380 7,550
Benson Municipal Utilities 158 1,384
Breckenridge Public Utilities 461 7,656
Detroit Lakes Public Utility 1,295 23,681
Elbow Lake Municipal Electric 175 2,000
Henning Electric Dept 7 32
Jackson Electric Light & Power 218 1,216
Lake Park Public Utilities 36 995
Lakefield City of 45 566
Luverne Municipal Utilities 267 4,099
Madison Municipal Utilities 129 2,074
Moorhead Public Service 3,579 56,274
Ortonville City of 216 1,963
St. James City of 225 2,983
Sauk Centre Water Light & Power 245 4,221
Staples City of 55 627
Wadena Light & Water 379 7,307
Worthington Municipal Power 212 1,887
Total: MRES 9,223 144,378
Northern Municipal Power Agency
Bagley Public Utility 222 3,592
Baudette City of 111 1,473
Fosston Municipal Utility 337 4,436
Halstad Municipal Utilities 106 2,107
Hawley Public Utilities 163 1,736
Roseau Municipal Water & Light 350 8,826
Stephen Electric Dept 95 1,581
Thief River Falls Municipal Utilities 444 6,388
Warren City of 118 2,410
Warroad Municipal Light & Power 158 1,880
Total: NMPA 2,104 34,429
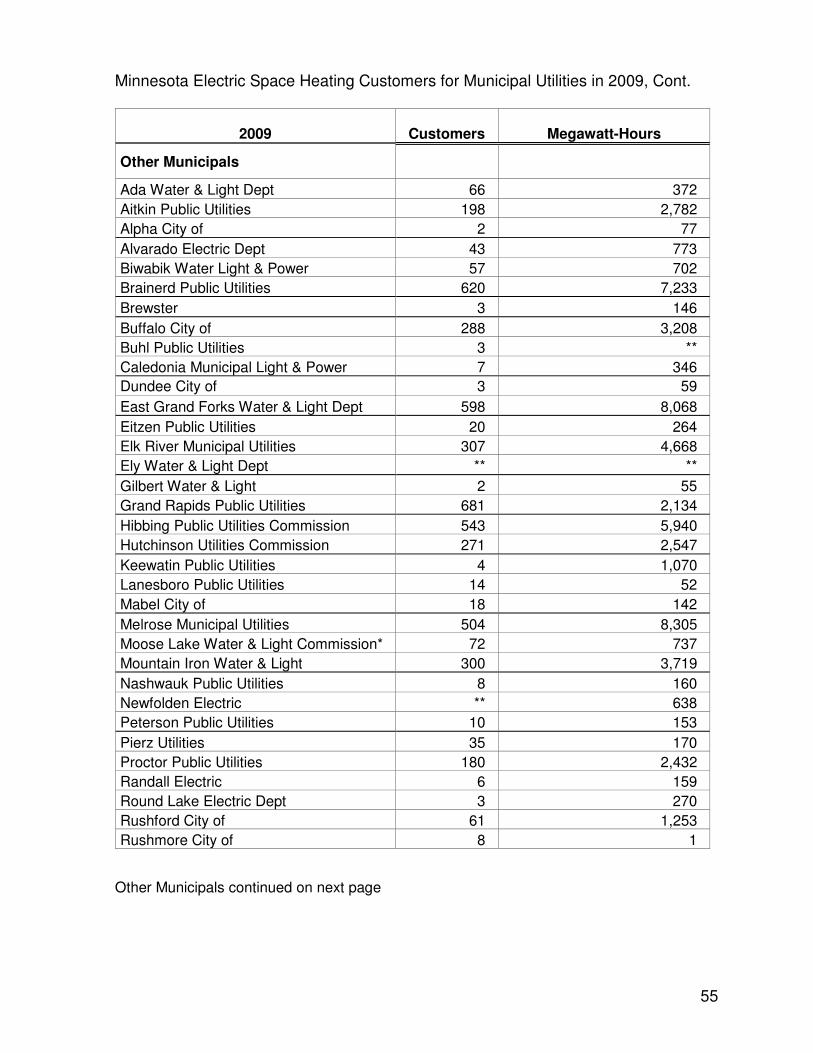
55
Minnesota Electric Space Heating Customers for Municipal Utilities in 2009, Cont.
2009 Customers Megawatt-Hours
Other Municipals
Ada Water & Light Dept 66 372
Aitkin Public Utilities 198 2,782
Alpha City of 2 77
Alvarado Electric Dept 43 773
Biwabik Water Light & Power 57 702
Brainerd Public Utilities 620 7,233
Brewster 3 146
Buffalo City of 288 3,208
Buhl Public Utilities 3 **
Caledonia Municipal Light & Power 7 346
Dundee City of 3 59
East Grand Forks Water & Light Dept 598 8,068
Eitzen Public Utilities 20 264
Elk River Municipal Utilities 307 4,668
Ely Water & Light Dept ** **
Gilbert Water & Light 2 55
Grand Rapids Public Utilities 681 2,134
Hibbing Public Utilities Commission 543 5,940
Hutchinson Utilities Commission 271 2,547
Keewatin Public Utilities 4 1,070
Lanesboro Public Utilities 14 52
Mabel City of 18 142
Melrose Municipal Utilities 504 8,305
Moose Lake Water & Light Commission* 72 737
Mountain Iron Water & Light 300 3,719
Nashwauk Public Utilities 8 160
Newfolden Electric ** 638
Peterson Public Utilities 10 153
Pierz Utilities 35 170
Proctor Public Utilities 180 2,432
Randall Electric 6 159
Round Lake Electric Dept 3 270
Rushford City of 61 1,253
Rushmore City of 8 1
Other Municipals continued on next page
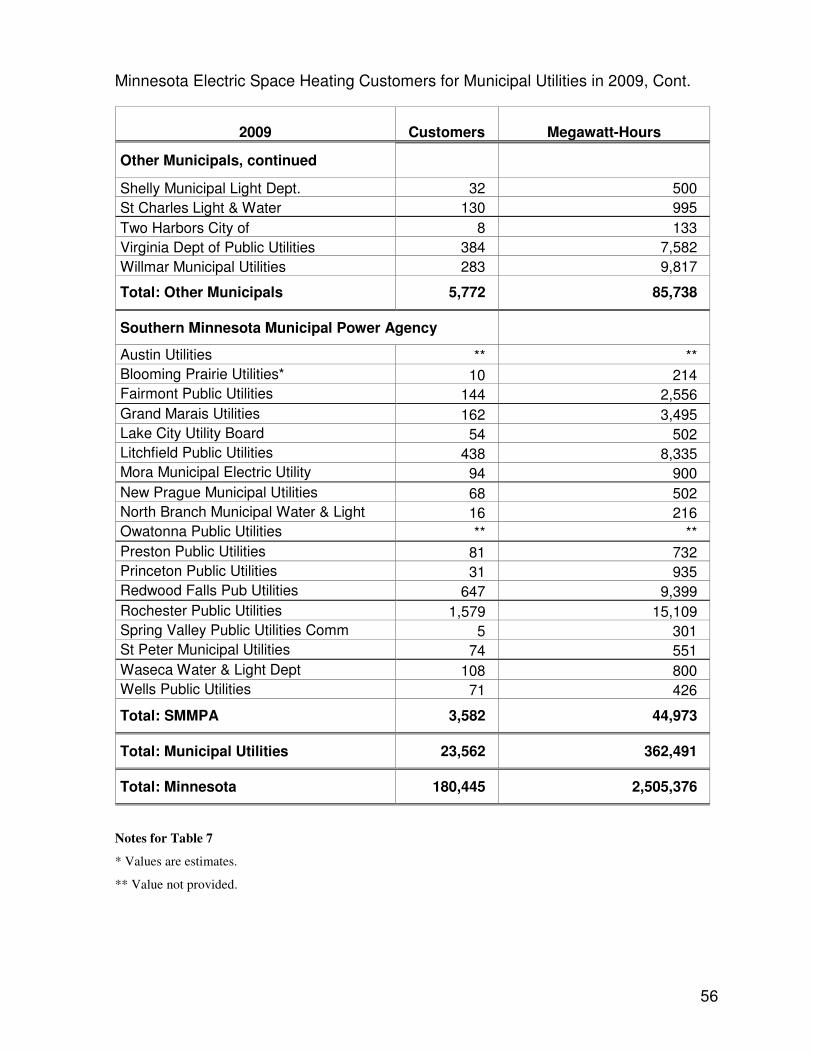
56
Minnesota Electric Space Heating Customers for Municipal Utilities in 2009, Cont.
2009 Customers Megawatt-Hours
Other Municipals, continued
Shelly Municipal Light Dept. 32 500
St Charles Light & Water 130 995
Two Harbors City of 8 133
Virginia Dept of Public Utilities 384 7,582
Willmar Municipal Utilities 283 9,817
Total: Other Municipals 5,772 85,738
Southern Minnesota Municipal Power Agency
Austin Utilities ** **
Blooming Prairie Utilities* 10 214
Fairmont Public Utilities 144 2,556
Grand Marais Utilities 162 3,495
Lake City Utility Board 54 502
Litchfield Public Utilities 438 8,335
Mora Municipal Electric Utility 94 900
New Prague Municipal Utilities 68 502
North Branch Municipal Water & Light 16 216
Owatonna Public Utilities ** **
Preston Public Utilities 81 732
Princeton Public Utilities 31 935
Redwood Falls Pub Utilities 647 9,399
Rochester Public Utilities 1,579 15,109
Spring Valley Public Utilities Comm 5 301
St Peter Municipal Utilities 74 551
Waseca Water & Light Dept 108 800
Wells Public Utilities 71 426
Total: SMMPA 3,582 44,973
Total: Municipal Utilities 23,562 362,491
Total: Minnesota 180,445 2,505,376
Notes for Table 7
* Values are estimates.
** Value not provided.
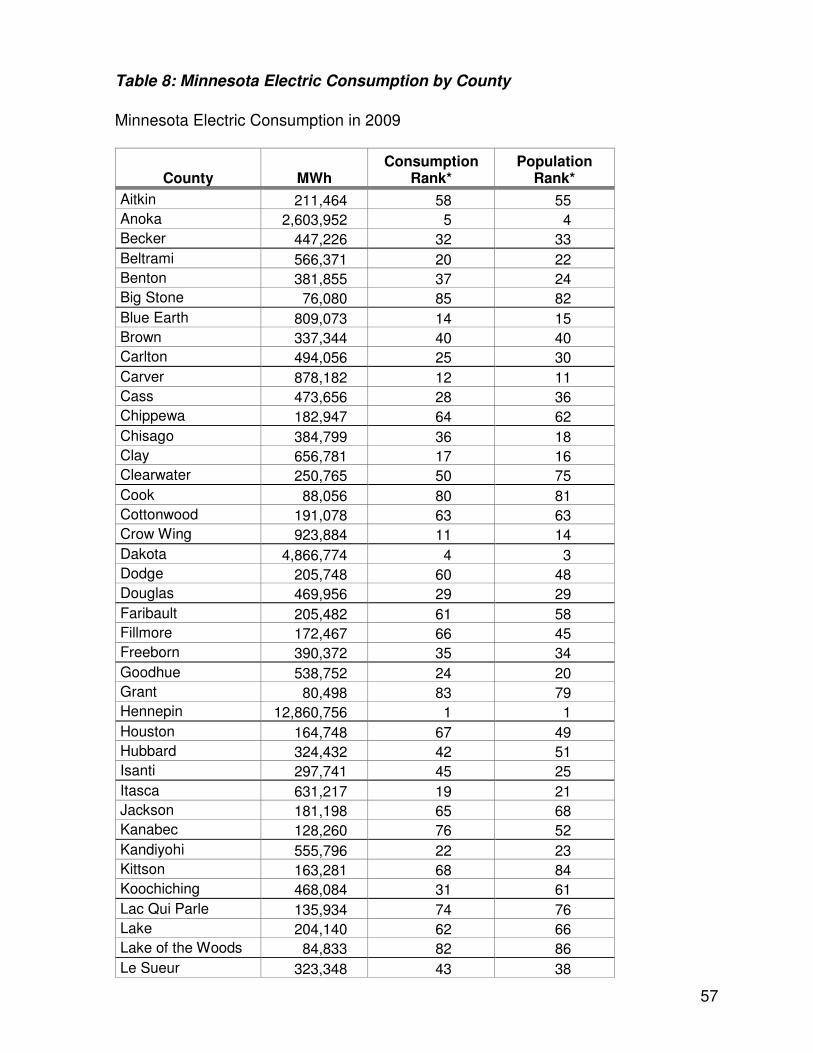
57
Table 8: Minnesota Electric Consumption by County
Minnesota Electric Consumption in 2009
County MWh Consumption
Rank* Population
Rank*
Aitkin 211,464 58 55
Anoka 2,603,952 5 4
Becker 447,226 32 33
Beltrami 566,371 20 22
Benton 381,855 37 24
Big Stone 76,080 85 82
Blue Earth 809,073 14 15
Brown 337,344 40 40
Carlton 494,056 25 30
Carver 878,182 12 11
Cass 473,656 28 36
Chippewa 182,947 64 62
Chisago 384,799 36 18
Clay 656,781 17 16
Clearwater 250,765 50 75
Cook 88,056 80 81
Cottonwood 191,078 63 63
Crow Wing 923,884 11 14
Dakota 4,866,774 4 3
Dodge 205,748 60 48
Douglas 469,956 29 29
Faribault 205,482 61 58
Fillmore 172,467 66 45
Freeborn 390,372 35 34
Goodhue 538,752 24 20
Grant 80,498 83 79
Hennepin 12,860,756 1 1
Houston 164,748 67 49
Hubbard 324,432 42 51
Isanti 297,741 45 25
Itasca 631,217 19 21
Jackson 181,198 65 68
Kanabec 128,260 76 52
Kandiyohi 555,796 22 23
Kittson 163,281 68 84
Koochiching 468,084 31 61
Lac Qui Parle 135,934 74 76
Lake 204,140 62 66
Lake of the Woods 84,833 82 86
Le Sueur 323,348 43 38

58
Minnesota Electric Consumption in 2009, Continued
County MWh Consumption
Rank* Population
Rank*
Lincoln 75,329 86 80
Lyon 717,707 16 41
McLeod 493,957 26 27
Mahnomen 85,289 81 83
Marshall 250,668 51 72
Martin 469,267 30 46
Meeker 280,398 46 43
Mille Lacs 229,496 55 39
Morrison 445,745 33 31
Mower 441,918 34 26
Murray 105,546 78 74
Nicollet 324,748 41 32
Nobles 344,089 39 47
Norman 80,307 84 77
Olmstead 1,493,036 8 8
Otter Tail 831,018 13 17
Pennington 212,706 57 59
Pine 252,653 49 37
Pipestone 123,774 77 73
Polk 541,315 23 35
Pope 141,387 72 65
Ramsey 5,231,612 3 2
Red Lake 138,509 73 85
Redwood 240,785 53 56
Renville 300,038 44 53
Rice 641,070 18 13
Rock 147,482 69 71
Roseau 261,229 47 54
St. Louis 5,480,809 2 6
Scott 1,290,153 9 9
Sherburne 737,216 15 12
Sibley 240,882 52 57
Stearns 2,144,840 7 7
Steele 487,560 27 28
Stevens 141,636 71 70
Swift 210,430 59 67
Todd 349,572 38 42
Traverse 55,843 87 87
Wabasha 255,669 48 44
Wadena 220,633 56 60
Waseca 240,406 54 50
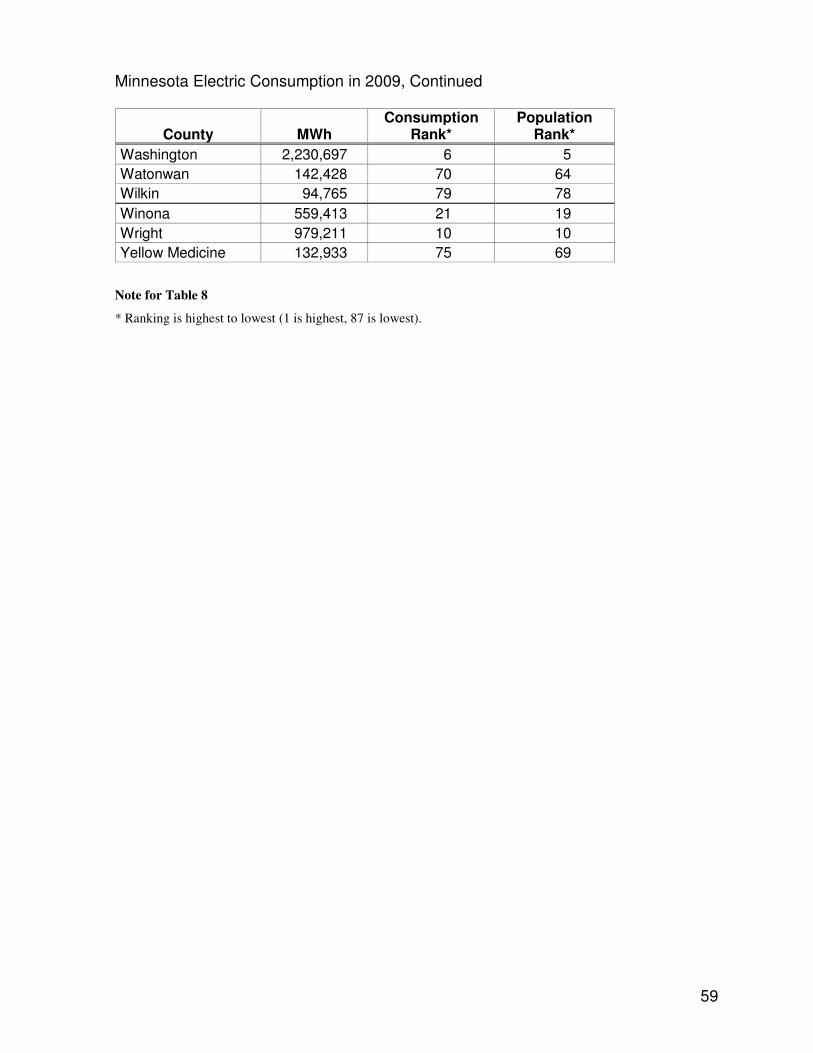
59
Minnesota Electric Consumption in 2009, Continued
County MWh Consumption
Rank* Population
Rank*
Washington 2,230,697 6 5
Watonwan 142,428 70 64
Wilkin 94,765 79 78
Winona 559,413 21 19
Wright 979,211 10 10
Yellow Medicine 132,933 75 69
Note for Table 8
* Ranking is highest to lowest (1 is highest, 87 is lowest).
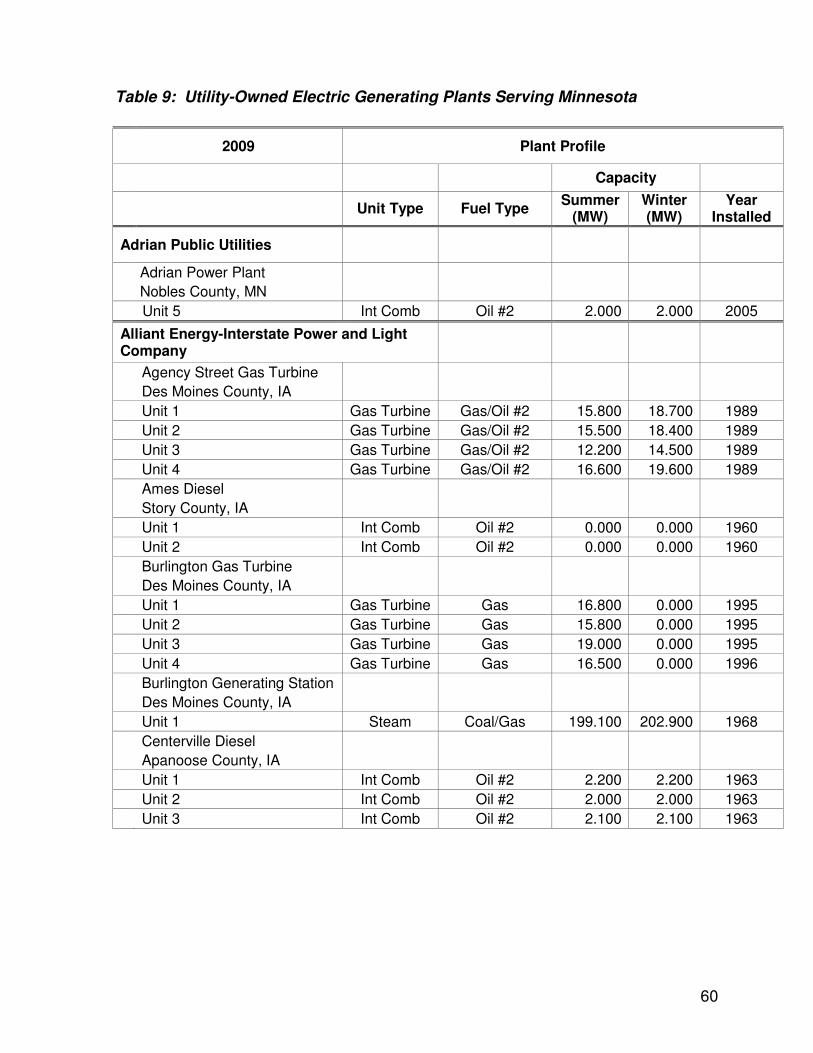
60
Table 9: Utility-Owned Electric Generating Plants Serving Minnesota
2009 Plant Profile
Capacity
Unit Type Fuel Type Summer
(MW) Winter (MW)
Year Installed
Adrian Public Utilities
Adrian Power Plant
Nobles County, MN
Unit 5 Int Comb Oil #2 2.000 2.000 2005
Alliant Energy-Interstate Power and Light Company
Agency Street Gas Turbine
Des Moines County, IA
Unit 1 Gas Turbine Gas/Oil #2 15.800 18.700 1989
Unit 2 Gas Turbine Gas/Oil #2 15.500 18.400 1989
Unit 3 Gas Turbine Gas/Oil #2 12.200 14.500 1989
Unit 4 Gas Turbine Gas/Oil #2 16.600 19.600 1989
Ames Diesel
Story County, IA
Unit 1 Int Comb Oil #2 0.000 0.000 1960
Unit 2 Int Comb Oil #2 0.000 0.000 1960
Burlington Gas Turbine
Des Moines County, IA
Unit 1 Gas Turbine Gas 16.800 0.000 1995
Unit 2 Gas Turbine Gas 15.800 0.000 1995
Unit 3 Gas Turbine Gas 19.000 0.000 1995
Unit 4 Gas Turbine Gas 16.500 0.000 1996
Burlington Generating Station
Des Moines County, IA
Unit 1 Steam Coal/Gas 199.100 202.900 1968
Centerville Diesel
Apanoose County, IA
Unit 1 Int Comb Oil #2 2.200 2.200 1963
Unit 2 Int Comb Oil #2 2.000 2.000 1963
Unit 3 Int Comb Oil #2 2.100 2.100 1963
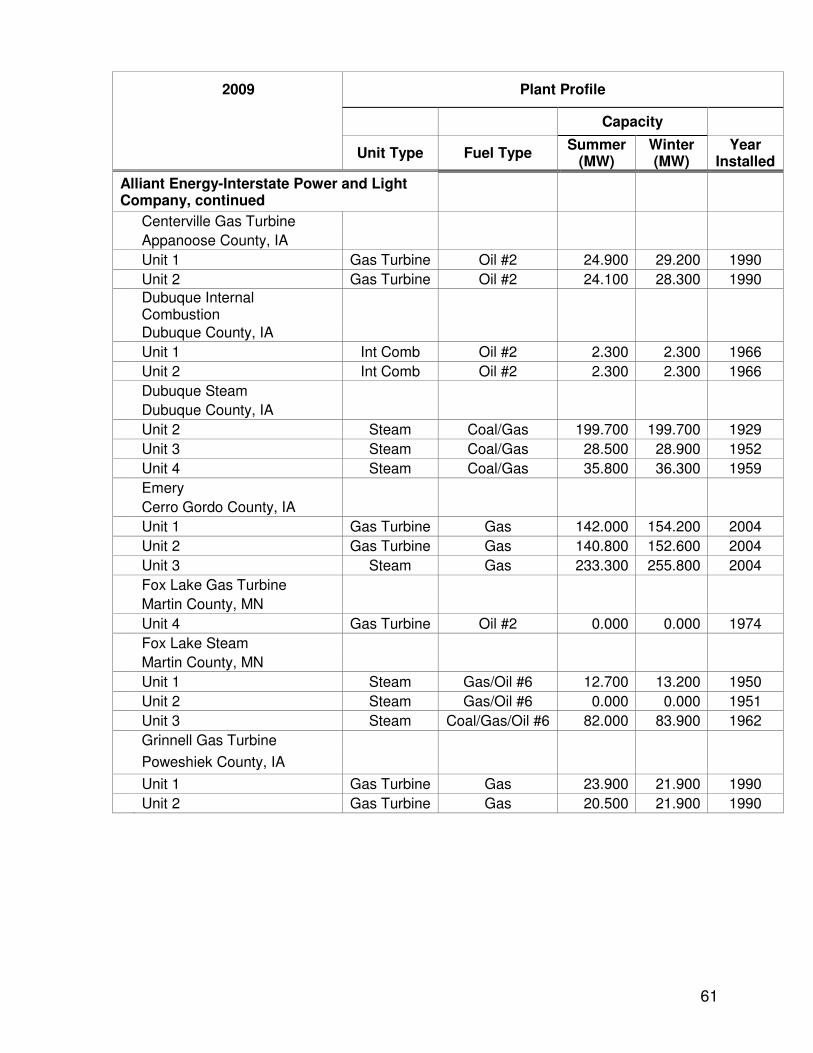
61
2009 Plant Profile
Capacity
Unit Type Fuel Type Summer
(MW) Winter (MW)
Year Installed
Alliant Energy-Interstate Power and Light Company, continued
Centerville Gas Turbine
Appanoose County, IA
Unit 1 Gas Turbine Oil #2 24.900 29.200 1990
Unit 2 Gas Turbine Oil #2 24.100 28.300 1990
Dubuque Internal Combustion
Dubuque County, IA
Unit 1 Int Comb Oil #2 2.300 2.300 1966
Unit 2 Int Comb Oil #2 2.300 2.300 1966
Dubuque Steam
Dubuque County, IA
Unit 2 Steam Coal/Gas 199.700 199.700 1929
Unit 3 Steam Coal/Gas 28.500 28.900 1952
Unit 4 Steam Coal/Gas 35.800 36.300 1959
Emery
Cerro Gordo County, IA
Unit 1 Gas Turbine Gas 142.000 154.200 2004
Unit 2 Gas Turbine Gas 140.800 152.600 2004
Unit 3 Steam Gas 233.300 255.800 2004
Fox Lake Gas Turbine
Martin County, MN
Unit 4 Gas Turbine Oil #2 0.000 0.000 1974
Fox Lake Steam
Martin County, MN
Unit 1 Steam Gas/Oil #6 12.700 13.200 1950
Unit 2 Steam Gas/Oil #6 0.000 0.000 1951
Unit 3 Steam Coal/Gas/Oil #6 82.000 83.900 1962
Grinnell Gas Turbine
Poweshiek County, IA
Unit 1 Gas Turbine Gas 23.900 21.900 1990
Unit 2 Gas Turbine Gas 20.500 21.900 1990
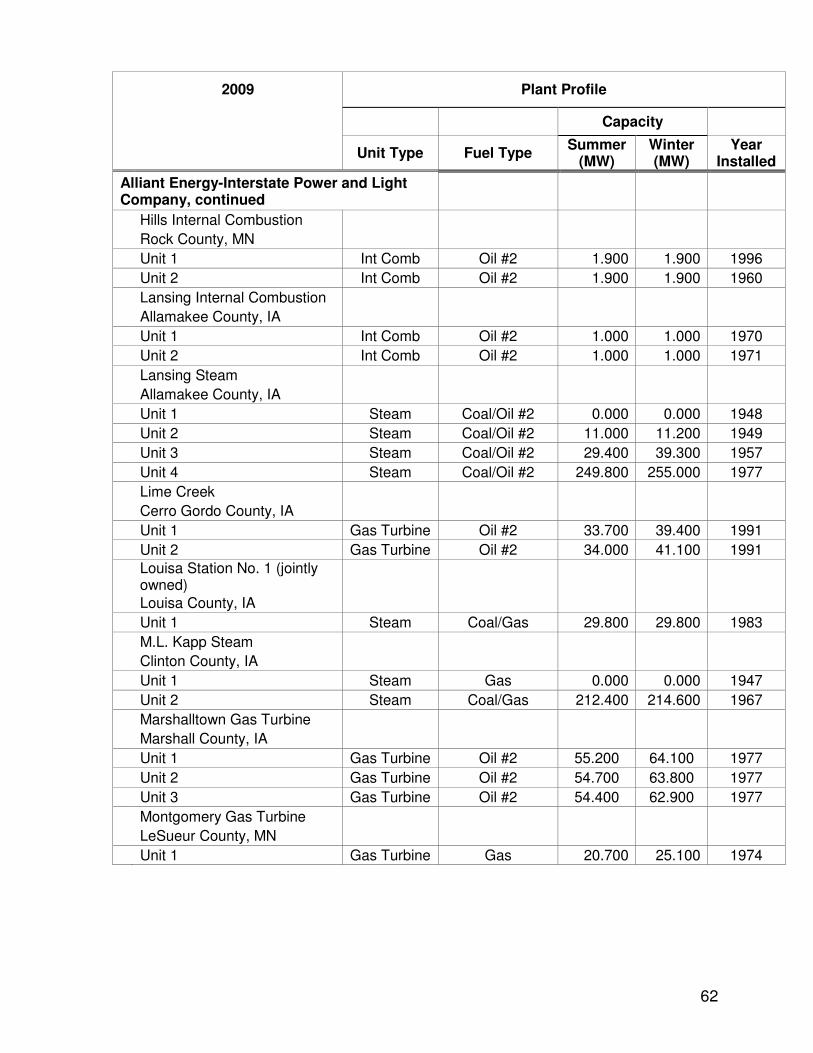
62
2009 Plant Profile
Capacity
Unit Type Fuel Type Summer
(MW) Winter (MW)
Year Installed
Alliant Energy-Interstate Power and Light Company, continued
Hills Internal Combustion
Rock County, MN
Unit 1 Int Comb Oil #2 1.900 1.900 1996
Unit 2 Int Comb Oil #2 1.900 1.900 1960
Lansing Internal Combustion
Allamakee County, IA
Unit 1 Int Comb Oil #2 1.000 1.000 1970
Unit 2 Int Comb Oil #2 1.000 1.000 1971
Lansing Steam
Allamakee County, IA
Unit 1 Steam Coal/Oil #2 0.000 0.000 1948
Unit 2 Steam Coal/Oil #2 11.000 11.200 1949
Unit 3 Steam Coal/Oil #2 29.400 39.300 1957
Unit 4 Steam Coal/Oil #2 249.800 255.000 1977
Lime Creek
Cerro Gordo County, IA
Unit 1 Gas Turbine Oil #2 33.700 39.400 1991
Unit 2 Gas Turbine Oil #2 34.000 41.100 1991
Louisa Station No. 1 (jointly owned)
Louisa County, IA
Unit 1 Steam Coal/Gas 29.800 29.800 1983
M.L. Kapp Steam
Clinton County, IA
Unit 1 Steam Gas 0.000 0.000 1947
Unit 2 Steam Coal/Gas 212.400 214.600 1967
Marshalltown Gas Turbine
Marshall County, IA
Unit 1 Gas Turbine Oil #2 55.200 64.100 1977
Unit 2 Gas Turbine Oil #2 54.700 63.800 1977
Unit 3 Gas Turbine Oil #2 54.400 62.900 1977
Montgomery Gas Turbine
LeSueur County, MN
Unit 1 Gas Turbine Gas 20.700 25.100 1974
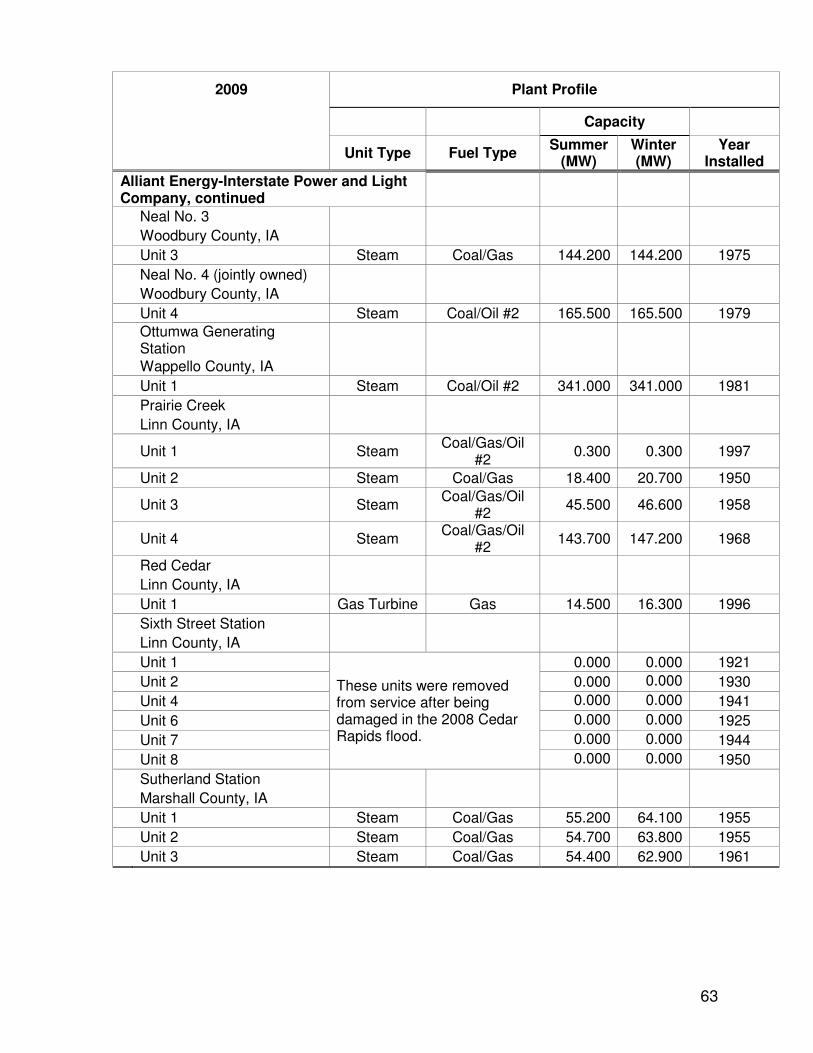
63
2009 Plant Profile
Capacity
Unit Type Fuel Type Summer
(MW) Winter (MW)
Year Installed
Alliant Energy-Interstate Power and Light Company, continued
Neal No. 3
Woodbury County, IA
Unit 3 Steam Coal/Gas 144.200 144.200 1975
Neal No. 4 (jointly owned)
Woodbury County, IA
Unit 4 Steam Coal/Oil #2 165.500 165.500 1979
Ottumwa Generating Station
Wappello County, IA
Unit 1 Steam Coal/Oil #2 341.000 341.000 1981
Prairie Creek
Linn County, IA
Unit 1 Steam Coal/Gas/Oil
#2 0.300 0.300 1997
Unit 2 Steam Coal/Gas 18.400 20.700 1950
Unit 3 Steam Coal/Gas/Oil
#2 45.500 46.600 1958
Unit 4 Steam Coal/Gas/Oil
#2 143.700 147.200 1968
Red Cedar
Linn County, IA
Unit 1 Gas Turbine Gas 14.500 16.300 1996
Sixth Street Station
Linn County, IA
Unit 1
These units were removed from service after being damaged in the 2008 Cedar Rapids flood.
0.000 0.000 1921
Unit 2 0.000 0.000 1930
Unit 4 0.000 0.000 1941
Unit 6 0.000 0.000 1925
Unit 7 0.000 0.000 1944
Unit 8 0.000 0.000 1950
Sutherland Station
Marshall County, IA
Unit 1 Steam Coal/Gas 55.200 64.100 1955
Unit 2 Steam Coal/Gas 54.700 63.800 1955
Unit 3 Steam Coal/Gas 54.400 62.900 1961
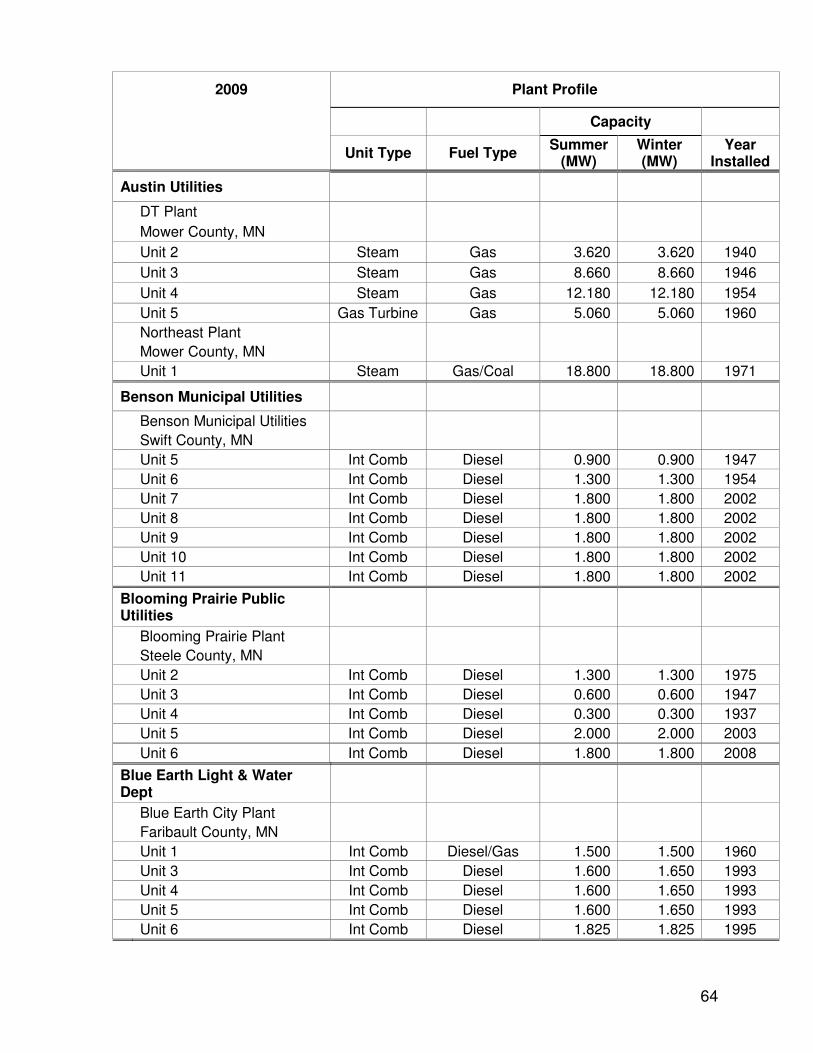
64
2009 Plant Profile
Capacity
Unit Type Fuel Type Summer
(MW) Winter (MW)
Year Installed
Austin Utilities
DT Plant
Mower County, MN
Unit 2 Steam Gas 3.620 3.620 1940
Unit 3 Steam Gas 8.660 8.660 1946
Unit 4 Steam Gas 12.180 12.180 1954
Unit 5 Gas Turbine Gas 5.060 5.060 1960
Northeast Plant
Mower County, MN
Unit 1 Steam Gas/Coal 18.800 18.800 1971
Benson Municipal Utilities
Benson Municipal Utilities
Swift County, MN
Unit 5 Int Comb Diesel 0.900 0.900 1947
Unit 6 Int Comb Diesel 1.300 1.300 1954
Unit 7 Int Comb Diesel 1.800 1.800 2002
Unit 8 Int Comb Diesel 1.800 1.800 2002
Unit 9 Int Comb Diesel 1.800 1.800 2002
Unit 10 Int Comb Diesel 1.800 1.800 2002
Unit 11 Int Comb Diesel 1.800 1.800 2002
Blooming Prairie Public Utilities
Blooming Prairie Plant
Steele County, MN
Unit 2 Int Comb Diesel 1.300 1.300 1975
Unit 3 Int Comb Diesel 0.600 0.600 1947
Unit 4 Int Comb Diesel 0.300 0.300 1937
Unit 5 Int Comb Diesel 2.000 2.000 2003
Unit 6 Int Comb Diesel 1.800 1.800 2008
Blue Earth Light & Water Dept
Blue Earth City Plant
Faribault County, MN
Unit 1 Int Comb Diesel/Gas 1.500 1.500 1960
Unit 3 Int Comb Diesel 1.600 1.650 1993
Unit 4 Int Comb Diesel 1.600 1.650 1993
Unit 5 Int Comb Diesel 1.600 1.650 1993
Unit 6 Int Comb Diesel 1.825 1.825 1995
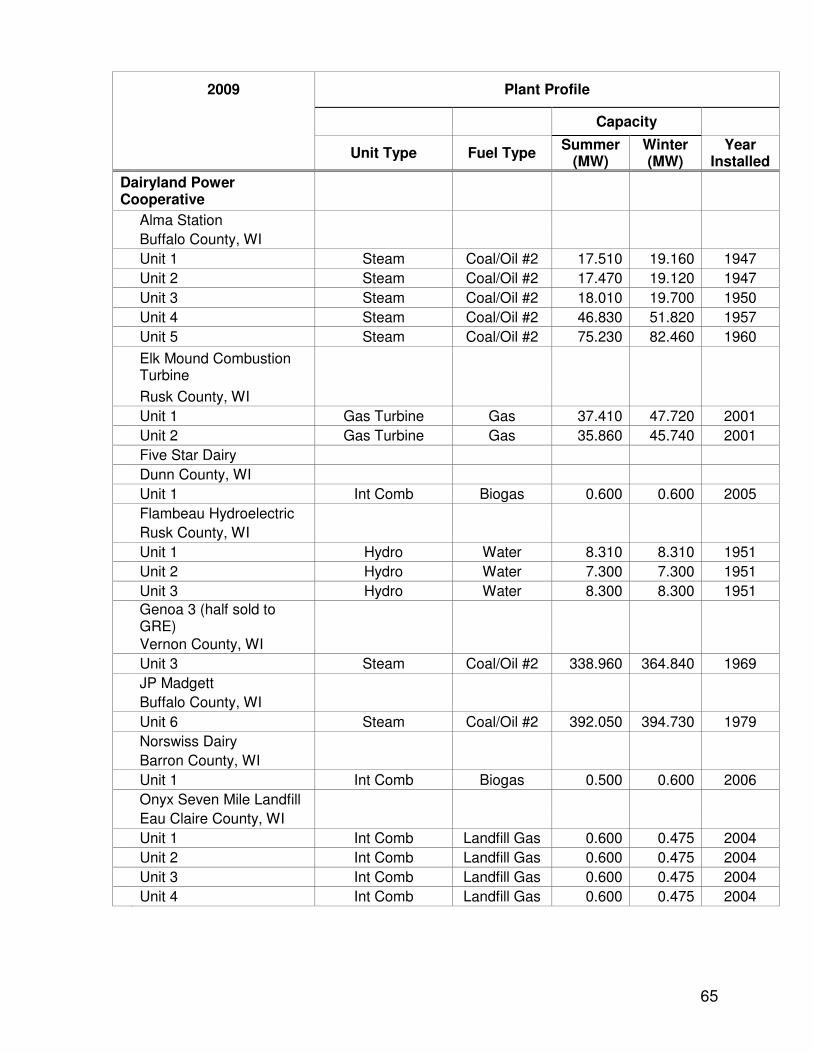
65
2009 Plant Profile
Capacity
Unit Type Fuel Type Summer
(MW) Winter (MW)
Year Installed
Dairyland Power Cooperative
Alma Station
Buffalo County, WI
Unit 1 Steam Coal/Oil #2 17.510 19.160 1947
Unit 2 Steam Coal/Oil #2 17.470 19.120 1947
Unit 3 Steam Coal/Oil #2 18.010 19.700 1950
Unit 4 Steam Coal/Oil #2 46.830 51.820 1957
Unit 5 Steam Coal/Oil #2 75.230 82.460 1960
Elk Mound Combustion Turbine
Rusk County, WI
Unit 1 Gas Turbine Gas 37.410 47.720 2001
Unit 2 Gas Turbine Gas 35.860 45.740 2001
Five Star Dairy
Dunn County, WI
Unit 1 Int Comb Biogas 0.600 0.600 2005
Flambeau Hydroelectric
Rusk County, WI
Unit 1 Hydro Water 8.310 8.310 1951
Unit 2 Hydro Water 7.300 7.300 1951
Unit 3 Hydro Water 8.300 8.300 1951
Genoa 3 (half sold to GRE)
Vernon County, WI
Unit 3 Steam Coal/Oil #2 338.960 364.840 1969
JP Madgett
Buffalo County, WI
Unit 6 Steam Coal/Oil #2 392.050 394.730 1979
Norswiss Dairy
Barron County, WI
Unit 1 Int Comb Biogas 0.500 0.600 2006
Onyx Seven Mile Landfill
Eau Claire County, WI
Unit 1 Int Comb Landfill Gas 0.600 0.475 2004
Unit 2 Int Comb Landfill Gas 0.600 0.475 2004
Unit 3 Int Comb Landfill Gas 0.600 0.475 2004
Unit 4 Int Comb Landfill Gas 0.600 0.475 2004
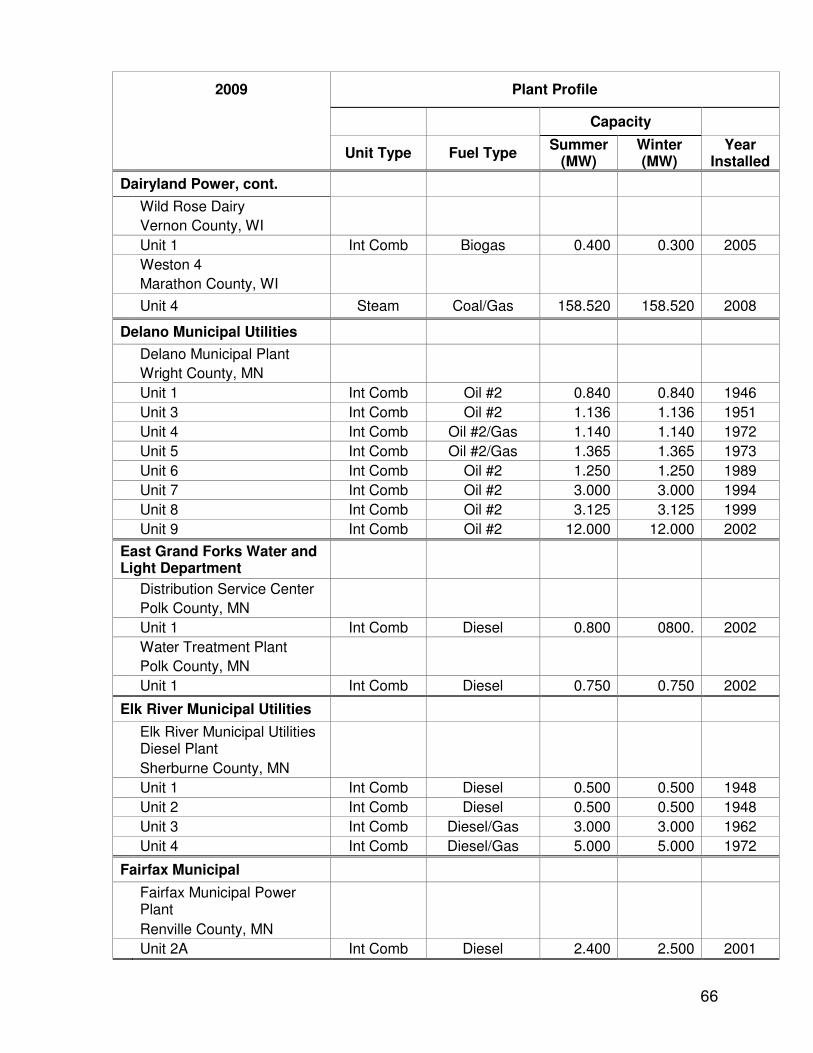
66
2009 Plant Profile
Capacity
Unit Type Fuel Type Summer
(MW) Winter (MW)
Year Installed
Dairyland Power, cont.
Wild Rose Dairy
Vernon County, WI
Unit 1 Int Comb Biogas 0.400 0.300 2005
Weston 4
Marathon County, WI
Unit 4 Steam Coal/Gas 158.520 158.520 2008
Delano Municipal Utilities
Delano Municipal Plant
Wright County, MN
Unit 1 Int Comb Oil #2 0.840 0.840 1946
Unit 3 Int Comb Oil #2 1.136 1.136 1951
Unit 4 Int Comb Oil #2/Gas 1.140 1.140 1972
Unit 5 Int Comb Oil #2/Gas 1.365 1.365 1973
Unit 6 Int Comb Oil #2 1.250 1.250 1989
Unit 7 Int Comb Oil #2 3.000 3.000 1994
Unit 8 Int Comb Oil #2 3.125 3.125 1999
Unit 9 Int Comb Oil #2 12.000 12.000 2002
East Grand Forks Water and Light Department
Distribution Service Center
Polk County, MN
Unit 1 Int Comb Diesel 0.800 0800. 2002
Water Treatment Plant
Polk County, MN
Unit 1 Int Comb Diesel 0.750 0.750 2002
Elk River Municipal Utilities
Elk River Municipal Utilities Diesel Plant
Sherburne County, MN
Unit 1 Int Comb Diesel 0.500 0.500 1948
Unit 2 Int Comb Diesel 0.500 0.500 1948
Unit 3 Int Comb Diesel/Gas 3.000 3.000 1962
Unit 4 Int Comb Diesel/Gas 5.000 5.000 1972
Fairfax Municipal
Fairfax Municipal Power Plant
Renville County, MN
Unit 2A Int Comb Diesel 2.400 2.500 2001
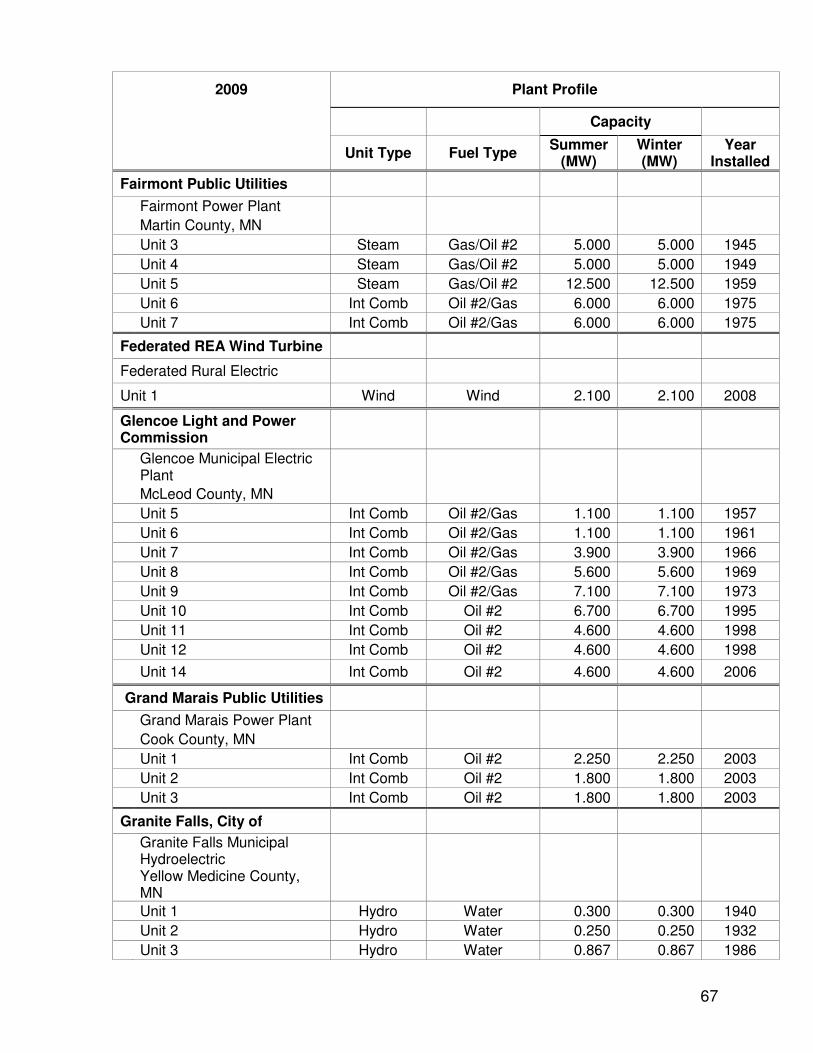
67
2009 Plant Profile
Capacity
Unit Type Fuel Type Summer
(MW) Winter (MW)
Year Installed
Fairmont Public Utilities
Fairmont Power Plant
Martin County, MN
Unit 3 Steam Gas/Oil #2 5.000 5.000 1945
Unit 4 Steam Gas/Oil #2 5.000 5.000 1949
Unit 5 Steam Gas/Oil #2 12.500 12.500 1959
Unit 6 Int Comb Oil #2/Gas 6.000 6.000 1975
Unit 7 Int Comb Oil #2/Gas 6.000 6.000 1975
Federated REA Wind Turbine
Federated Rural Electric
Unit 1 Wind Wind 2.100 2.100 2008
Glencoe Light and Power Commission
Glencoe Municipal Electric Plant
McLeod County, MN
Unit 5 Int Comb Oil #2/Gas 1.100 1.100 1957
Unit 6 Int Comb Oil #2/Gas 1.100 1.100 1961
Unit 7 Int Comb Oil #2/Gas 3.900 3.900 1966
Unit 8 Int Comb Oil #2/Gas 5.600 5.600 1969
Unit 9 Int Comb Oil #2/Gas 7.100 7.100 1973
Unit 10 Int Comb Oil #2 6.700 6.700 1995
Unit 11 Int Comb Oil #2 4.600 4.600 1998
Unit 12 Int Comb Oil #2 4.600 4.600 1998
Unit 14 Int Comb Oil #2 4.600 4.600 2006
Grand Marais Public Utilities
Grand Marais Power Plant
Cook County, MN
Unit 1 Int Comb Oil #2 2.250 2.250 2003
Unit 2 Int Comb Oil #2 1.800 1.800 2003
Unit 3 Int Comb Oil #2 1.800 1.800 2003
Granite Falls, City of
Granite Falls Municipal Hydroelectric
Yellow Medicine County, MN
Unit 1 Hydro Water 0.300 0.300 1940
Unit 2 Hydro Water 0.250 0.250 1932
Unit 3 Hydro Water 0.867 0.867 1986
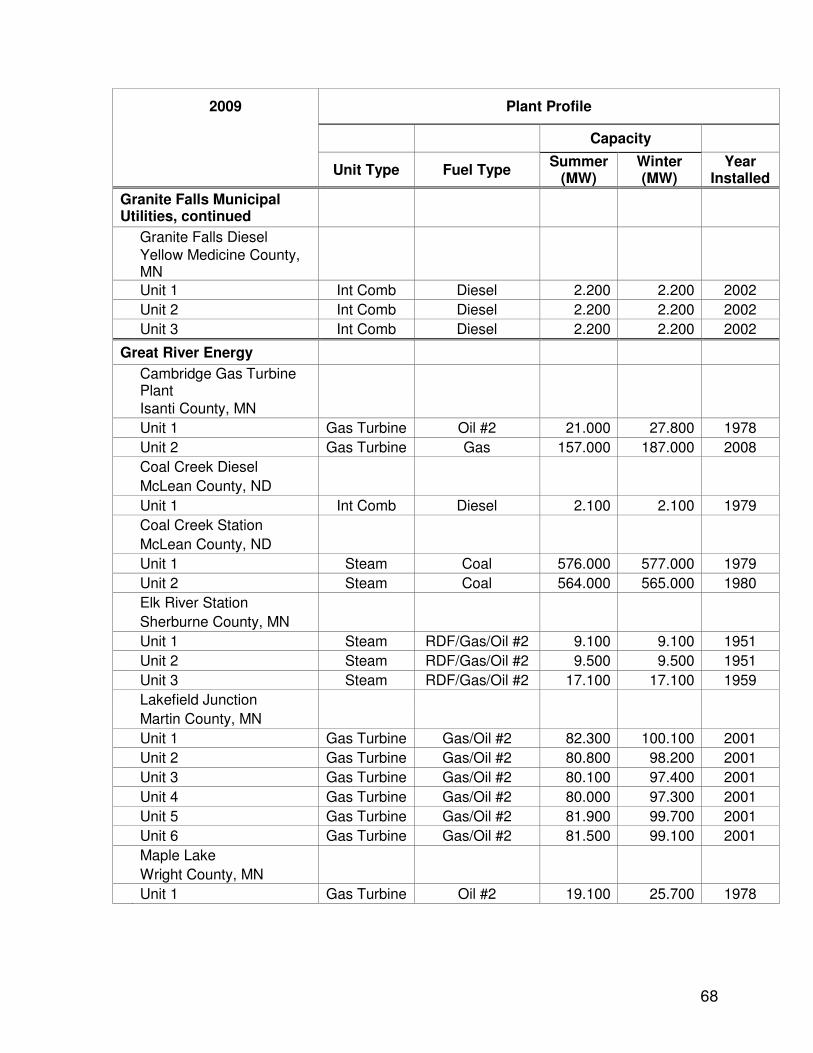
68
2009 Plant Profile
Capacity
Unit Type Fuel Type Summer
(MW) Winter (MW)
Year Installed
Granite Falls Municipal Utilities, continued
Granite Falls Diesel
Yellow Medicine County, MN
Unit 1 Int Comb Diesel 2.200 2.200 2002
Unit 2 Int Comb Diesel 2.200 2.200 2002
Unit 3 Int Comb Diesel 2.200 2.200 2002
Great River Energy
Cambridge Gas Turbine Plant
Isanti County, MN
Unit 1 Gas Turbine Oil #2 21.000 27.800 1978
Unit 2 Gas Turbine Gas 157.000 187.000 2008
Coal Creek Diesel
McLean County, ND
Unit 1 Int Comb Diesel 2.100 2.100 1979
Coal Creek Station
McLean County, ND
Unit 1 Steam Coal 576.000 577.000 1979
Unit 2 Steam Coal 564.000 565.000 1980
Elk River Station
Sherburne County, MN
Unit 1 Steam RDF/Gas/Oil #2 9.100 9.100 1951
Unit 2 Steam RDF/Gas/Oil #2 9.500 9.500 1951
Unit 3 Steam RDF/Gas/Oil #2 17.100 17.100 1959
Lakefield Junction
Martin County, MN
Unit 1 Gas Turbine Gas/Oil #2 82.300 100.100 2001
Unit 2 Gas Turbine Gas/Oil #2 80.800 98.200 2001
Unit 3 Gas Turbine Gas/Oil #2 80.100 97.400 2001
Unit 4 Gas Turbine Gas/Oil #2 80.000 97.300 2001
Unit 5 Gas Turbine Gas/Oil #2 81.900 99.700 2001
Unit 6 Gas Turbine Gas/Oil #2 81.500 99.100 2001
Maple Lake
Wright County, MN
Unit 1 Gas Turbine Oil #2 19.100 25.700 1978
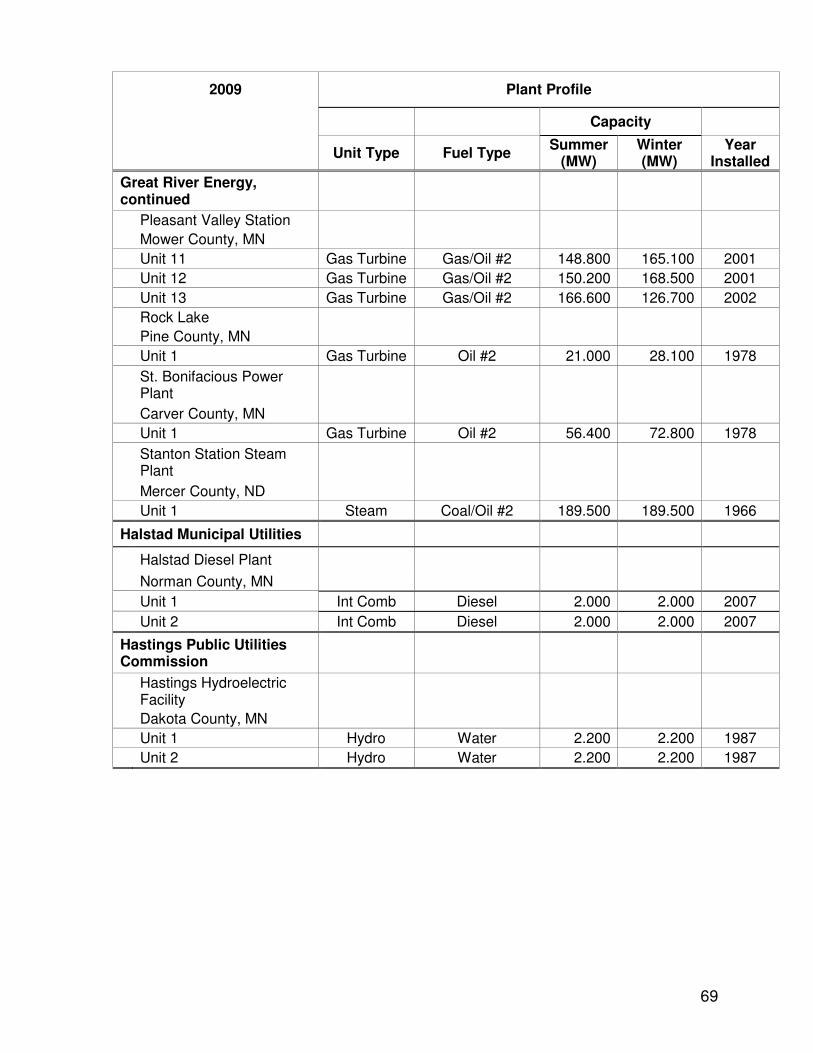
69
2009 Plant Profile
Capacity
Unit Type Fuel Type Summer
(MW) Winter (MW)
Year Installed
Great River Energy, continued
Pleasant Valley Station
Mower County, MN
Unit 11 Gas Turbine Gas/Oil #2 148.800 165.100 2001
Unit 12 Gas Turbine Gas/Oil #2 150.200 168.500 2001
Unit 13 Gas Turbine Gas/Oil #2 166.600 126.700 2002
Rock Lake
Pine County, MN
Unit 1 Gas Turbine Oil #2 21.000 28.100 1978
St. Bonifacious Power Plant
Carver County, MN
Unit 1 Gas Turbine Oil #2 56.400 72.800 1978
Stanton Station Steam Plant
Mercer County, ND
Unit 1 Steam Coal/Oil #2 189.500 189.500 1966
Halstad Municipal Utilities
Halstad Diesel Plant
Norman County, MN
Unit 1 Int Comb Diesel 2.000 2.000 2007
Unit 2 Int Comb Diesel 2.000 2.000 2007
Hastings Public Utilities Commission
Hastings Hydroelectric Facility
Dakota County, MN
Unit 1 Hydro Water 2.200 2.200 1987
Unit 2 Hydro Water 2.200 2.200 1987
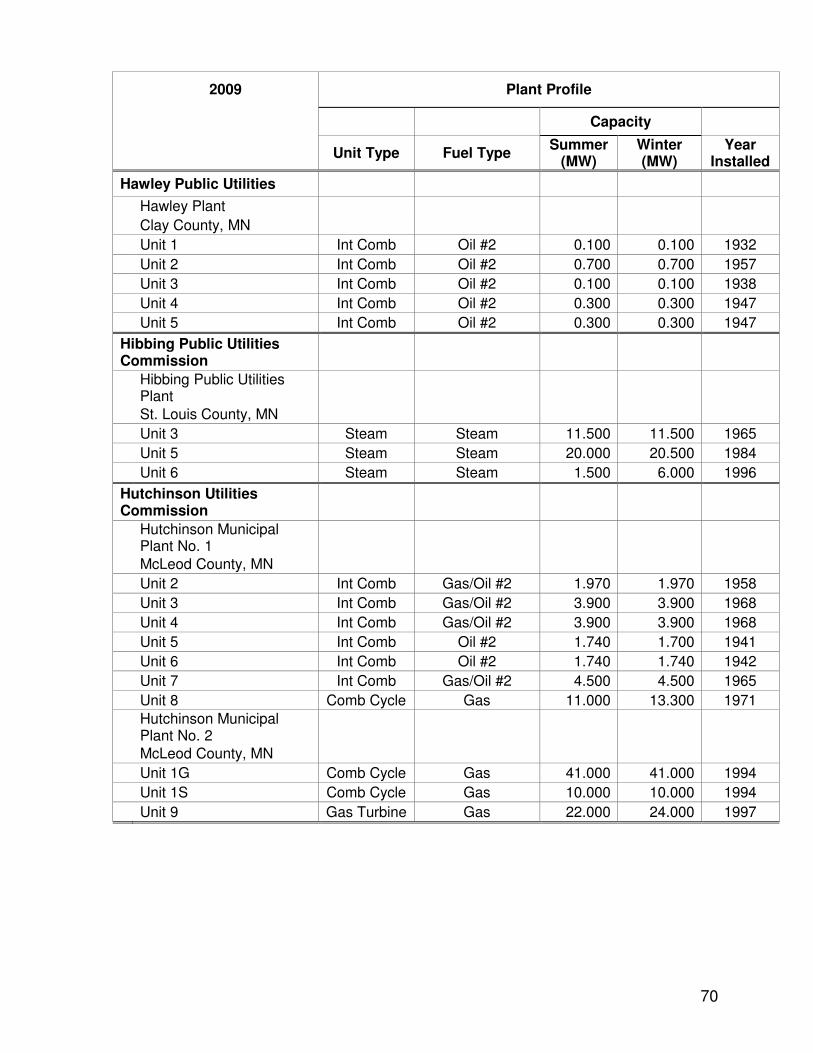
70
2009 Plant Profile
Capacity
Unit Type Fuel Type Summer
(MW) Winter (MW)
Year Installed
Hawley Public Utilities
Hawley Plant
Clay County, MN
Unit 1 Int Comb Oil #2 0.100 0.100 1932
Unit 2 Int Comb Oil #2 0.700 0.700 1957
Unit 3 Int Comb Oil #2 0.100 0.100 1938
Unit 4 Int Comb Oil #2 0.300 0.300 1947
Unit 5 Int Comb Oil #2 0.300 0.300 1947
Hibbing Public Utilities Commission
Hibbing Public Utilities Plant
St. Louis County, MN
Unit 3 Steam Steam 11.500 11.500 1965
Unit 5 Steam Steam 20.000 20.500 1984
Unit 6 Steam Steam 1.500 6.000 1996
Hutchinson Utilities Commission
Hutchinson Municipal Plant No. 1
McLeod County, MN
Unit 2 Int Comb Gas/Oil #2 1.970 1.970 1958
Unit 3 Int Comb Gas/Oil #2 3.900 3.900 1968
Unit 4 Int Comb Gas/Oil #2 3.900 3.900 1968
Unit 5 Int Comb Oil #2 1.740 1.700 1941
Unit 6 Int Comb Oil #2 1.740 1.740 1942
Unit 7 Int Comb Gas/Oil #2 4.500 4.500 1965
Unit 8 Comb Cycle Gas 11.000 13.300 1971
Hutchinson Municipal Plant No. 2
McLeod County, MN
Unit 1G Comb Cycle Gas 41.000 41.000 1994
Unit 1S Comb Cycle Gas 10.000 10.000 1994
Unit 9 Gas Turbine Gas 22.000 24.000 1997
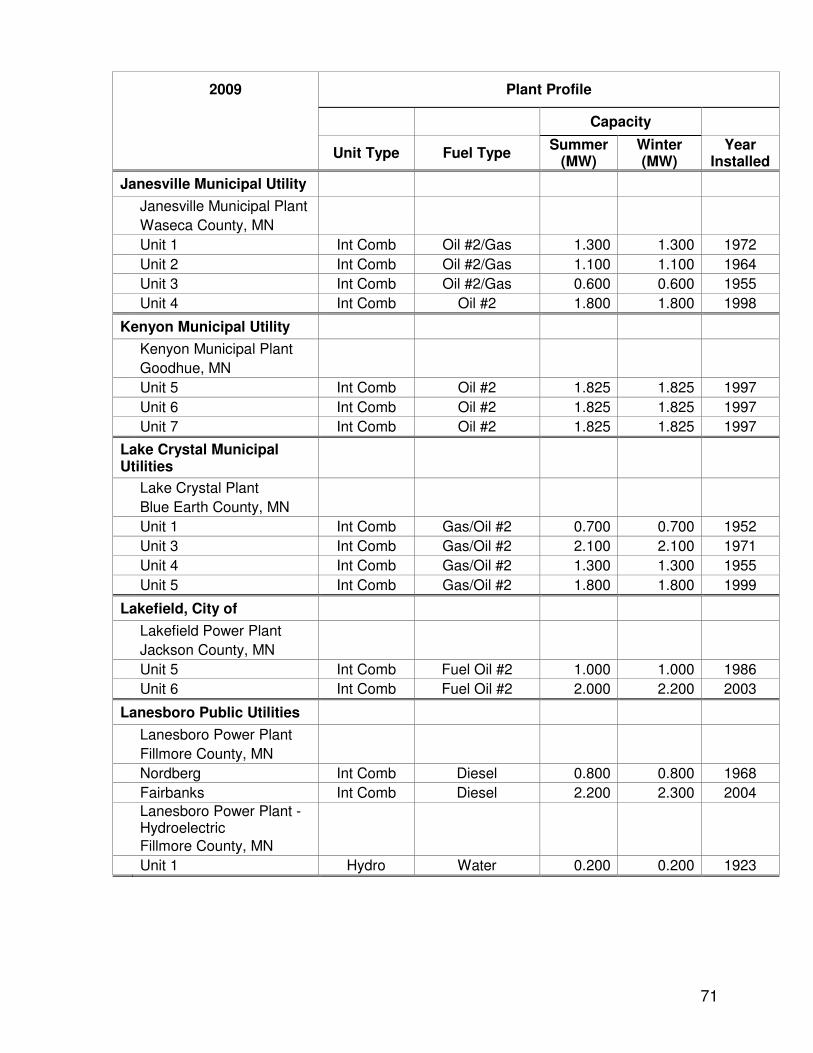
71
2009 Plant Profile
Capacity
Unit Type Fuel Type Summer
(MW) Winter (MW)
Year Installed
Janesville Municipal Utility
Janesville Municipal Plant
Waseca County, MN
Unit 1 Int Comb Oil #2/Gas 1.300 1.300 1972
Unit 2 Int Comb Oil #2/Gas 1.100 1.100 1964
Unit 3 Int Comb Oil #2/Gas 0.600 0.600 1955
Unit 4 Int Comb Oil #2 1.800 1.800 1998
Kenyon Municipal Utility
Kenyon Municipal Plant
Goodhue, MN
Unit 5 Int Comb Oil #2 1.825 1.825 1997
Unit 6 Int Comb Oil #2 1.825 1.825 1997
Unit 7 Int Comb Oil #2 1.825 1.825 1997
Lake Crystal Municipal Utilities
Lake Crystal Plant
Blue Earth County, MN
Unit 1 Int Comb Gas/Oil #2 0.700 0.700 1952
Unit 3 Int Comb Gas/Oil #2 2.100 2.100 1971
Unit 4 Int Comb Gas/Oil #2 1.300 1.300 1955
Unit 5 Int Comb Gas/Oil #2 1.800 1.800 1999
Lakefield, City of
Lakefield Power Plant
Jackson County, MN
Unit 5 Int Comb Fuel Oil #2 1.000 1.000 1986
Unit 6 Int Comb Fuel Oil #2 2.000 2.200 2003
Lanesboro Public Utilities
Lanesboro Power Plant
Fillmore County, MN
Nordberg Int Comb Diesel 0.800 0.800 1968
Fairbanks Int Comb Diesel 2.200 2.300 2004
Lanesboro Power Plant - Hydroelectric
Fillmore County, MN
Unit 1 Hydro Water 0.200 0.200 1923

72
2009 Plant Profile
Capacity
Unit Type Fuel Type Summer
(MW) Winter (MW)
Year Installed
Litchfield Public Utilities
Litchfield Power Plant
Meeker County, MN
Unit 1 Int Comb Gas/Diesel 2.100 2.100 1962
Unit 2 Int Comb Gas/Diesel 2.100 2.100 1962
Luverne, City of
Luverne Power Plant Rock County, MN
Unit 1 Int Comb Diesel 3.500 3.500 1967
Madelia Municipal Light & Power
Madelia Municipal Plant
Watonwan County, MN
Unit 1 Int Comb Oil #2/Gas 2.800 3.160 2001
Unit 2 Int Comb Oil #2/Gas 1.700 2.000 1966
Unit 3 Int Comb Oil #2/Gas 0.800 0.800 1959
Unit 4 Int Comb Oil #2/Gas 3.750 4.000 1973
Unit 5 Int Comb Oil #2/Gas 1.200 1.200 1954
Marshall Municipal Utilities
Marshall Power Plant
Lyon County, MN
Unit 6 Gas Turbine Oil #2 15.000 19.000 1969
Melrose Public Utilities
Melrose Power Plant
Stearns County, MN
Unit 1 Int Comb Oil #2 0.750 0.750 1945
Unit 2 Int Comb Oil #2 0.825 0.825 1948
Unit 3 Int Comb Oil #2/Diesel 3.000 3.000 1969
Unit 4 Int Comb Oil #2/Diesel 3.000 3.000 1969
Minnesota Power Company
Blanchard Hydroelectric Station
Morrison County, MN
Unit 1 Hydro Water 5.400 5.400 1925
Unit 2 Hydro Water 5.600 5.600 1925
Unit 3 Hydro Water 5.300 5.300 1988
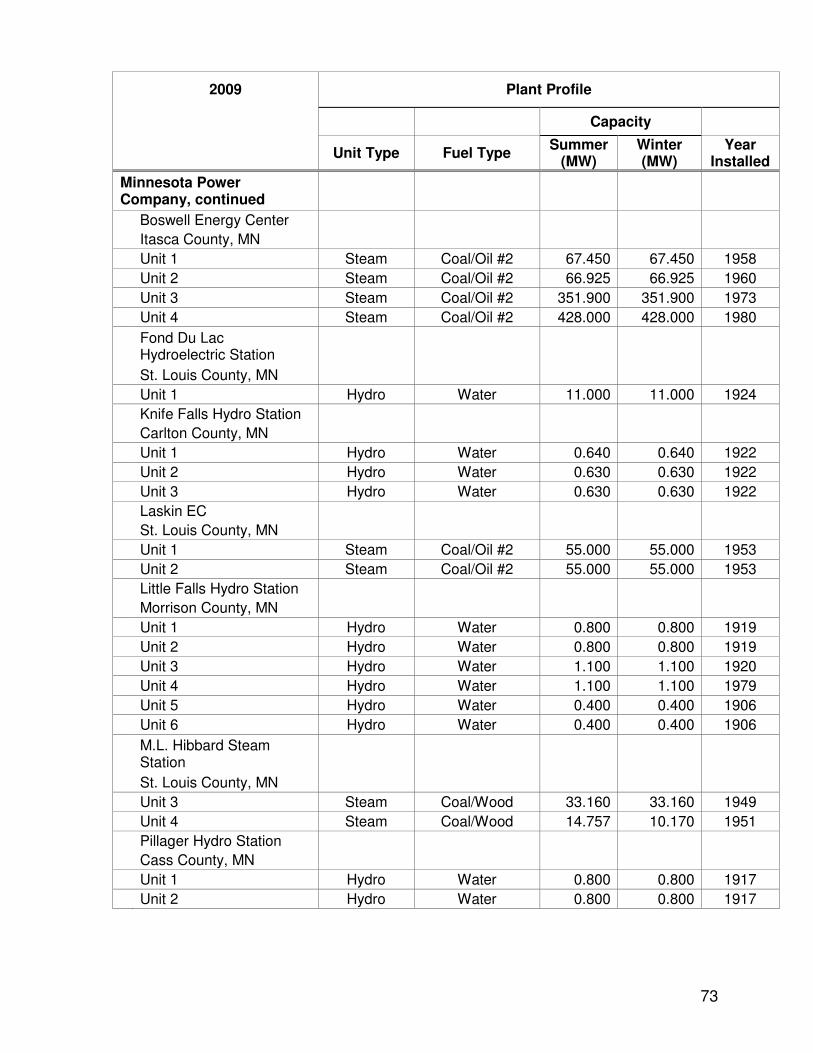
73
2009 Plant Profile
Capacity
Unit Type Fuel Type Summer
(MW) Winter (MW)
Year Installed
Minnesota Power Company, continued
Boswell Energy Center
Itasca County, MN
Unit 1 Steam Coal/Oil #2 67.450 67.450 1958
Unit 2 Steam Coal/Oil #2 66.925 66.925 1960
Unit 3 Steam Coal/Oil #2 351.900 351.900 1973
Unit 4 Steam Coal/Oil #2 428.000 428.000 1980
Fond Du Lac Hydroelectric Station
St. Louis County, MN
Unit 1 Hydro Water 11.000 11.000 1924
Knife Falls Hydro Station
Carlton County, MN
Unit 1 Hydro Water 0.640 0.640 1922
Unit 2 Hydro Water 0.630 0.630 1922
Unit 3 Hydro Water 0.630 0.630 1922
Laskin EC
St. Louis County, MN
Unit 1 Steam Coal/Oil #2 55.000 55.000 1953
Unit 2 Steam Coal/Oil #2 55.000 55.000 1953
Little Falls Hydro Station
Morrison County, MN
Unit 1 Hydro Water 0.800 0.800 1919
Unit 2 Hydro Water 0.800 0.800 1919
Unit 3 Hydro Water 1.100 1.100 1920
Unit 4 Hydro Water 1.100 1.100 1979
Unit 5 Hydro Water 0.400 0.400 1906
Unit 6 Hydro Water 0.400 0.400 1906
M.L. Hibbard Steam Station
St. Louis County, MN
Unit 3 Steam Coal/Wood 33.160 33.160 1949
Unit 4 Steam Coal/Wood 14.757 10.170 1951
Pillager Hydro Station
Cass County, MN
Unit 1 Hydro Water 0.800 0.800 1917
Unit 2 Hydro Water 0.800 0.800 1917

74
2009 Plant Profile
Capacity
Unit Type Fuel Type Summer
(MW) Winter (MW)
Year Installed
Minnesota Power Company, continued
Prairie River Hydroelectric Station
Itasca County, MN
Unit 1 Hydro Water 0.400 0.400 1921
Unit 2 Hydro Water 0.400 0.400 1921
Rapids Energy Center
Itasca County, MN
Unit 4 Hydro Water 0.900 1.044 1917
Unit 5 Hydro Water 0.000 0.000 1948
Unit 6 Steam Gas/Wood 13.340 13.340 1969
Unit 7 Steam Wood 16.000 16.000 1980
Sappi Cloquet Turbine Generator 5
Carlton County, MN
Unit 5 Steam Wood/Gas 22.554 22.554 2001
Scanlon Hydroelectric Station
Carlton County, MN
Unit 1 Hydro Water 0.400 0.400 1923
Unit 2 Hydro Water 0.400 0.400 1923
Unit 3 Hydro Water 0.400 0.400 1923
Unit 4 Hydro Water 0.400 0.400 1923
Sylvan Hydroelectric Station
Cass County, MN
Unit 1 Hydro Water 0.600 0.600 1913
Unit 2 Hydro Water 0.600 0.600 1913
Unit 3 Hydro Water 0.600 0.600 1915
Taconite Harbor
Cook County, MN
Unit 1 Steam Coal/Oil #2 77.500 77.500 1953
Unit 2 Steam Coal/Oil #2 77.000 77.000 1953
Unit 3 Steam Coal/Oil #2 76.000 76.000 1954
Taconite Ridge 1
St. Louis County, MN
Unit 1 Wind 25.000 25.000 2008
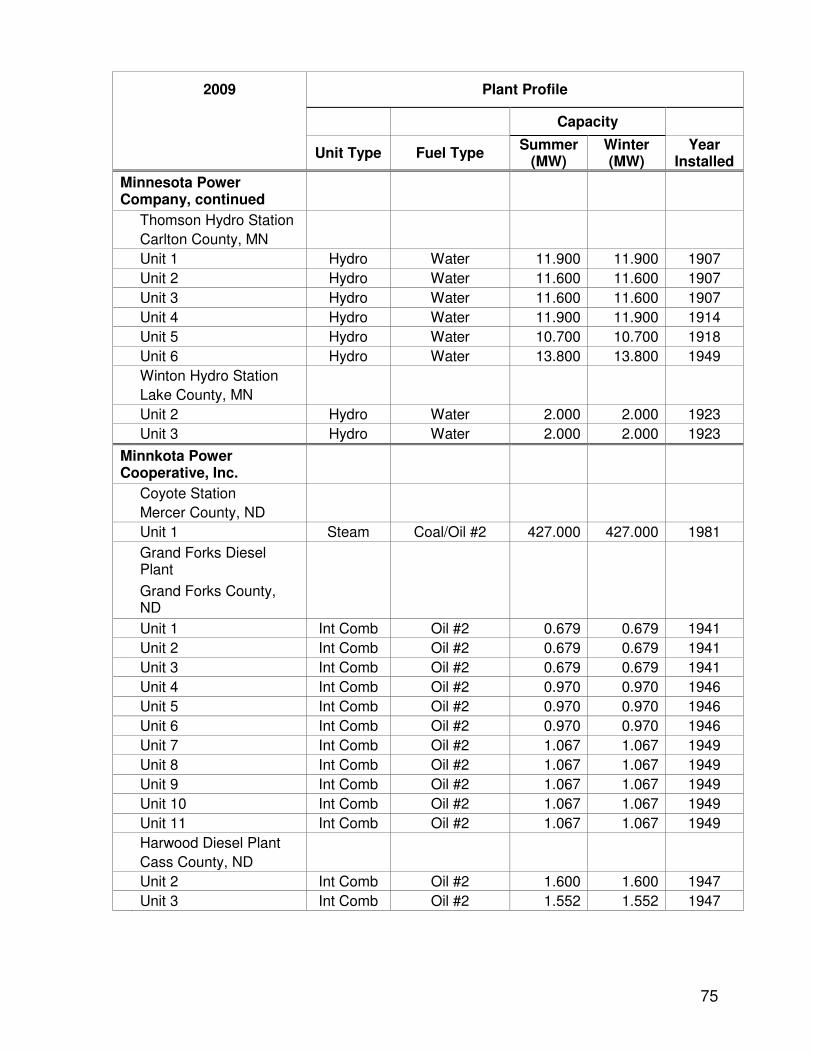
75
2009 Plant Profile
Capacity
Unit Type Fuel Type Summer
(MW) Winter (MW)
Year Installed
Minnesota Power Company, continued
Thomson Hydro Station
Carlton County, MN
Unit 1 Hydro Water 11.900 11.900 1907
Unit 2 Hydro Water 11.600 11.600 1907
Unit 3 Hydro Water 11.600 11.600 1907
Unit 4 Hydro Water 11.900 11.900 1914
Unit 5 Hydro Water 10.700 10.700 1918
Unit 6 Hydro Water 13.800 13.800 1949
Winton Hydro Station
Lake County, MN
Unit 2 Hydro Water 2.000 2.000 1923
Unit 3 Hydro Water 2.000 2.000 1923
Minnkota Power Cooperative, Inc.
Coyote Station
Mercer County, ND
Unit 1 Steam Coal/Oil #2 427.000 427.000 1981
Grand Forks Diesel Plant
Grand Forks County, ND
Unit 1 Int Comb Oil #2 0.679 0.679 1941
Unit 2 Int Comb Oil #2 0.679 0.679 1941
Unit 3 Int Comb Oil #2 0.679 0.679 1941
Unit 4 Int Comb Oil #2 0.970 0.970 1946
Unit 5 Int Comb Oil #2 0.970 0.970 1946
Unit 6 Int Comb Oil #2 0.970 0.970 1946
Unit 7 Int Comb Oil #2 1.067 1.067 1949
Unit 8 Int Comb Oil #2 1.067 1.067 1949
Unit 9 Int Comb Oil #2 1.067 1.067 1949
Unit 10 Int Comb Oil #2 1.067 1.067 1949
Unit 11 Int Comb Oil #2 1.067 1.067 1949
Harwood Diesel Plant
Cass County, ND
Unit 2 Int Comb Oil #2 1.600 1.600 1947
Unit 3 Int Comb Oil #2 1.552 1.552 1947
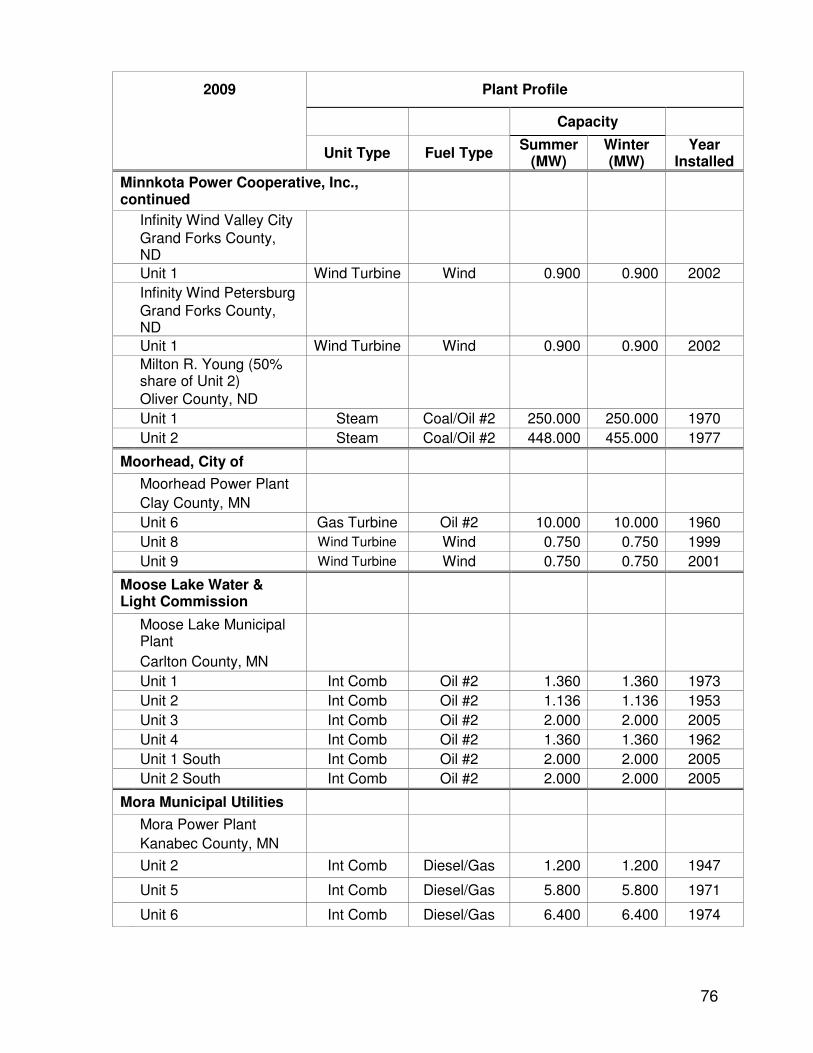
76
2009 Plant Profile
Capacity
Unit Type Fuel Type Summer
(MW) Winter (MW)
Year Installed
Minnkota Power Cooperative, Inc., continued
Infinity Wind Valley City
Grand Forks County, ND
Unit 1 Wind Turbine Wind 0.900 0.900 2002
Infinity Wind Petersburg
Grand Forks County, ND
Unit 1 Wind Turbine Wind 0.900 0.900 2002
Milton R. Young (50% share of Unit 2)
Oliver County, ND
Unit 1 Steam Coal/Oil #2 250.000 250.000 1970
Unit 2 Steam Coal/Oil #2 448.000 455.000 1977
Moorhead, City of
Moorhead Power Plant
Clay County, MN
Unit 6 Gas Turbine Oil #2 10.000 10.000 1960
Unit 8 Wind Turbine Wind 0.750 0.750 1999
Unit 9 Wind Turbine Wind 0.750 0.750 2001
Moose Lake Water & Light Commission
Moose Lake Municipal Plant
Carlton County, MN
Unit 1 Int Comb Oil #2 1.360 1.360 1973
Unit 2 Int Comb Oil #2 1.136 1.136 1953
Unit 3 Int Comb Oil #2 2.000 2.000 2005
Unit 4 Int Comb Oil #2 1.360 1.360 1962
Unit 1 South Int Comb Oil #2 2.000 2.000 2005
Unit 2 South Int Comb Oil #2 2.000 2.000 2005
Mora Municipal Utilities
Mora Power Plant
Kanabec County, MN
Unit 2 Int Comb Diesel/Gas 1.200 1.200 1947
Unit 5 Int Comb Diesel/Gas 5.800 5.800 1971
Unit 6 Int Comb Diesel/Gas 6.400 6.400 1974
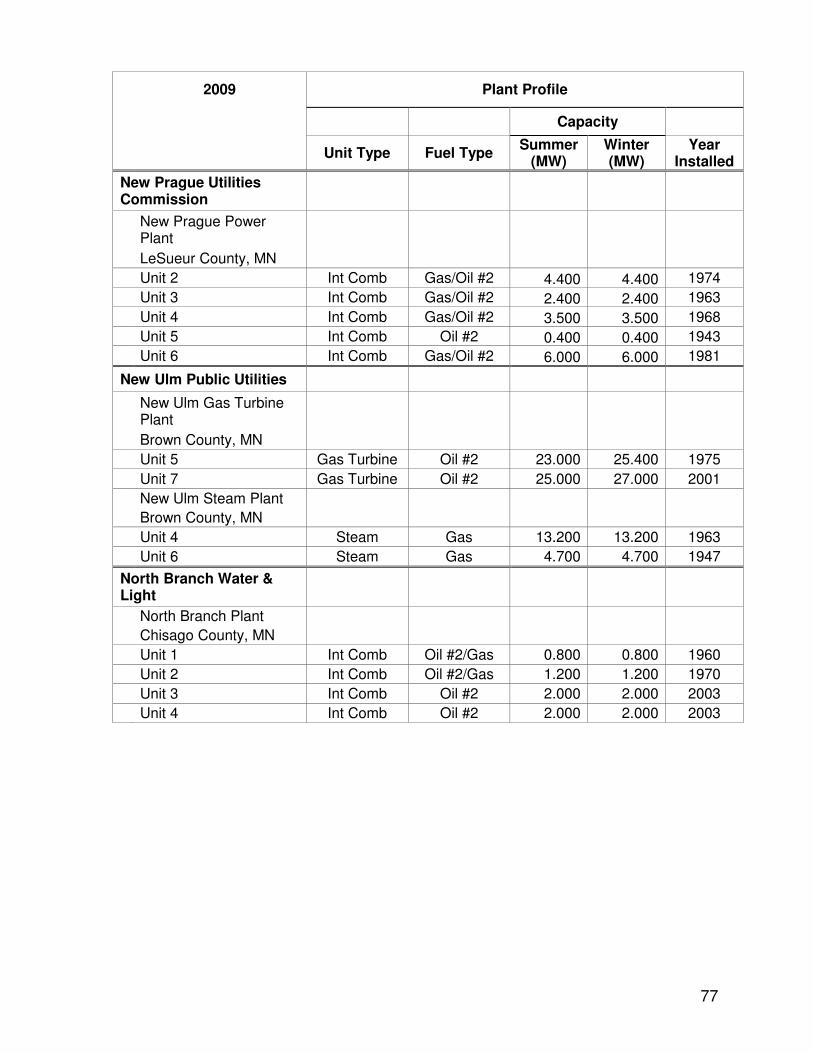
77
2009 Plant Profile
Capacity
Unit Type Fuel Type Summer
(MW) Winter (MW)
Year Installed
New Prague Utilities Commission
New Prague Power Plant
LeSueur County, MN
Unit 2 Int Comb Gas/Oil #2 4.400 4.400 1974
Unit 3 Int Comb Gas/Oil #2 2.400 2.400 1963
Unit 4 Int Comb Gas/Oil #2 3.500 3.500 1968
Unit 5 Int Comb Oil #2 0.400 0.400 1943
Unit 6 Int Comb Gas/Oil #2 6.000 6.000 1981
New Ulm Public Utilities
New Ulm Gas Turbine Plant
Brown County, MN
Unit 5 Gas Turbine Oil #2 23.000 25.400 1975
Unit 7 Gas Turbine Oil #2 25.000 27.000 2001
New Ulm Steam Plant
Brown County, MN
Unit 4 Steam Gas 13.200 13.200 1963
Unit 6 Steam Gas 4.700 4.700 1947
North Branch Water & Light
North Branch Plant
Chisago County, MN
Unit 1 Int Comb Oil #2/Gas 0.800 0.800 1960
Unit 2 Int Comb Oil #2/Gas 1.200 1.200 1970
Unit 3 Int Comb Oil #2 2.000 2.000 2003
Unit 4 Int Comb Oil #2 2.000 2.000 2003
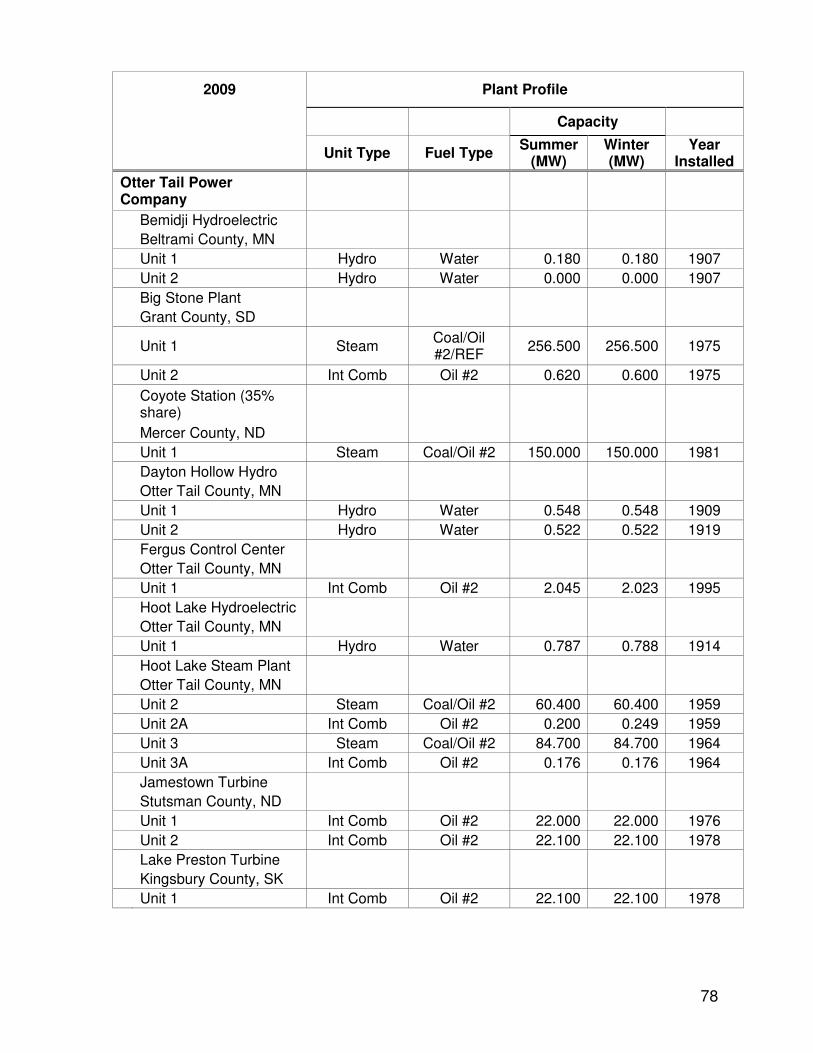
78
2009 Plant Profile
Capacity
Unit Type Fuel Type Summer
(MW) Winter (MW)
Year Installed
Otter Tail Power Company
Bemidji Hydroelectric
Beltrami County, MN
Unit 1 Hydro Water 0.180 0.180 1907
Unit 2 Hydro Water 0.000 0.000 1907
Big Stone Plant
Grant County, SD
Unit 1 Steam Coal/Oil #2/REF
256.500 256.500 1975
Unit 2 Int Comb Oil #2 0.620 0.600 1975
Coyote Station (35% share)
Mercer County, ND
Unit 1 Steam Coal/Oil #2 150.000 150.000 1981
Dayton Hollow Hydro
Otter Tail County, MN
Unit 1 Hydro Water 0.548 0.548 1909
Unit 2 Hydro Water 0.522 0.522 1919
Fergus Control Center
Otter Tail County, MN
Unit 1 Int Comb Oil #2 2.045 2.023 1995
Hoot Lake Hydroelectric
Otter Tail County, MN
Unit 1 Hydro Water 0.787 0.788 1914
Hoot Lake Steam Plant
Otter Tail County, MN
Unit 2 Steam Coal/Oil #2 60.400 60.400 1959
Unit 2A Int Comb Oil #2 0.200 0.249 1959
Unit 3 Steam Coal/Oil #2 84.700 84.700 1964
Unit 3A Int Comb Oil #2 0.176 0.176 1964
Jamestown Turbine
Stutsman County, ND
Unit 1 Int Comb Oil #2 22.000 22.000 1976
Unit 2 Int Comb Oil #2 22.100 22.100 1978
Lake Preston Turbine
Kingsbury County, SK
Unit 1 Int Comb Oil #2 22.100 22.100 1978
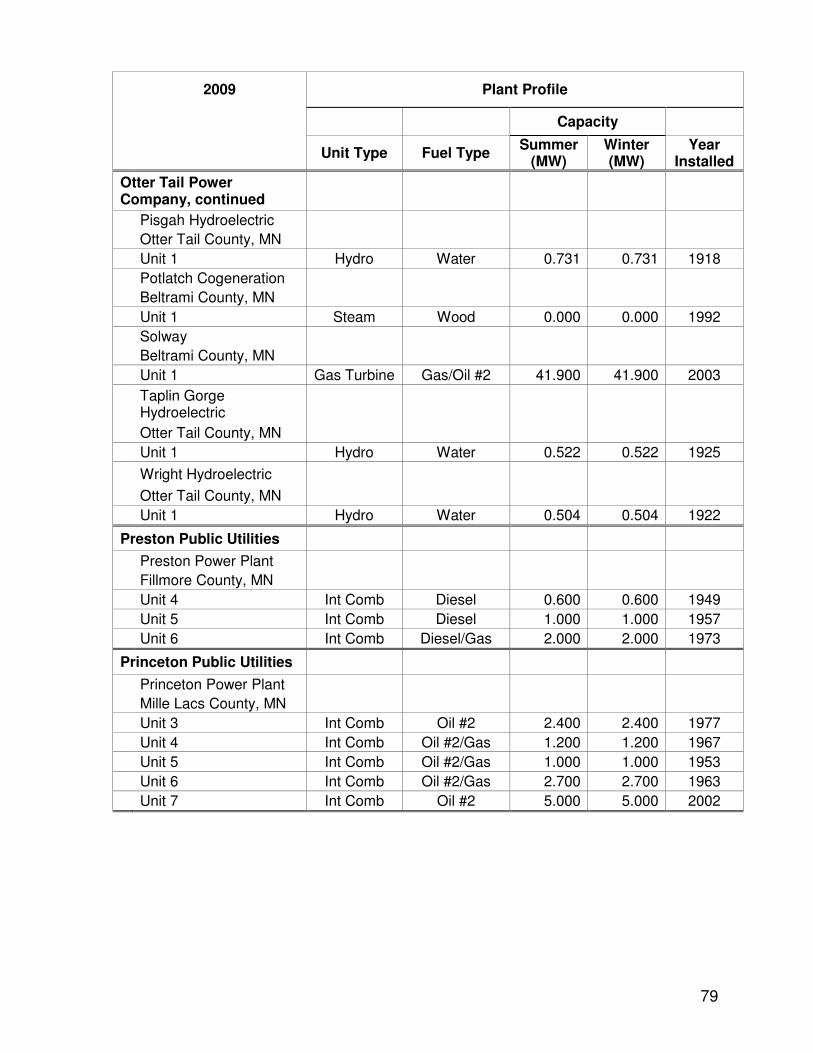
79
2009 Plant Profile
Capacity
Unit Type Fuel Type Summer
(MW) Winter (MW)
Year Installed
Otter Tail Power Company, continued
Pisgah Hydroelectric
Otter Tail County, MN
Unit 1 Hydro Water 0.731 0.731 1918
Potlatch Cogeneration
Beltrami County, MN
Unit 1 Steam Wood 0.000 0.000 1992
Solway
Beltrami County, MN
Unit 1 Gas Turbine Gas/Oil #2 41.900 41.900 2003
Taplin Gorge Hydroelectric
Otter Tail County, MN
Unit 1 Hydro Water 0.522 0.522 1925
Wright Hydroelectric
Otter Tail County, MN
Unit 1 Hydro Water 0.504 0.504 1922
Preston Public Utilities
Preston Power Plant
Fillmore County, MN
Unit 4 Int Comb Diesel 0.600 0.600 1949
Unit 5 Int Comb Diesel 1.000 1.000 1957
Unit 6 Int Comb Diesel/Gas 2.000 2.000 1973
Princeton Public Utilities
Princeton Power Plant
Mille Lacs County, MN
Unit 3 Int Comb Oil #2 2.400 2.400 1977
Unit 4 Int Comb Oil #2/Gas 1.200 1.200 1967
Unit 5 Int Comb Oil #2/Gas 1.000 1.000 1953
Unit 6 Int Comb Oil #2/Gas 2.700 2.700 1963
Unit 7 Int Comb Oil #2 5.000 5.000 2002

80
2009 Plant Profile
Capacity
Unit Type Fuel Type Summer
(MW) Winter (MW)
Year Installed
Redwood Falls Public Utilities Commission
Redwood Falls Power Plant
Redwood County, MN
Unit 1A Hydro Water 0.500 0.500 1930
Unit 7 Int Comb Gas/Oil #2 5.800 5.800 1974
Southside Substation Plant
Redwood County, MN
Unit 2 Int Comb Oil #2 2.250 2.250 1968
Unit 3 Int Comb Oil #2 2.000 2.000 2002
Unit 4 Int Comb Oil #2 2.000 2.000 2002
Unit 5 Int Comb Oil #2 2.000 2.000 2002
Rochester Public Utilities
Cascade Creek
Olmsted County, MN
Unit 1 Gas Turbine Gas/Oil #6 31.000 31.000 1974
Unit 2 Gas Turbine Gas/Oil #6 49.500 49.500 2002
Lake Zumbro Hydro
Wabasha County, MN
Unit 1 Hydro Water 1.300 1.000 1984
Unit 2 Hydro Water 1.300 1.000 1984
Silver Lake Steam Plant
Olmsted County, MN
Unit 1 Steam Coal/Gas 9.000 9.000 1949
Unit 2 Steam Coal/Gas 14.000 14.000 1953
Unit 3 Steam Coal/Gas 24.000 24.000 1962
Unit 4 Steam Coal/Gas 59.000 59.000 1969
St. Charles Light & Water
St. Charles Power Plant
Winona County, MN
Unit 1 Int Comb Diesel 5.400 37.400 2004
Unit 2 Int Comb Diesel 5.000 36.600 2004
Unit 3 Int Comb Diesel 5.000 35.600 2004
Unit 4 Int Comb Diesel 5.100 37.000 2004
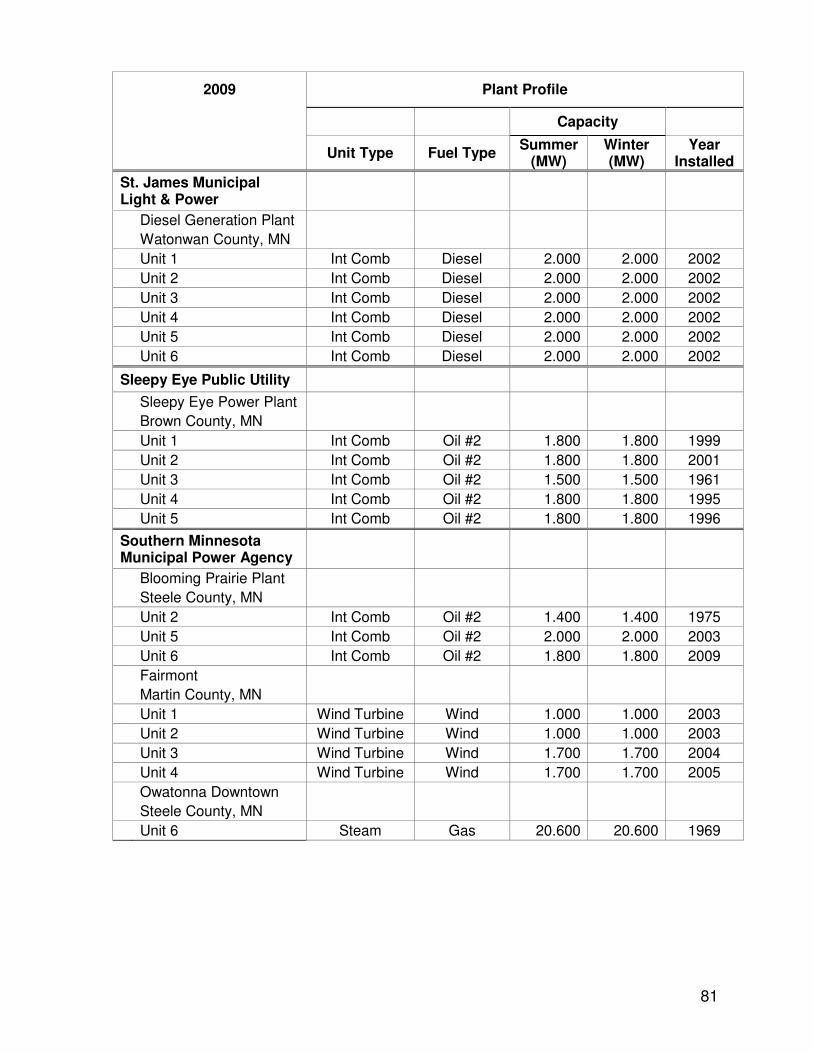
81
2009 Plant Profile
Capacity
Unit Type Fuel Type Summer
(MW) Winter (MW)
Year Installed
St. James Municipal Light & Power
Diesel Generation Plant
Watonwan County, MN
Unit 1 Int Comb Diesel 2.000 2.000 2002
Unit 2 Int Comb Diesel 2.000 2.000 2002
Unit 3 Int Comb Diesel 2.000 2.000 2002
Unit 4 Int Comb Diesel 2.000 2.000 2002
Unit 5 Int Comb Diesel 2.000 2.000 2002
Unit 6 Int Comb Diesel 2.000 2.000 2002
Sleepy Eye Public Utility
Sleepy Eye Power Plant
Brown County, MN
Unit 1 Int Comb Oil #2 1.800 1.800 1999
Unit 2 Int Comb Oil #2 1.800 1.800 2001
Unit 3 Int Comb Oil #2 1.500 1.500 1961
Unit 4 Int Comb Oil #2 1.800 1.800 1995
Unit 5 Int Comb Oil #2 1.800 1.800 1996
Southern Minnesota Municipal Power Agency
Blooming Prairie Plant
Steele County, MN
Unit 2 Int Comb Oil #2 1.400 1.400 1975
Unit 5 Int Comb Oil #2 2.000 2.000 2003
Unit 6 Int Comb Oil #2 1.800 1.800 2009
Fairmont
Martin County, MN
Unit 1 Wind Turbine Wind 1.000 1.000 2003
Unit 2 Wind Turbine Wind 1.000 1.000 2003
Unit 3 Wind Turbine Wind 1.700 1.700 2004
Unit 4 Wind Turbine Wind 1.700 1.700 2005
Owatonna Downtown
Steele County, MN
Unit 6 Steam Gas 20.600 20.600 1969
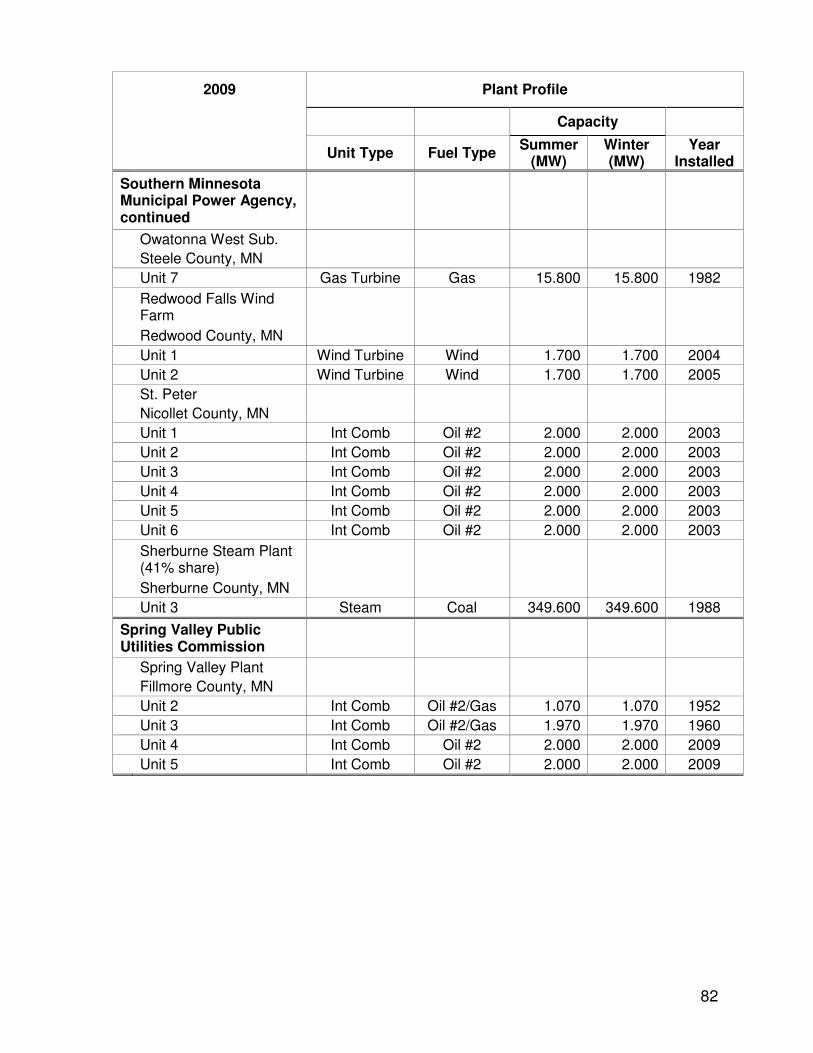
82
2009 Plant Profile
Capacity
Unit Type Fuel Type Summer
(MW) Winter (MW)
Year Installed
Southern Minnesota Municipal Power Agency, continued
Owatonna West Sub.
Steele County, MN
Unit 7 Gas Turbine Gas 15.800 15.800 1982
Redwood Falls Wind Farm
Redwood County, MN
Unit 1 Wind Turbine Wind 1.700 1.700 2004
Unit 2 Wind Turbine Wind 1.700 1.700 2005
St. Peter
Nicollet County, MN
Unit 1 Int Comb Oil #2 2.000 2.000 2003
Unit 2 Int Comb Oil #2 2.000 2.000 2003
Unit 3 Int Comb Oil #2 2.000 2.000 2003
Unit 4 Int Comb Oil #2 2.000 2.000 2003
Unit 5 Int Comb Oil #2 2.000 2.000 2003
Unit 6 Int Comb Oil #2 2.000 2.000 2003
Sherburne Steam Plant (41% share)
Sherburne County, MN
Unit 3 Steam Coal 349.600 349.600 1988
Spring Valley Public Utilities Commission
Spring Valley Plant
Fillmore County, MN
Unit 2 Int Comb Oil #2/Gas 1.070 1.070 1952
Unit 3 Int Comb Oil #2/Gas 1.970 1.970 1960
Unit 4 Int Comb Oil #2 2.000 2.000 2009
Unit 5 Int Comb Oil #2 2.000 2.000 2009

83
2009 Plant Profile
Capacity
Unit Type Fuel Type Summer
(MW) Winter (MW)
Year Installed
Steele Waseca Cooperative Electric
Windmills Co-Generators
Steele County, MN
Unit 1 Wind Wind 0.004 0.004 1984
Unit 2 Wind Wind 0.035 0.035 1997
Unit 3 Wind Wind 0.039 0.039 2002
Unit 4 Wind Wind 0.039 0.039 2002
Unit 5 Wind Wind 0.039 0.039 2002
Unit 6 Wind Wind 0.039 0.039 2002
Unit 7 Wind Wind 0.039 0.039 2002
Unit 8 Wind Wind 0.039 0.039 2003
Unit 9 Wind Wind 0.039 0.039 2003
Unit 10 Wind Wind 0.039 0.039 2004
Unit 11 Wind Wind 0.039 0.039 2004
Unit 12 Wind Wind 0.020 0.020 2004
Unit 13 Wind Wind 0.039 0.039 2004
Unit 14 Wind Wind 0.039 0.039 2004
Unit 15 Wind Wind 0.039 0.039 2004
Unit 16 Wind Wind 0.035 0.035 2006
Unit 17 Wind Wind/Solar 0.012 0.012 2007
Unit 18 Wind Wind 0.039 0.039 2004
Unit 19 Wind Wind 0.018 0.018 1984
Unit 20 Wind Wind 0.040 0.040 2009
Unit 21 Wind Wind 0.040 0.040 2009
Unit 22 Wind Wind 0.010 0.010 2009
Thief River Falls Municipal Utilities
Thief River Falls Municipal Power Plant
Pennington County, MN
Unit 1 Hydro Water 0.250 0.250 1927
Unit 2 Hydro Water 0.300 0.300 1927
Thief River Falls Municipal Power Plant
Pennington County, MN
Unit 1 Int Comb Oil #2 1.300 1.300 1956
Unit 2 Int Comb Oil #2 1.100 1.100 1953
Unit 3 Int Comb Oil #2 1.270 1.270 2000
Unit 4 Int Comb Oil #2 2.000 2.000 1946
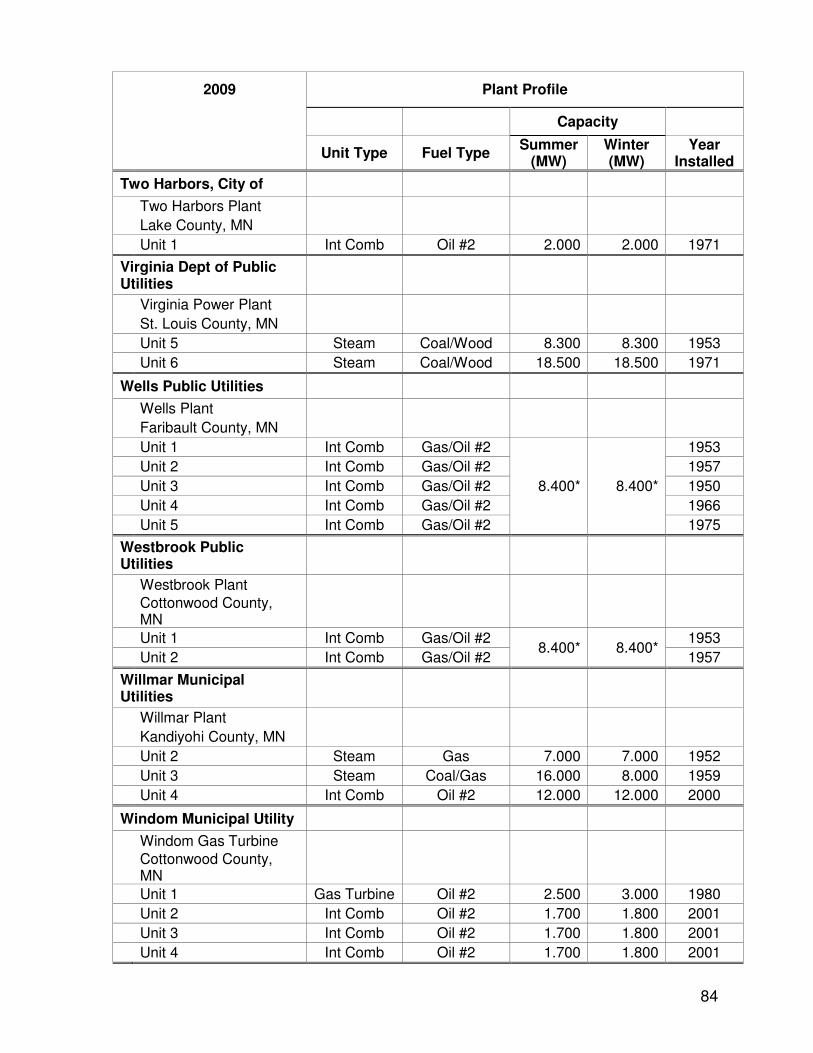
84
2009 Plant Profile
Capacity
Unit Type Fuel Type Summer
(MW) Winter (MW)
Year Installed
Two Harbors, City of
Two Harbors Plant
Lake County, MN
Unit 1 Int Comb Oil #2 2.000 2.000 1971
Virginia Dept of Public Utilities
Virginia Power Plant
St. Louis County, MN
Unit 5 Steam Coal/Wood 8.300 8.300 1953
Unit 6 Steam Coal/Wood 18.500 18.500 1971
Wells Public Utilities
Wells Plant
Faribault County, MN
Unit 1 Int Comb Gas/Oil #2
8.400* 8.400*
1953
Unit 2 Int Comb Gas/Oil #2 1957
Unit 3 Int Comb Gas/Oil #2 1950
Unit 4 Int Comb Gas/Oil #2 1966
Unit 5 Int Comb Gas/Oil #2 1975
Westbrook Public Utilities
Westbrook Plant
Cottonwood County, MN
Unit 1 Int Comb Gas/Oil #2 8.400* 8.400*
1953
Unit 2 Int Comb Gas/Oil #2 1957
Willmar Municipal Utilities
Willmar Plant
Kandiyohi County, MN
Unit 2 Steam Gas 7.000 7.000 1952
Unit 3 Steam Coal/Gas 16.000 8.000 1959
Unit 4 Int Comb Oil #2 12.000 12.000 2000
Windom Municipal Utility
Windom Gas Turbine
Cottonwood County, MN
Unit 1 Gas Turbine Oil #2 2.500 3.000 1980
Unit 2 Int Comb Oil #2 1.700 1.800 2001
Unit 3 Int Comb Oil #2 1.700 1.800 2001
Unit 4 Int Comb Oil #2 1.700 1.800 2001
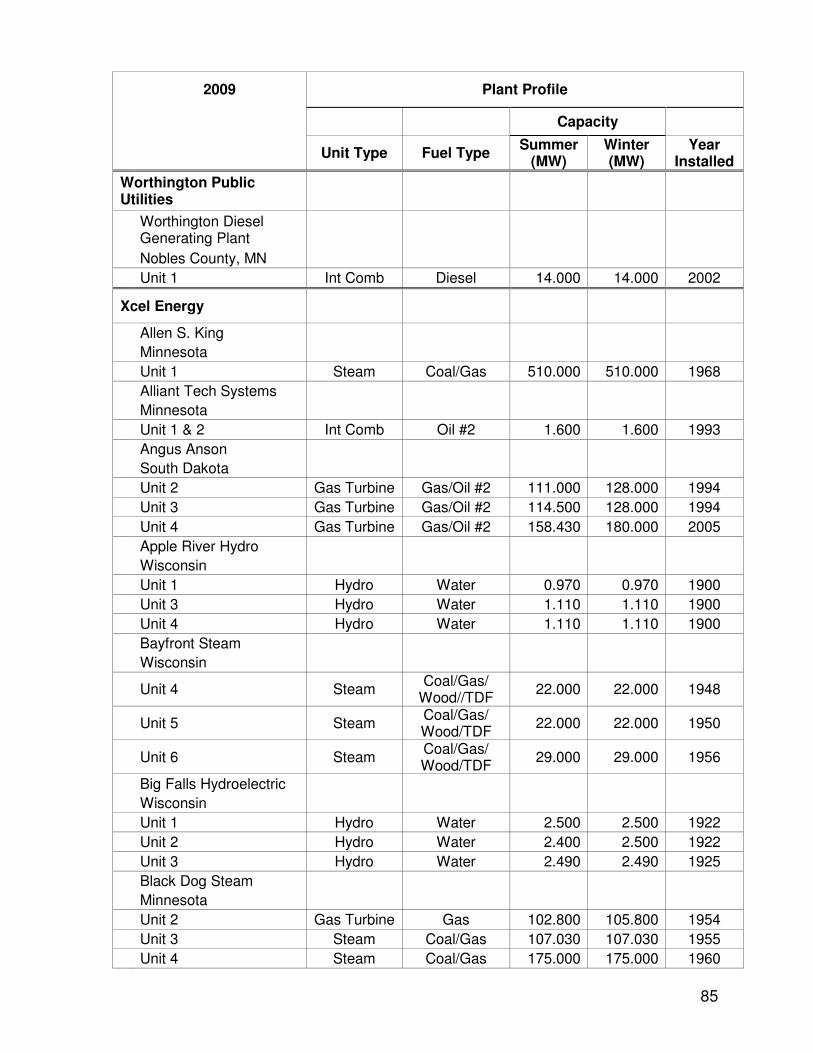
85
2009 Plant Profile
Capacity
Unit Type Fuel Type Summer
(MW) Winter (MW)
Year Installed
Worthington Public Utilities
Worthington Diesel Generating Plant
Nobles County, MN
Unit 1 Int Comb Diesel 14.000 14.000 2002
Xcel Energy
Allen S. King
Minnesota
Unit 1 Steam Coal/Gas 510.000 510.000 1968
Alliant Tech Systems
Minnesota
Unit 1 & 2 Int Comb Oil #2 1.600 1.600 1993
Angus Anson
South Dakota
Unit 2 Gas Turbine Gas/Oil #2 111.000 128.000 1994
Unit 3 Gas Turbine Gas/Oil #2 114.500 128.000 1994
Unit 4 Gas Turbine Gas/Oil #2 158.430 180.000 2005
Apple River Hydro
Wisconsin
Unit 1 Hydro Water 0.970 0.970 1900
Unit 3 Hydro Water 1.110 1.110 1900
Unit 4 Hydro Water 1.110 1.110 1900
Bayfront Steam
Wisconsin
Unit 4 Steam Coal/Gas/
Wood//TDF 22.000 22.000 1948
Unit 5 Steam Coal/Gas/ Wood/TDF
22.000 22.000 1950
Unit 6 Steam Coal/Gas/ Wood/TDF
29.000 29.000 1956
Big Falls Hydroelectric
Wisconsin
Unit 1 Hydro Water 2.500 2.500 1922
Unit 2 Hydro Water 2.400 2.500 1922
Unit 3 Hydro Water 2.490 2.490 1925
Black Dog Steam
Minnesota
Unit 2 Gas Turbine Gas 102.800 105.800 1954
Unit 3 Steam Coal/Gas 107.030 107.030 1955
Unit 4 Steam Coal/Gas 175.000 175.000 1960
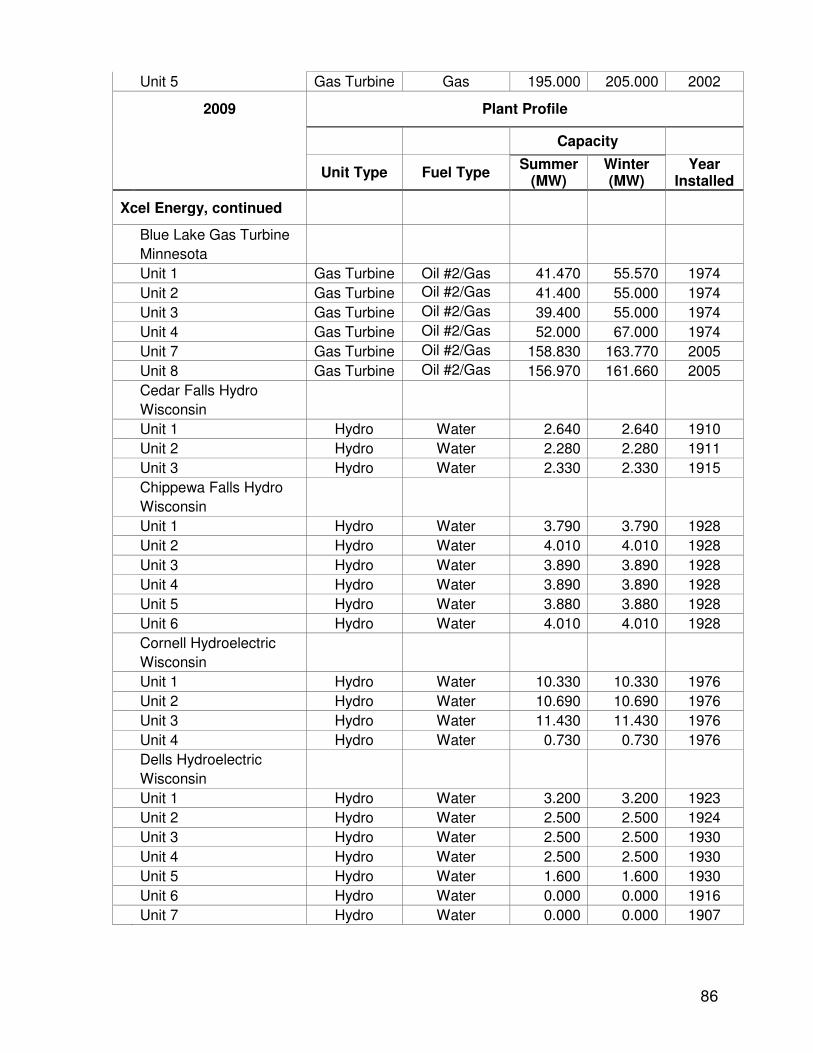
86
Unit 5 Gas Turbine Gas 195.000 205.000 2002
2009 Plant Profile
Capacity
Unit Type Fuel Type Summer
(MW) Winter (MW)
Year Installed
Xcel Energy, continued
Blue Lake Gas Turbine
Minnesota
Unit 1 Gas Turbine Oil #2/Gas 41.470 55.570 1974
Unit 2 Gas Turbine Oil #2/Gas 41.400 55.000 1974
Unit 3 Gas Turbine Oil #2/Gas 39.400 55.000 1974
Unit 4 Gas Turbine Oil #2/Gas 52.000 67.000 1974
Unit 7 Gas Turbine Oil #2/Gas 158.830 163.770 2005
Unit 8 Gas Turbine Oil #2/Gas 156.970 161.660 2005
Cedar Falls Hydro
Wisconsin
Unit 1 Hydro Water 2.640 2.640 1910
Unit 2 Hydro Water 2.280 2.280 1911
Unit 3 Hydro Water 2.330 2.330 1915
Chippewa Falls Hydro
Wisconsin
Unit 1 Hydro Water 3.790 3.790 1928
Unit 2 Hydro Water 4.010 4.010 1928
Unit 3 Hydro Water 3.890 3.890 1928
Unit 4 Hydro Water 3.890 3.890 1928
Unit 5 Hydro Water 3.880 3.880 1928
Unit 6 Hydro Water 4.010 4.010 1928
Cornell Hydroelectric
Wisconsin
Unit 1 Hydro Water 10.330 10.330 1976
Unit 2 Hydro Water 10.690 10.690 1976
Unit 3 Hydro Water 11.430 11.430 1976
Unit 4 Hydro Water 0.730 0.730 1976
Dells Hydroelectric
Wisconsin
Unit 1 Hydro Water 3.200 3.200 1923
Unit 2 Hydro Water 2.500 2.500 1924
Unit 3 Hydro Water 2.500 2.500 1930
Unit 4 Hydro Water 2.500 2.500 1930
Unit 5 Hydro Water 1.600 1.600 1930
Unit 6 Hydro Water 0.000 0.000 1916
Unit 7 Hydro Water 0.000 0.000 1907
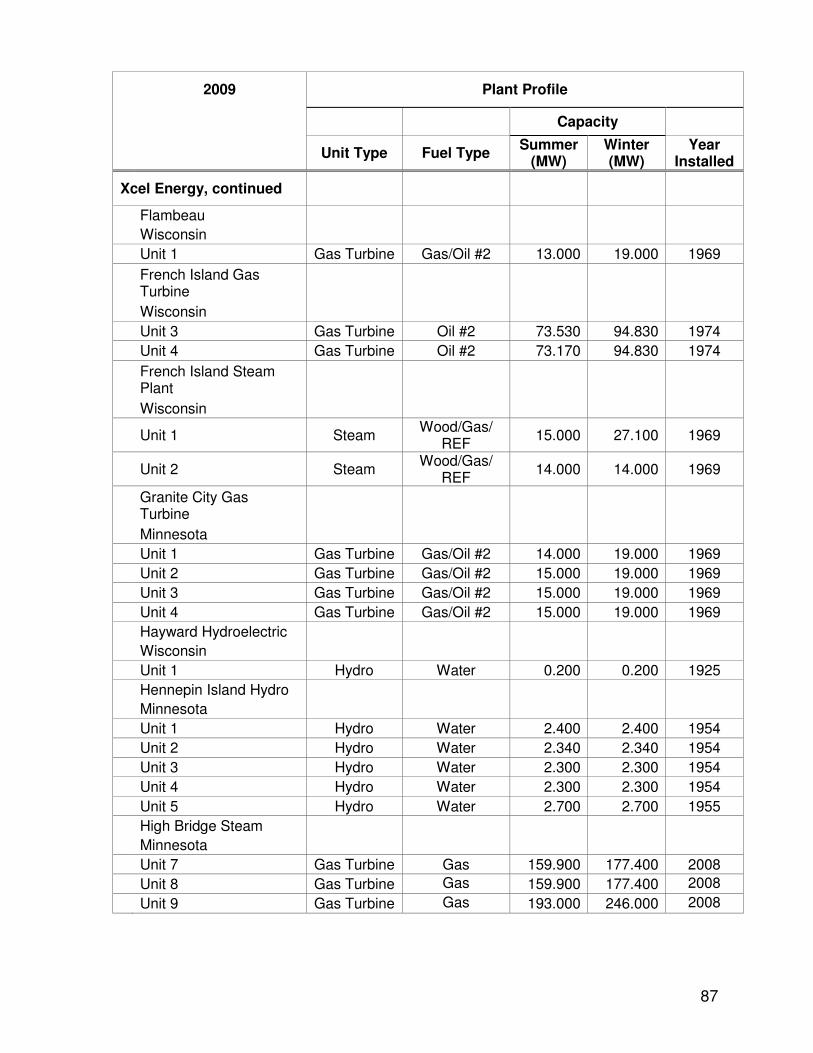
87
2009 Plant Profile
Capacity
Unit Type Fuel Type Summer
(MW) Winter (MW)
Year Installed
Xcel Energy, continued
Flambeau
Wisconsin
Unit 1 Gas Turbine Gas/Oil #2 13.000 19.000 1969
French Island Gas Turbine
Wisconsin
Unit 3 Gas Turbine Oil #2 73.530 94.830 1974
Unit 4 Gas Turbine Oil #2 73.170 94.830 1974
French Island Steam Plant
Wisconsin
Unit 1 Steam Wood/Gas/
REF 15.000 27.100 1969
Unit 2 Steam Wood/Gas/
REF 14.000 14.000 1969
Granite City Gas Turbine
Minnesota
Unit 1 Gas Turbine Gas/Oil #2 14.000 19.000 1969
Unit 2 Gas Turbine Gas/Oil #2 15.000 19.000 1969
Unit 3 Gas Turbine Gas/Oil #2 15.000 19.000 1969
Unit 4 Gas Turbine Gas/Oil #2 15.000 19.000 1969
Hayward Hydroelectric
Wisconsin
Unit 1 Hydro Water 0.200 0.200 1925
Hennepin Island Hydro
Minnesota
Unit 1 Hydro Water 2.400 2.400 1954
Unit 2 Hydro Water 2.340 2.340 1954
Unit 3 Hydro Water 2.300 2.300 1954
Unit 4 Hydro Water 2.300 2.300 1954
Unit 5 Hydro Water 2.700 2.700 1955
High Bridge Steam
Minnesota
Unit 7 Gas Turbine Gas 159.900 177.400 2008
Unit 8 Gas Turbine Gas 159.900 177.400 2008
Unit 9 Gas Turbine Gas 193.000 246.000 2008
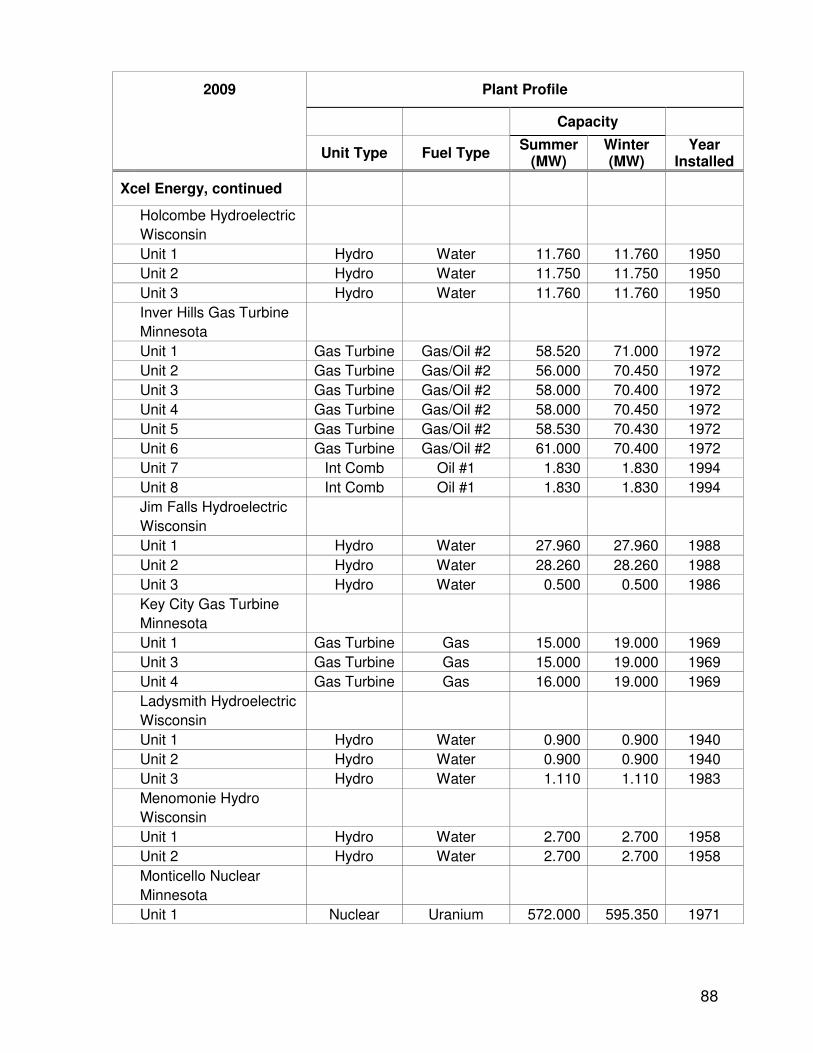
88
2009 Plant Profile
Capacity
Unit Type Fuel Type Summer
(MW) Winter (MW)
Year Installed
Xcel Energy, continued
Holcombe Hydroelectric
Wisconsin
Unit 1 Hydro Water 11.760 11.760 1950
Unit 2 Hydro Water 11.750 11.750 1950
Unit 3 Hydro Water 11.760 11.760 1950
Inver Hills Gas Turbine
Minnesota
Unit 1 Gas Turbine Gas/Oil #2 58.520 71.000 1972
Unit 2 Gas Turbine Gas/Oil #2 56.000 70.450 1972
Unit 3 Gas Turbine Gas/Oil #2 58.000 70.400 1972
Unit 4 Gas Turbine Gas/Oil #2 58.000 70.450 1972
Unit 5 Gas Turbine Gas/Oil #2 58.530 70.430 1972
Unit 6 Gas Turbine Gas/Oil #2 61.000 70.400 1972
Unit 7 Int Comb Oil #1 1.830 1.830 1994
Unit 8 Int Comb Oil #1 1.830 1.830 1994
Jim Falls Hydroelectric
Wisconsin
Unit 1 Hydro Water 27.960 27.960 1988
Unit 2 Hydro Water 28.260 28.260 1988
Unit 3 Hydro Water 0.500 0.500 1986
Key City Gas Turbine
Minnesota
Unit 1 Gas Turbine Gas 15.000 19.000 1969
Unit 3 Gas Turbine Gas 15.000 19.000 1969
Unit 4 Gas Turbine Gas 16.000 19.000 1969
Ladysmith Hydroelectric
Wisconsin
Unit 1 Hydro Water 0.900 0.900 1940
Unit 2 Hydro Water 0.900 0.900 1940
Unit 3 Hydro Water 1.110 1.110 1983
Menomonie Hydro
Wisconsin
Unit 1 Hydro Water 2.700 2.700 1958
Unit 2 Hydro Water 2.700 2.700 1958
Monticello Nuclear
Minnesota
Unit 1 Nuclear Uranium 572.000 595.350 1971
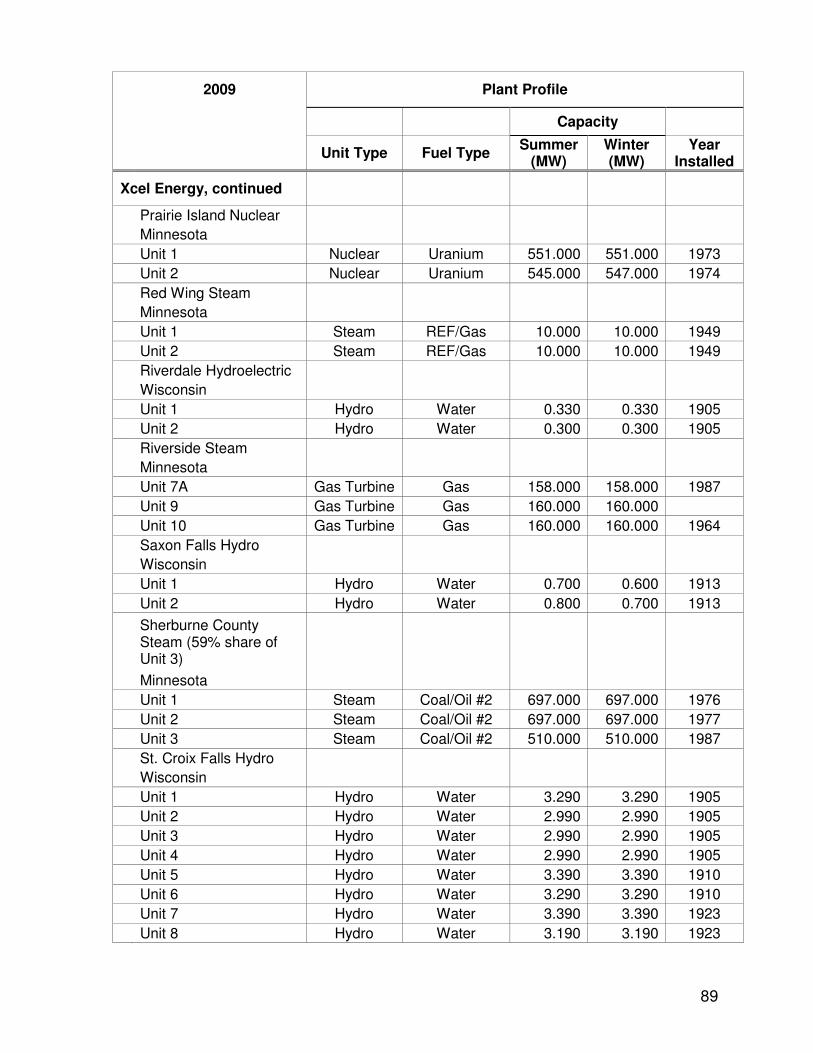
89
2009 Plant Profile
Capacity
Unit Type Fuel Type Summer
(MW) Winter (MW)
Year Installed
Xcel Energy, continued
Prairie Island Nuclear
Minnesota
Unit 1 Nuclear Uranium 551.000 551.000 1973
Unit 2 Nuclear Uranium 545.000 547.000 1974
Red Wing Steam
Minnesota
Unit 1 Steam REF/Gas 10.000 10.000 1949
Unit 2 Steam REF/Gas 10.000 10.000 1949
Riverdale Hydroelectric
Wisconsin
Unit 1 Hydro Water 0.330 0.330 1905
Unit 2 Hydro Water 0.300 0.300 1905
Riverside Steam
Minnesota
Unit 7A Gas Turbine Gas 158.000 158.000 1987
Unit 9 Gas Turbine Gas 160.000 160.000
Unit 10 Gas Turbine Gas 160.000 160.000 1964
Saxon Falls Hydro
Wisconsin
Unit 1 Hydro Water 0.700 0.600 1913
Unit 2 Hydro Water 0.800 0.700 1913
Sherburne County Steam (59% share of Unit 3)
Minnesota
Unit 1 Steam Coal/Oil #2 697.000 697.000 1976
Unit 2 Steam Coal/Oil #2 697.000 697.000 1977
Unit 3 Steam Coal/Oil #2 510.000 510.000 1987
St. Croix Falls Hydro
Wisconsin
Unit 1 Hydro Water 3.290 3.290 1905
Unit 2 Hydro Water 2.990 2.990 1905
Unit 3 Hydro Water 2.990 2.990 1905
Unit 4 Hydro Water 2.990 2.990 1905
Unit 5 Hydro Water 3.390 3.390 1910
Unit 6 Hydro Water 3.290 3.290 1910
Unit 7 Hydro Water 3.390 3.390 1923
Unit 8 Hydro Water 3.190 3.190 1923
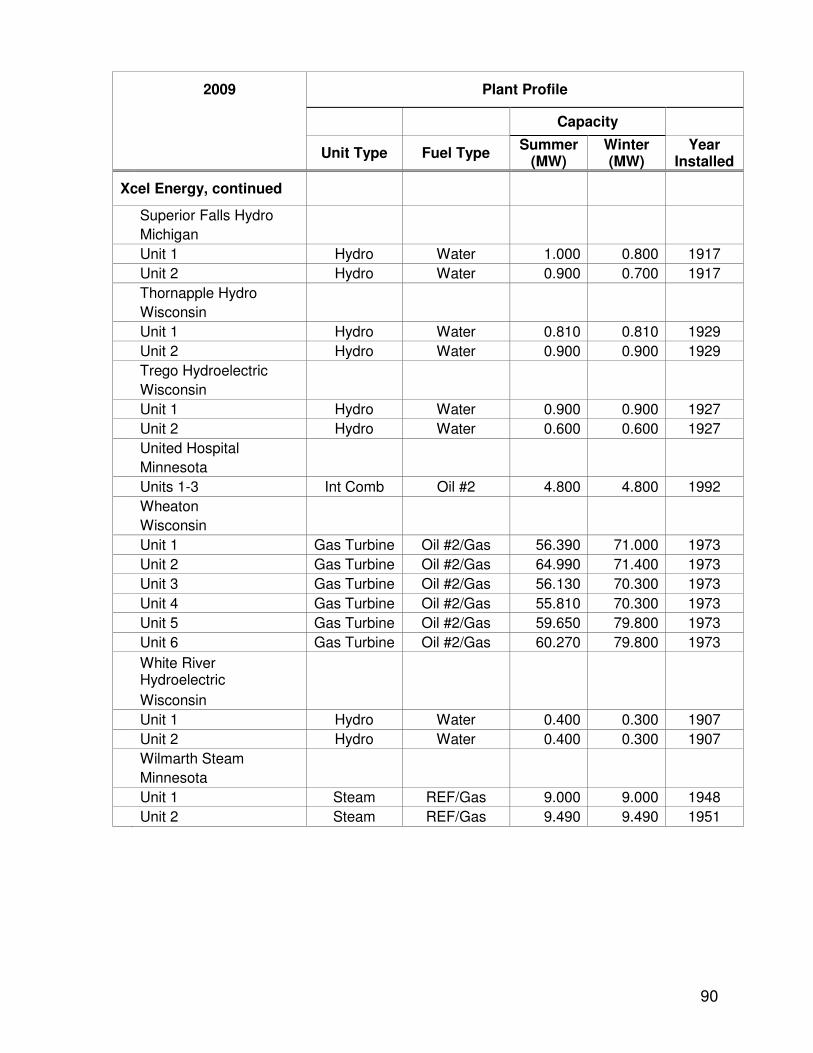
90
2009 Plant Profile
Capacity
Unit Type Fuel Type Summer
(MW) Winter (MW)
Year Installed
Xcel Energy, continued
Superior Falls Hydro
Michigan
Unit 1 Hydro Water 1.000 0.800 1917
Unit 2 Hydro Water 0.900 0.700 1917
Thornapple Hydro
Wisconsin
Unit 1 Hydro Water 0.810 0.810 1929
Unit 2 Hydro Water 0.900 0.900 1929
Trego Hydroelectric
Wisconsin
Unit 1 Hydro Water 0.900 0.900 1927
Unit 2 Hydro Water 0.600 0.600 1927
United Hospital
Minnesota
Units 1-3 Int Comb Oil #2 4.800 4.800 1992
Wheaton
Wisconsin
Unit 1 Gas Turbine Oil #2/Gas 56.390 71.000 1973
Unit 2 Gas Turbine Oil #2/Gas 64.990 71.400 1973
Unit 3 Gas Turbine Oil #2/Gas 56.130 70.300 1973
Unit 4 Gas Turbine Oil #2/Gas 55.810 70.300 1973
Unit 5 Gas Turbine Oil #2/Gas 59.650 79.800 1973
Unit 6 Gas Turbine Oil #2/Gas 60.270 79.800 1973
White River Hydroelectric
Wisconsin
Unit 1 Hydro Water 0.400 0.300 1907
Unit 2 Hydro Water 0.400 0.300 1907
Wilmarth Steam
Minnesota
Unit 1 Steam REF/Gas 9.000 9.000 1948
Unit 2 Steam REF/Gas 9.490 9.490 1951
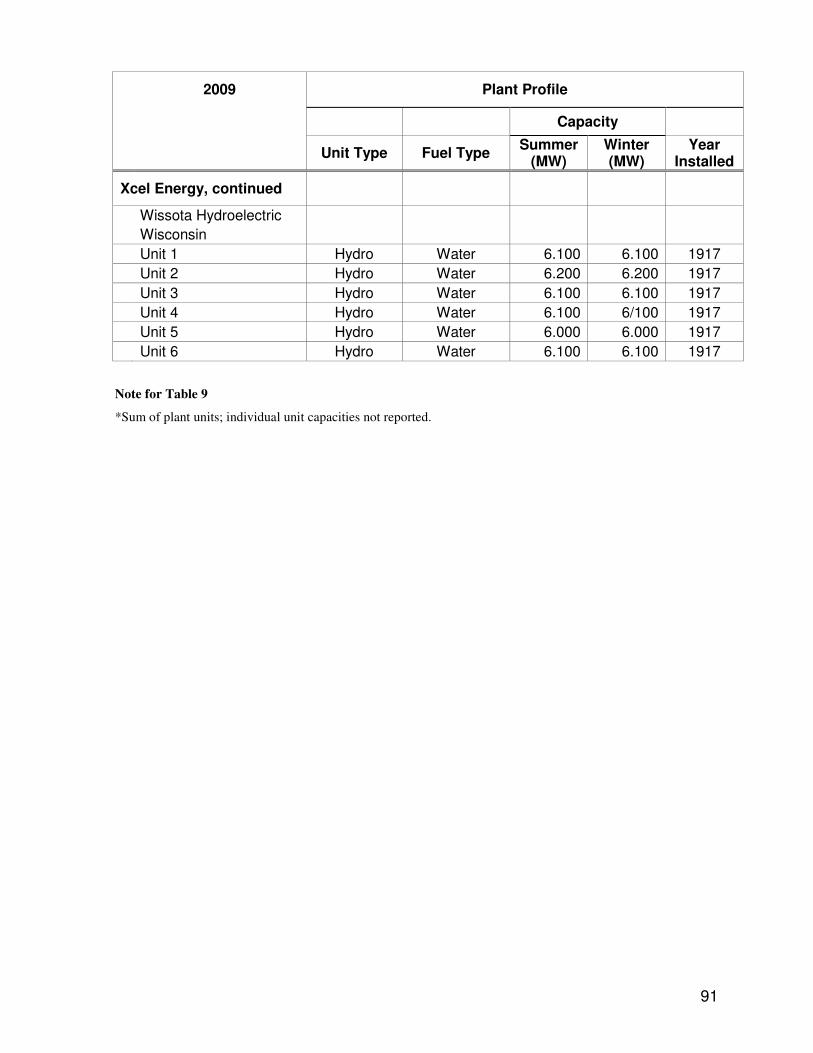
91
2009 Plant Profile
Capacity
Unit Type Fuel Type Summer
(MW) Winter (MW)
Year Installed
Xcel Energy, continued
Wissota Hydroelectric
Wisconsin
Unit 1 Hydro Water 6.100 6.100 1917
Unit 2 Hydro Water 6.200 6.200 1917
Unit 3 Hydro Water 6.100 6.100 1917
Unit 4 Hydro Water 6.100 6/100 1917
Unit 5 Hydro Water 6.000 6.000 1917
Unit 6 Hydro Water 6.100 6.100 1917
Note for Table 9
*Sum of plant units; individual unit capacities not reported.
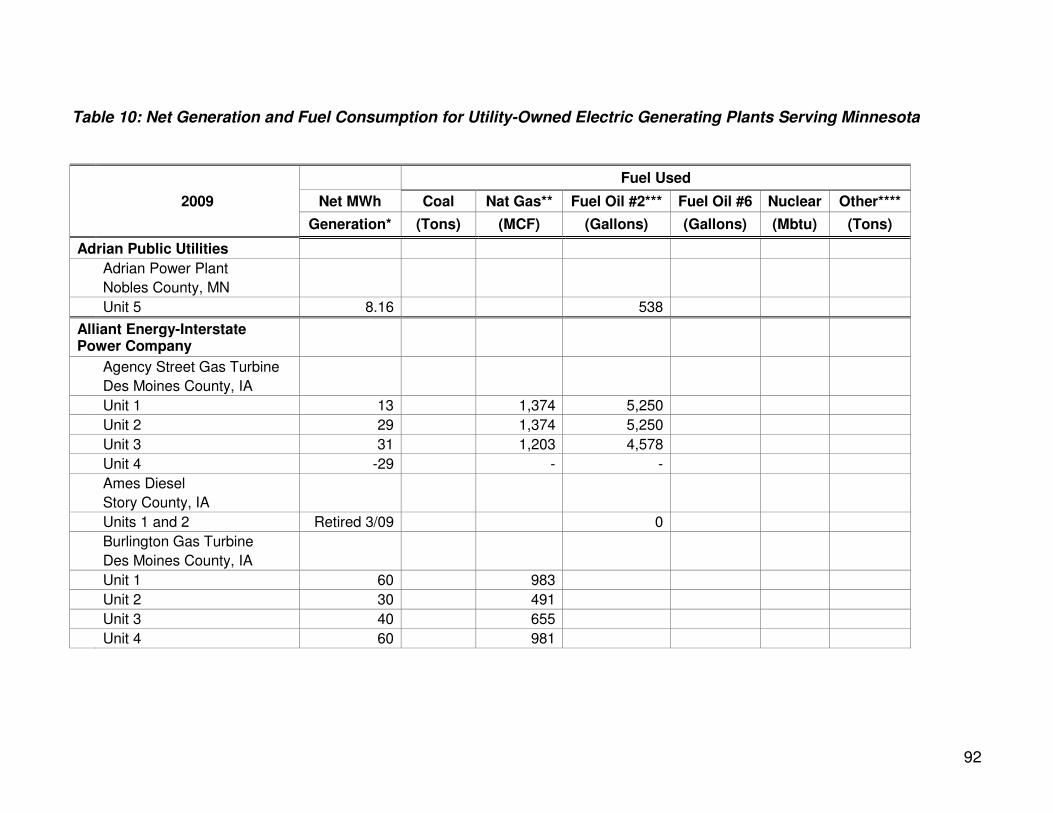
92
Table 10: Net Generation and Fuel Consumption for Utility-Owned Electric Generating Plants Serving Minnesota
Fuel Used
2009 Net MWh Coal Nat Gas** Fuel Oil #2*** Fuel Oil #6 Nuclear Other****
Generation* (Tons) (MCF) (Gallons) (Gallons) (Mbtu) (Tons)
Adrian Public Utilities
Adrian Power Plant
Nobles County, MN
Unit 5 8.16 538
Alliant Energy-Interstate Power Company
Agency Street Gas Turbine
Des Moines County, IA
Unit 1 13 1,374 5,250
Unit 2 29 1,374 5,250
Unit 3 31 1,203 4,578
Unit 4 -29 - -
Ames Diesel
Story County, IA
Units 1 and 2 Retired 3/09 0
Burlington Gas Turbine
Des Moines County, IA
Unit 1 60 983
Unit 2 30 491
Unit 3 40 655
Unit 4 60 981

93
Fuel Used
2009 Net MWh Coal Nat Gas** Fuel Oil #2*** Fuel Oil #6 Nuclear Other****
Generation* (Tons) (MCF) (Gallons) (Gallons) (Mbtu) (Tons)
Alliant Energy-Interstate Power Company, continued
Burlington Steam
Des Moines County, IA
Unit 1 1,204,606 764,034 18,666
Centerville Diesel
Appanoose County, IA
Units 1 – 3 -213 1,470
Centerville Gas Turbine
Appanoose County, IA
Units 1 – 2 -551 20,454
Dubuque Internal Combustion
Dubuque County, IA
Unit 1 -40 2,142
Unit 2 -39 2,226
Dubuque Steam
Dubuque County, IA
Unit 2 152 587 8,850 0
Unit 3 56,125 45,347 16,175 4,368
Unit 4 78,265 60,930 75,066
Emery
Cerro Gordo County, IA
Unit 1 208,257 2,564,589 10,920
Unit 2 151,857 1,870,115 7,980
Unit 3 (Combined Cycle) 224,822
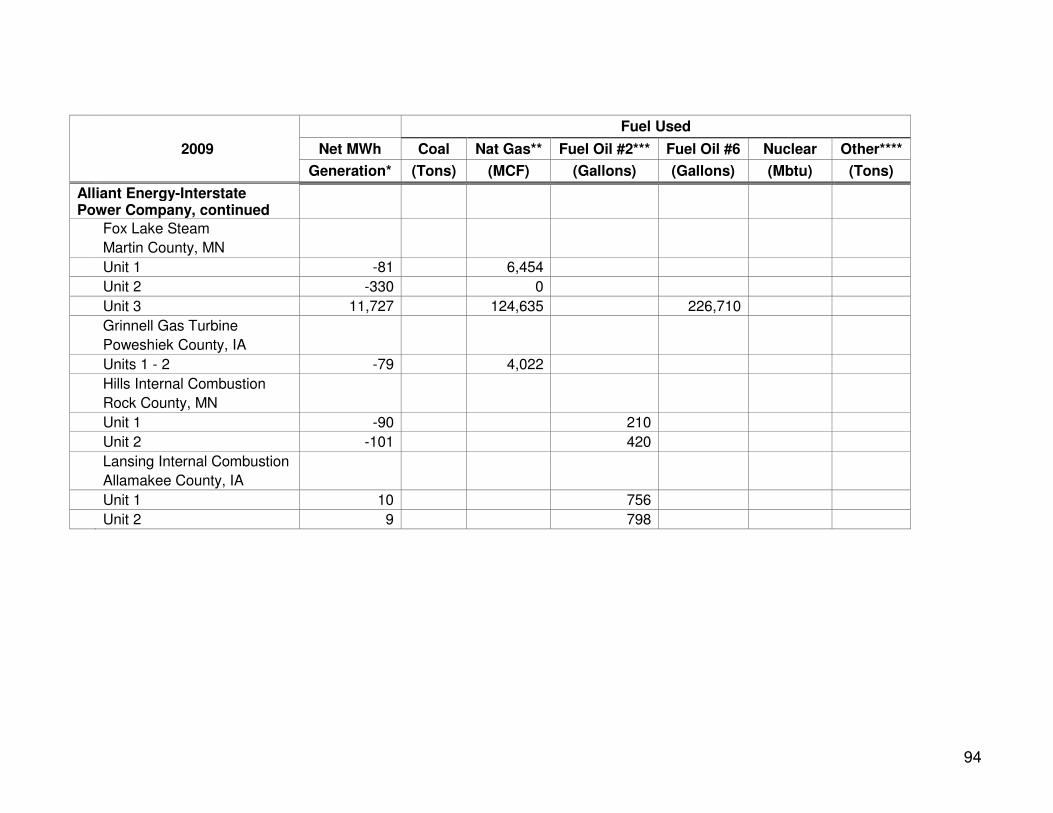
94
Fuel Used
2009 Net MWh Coal Nat Gas** Fuel Oil #2*** Fuel Oil #6 Nuclear Other****
Generation* (Tons) (MCF) (Gallons) (Gallons) (Mbtu) (Tons)
Alliant Energy-Interstate Power Company, continued
Fox Lake Steam
Martin County, MN
Unit 1 -81 6,454
Unit 2 -330 0
Unit 3 11,727 124,635 226,710
Grinnell Gas Turbine
Poweshiek County, IA
Units 1 - 2 -79 4,022
Hills Internal Combustion
Rock County, MN
Unit 1 -90 210
Unit 2 -101 420
Lansing Internal Combustion
Allamakee County, IA
Unit 1 10 756
Unit 2 9 798
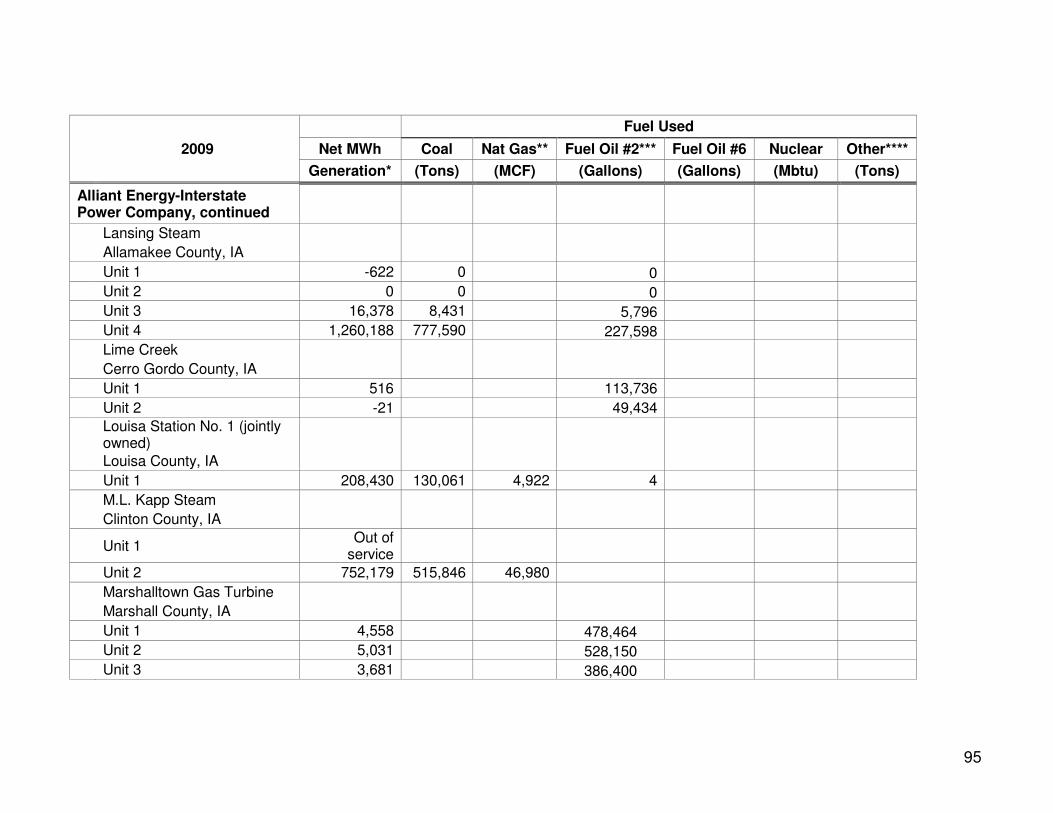
95
Fuel Used
2009 Net MWh Coal Nat Gas** Fuel Oil #2*** Fuel Oil #6 Nuclear Other****
Generation* (Tons) (MCF) (Gallons) (Gallons) (Mbtu) (Tons)
Alliant Energy-Interstate Power Company, continued
Lansing Steam
Allamakee County, IA
Unit 1 -622 0 0
Unit 2 0 0 0
Unit 3 16,378 8,431 5,796
Unit 4 1,260,188 777,590 227,598
Lime Creek
Cerro Gordo County, IA
Unit 1 516 113,736
Unit 2 -21 49,434
Louisa Station No. 1 (jointly owned)
Louisa County, IA
Unit 1 208,430 130,061 4,922 4
M.L. Kapp Steam
Clinton County, IA
Unit 1 Out of
service
Unit 2 752,179 515,846 46,980
Marshalltown Gas Turbine
Marshall County, IA
Unit 1 4,558 478,464
Unit 2 5,031 528,150
Unit 3 3,681 386,400

96
Fuel Used
2009 Net MWh Coal Nat Gas** Fuel Oil #2*** Fuel Oil #6 Nuclear Other****
Generation* (Tons) (MCF) (Gallons) (Gallons) (Mbtu) (Tons)
Alliant Energy-Interstate Power Company, continued
Montgomery Gas Turbine
LeSueur County, MN
Unit 1 -21 16,254
Neal No. 3
Woodbury County, IA
Unit 1 1,111,531 673,747 16,007
Neal No. 4 (jointly owned)
Woodbury County, IA
Unit 4 1,135,980 690,040 115,836
Ottumwa Generating Station
Wappello County, IA
Unit 1 1,886,750 1,201,971 246,246
Prairie Creek
Linn County, IA
Unit 1A 34,921 19,664 24,005
Unit 2 0 27,427 29,366 0
Unit 3 14,871 8,190 74,484 0
Unit 4 -5,437 3,754 126,564 0
Red Cedar
Linn County, IA
Unit 1 -144 10,675
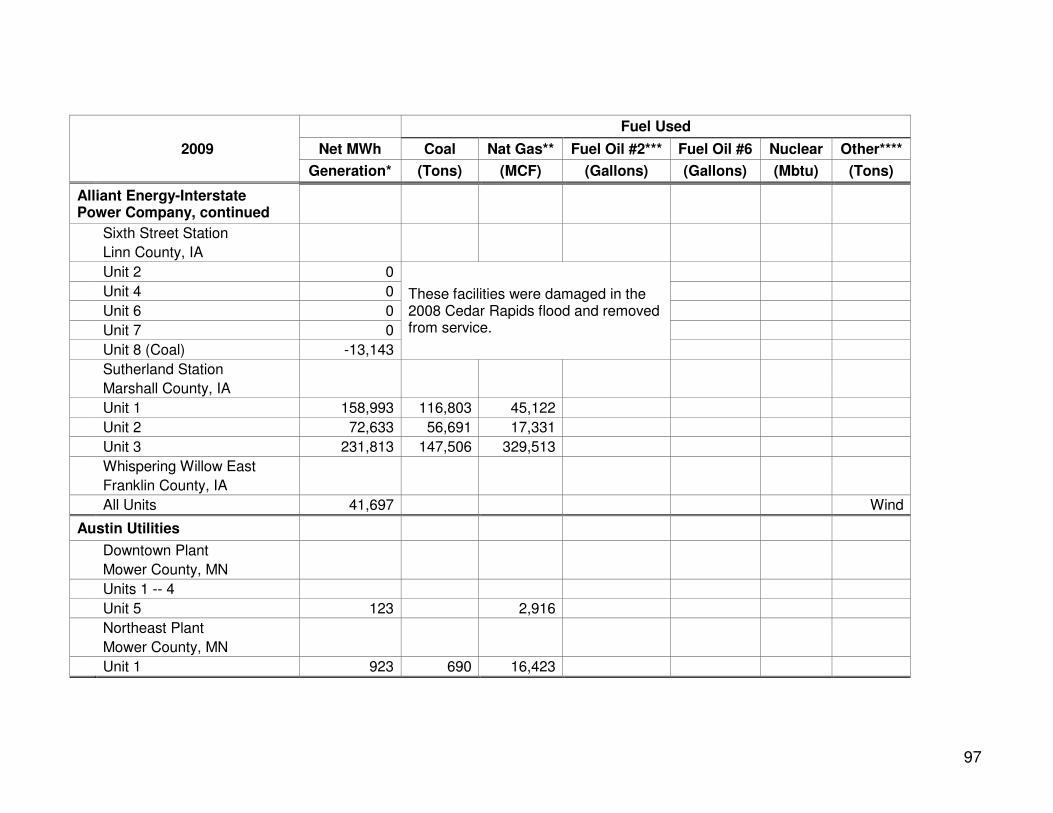
97
Fuel Used
2009 Net MWh Coal Nat Gas** Fuel Oil #2*** Fuel Oil #6 Nuclear Other****
Generation* (Tons) (MCF) (Gallons) (Gallons) (Mbtu) (Tons)
Alliant Energy-Interstate Power Company, continued
Sixth Street Station
Linn County, IA
Unit 2 0
These facilities were damaged in the 2008 Cedar Rapids flood and removed from service.
Unit 4 0
Unit 6 0
Unit 7 0
Unit 8 (Coal) -13,143
Sutherland Station
Marshall County, IA
Unit 1 158,993 116,803 45,122
Unit 2 72,633 56,691 17,331
Unit 3 231,813 147,506 329,513
Whispering Willow East
Franklin County, IA
All Units 41,697 Wind
Austin Utilities
Downtown Plant
Mower County, MN
Units 1 -- 4
Unit 5 123 2,916
Northeast Plant
Mower County, MN
Unit 1 923 690 16,423
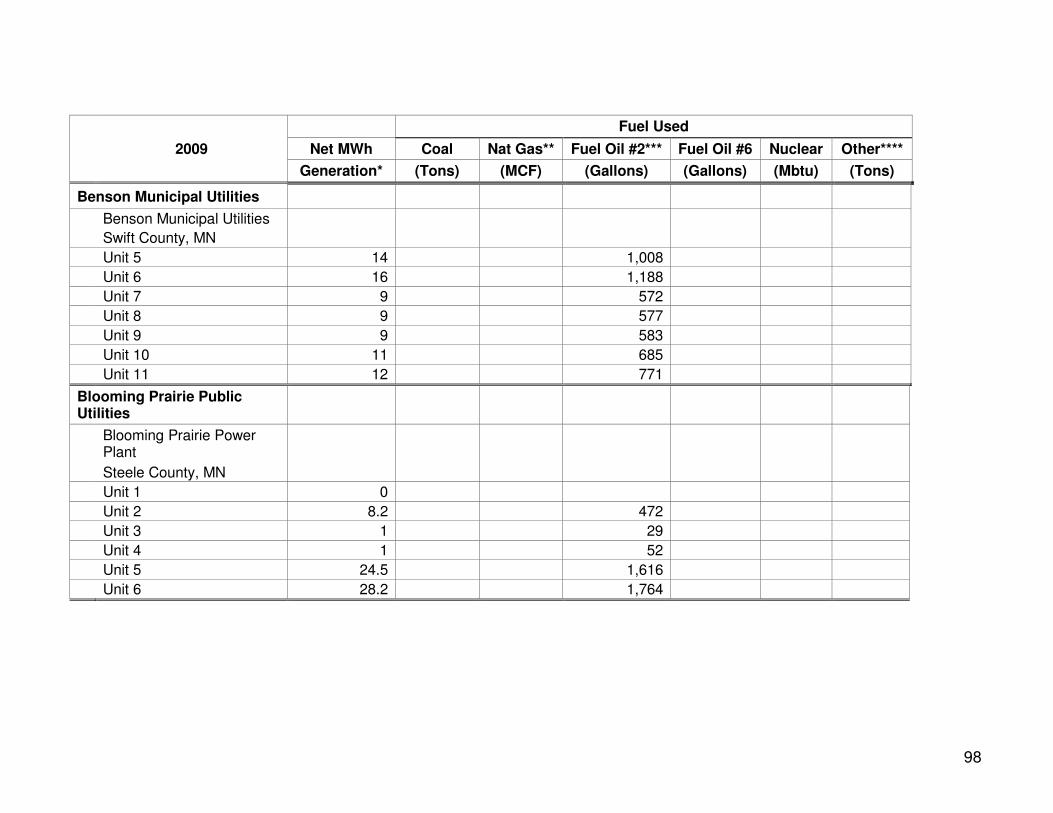
98
Fuel Used
2009 Net MWh Coal Nat Gas** Fuel Oil #2*** Fuel Oil #6 Nuclear Other****
Generation* (Tons) (MCF) (Gallons) (Gallons) (Mbtu) (Tons)
Benson Municipal Utilities
Benson Municipal Utilities
Swift County, MN
Unit 5 14 1,008
Unit 6 16 1,188
Unit 7 9 572
Unit 8 9 577
Unit 9 9 583
Unit 10 11 685
Unit 11 12 771
Blooming Prairie Public Utilities
Blooming Prairie Power Plant
Steele County, MN
Unit 1 0
Unit 2 8.2 472
Unit 3 1 29
Unit 4 1 52
Unit 5 24.5 1,616
Unit 6 28.2 1,764
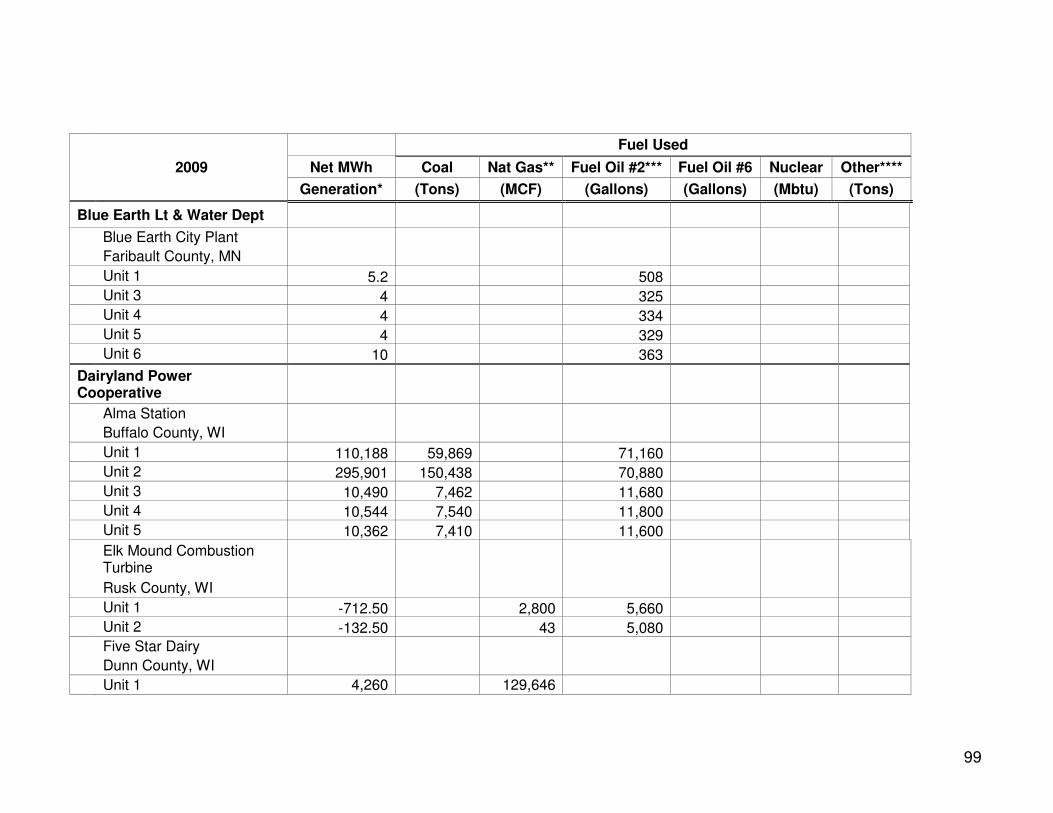
99
Fuel Used
2009 Net MWh Coal Nat Gas** Fuel Oil #2*** Fuel Oil #6 Nuclear Other****
Generation* (Tons) (MCF) (Gallons) (Gallons) (Mbtu) (Tons)
Blue Earth Lt & Water Dept
Blue Earth City Plant
Faribault County, MN
Unit 1 5.2 508
Unit 3 4 325
Unit 4 4 334
Unit 5 4 329
Unit 6 10 363
Dairyland Power Cooperative
Alma Station
Buffalo County, WI
Unit 1 110,188 59,869 71,160
Unit 2 295,901 150,438 70,880
Unit 3 10,490 7,462 11,680
Unit 4 10,544 7,540 11,800
Unit 5 10,362 7,410 11,600
Elk Mound Combustion Turbine
Rusk County, WI
Unit 1 -712.50 2,800 5,660
Unit 2 -132.50 43 5,080
Five Star Dairy
Dunn County, WI
Unit 1 4,260 129,646
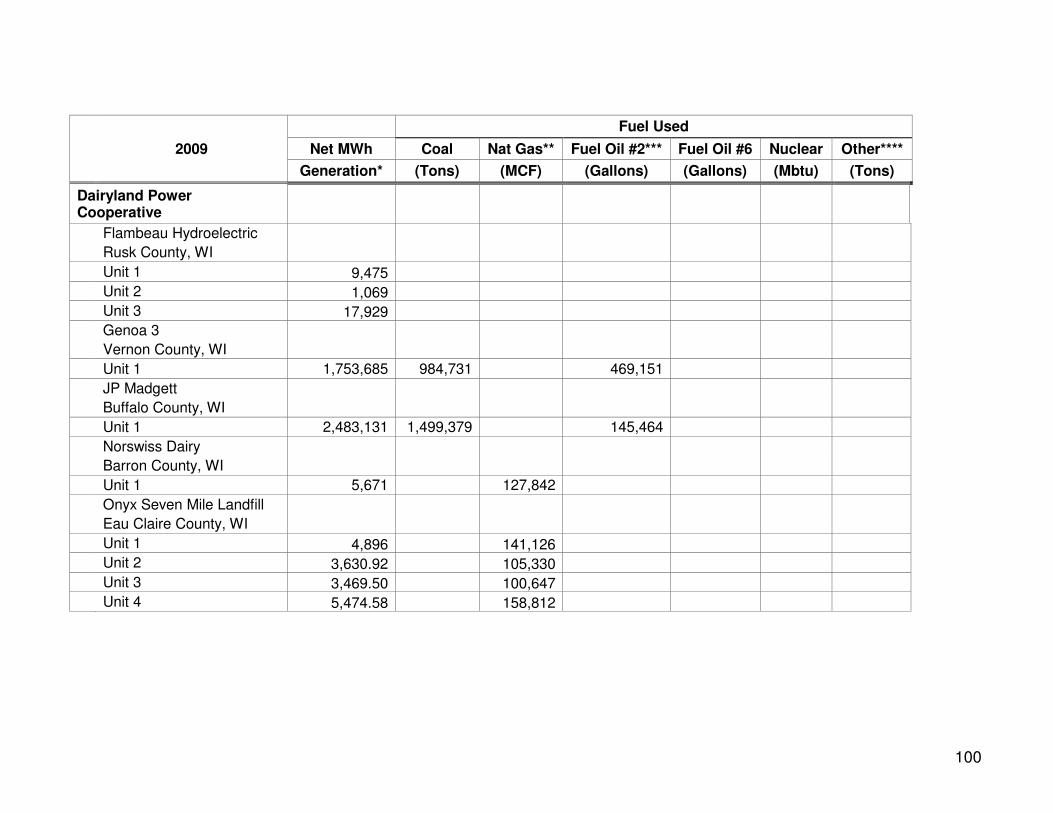
100
Fuel Used
2009 Net MWh Coal Nat Gas** Fuel Oil #2*** Fuel Oil #6 Nuclear Other****
Generation* (Tons) (MCF) (Gallons) (Gallons) (Mbtu) (Tons)
Dairyland Power Cooperative
Flambeau Hydroelectric
Rusk County, WI
Unit 1 9,475
Unit 2 1,069
Unit 3 17,929
Genoa 3
Vernon County, WI
Unit 1 1,753,685 984,731 469,151
JP Madgett
Buffalo County, WI
Unit 1 2,483,131 1,499,379 145,464
Norswiss Dairy
Barron County, WI
Unit 1 5,671 127,842
Onyx Seven Mile Landfill
Eau Claire County, WI
Unit 1 4,896 141,126
Unit 2 3,630.92 105,330
Unit 3 3,469.50 100,647
Unit 4 5,474.58 158,812
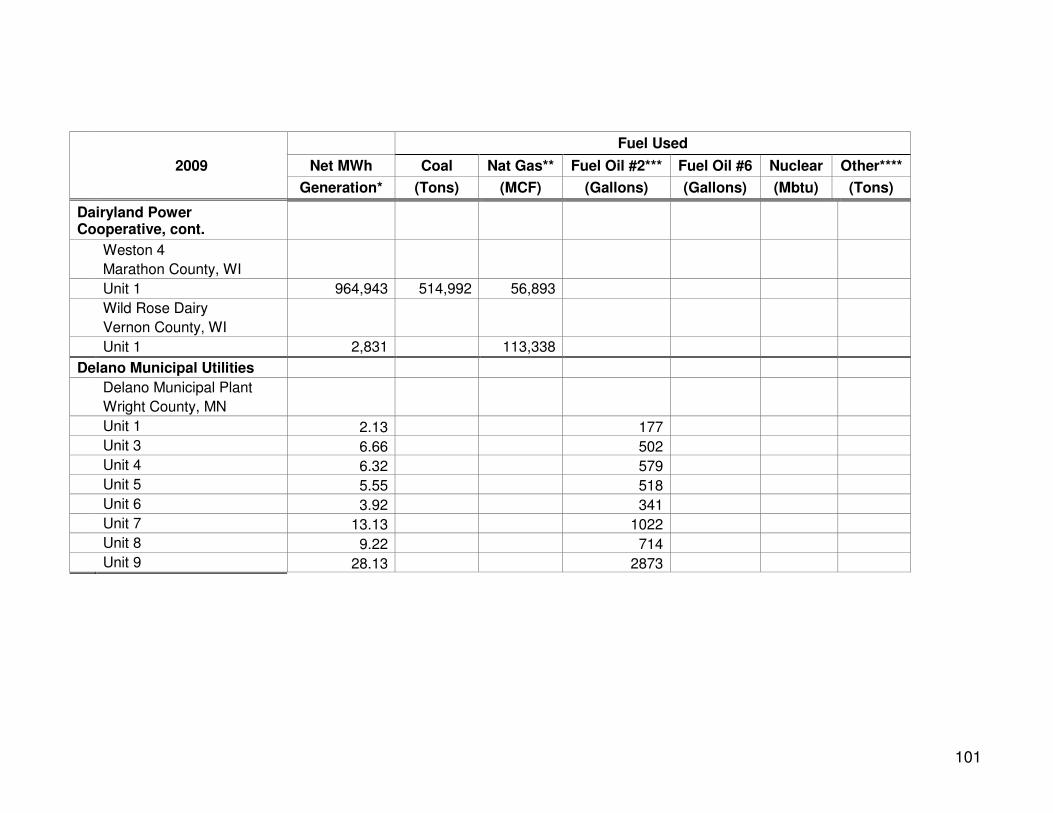
101
Fuel Used
2009 Net MWh Coal Nat Gas** Fuel Oil #2*** Fuel Oil #6 Nuclear Other****
Generation* (Tons) (MCF) (Gallons) (Gallons) (Mbtu) (Tons)
Dairyland Power Cooperative, cont.
Weston 4
Marathon County, WI
Unit 1 964,943 514,992 56,893
Wild Rose Dairy
Vernon County, WI
Unit 1 2,831 113,338
Delano Municipal Utilities
Delano Municipal Plant
Wright County, MN
Unit 1 2.13 177
Unit 3 6.66 502
Unit 4 6.32 579
Unit 5 5.55 518
Unit 6 3.92 341
Unit 7 13.13 1022
Unit 8 9.22 714
Unit 9 28.13 2873

102
Fuel Used
2009 Net MWh Coal Nat Gas** Fuel Oil #2*** Fuel Oil #6 Nuclear Other****
Generation* (Tons) (MCF) (Gallons) (Gallons) (Mbtu) (Tons)
East Grand Forks Water and Light Department
Distribution Service Center
Polk County, MN
Unit 1 7 535.84
Water Treatment Plant
Polk County, MN
Unit 1 13 891
Elk River Municipal Utilities
Elk River Muni Diesel Plant
Sherburne County, MN
Unit 1
Unit 2
Unit 3
Unit 4
Fairfax Municipal
Fairfax Muni Power Plant
Renville County, MN
Unit 2A 0 50
Fairmont Public Utilities
Fairmont Power Plant
Martin County, MN
Units 3-5 0
Unit 6 380 2,738 5,238
Unit 7 371 2,620 5,088
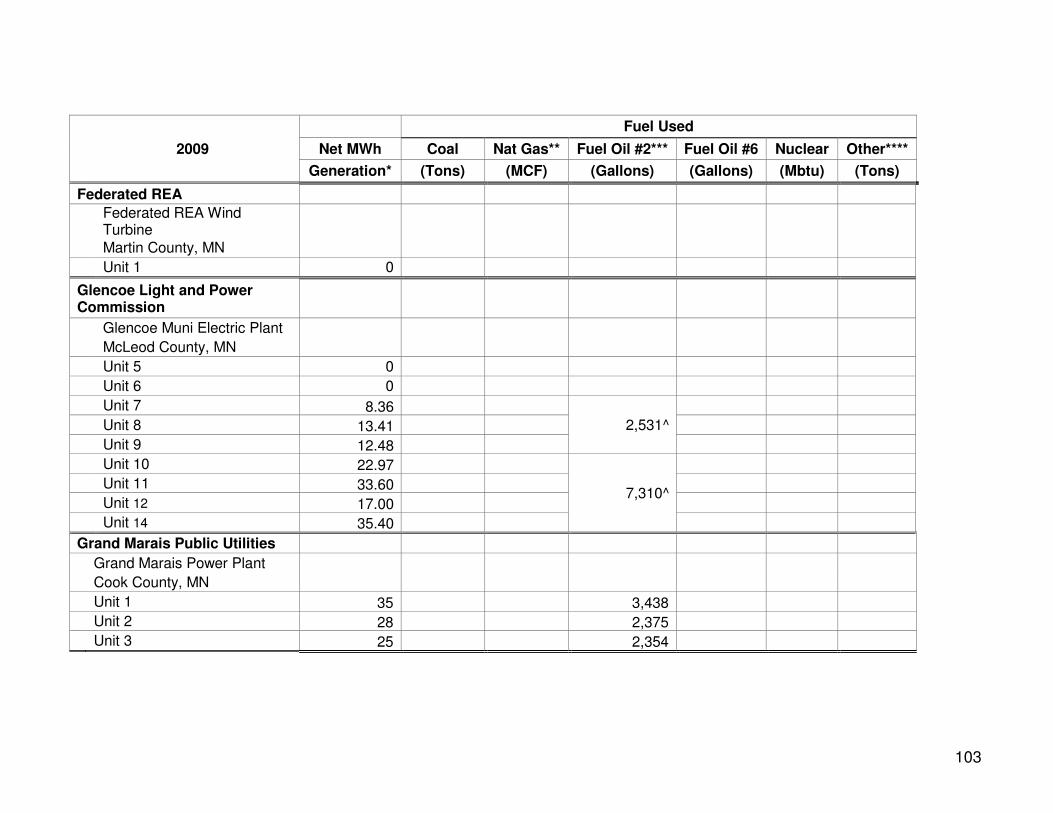
103
Fuel Used
2009 Net MWh Coal Nat Gas** Fuel Oil #2*** Fuel Oil #6 Nuclear Other****
Generation* (Tons) (MCF) (Gallons) (Gallons) (Mbtu) (Tons)
Federated REA
Federated REA Wind Turbine
Martin County, MN
Unit 1 0
Glencoe Light and Power Commission
Glencoe Muni Electric Plant
McLeod County, MN
Unit 5 0
Unit 6 0
Unit 7 8.36
2,531^
Unit 8 13.41
Unit 9 12.48
Unit 10 22.97
7,310^
Unit 11 33.60
Unit 12 17.00
Unit 14 35.40
Grand Marais Public Utilities
Grand Marais Power Plant
Cook County, MN
Unit 1 35 3,438
Unit 2 28 2,375
Unit 3 25 2,354
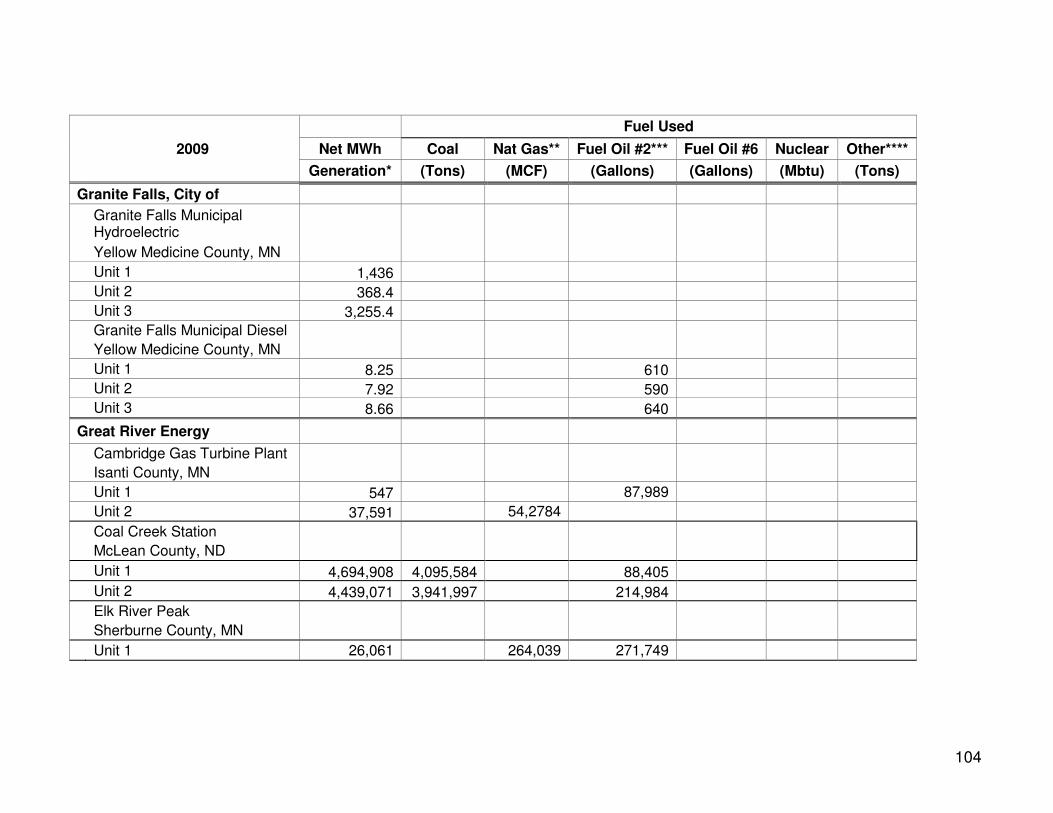
104
Fuel Used
2009 Net MWh Coal Nat Gas** Fuel Oil #2*** Fuel Oil #6 Nuclear Other****
Generation* (Tons) (MCF) (Gallons) (Gallons) (Mbtu) (Tons)
Granite Falls, City of
Granite Falls Municipal Hydroelectric
Yellow Medicine County, MN
Unit 1 1,436
Unit 2 368.4
Unit 3 3,255.4
Granite Falls Municipal Diesel
Yellow Medicine County, MN
Unit 1 8.25 610
Unit 2 7.92 590
Unit 3 8.66 640
Great River Energy
Cambridge Gas Turbine Plant
Isanti County, MN
Unit 1 547 87,989
Unit 2 37,591 54,2784
Coal Creek Station
McLean County, ND
Unit 1 4,694,908 4,095,584 88,405
Unit 2 4,439,071 3,941,997 214,984
Elk River Peak
Sherburne County, MN
Unit 1 26,061 264,039 271,749
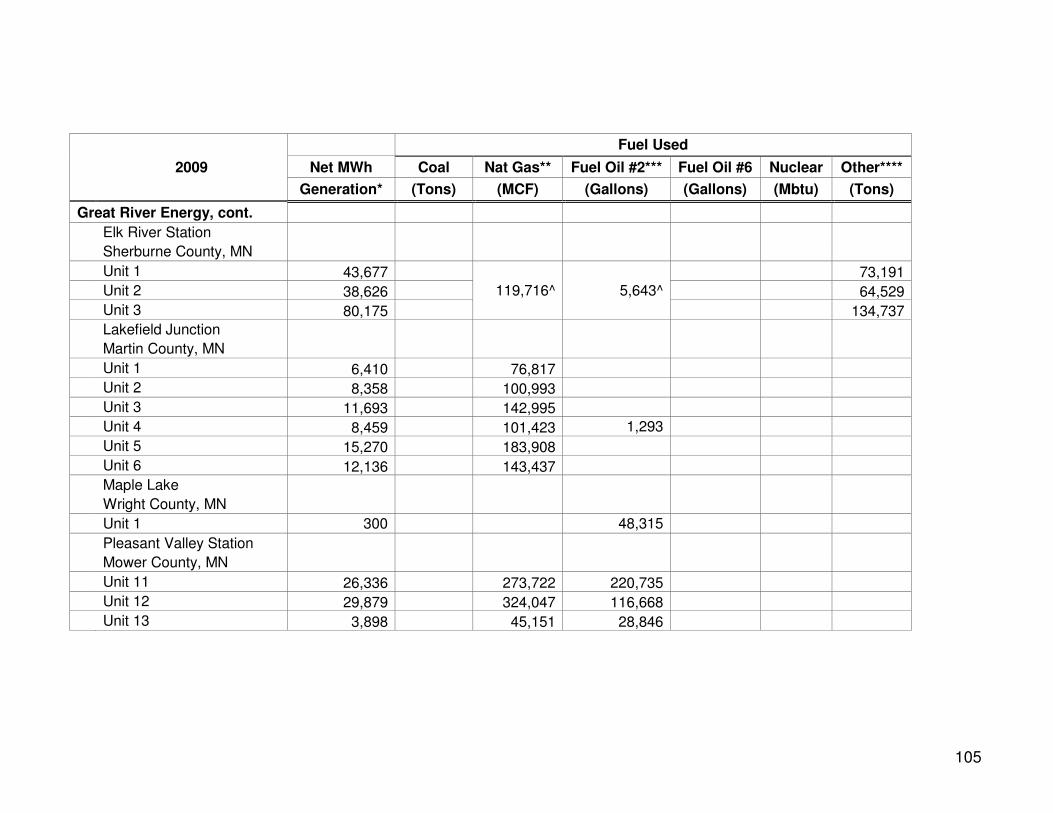
105
Fuel Used
2009 Net MWh Coal Nat Gas** Fuel Oil #2*** Fuel Oil #6 Nuclear Other****
Generation* (Tons) (MCF) (Gallons) (Gallons) (Mbtu) (Tons)
Great River Energy, cont.
Elk River Station
Sherburne County, MN
Unit 1 43,677
119,716^ 5,643^
73,191
Unit 2 38,626 64,529
Unit 3 80,175 134,737
Lakefield Junction
Martin County, MN
Unit 1 6,410 76,817
Unit 2 8,358 100,993
Unit 3 11,693 142,995
Unit 4 8,459 101,423 1,293
Unit 5 15,270 183,908
Unit 6 12,136 143,437
Maple Lake
Wright County, MN
Unit 1 300 48,315
Pleasant Valley Station
Mower County, MN
Unit 11 26,336 273,722 220,735
Unit 12 29,879 324,047 116,668
Unit 13 3,898 45,151 28,846
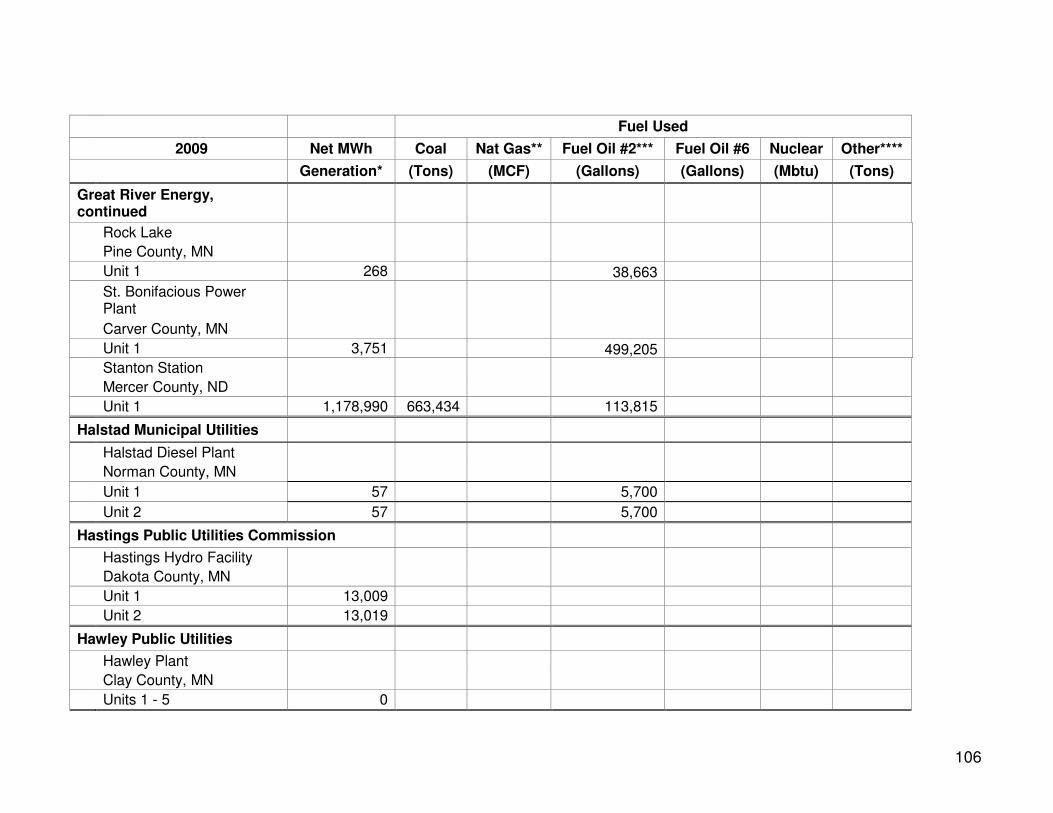
106
Fuel Used
2009 Net MWh Coal Nat Gas** Fuel Oil #2*** Fuel Oil #6 Nuclear Other****
Generation* (Tons) (MCF) (Gallons) (Gallons) (Mbtu) (Tons)
Great River Energy, continued
Rock Lake
Pine County, MN
Unit 1 268 38,663
St. Bonifacious Power Plant
Carver County, MN
Unit 1 3,751 499,205
Stanton Station
Mercer County, ND
Unit 1 1,178,990 663,434 113,815
Halstad Municipal Utilities
Halstad Diesel Plant
Norman County, MN
Unit 1 57 5,700
Unit 2 57 5,700
Hastings Public Utilities Commission
Hastings Hydro Facility
Dakota County, MN
Unit 1 13,009
Unit 2 13,019
Hawley Public Utilities
Hawley Plant
Clay County, MN
Units 1 - 5 0
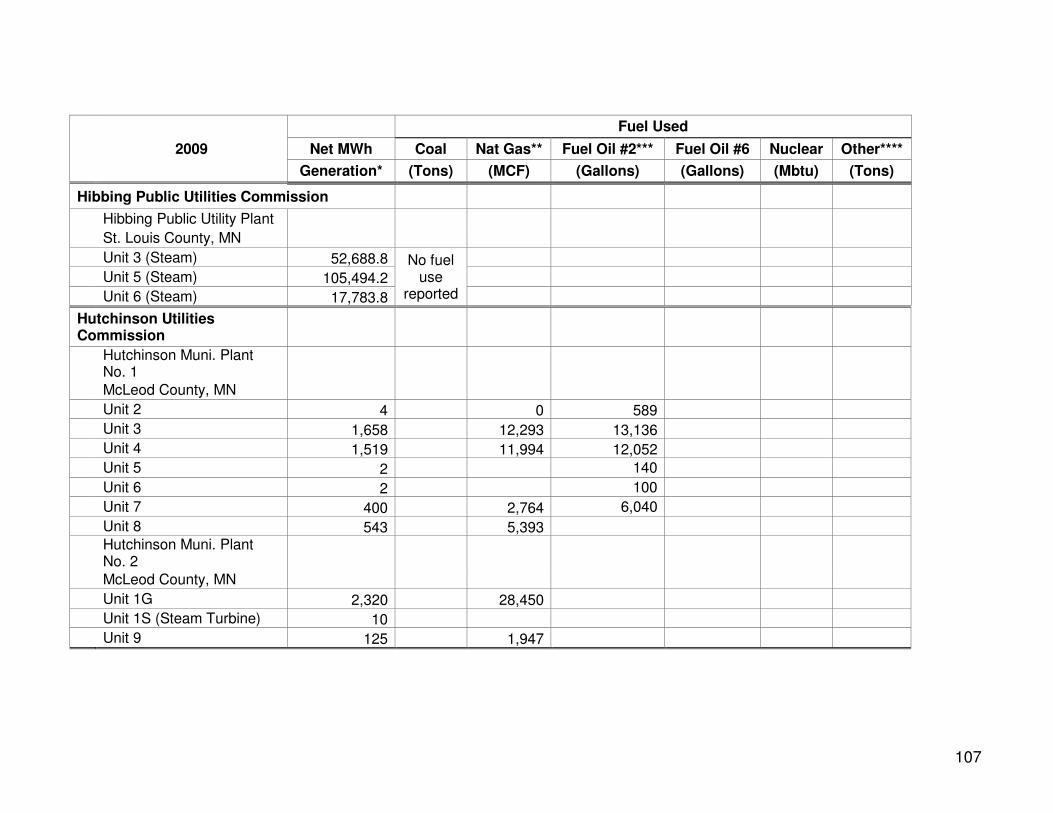
107
Fuel Used
2009 Net MWh Coal Nat Gas** Fuel Oil #2*** Fuel Oil #6 Nuclear Other****
Generation* (Tons) (MCF) (Gallons) (Gallons) (Mbtu) (Tons)
Hibbing Public Utilities Commission
Hibbing Public Utility Plant
St. Louis County, MN
Unit 3 (Steam) 52,688.8 No fuel use
reported
Unit 5 (Steam) 105,494.2
Unit 6 (Steam) 17,783.8
Hutchinson Utilities Commission
Hutchinson Muni. Plant No. 1
McLeod County, MN
Unit 2 4 0 589
Unit 3 1,658 12,293 13,136
Unit 4 1,519 11,994 12,052
Unit 5 2 140
Unit 6 2 100
Unit 7 400 2,764 6,040
Unit 8 543 5,393
Hutchinson Muni. Plant No. 2
McLeod County, MN
Unit 1G 2,320 28,450
Unit 1S (Steam Turbine) 10
Unit 9 125 1,947
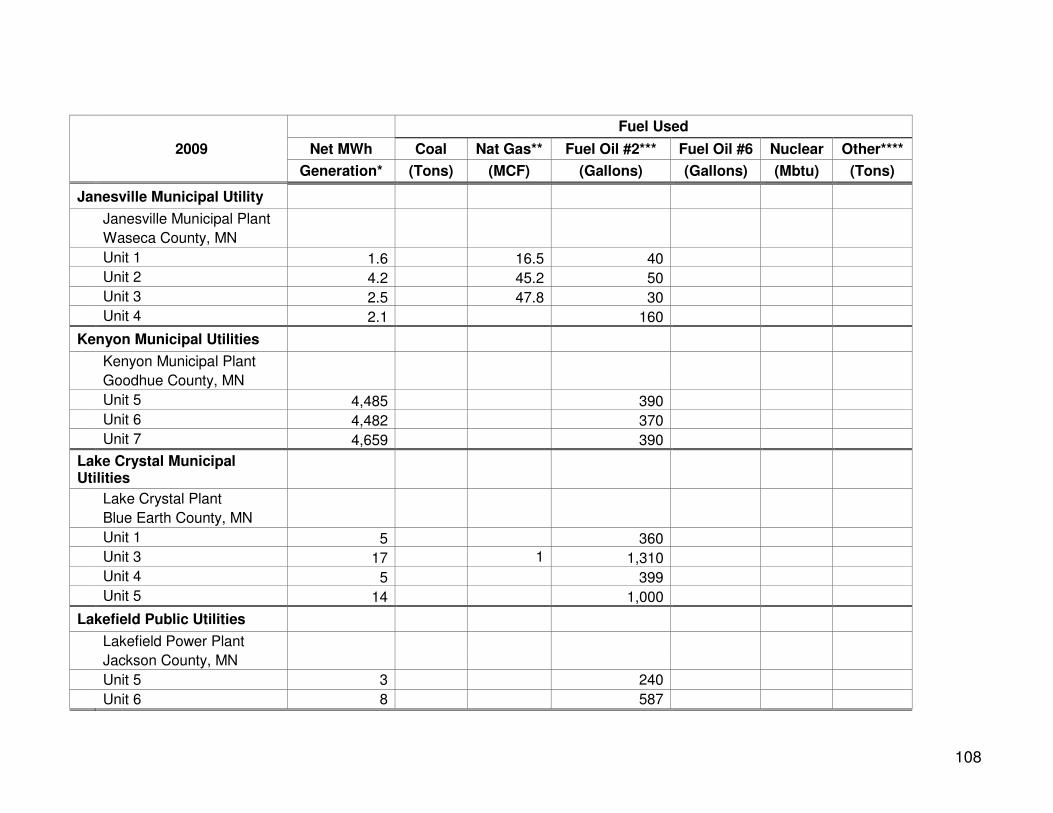
108
Fuel Used
2009 Net MWh Coal Nat Gas** Fuel Oil #2*** Fuel Oil #6 Nuclear Other****
Generation* (Tons) (MCF) (Gallons) (Gallons) (Mbtu) (Tons)
Janesville Municipal Utility
Janesville Municipal Plant
Waseca County, MN
Unit 1 1.6 16.5 40
Unit 2 4.2 45.2 50
Unit 3 2.5 47.8 30
Unit 4 2.1 160
Kenyon Municipal Utilities
Kenyon Municipal Plant
Goodhue County, MN
Unit 5 4,485 390
Unit 6 4,482 370
Unit 7 4,659 390
Lake Crystal Municipal Utilities
Lake Crystal Plant
Blue Earth County, MN
Unit 1 5 360
Unit 3 17 1 1,310
Unit 4 5 399
Unit 5 14 1,000
Lakefield Public Utilities
Lakefield Power Plant
Jackson County, MN
Unit 5 3 240
Unit 6 8 587
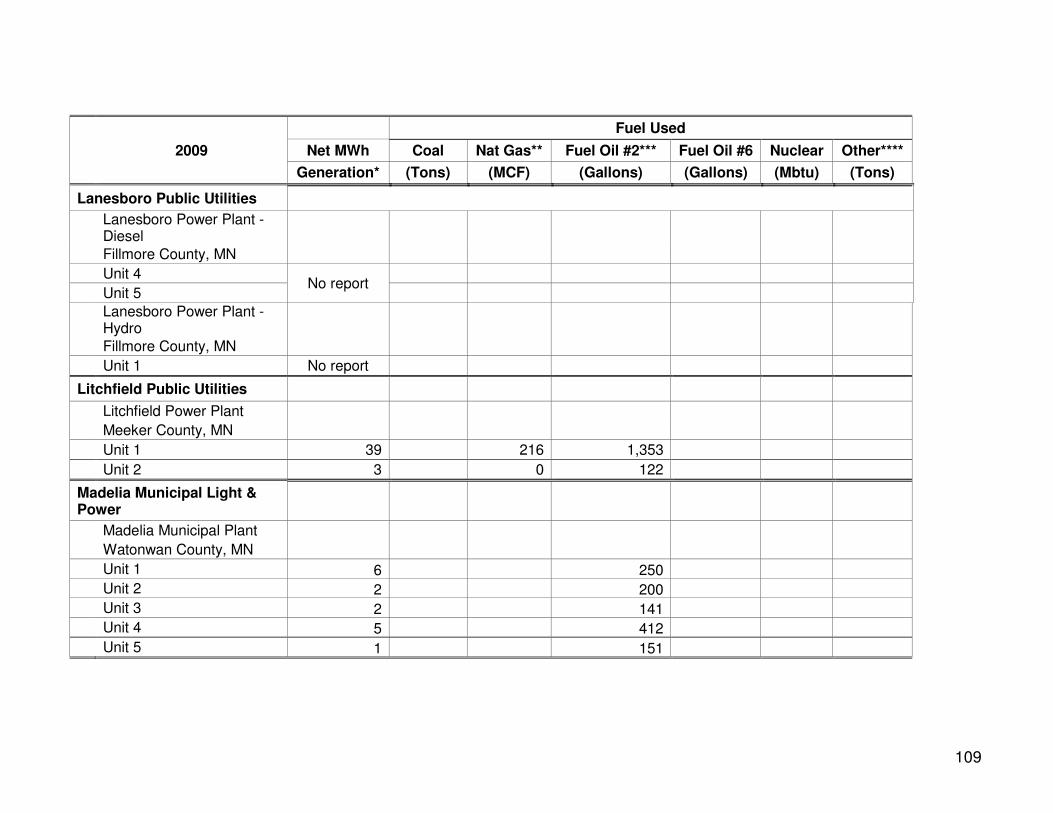
109
Fuel Used
2009 Net MWh Coal Nat Gas** Fuel Oil #2*** Fuel Oil #6 Nuclear Other****
Generation* (Tons) (MCF) (Gallons) (Gallons) (Mbtu) (Tons)
Lanesboro Public Utilities
Lanesboro Power Plant - Diesel
Fillmore County, MN
Unit 4 No report
Unit 5
Lanesboro Power Plant - Hydro
Fillmore County, MN
Unit 1 No report
Litchfield Public Utilities
Litchfield Power Plant
Meeker County, MN
Unit 1 39 216 1,353
Unit 2 3 0 122
Madelia Municipal Light & Power
Madelia Municipal Plant
Watonwan County, MN
Unit 1 6 250
Unit 2 2 200
Unit 3 2 141
Unit 4 5 412
Unit 5 1 151
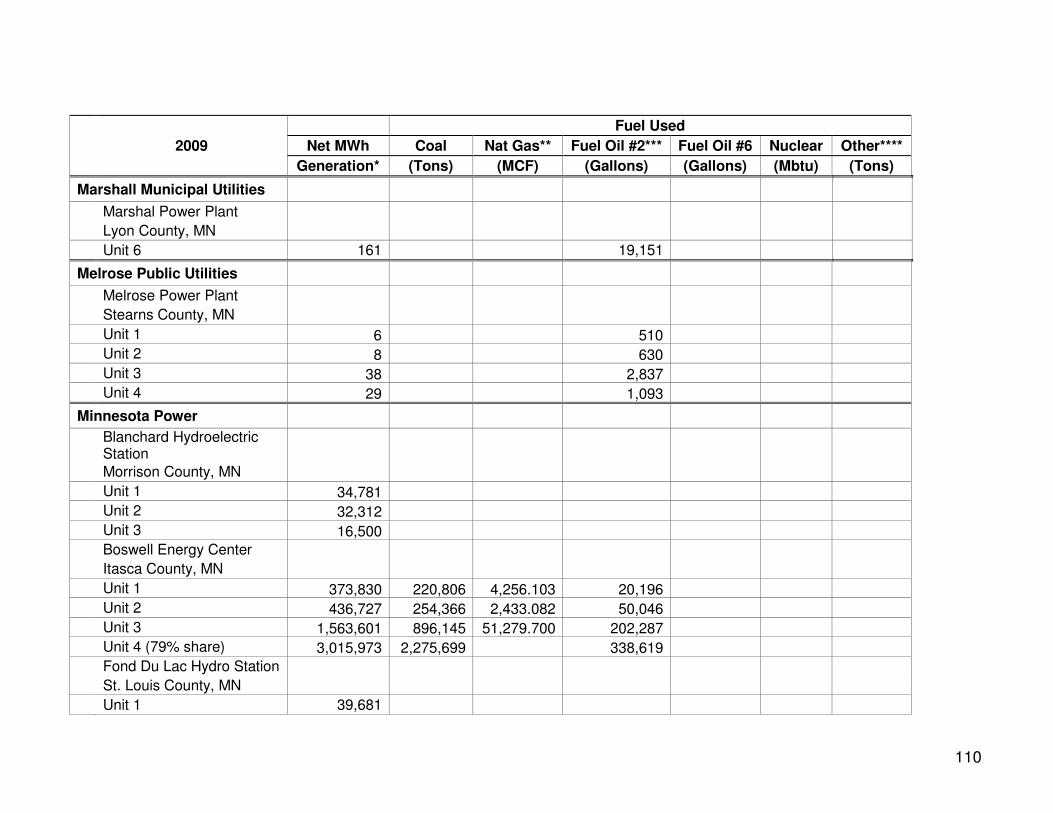
110
Fuel Used
2009 Net MWh Coal Nat Gas** Fuel Oil #2*** Fuel Oil #6 Nuclear Other****
Generation* (Tons) (MCF) (Gallons) (Gallons) (Mbtu) (Tons)
Marshall Municipal Utilities
Marshal Power Plant
Lyon County, MN
Unit 6 161 19,151
Melrose Public Utilities
Melrose Power Plant
Stearns County, MN
Unit 1 6 510
Unit 2 8 630
Unit 3 38 2,837
Unit 4 29 1,093
Minnesota Power
Blanchard Hydroelectric Station
Morrison County, MN
Unit 1 34,781
Unit 2 32,312
Unit 3 16,500
Boswell Energy Center
Itasca County, MN
Unit 1 373,830 220,806 4,256.103 20,196
Unit 2 436,727 254,366 2,433.082 50,046
Unit 3 1,563,601 896,145 51,279.700 202,287
Unit 4 (79% share) 3,015,973 2,275,699 338,619
Fond Du Lac Hydro Station
St. Louis County, MN
Unit 1 39,681

111
Fuel Used
2009 Net MWh Coal Nat Gas** Fuel Oil #2*** Fuel Oil #6 Nuclear Other****
Generation* (Tons) (MCF) (Gallons) (Gallons) (Mbtu) (Tons)
Minnesota Power, continued
Knife Falls Hydro Station
Carlton County, MN
Unit 1 4,916
Unit 2 2,366
Unit 3 321
Laskin Energy Center
St. Louis County, MN
Unit 1 253,506 174,594 5,871 61
Unit 2 256,999 179,594 5,871 61
Little Falls Hydro Station
Morrison County, MN
Unit 1 6,233
Unit 2 6,219
Unit 3 7,578
Unit 4 9,609
Unit 5 1,234
Unit 6 937
M.L. Hibbard Steam Sta.
St. Louis County, MN
Unit 3 34,415 12,443 53,038
Unit 4 6,289 952 9,518
Pillager Hydro Station
Cass County, MN
Unit 1 4,693
Unit 2 4,709
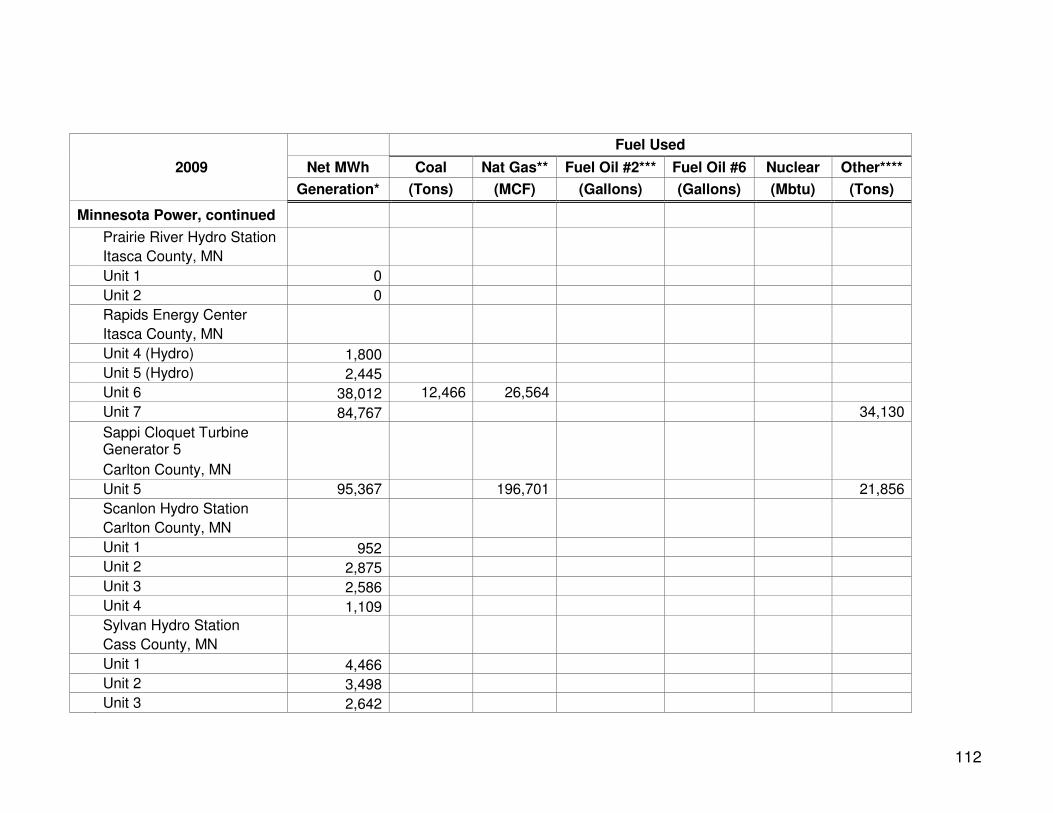
112
Fuel Used
2009 Net MWh Coal Nat Gas** Fuel Oil #2*** Fuel Oil #6 Nuclear Other****
Generation* (Tons) (MCF) (Gallons) (Gallons) (Mbtu) (Tons)
Minnesota Power, continued
Prairie River Hydro Station
Itasca County, MN
Unit 1 0
Unit 2 0
Rapids Energy Center
Itasca County, MN
Unit 4 (Hydro) 1,800
Unit 5 (Hydro) 2,445
Unit 6 38,012 12,466 26,564
Unit 7 84,767 34,130
Sappi Cloquet Turbine Generator 5
Carlton County, MN
Unit 5 95,367 196,701 21,856
Scanlon Hydro Station
Carlton County, MN
Unit 1 952
Unit 2 2,875
Unit 3 2,586
Unit 4 1,109
Sylvan Hydro Station
Cass County, MN
Unit 1 4,466
Unit 2 3,498
Unit 3 2,642
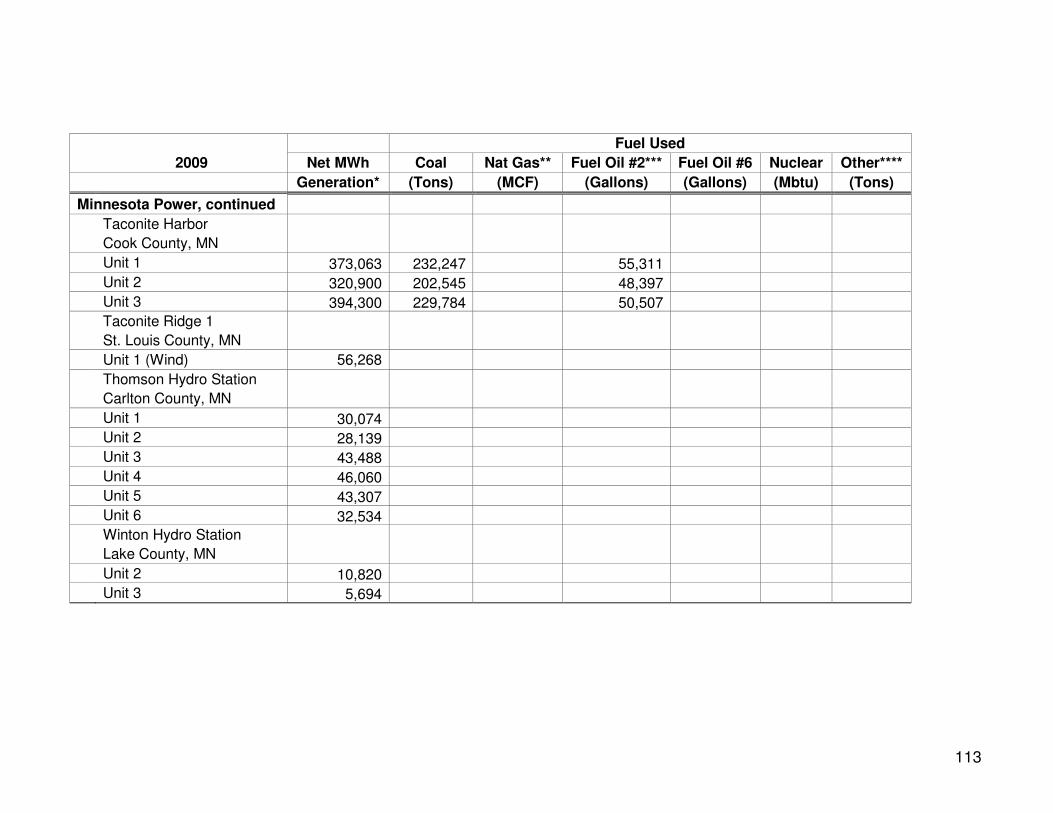
113
Fuel Used
2009 Net MWh Coal Nat Gas** Fuel Oil #2*** Fuel Oil #6 Nuclear Other****
Generation* (Tons) (MCF) (Gallons) (Gallons) (Mbtu) (Tons)
Minnesota Power, continued
Taconite Harbor
Cook County, MN
Unit 1 373,063 232,247 55,311
Unit 2 320,900 202,545 48,397
Unit 3 394,300 229,784 50,507
Taconite Ridge 1
St. Louis County, MN
Unit 1 (Wind) 56,268
Thomson Hydro Station
Carlton County, MN
Unit 1 30,074
Unit 2 28,139
Unit 3 43,488
Unit 4 46,060
Unit 5 43,307
Unit 6 32,534
Winton Hydro Station
Lake County, MN
Unit 2 10,820
Unit 3 5,694
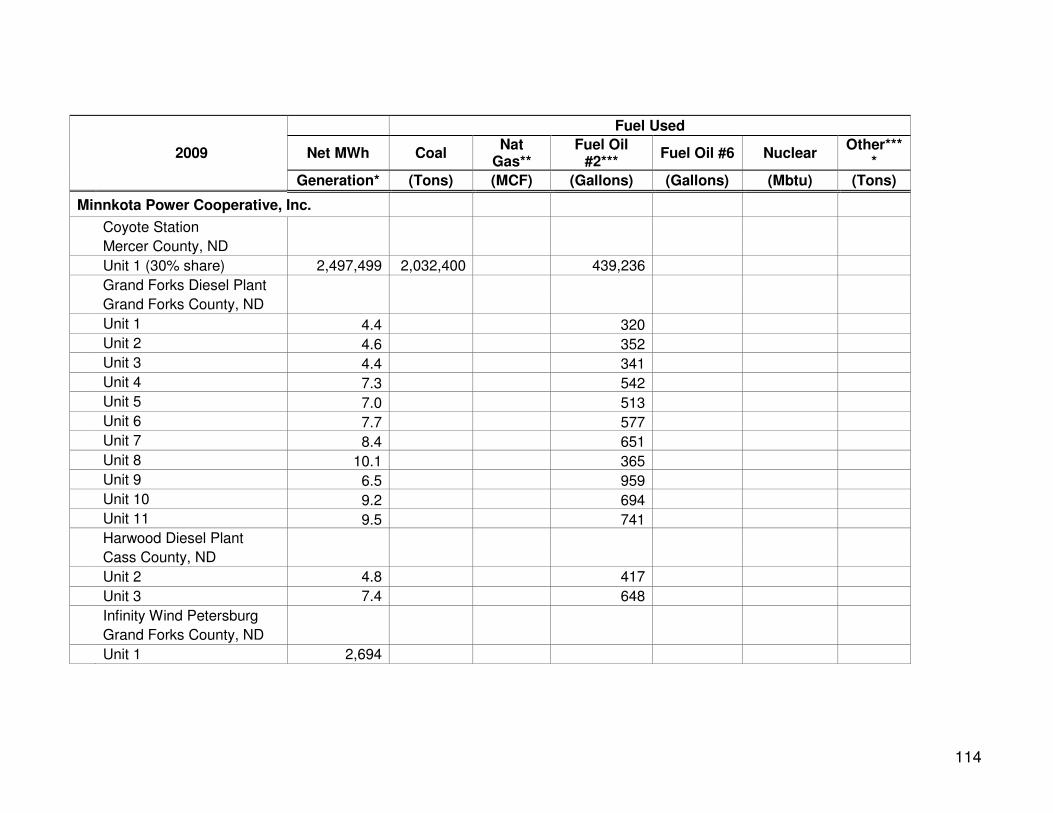
114
Fuel Used
2009 Net MWh Coal Nat
Gas** Fuel Oil
#2*** Fuel Oil #6 Nuclear
Other****
Generation* (Tons) (MCF) (Gallons) (Gallons) (Mbtu) (Tons)
Minnkota Power Cooperative, Inc.
Coyote Station
Mercer County, ND
Unit 1 (30% share) 2,497,499 2,032,400 439,236
Grand Forks Diesel Plant
Grand Forks County, ND
Unit 1 4.4 320
Unit 2 4.6 352
Unit 3 4.4 341
Unit 4 7.3 542
Unit 5 7.0 513
Unit 6 7.7 577
Unit 7 8.4 651
Unit 8 10.1 365
Unit 9 6.5 959
Unit 10 9.2 694
Unit 11 9.5 741
Harwood Diesel Plant
Cass County, ND
Unit 2 4.8 417
Unit 3 7.4 648
Infinity Wind Petersburg
Grand Forks County, ND
Unit 1 2,694
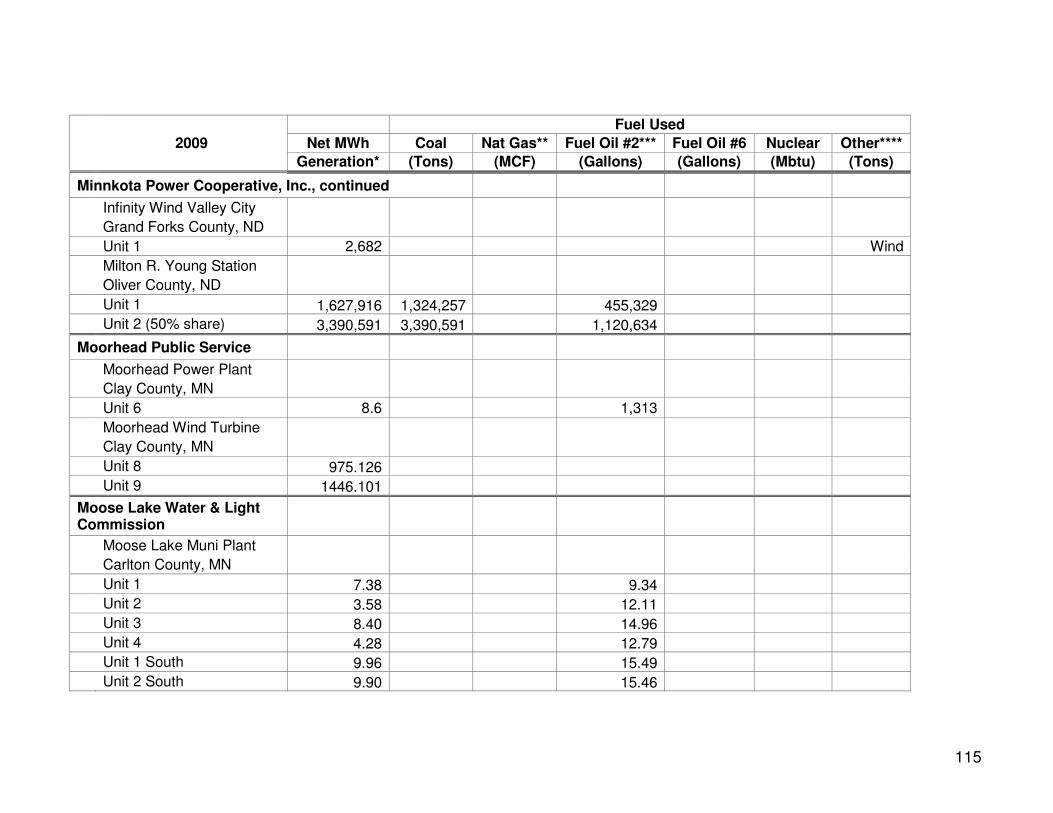
115
Fuel Used
2009 Net MWh Coal Nat Gas** Fuel Oil #2*** Fuel Oil #6 Nuclear Other****
Generation* (Tons) (MCF) (Gallons) (Gallons) (Mbtu) (Tons)
Minnkota Power Cooperative, Inc., continued
Infinity Wind Valley City
Grand Forks County, ND
Unit 1 2,682 Wind
Milton R. Young Station
Oliver County, ND
Unit 1 1,627,916 1,324,257 455,329
Unit 2 (50% share) 3,390,591 3,390,591 1,120,634
Moorhead Public Service
Moorhead Power Plant
Clay County, MN
Unit 6 8.6 1,313
Moorhead Wind Turbine
Clay County, MN
Unit 8 975.126
Unit 9 1446.101
Moose Lake Water & Light Commission
Moose Lake Muni Plant
Carlton County, MN
Unit 1 7.38 9.34
Unit 2 3.58 12.11
Unit 3 8.40 14.96
Unit 4 4.28 12.79
Unit 1 South 9.96 15.49
Unit 2 South 9.90 15.46
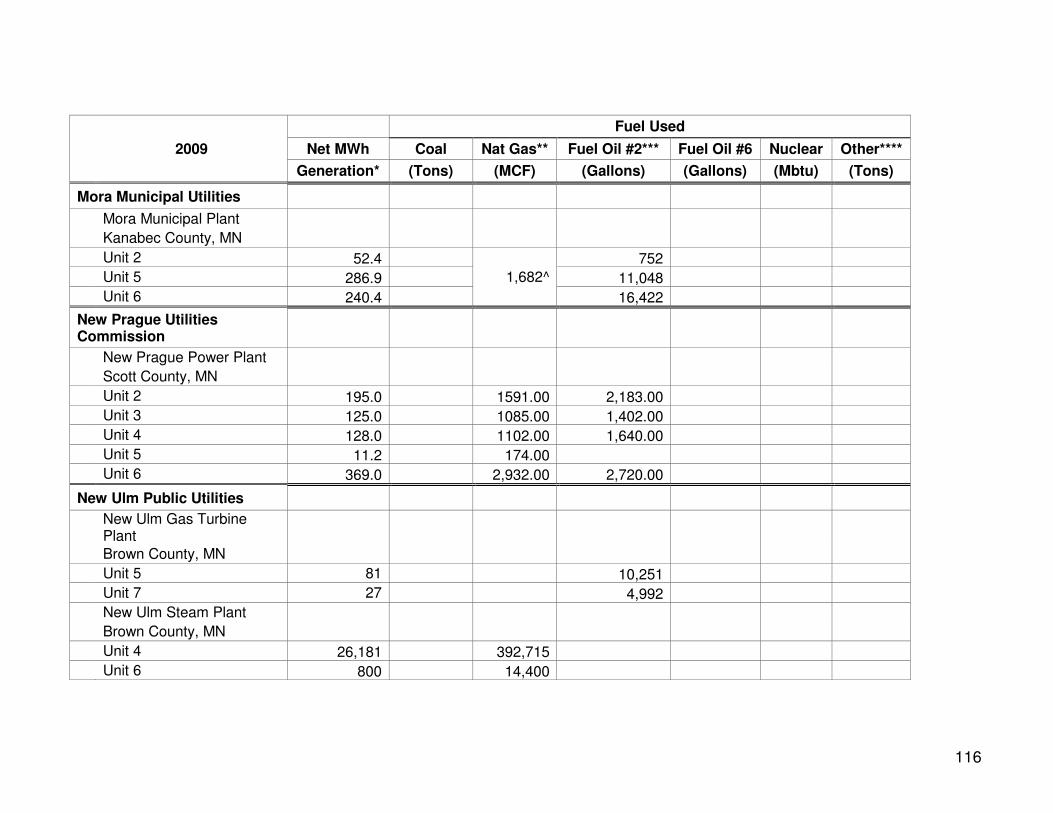
116
Fuel Used
2009 Net MWh Coal Nat Gas** Fuel Oil #2*** Fuel Oil #6 Nuclear Other****
Generation* (Tons) (MCF) (Gallons) (Gallons) (Mbtu) (Tons)
Mora Municipal Utilities
Mora Municipal Plant
Kanabec County, MN
Unit 2 52.4
1,682^
752
Unit 5 286.9 11,048
Unit 6 240.4 16,422
New Prague Utilities Commission
New Prague Power Plant
Scott County, MN
Unit 2 195.0 1591.00 2,183.00
Unit 3 125.0 1085.00 1,402.00
Unit 4 128.0 1102.00 1,640.00
Unit 5 11.2 174.00
Unit 6 369.0 2,932.00 2,720.00
New Ulm Public Utilities
New Ulm Gas Turbine Plant
Brown County, MN
Unit 5 81 10,251
Unit 7 27 4,992
New Ulm Steam Plant
Brown County, MN
Unit 4 26,181 392,715
Unit 6 800 14,400
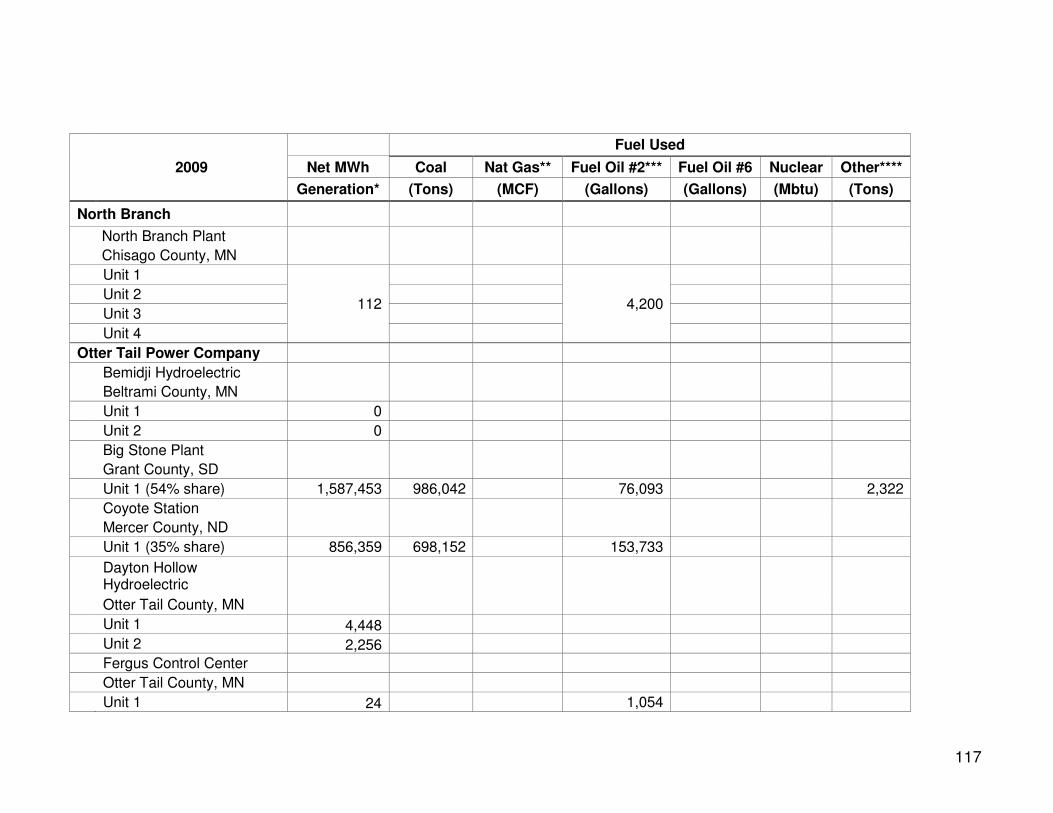
117
Fuel Used
2009 Net MWh Coal Nat Gas** Fuel Oil #2*** Fuel Oil #6 Nuclear Other****
Generation* (Tons) (MCF) (Gallons) (Gallons) (Mbtu) (Tons)
North Branch
North Branch Plant
Chisago County, MN
Unit 1
112
4,200
Unit 2
Unit 3
Unit 4
Otter Tail Power Company
Bemidji Hydroelectric
Beltrami County, MN
Unit 1 0
Unit 2 0
Big Stone Plant
Grant County, SD
Unit 1 (54% share) 1,587,453 986,042 76,093 2,322
Coyote Station
Mercer County, ND
Unit 1 (35% share) 856,359 698,152 153,733
Dayton Hollow Hydroelectric
Otter Tail County, MN
Unit 1 4,448
Unit 2 2,256
Fergus Control Center
Otter Tail County, MN
Unit 1 24 1,054
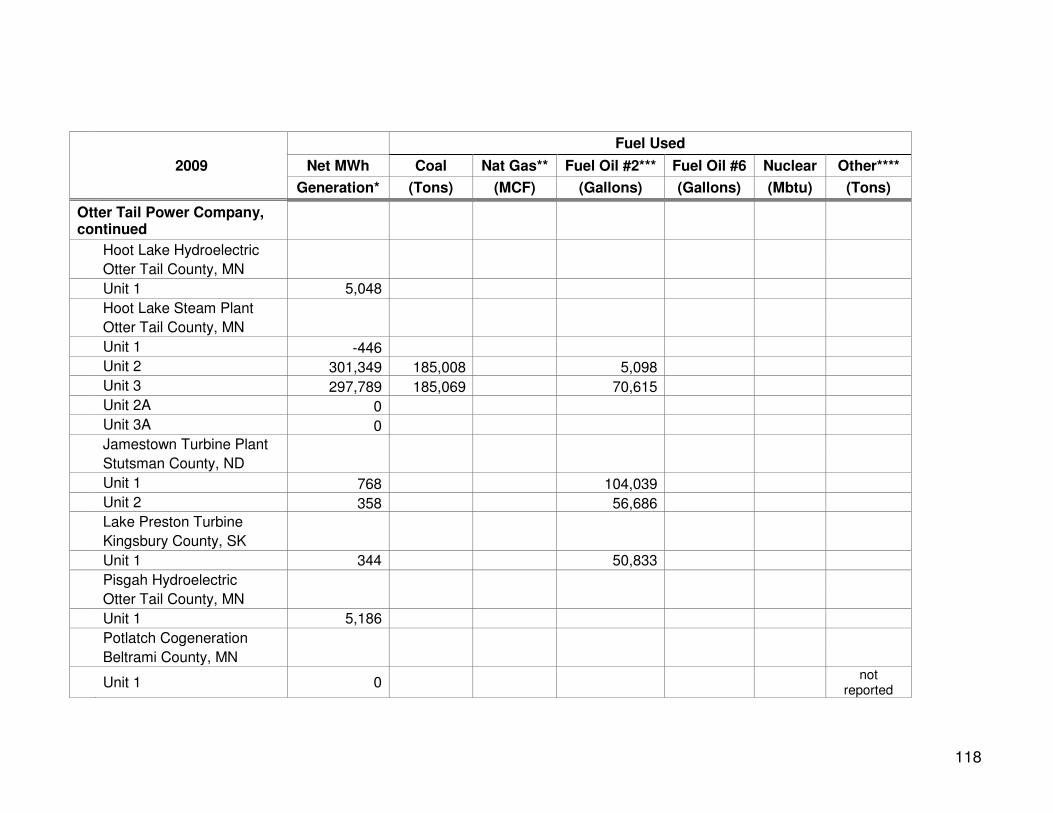
118
Fuel Used
2009 Net MWh Coal Nat Gas** Fuel Oil #2*** Fuel Oil #6 Nuclear Other****
Generation* (Tons) (MCF) (Gallons) (Gallons) (Mbtu) (Tons)
Otter Tail Power Company, continued
Hoot Lake Hydroelectric
Otter Tail County, MN
Unit 1 5,048
Hoot Lake Steam Plant
Otter Tail County, MN
Unit 1 -446
Unit 2 301,349 185,008 5,098
Unit 3 297,789 185,069 70,615
Unit 2A 0
Unit 3A 0
Jamestown Turbine Plant
Stutsman County, ND
Unit 1 768 104,039
Unit 2 358 56,686
Lake Preston Turbine
Kingsbury County, SK
Unit 1 344 50,833
Pisgah Hydroelectric
Otter Tail County, MN
Unit 1 5,186
Potlatch Cogeneration
Beltrami County, MN
Unit 1 0 not
reported
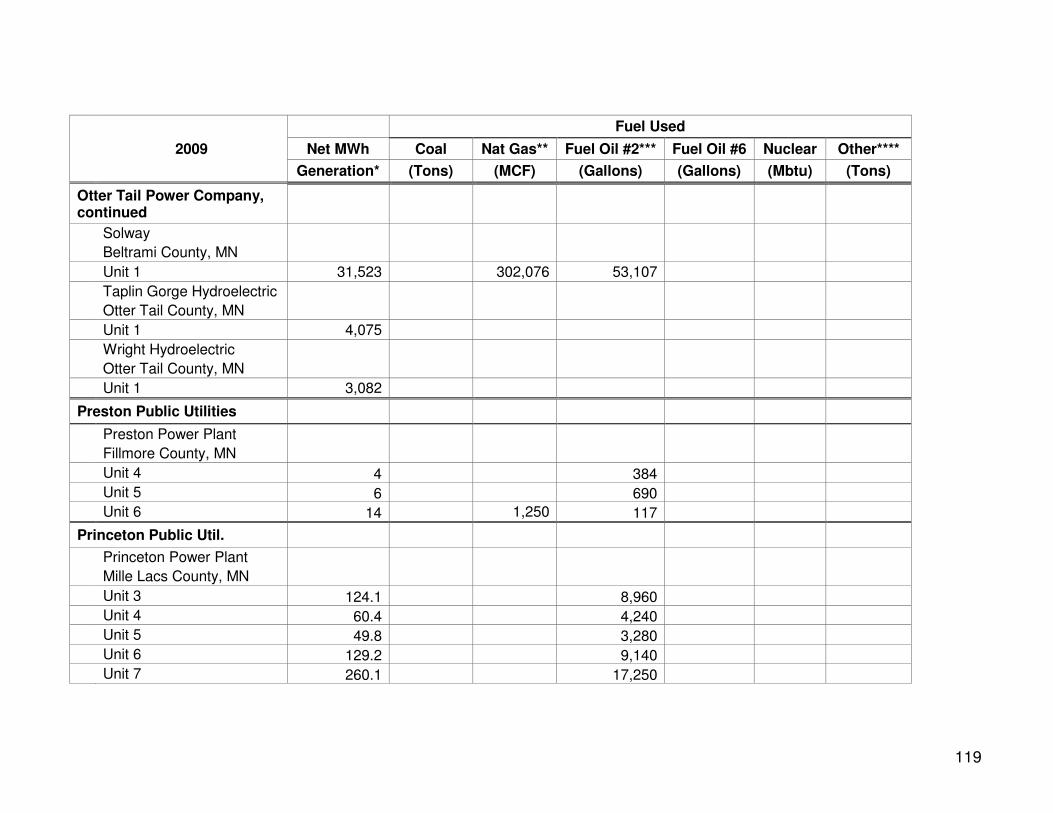
119
Fuel Used
2009 Net MWh Coal Nat Gas** Fuel Oil #2*** Fuel Oil #6 Nuclear Other****
Generation* (Tons) (MCF) (Gallons) (Gallons) (Mbtu) (Tons)
Otter Tail Power Company, continued
Solway
Beltrami County, MN
Unit 1 31,523 302,076 53,107
Taplin Gorge Hydroelectric
Otter Tail County, MN
Unit 1 4,075
Wright Hydroelectric
Otter Tail County, MN
Unit 1 3,082
Preston Public Utilities
Preston Power Plant
Fillmore County, MN
Unit 4 4 384
Unit 5 6 690
Unit 6 14 1,250 117
Princeton Public Util.
Princeton Power Plant
Mille Lacs County, MN
Unit 3 124.1 8,960
Unit 4 60.4 4,240
Unit 5 49.8 3,280
Unit 6 129.2 9,140
Unit 7 260.1 17,250
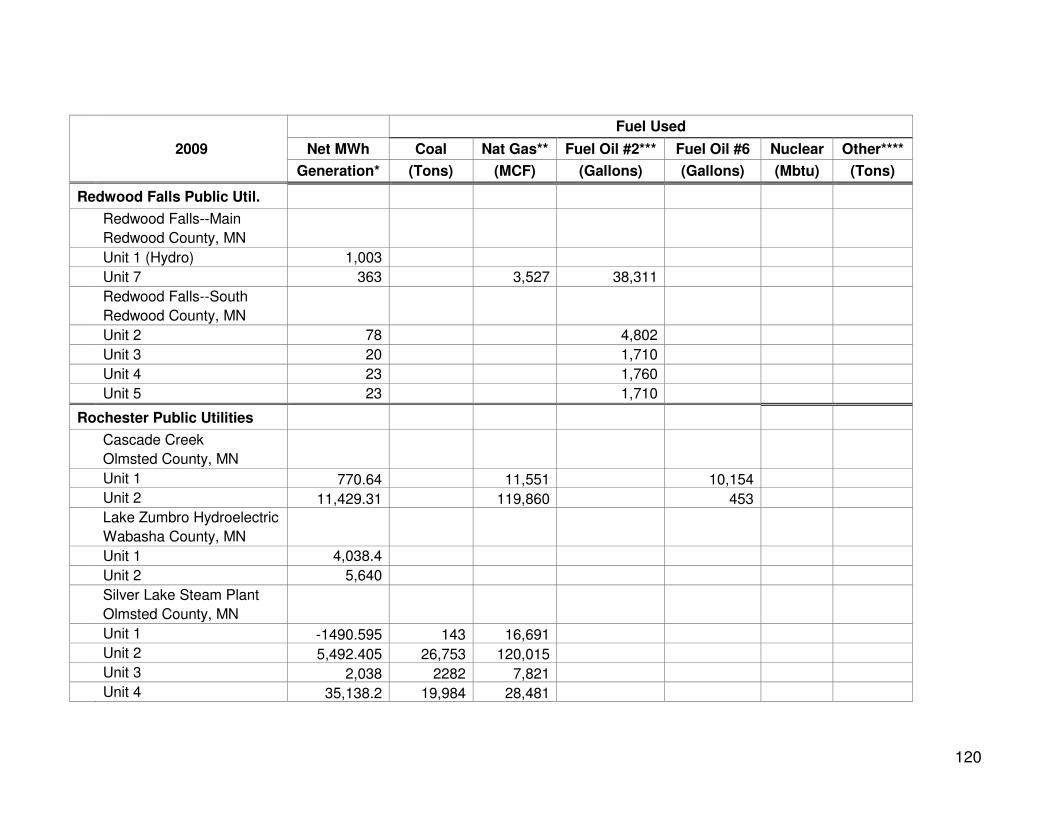
120
Fuel Used
2009 Net MWh Coal Nat Gas** Fuel Oil #2*** Fuel Oil #6 Nuclear Other****
Generation* (Tons) (MCF) (Gallons) (Gallons) (Mbtu) (Tons)
Redwood Falls Public Util.
Redwood Falls--Main
Redwood County, MN
Unit 1 (Hydro) 1,003
Unit 7 363 3,527 38,311
Redwood Falls--South
Redwood County, MN
Unit 2 78 4,802
Unit 3 20 1,710
Unit 4 23 1,760
Unit 5 23 1,710
Rochester Public Utilities
Cascade Creek
Olmsted County, MN
Unit 1 770.64 11,551 10,154
Unit 2 11,429.31 119,860 453
Lake Zumbro Hydroelectric
Wabasha County, MN
Unit 1 4,038.4
Unit 2 5,640
Silver Lake Steam Plant
Olmsted County, MN
Unit 1 -1490.595 143 16,691
Unit 2 5,492.405 26,753 120,015
Unit 3 2,038 2282 7,821
Unit 4 35,138.2 19,984 28,481

121
Fuel Used
2009 Net MWh Coal Nat Gas** Fuel Oil #2*** Fuel Oil #6 Nuclear Other****
Generation* (Tons) (MCF) (Gallons) (Gallons) (Mbtu) (Tons)
St. Charles Light and Water
St. Charles Power Plant
Winona County, MN
Unit 1 11.6 900
Unit 2 11.4 820
Unit 3 11.4 850
Unit 4 11.5 830
St. James Municipal Light & Power
Diesel Generation Plant
Watonwan County, MN
Unit 1 8.3 567
Unit 2 8.0 559
Unit 3 8.0 569
Unit 4 8.0 558
Unit 5 8.0 562
Unit 6 8.0 563
Sleepy Eye Public Utility
Sleepy Eye Power Plant
Brown County, MN
Units 1 - 5 0
Southern Minnesota Municipal Power Agency
Owatonna Downtown
Steele County, MN
Units 6 - 7 1,305 12,982
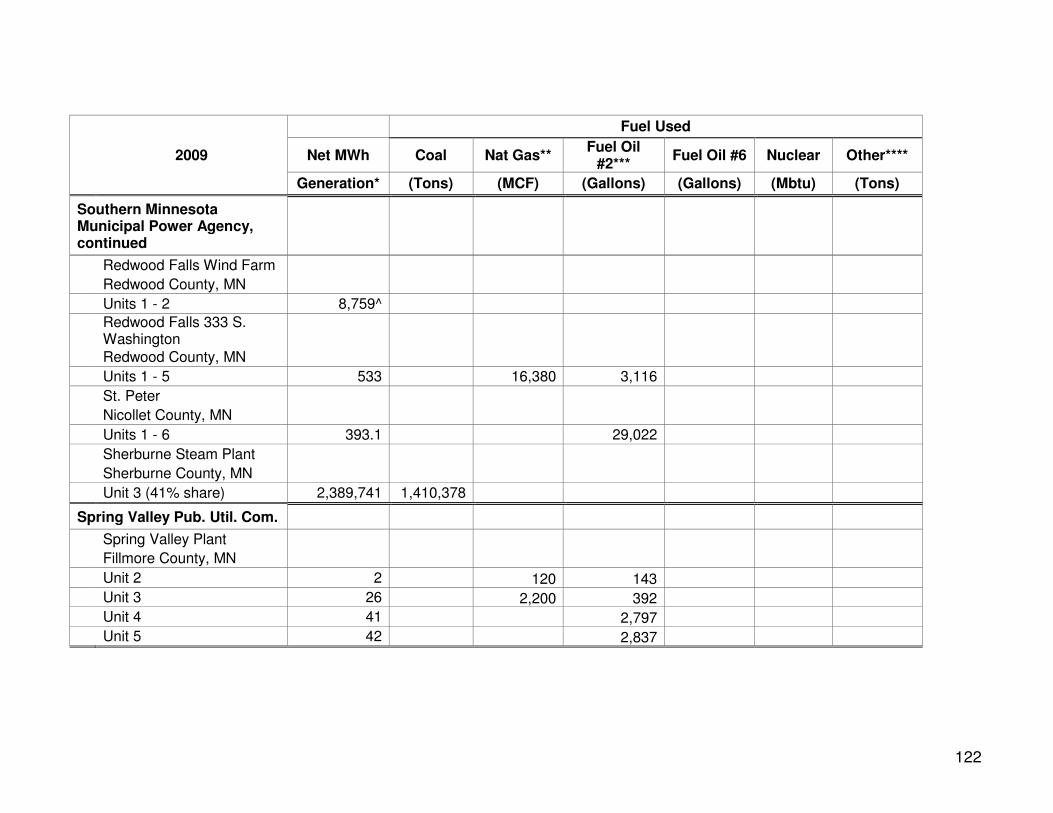
122
Fuel Used
2009 Net MWh Coal Nat Gas** Fuel Oil
#2*** Fuel Oil #6 Nuclear Other****
Generation* (Tons) (MCF) (Gallons) (Gallons) (Mbtu) (Tons)
Southern Minnesota Municipal Power Agency, continued
Redwood Falls Wind Farm
Redwood County, MN
Units 1 - 2 8,759^
Redwood Falls 333 S. Washington
Redwood County, MN
Units 1 - 5 533 16,380 3,116
St. Peter
Nicollet County, MN
Units 1 - 6 393.1 29,022
Sherburne Steam Plant
Sherburne County, MN
Unit 3 (41% share) 2,389,741 1,410,378
Spring Valley Pub. Util. Com.
Spring Valley Plant
Fillmore County, MN
Unit 2 2 120 143
Unit 3 26 2,200 392
Unit 4 41 2,797
Unit 5 42 2,837

123
Fuel Used
2009 Net MWh Coal Nat Gas** Fuel Oil #2*** Fuel Oil #6 Nuclear Other****
Generation* (Tons) (MCF) (Gallons) (Gallons) (Mbtu) (Tons)
Steele Waseca Coop Electric
Windmills
Steele County, MN
Unit 1 0
Unit 2 27
Unit 3 48
Unit 4 46
Unit 5 31
Unit 6 41
Unit 7 44
Unit 8 56
Unit 9 63
Unit 10 61
Unit 11 62
Unit 12 0
Unit 13 68
Unit 14 57
Unit 15 46
Unit 16 41
Unit 17 7
Unit 18 0
Unit 19 0
Unit 20 30
Unit 21 43
Unit 22 11
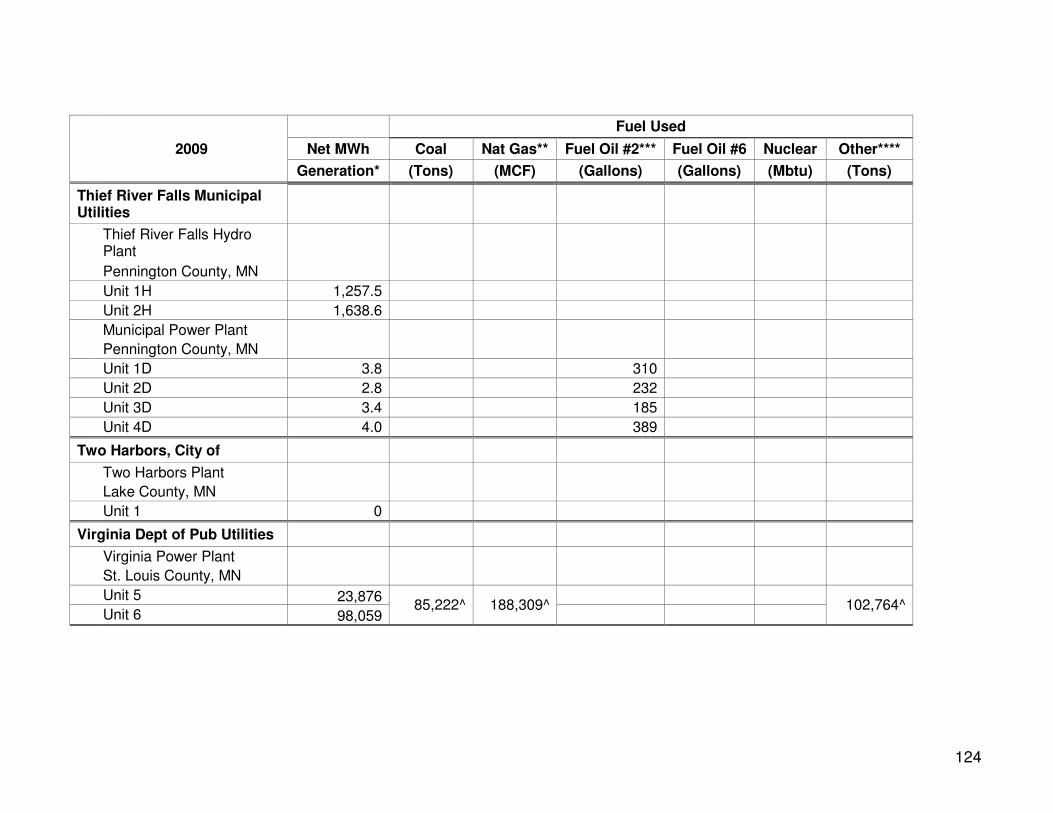
124
Fuel Used
2009 Net MWh Coal Nat Gas** Fuel Oil #2*** Fuel Oil #6 Nuclear Other****
Generation* (Tons) (MCF) (Gallons) (Gallons) (Mbtu) (Tons)
Thief River Falls Municipal Utilities
Thief River Falls Hydro Plant
Pennington County, MN
Unit 1H 1,257.5
Unit 2H 1,638.6
Municipal Power Plant
Pennington County, MN
Unit 1D 3.8 310
Unit 2D 2.8 232
Unit 3D 3.4 185
Unit 4D 4.0 389
Two Harbors, City of
Two Harbors Plant
Lake County, MN
Unit 1 0
Virginia Dept of Pub Utilities
Virginia Power Plant
St. Louis County, MN
Unit 5 23,876 85,222^ 188,309^
102,764^
Unit 6 98,059
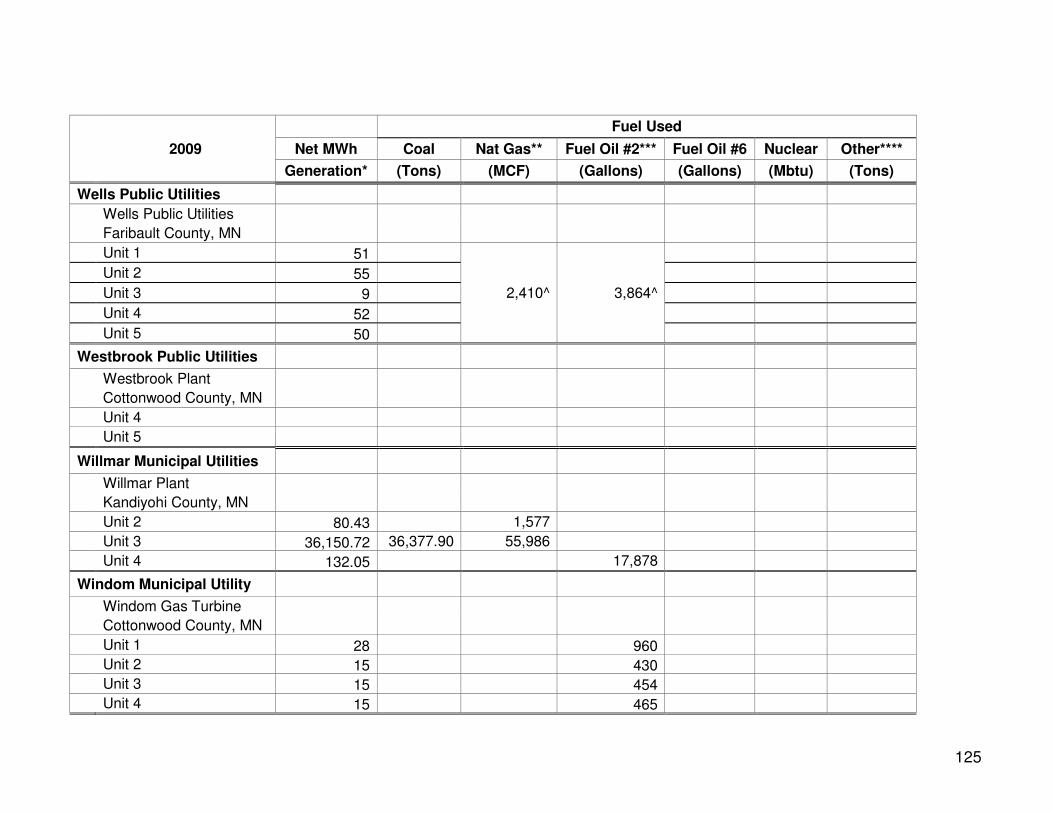
125
Fuel Used
2009 Net MWh Coal Nat Gas** Fuel Oil #2*** Fuel Oil #6 Nuclear Other****
Generation* (Tons) (MCF) (Gallons) (Gallons) (Mbtu) (Tons)
Wells Public Utilities
Wells Public Utilities
Faribault County, MN
Unit 1 51
2,410^ 3,864^
Unit 2 55
Unit 3 9
Unit 4 52
Unit 5 50
Westbrook Public Utilities
Westbrook Plant
Cottonwood County, MN
Unit 4
Unit 5
Willmar Municipal Utilities
Willmar Plant
Kandiyohi County, MN
Unit 2 80.43 1,577
Unit 3 36,150.72 36,377.90 55,986
Unit 4 132.05 17,878
Windom Municipal Utility
Windom Gas Turbine
Cottonwood County, MN
Unit 1 28 960
Unit 2 15 430
Unit 3 15 454
Unit 4 15 465
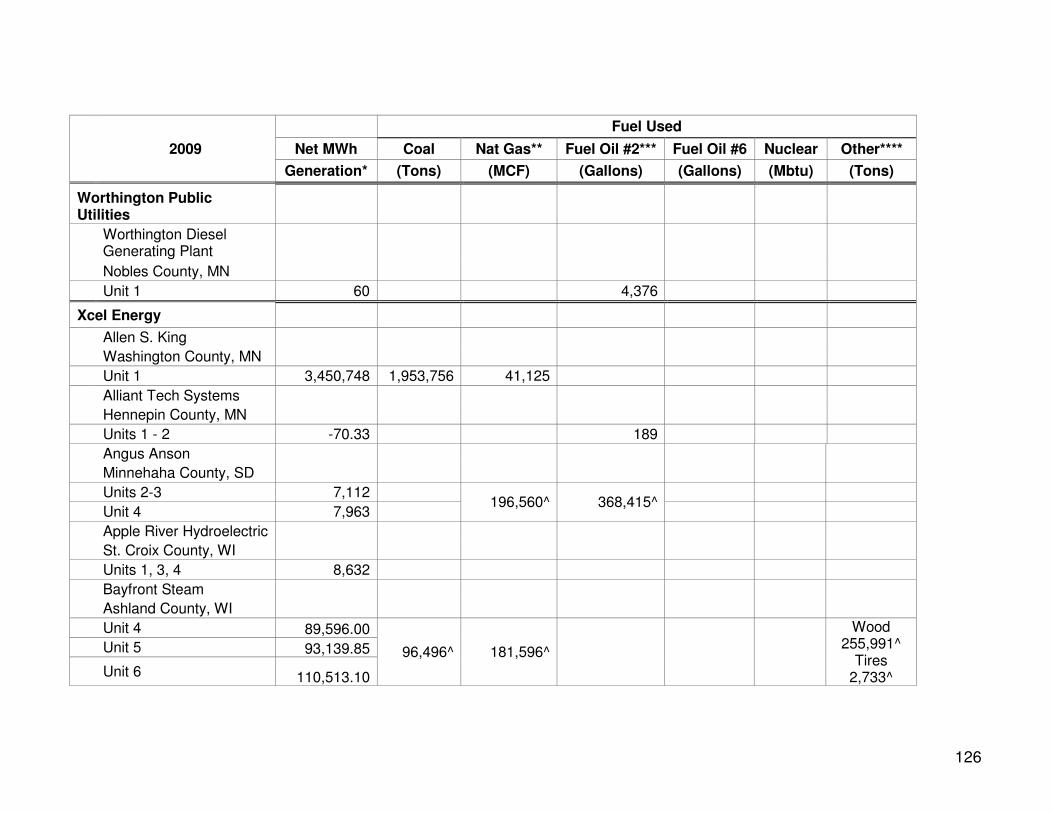
126
Fuel Used
2009 Net MWh Coal Nat Gas** Fuel Oil #2*** Fuel Oil #6 Nuclear Other****
Generation* (Tons) (MCF) (Gallons) (Gallons) (Mbtu) (Tons)
Worthington Public Utilities
Worthington Diesel Generating Plant
Nobles County, MN
Unit 1 60 4,376
Xcel Energy
Allen S. King
Washington County, MN
Unit 1 3,450,748 1,953,756 41,125
Alliant Tech Systems
Hennepin County, MN
Units 1 - 2 -70.33 189
Angus Anson
Minnehaha County, SD
Units 2-3 7,112 196,560^ 368,415^
Unit 4 7,963
Apple River Hydroelectric
St. Croix County, WI
Units 1, 3, 4 8,632
Bayfront Steam
Ashland County, WI
Unit 4 89,596.00
96,496^ 181,596^
Wood 255,991^
Tires 2,733^
Unit 5 93,139.85
Unit 6 110,513.10
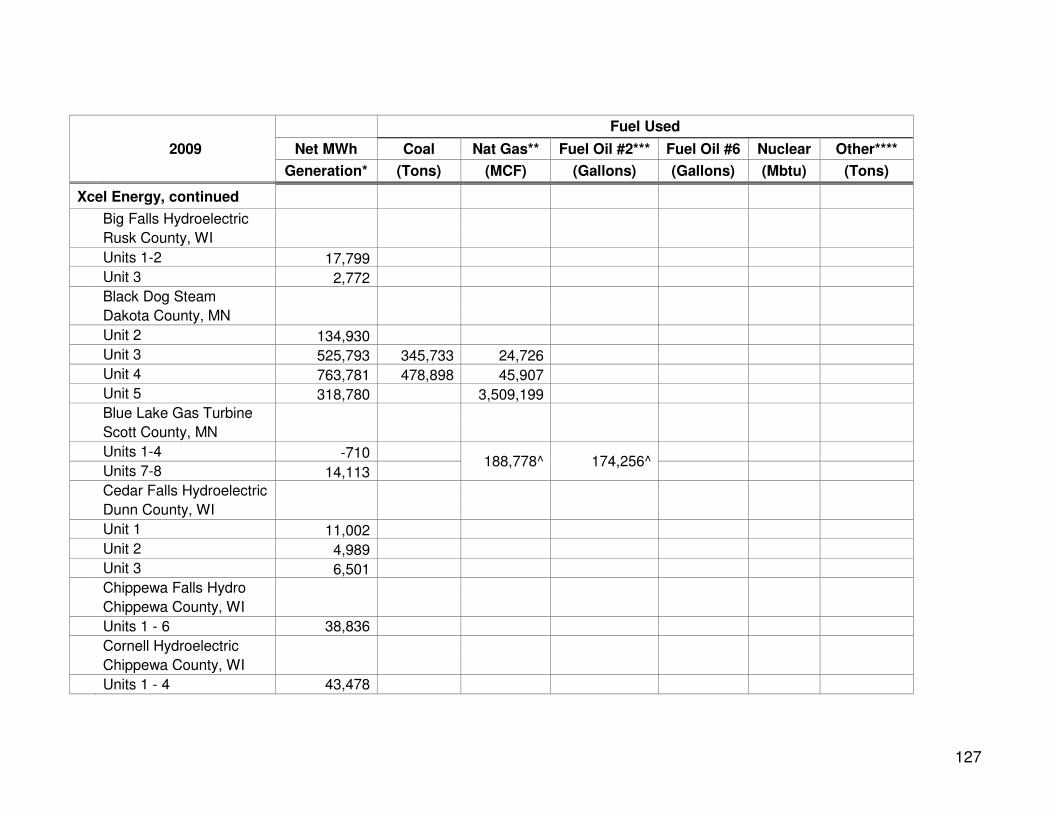
127
Fuel Used
2009 Net MWh Coal Nat Gas** Fuel Oil #2*** Fuel Oil #6 Nuclear Other****
Generation* (Tons) (MCF) (Gallons) (Gallons) (Mbtu) (Tons)
Xcel Energy, continued
Big Falls Hydroelectric
Rusk County, WI
Units 1-2 17,799
Unit 3 2,772
Black Dog Steam
Dakota County, MN
Unit 2 134,930
Unit 3 525,793 345,733 24,726
Unit 4 763,781 478,898 45,907
Unit 5 318,780 3,509,199
Blue Lake Gas Turbine
Scott County, MN
Units 1-4 -710 188,778^ 174,256^
Units 7-8 14,113
Cedar Falls Hydroelectric
Dunn County, WI
Unit 1 11,002
Unit 2 4,989
Unit 3 6,501
Chippewa Falls Hydro
Chippewa County, WI
Units 1 - 6 38,836
Cornell Hydroelectric
Chippewa County, WI
Units 1 - 4 43,478
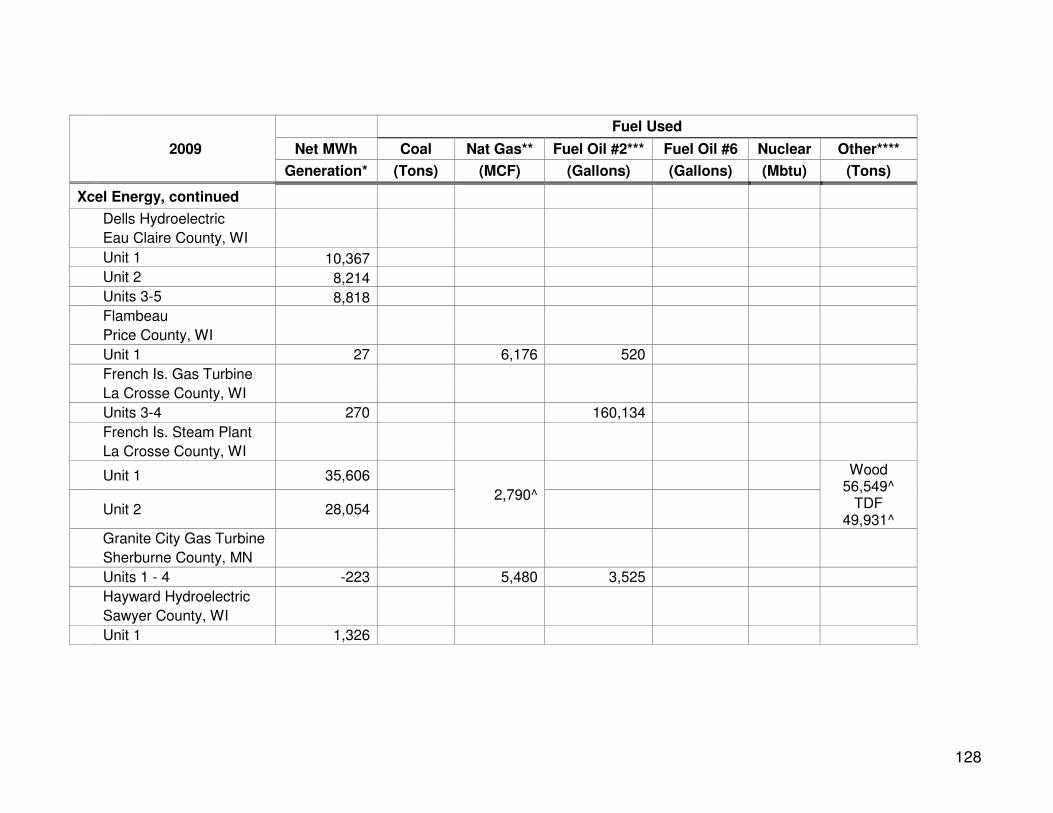
128
Fuel Used
2009 Net MWh Coal Nat Gas** Fuel Oil #2*** Fuel Oil #6 Nuclear Other****
Generation* (Tons) (MCF) (Gallons) (Gallons) (Mbtu) (Tons)
Xcel Energy, continued
Dells Hydroelectric
Eau Claire County, WI
Unit 1 10,367
Unit 2 8,214
Units 3-5 8,818
Flambeau
Price County, WI
Unit 1 27 6,176 520
French Is. Gas Turbine
La Crosse County, WI
Units 3-4 270 160,134
French Is. Steam Plant
La Crosse County, WI
Unit 1 35,606
2,790^
Wood 56,549^
TDF 49,931^
Unit 2 28,054
Granite City Gas Turbine
Sherburne County, MN
Units 1 - 4 -223 5,480 3,525
Hayward Hydroelectric
Sawyer County, WI
Unit 1 1,326
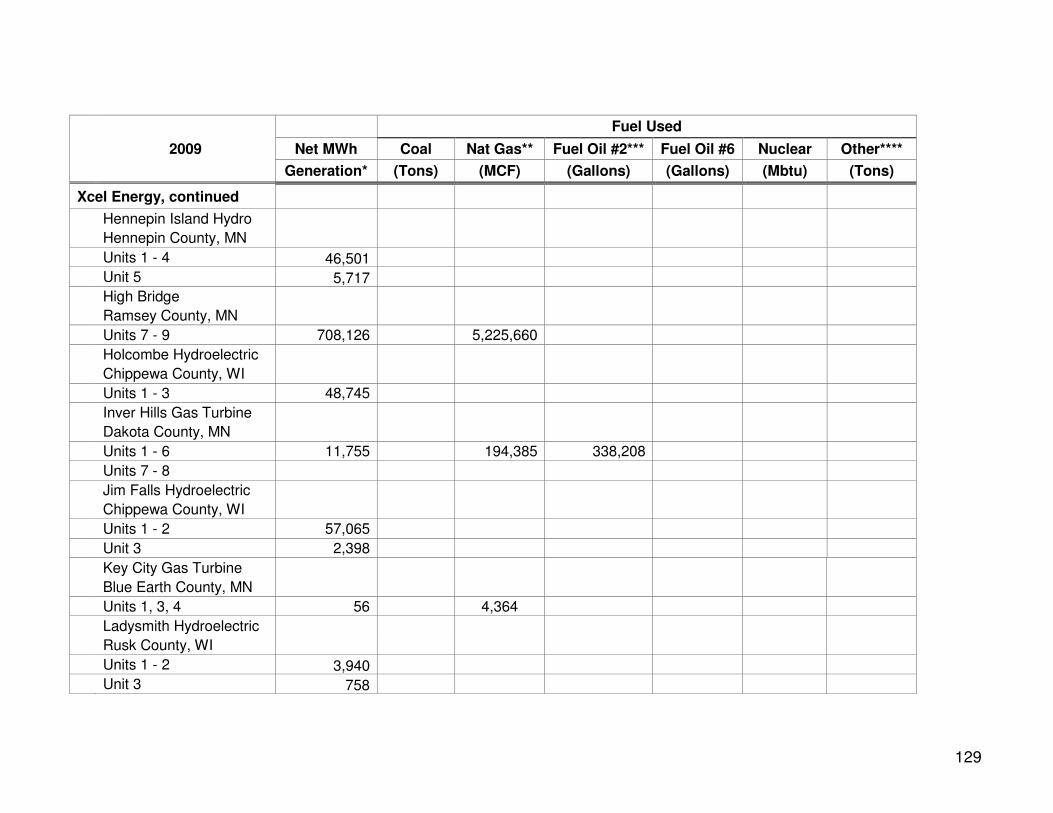
129
Fuel Used
2009 Net MWh Coal Nat Gas** Fuel Oil #2*** Fuel Oil #6 Nuclear Other****
Generation* (Tons) (MCF) (Gallons) (Gallons) (Mbtu) (Tons)
Xcel Energy, continued
Hennepin Island Hydro
Hennepin County, MN
Units 1 - 4 46,501
Unit 5 5,717
High Bridge
Ramsey County, MN
Units 7 - 9 708,126 5,225,660
Holcombe Hydroelectric
Chippewa County, WI
Units 1 - 3 48,745
Inver Hills Gas Turbine
Dakota County, MN
Units 1 - 6 11,755 194,385 338,208
Units 7 - 8
Jim Falls Hydroelectric
Chippewa County, WI
Units 1 - 2 57,065
Unit 3 2,398
Key City Gas Turbine
Blue Earth County, MN
Units 1, 3, 4 56 4,364
Ladysmith Hydroelectric
Rusk County, WI
Units 1 - 2 3,940
Unit 3 758
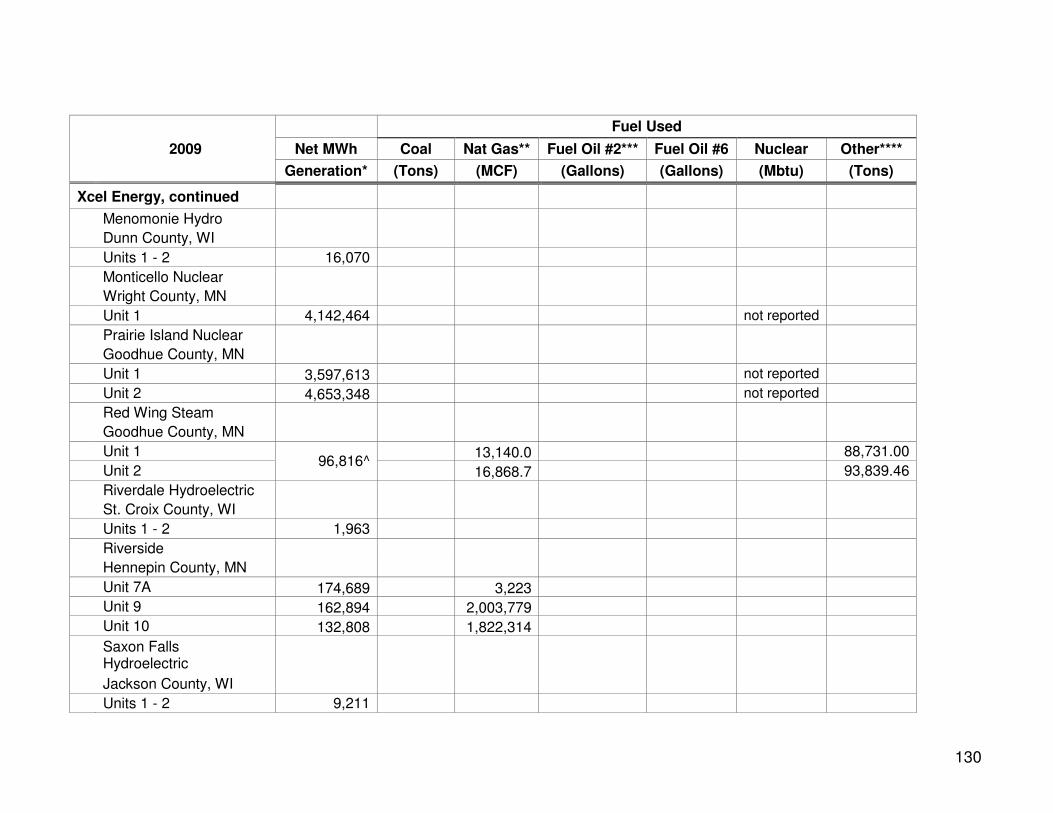
130
Fuel Used
2009 Net MWh Coal Nat Gas** Fuel Oil #2*** Fuel Oil #6 Nuclear Other****
Generation* (Tons) (MCF) (Gallons) (Gallons) (Mbtu) (Tons)
Xcel Energy, continued
Menomonie Hydro
Dunn County, WI
Units 1 - 2 16,070
Monticello Nuclear
Wright County, MN
Unit 1 4,142,464 not reported
Prairie Island Nuclear
Goodhue County, MN
Unit 1 3,597,613 not reported
Unit 2 4,653,348 not reported
Red Wing Steam
Goodhue County, MN
Unit 1 96,816^
13,140.0 88,731.00
Unit 2 16,868.7 93,839.46
Riverdale Hydroelectric
St. Croix County, WI
Units 1 - 2 1,963
Riverside
Hennepin County, MN
Unit 7A 174,689 3,223
Unit 9 162,894 2,003,779
Unit 10 132,808 1,822,314
Saxon Falls Hydroelectric
Jackson County, WI
Units 1 - 2 9,211
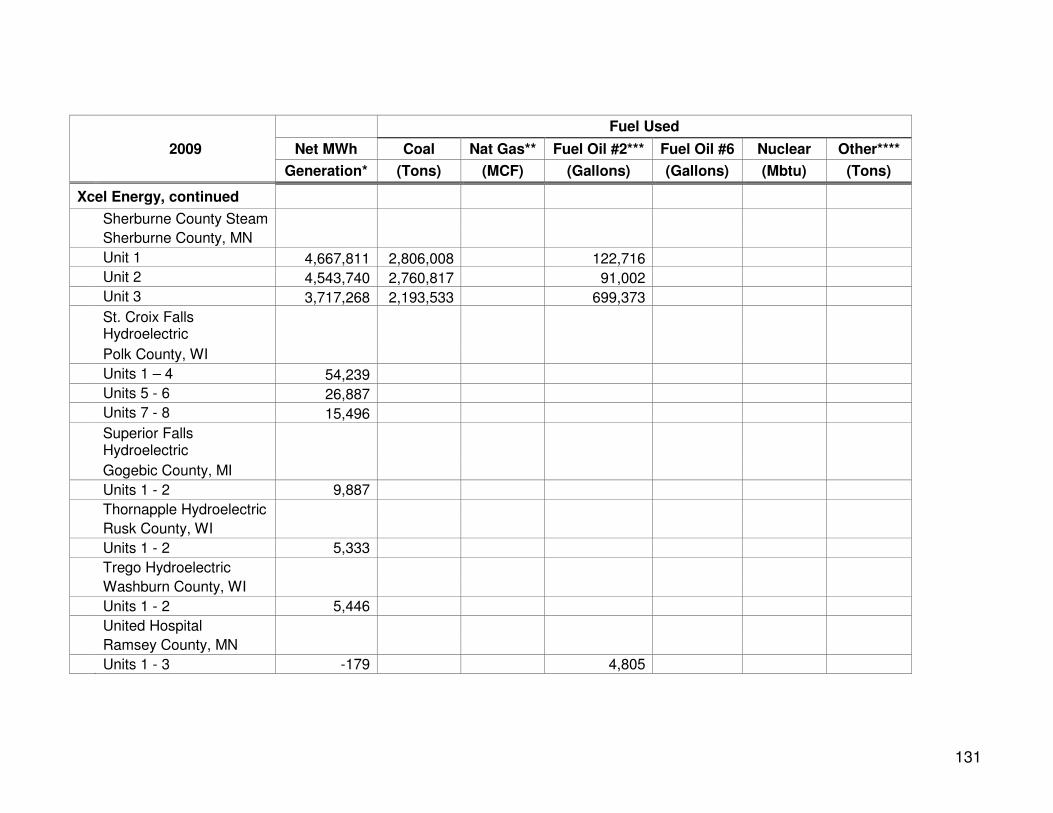
131
Fuel Used
2009 Net MWh Coal Nat Gas** Fuel Oil #2*** Fuel Oil #6 Nuclear Other****
Generation* (Tons) (MCF) (Gallons) (Gallons) (Mbtu) (Tons)
Xcel Energy, continued
Sherburne County Steam
Sherburne County, MN
Unit 1 4,667,811 2,806,008 122,716
Unit 2 4,543,740 2,760,817 91,002
Unit 3 3,717,268 2,193,533 699,373
St. Croix Falls Hydroelectric
Polk County, WI
Units 1 – 4 54,239
Units 5 - 6 26,887
Units 7 - 8 15,496
Superior Falls Hydroelectric
Gogebic County, MI
Units 1 - 2 9,887
Thornapple Hydroelectric
Rusk County, WI
Units 1 - 2 5,333
Trego Hydroelectric
Washburn County, WI
Units 1 - 2 5,446
United Hospital
Ramsey County, MN
Units 1 - 3 -179 4,805

132
Fuel Used
2009 Net MWh Coal Nat Gas** Fuel Oil #2*** Fuel Oil #6 Nuclear Other****
Generation* (Tons) (MCF) (Gallons) (Gallons) (Mbtu) (Tons)
Xcel Energy, continued
Wheaton
Chippewa County, WI
Units 1 - 6 10,835 165,056 344,672
White River Hydroelectric
Ashland County, WI
Units 1 - 2 3,307
Wilmarth Steam
Blue Earth County, MN
Unit 1 46,852 14,128 88,639
Unit 2 47,887 15,713 86,389
Wissota Hydroelectric
Chippewa County, WI
Units 1 - 6 75,597
Public Utility Totals 79,313,704 42,879,303 24,059,406 10,746,990 256,217 Not
reported 877,904
Notes for Table 10
* Net generation values of zero indicate less than one MWh of production; however, values are included in the Public Utility Total. Negative net generation values indicate that the unit’s electric consumption exceeded gross generation. However, these units did produce positive amounts of energy during the year.
** Natural gas includes the methane gas used by a few units.
*** Fuel Oil #2 includes Diesel Fuel.
**** “Other fuels” include wood, wood by-products, tire-derived and refuse-derived fuel.
^ Total for all units shown as combined.
.
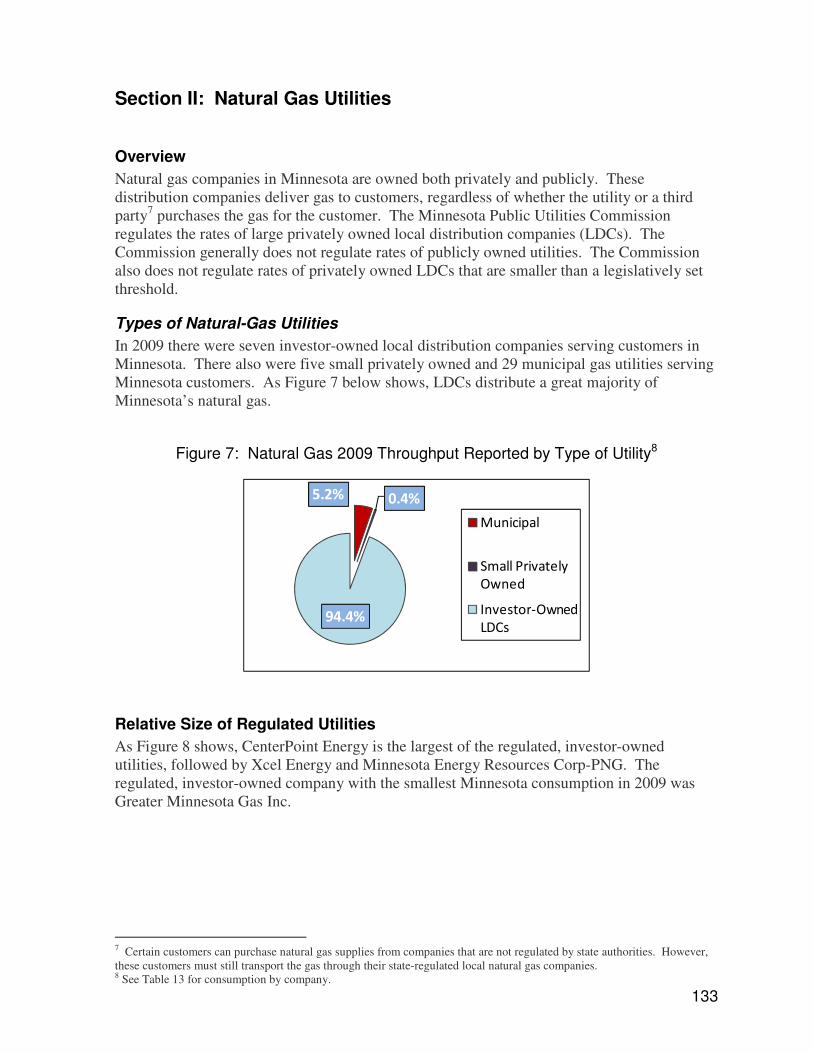
133
Section II: Natural Gas Utilities
Overview
Natural gas companies in Minnesota are owned both privately and publicly. These distribution companies deliver gas to customers, regardless of whether the utility or a third party7 purchases the gas for the customer. The Minnesota Public Utilities Commission regulates the rates of large privately owned local distribution companies (LDCs). The Commission generally does not regulate rates of publicly owned utilities. The Commission also does not regulate rates of privately owned LDCs that are smaller than a legislatively set threshold.
Types of Natural-Gas Utilities
In 2009 there were seven investor-owned local distribution companies serving customers in Minnesota. There also were five small privately owned and 29 municipal gas utilities serving Minnesota customers. As Figure 7 below shows, LDCs distribute a great majority of Minnesota’s natural gas.
Figure 7: Natural Gas 2009 Throughput Reported by Type of Utility8
5.2% 0.4%
94.4%
Municipal
Small Privately
Owned
Investor-Owned
LDCs
Relative Size of Regulated Utilities
As Figure 8 shows, CenterPoint Energy is the largest of the regulated, investor-owned utilities, followed by Xcel Energy and Minnesota Energy Resources Corp-PNG. The regulated, investor-owned company with the smallest Minnesota consumption in 2009 was Greater Minnesota Gas Inc.
7 Certain customers can purchase natural gas supplies from companies that are not regulated by state authorities. However, these customers must still transport the gas through their state-regulated local natural gas companies. 8 See Table 13 for consumption by company.
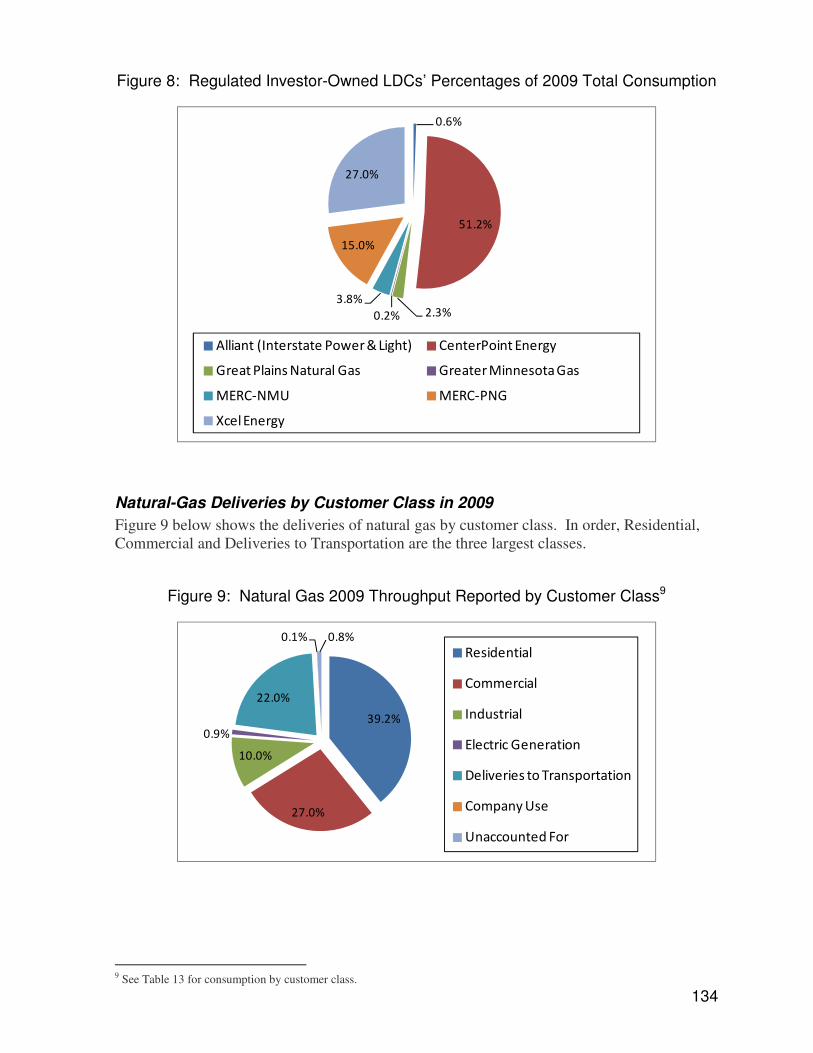
134
Figure 8: Regulated Investor-Owned LDCs’ Percentages of 2009 Total Consumption
0.6%
51.2%
2.3%0.2%
3.8%
15.0%
27.0%
Alliant (Interstate Power & Light) CenterPoint Energy
Great Plains Natural Gas Greater Minnesota Gas
MERC-NMU MERC-PNG
Xcel Energy
Natural-Gas Deliveries by Customer Class in 2009
Figure 9 below shows the deliveries of natural gas by customer class. In order, Residential, Commercial and Deliveries to Transportation are the three largest classes.
Figure 9: Natural Gas 2009 Throughput Reported by Customer Class9
39.2%
27.0%
10.0%
0.9%
22.0%
0.1% 0.8%
Residential
Commercial
Industrial
Electric Generation
Deliveries to Transportation
Company Use
Unaccounted For
9 See Table 13 for consumption by customer class.
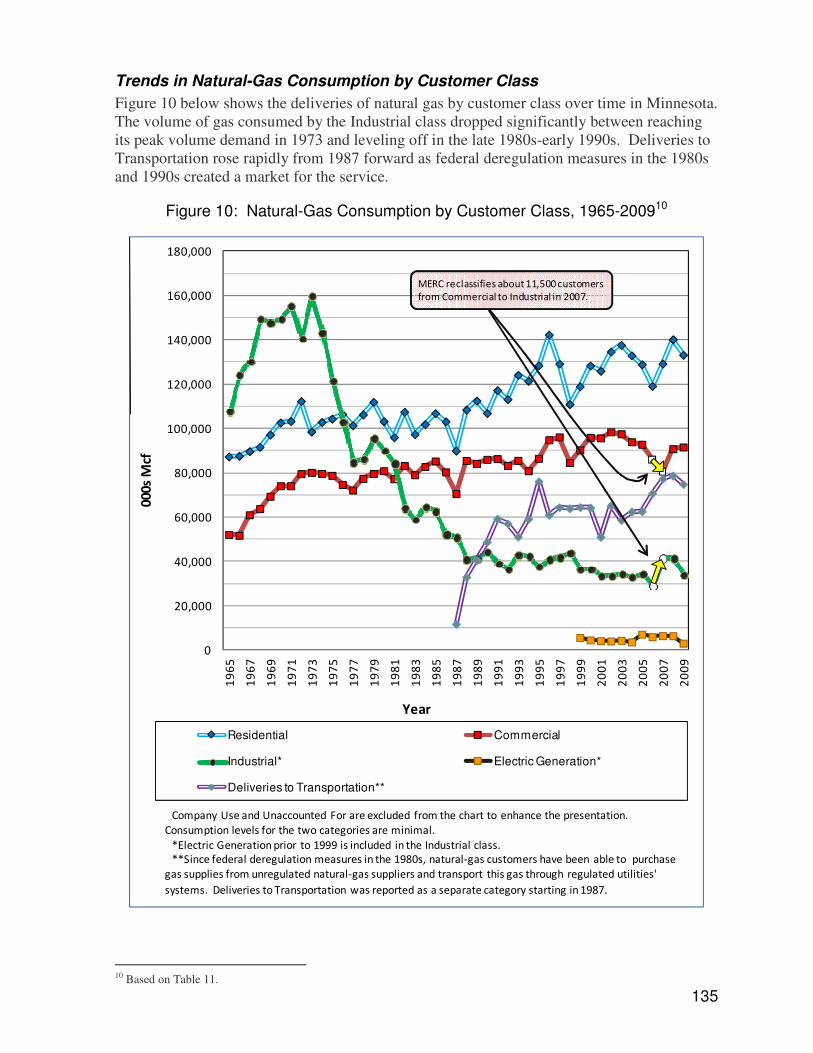
135
Trends in Natural-Gas Consumption by Customer Class
Figure 10 below shows the deliveries of natural gas by customer class over time in Minnesota. The volume of gas consumed by the Industrial class dropped significantly between reaching its peak volume demand in 1973 and leveling off in the late 1980s-early 1990s. Deliveries to Transportation rose rapidly from 1987 forward as federal deregulation measures in the 1980s and 1990s created a market for the service.
Figure 10: Natural-Gas Consumption by Customer Class, 1965-200910
0
20,000
40,000
60,000
80,000
100,000
120,000
140,000
160,000
180,000
19
65
19
67
19
69
19
71
19
73
19
75
19
77
19
79
19
81
19
83
19
85
19
87
19
89
19
91
19
93
19
95
19
97
19
99
20
01
20
03
20
05
20
07
20
09
00
0s
Mcf
Year
Residential Commercial
Industrial* Electric Generation*
Deliveries to Transportation**
MERC reclassifies about 11,500 customers
from Commercial to Industrial in 2007.
Company Use and Unaccounted For are excluded from the chart to enhance the presentation.
Consumption levels for the two categories are minimal.
*Electric Generation prior to 1999 is included in the Industrial class.
**Since federal deregulation measures in the 1980s, natural-gas customers have been able to purchase
gas supplies from unregulated natural-gas suppliers and transport this gas through regulated utilities'
systems. Deliveries to Transportation was reported as a separate category starting in 1987.
10 Based on Table 11.
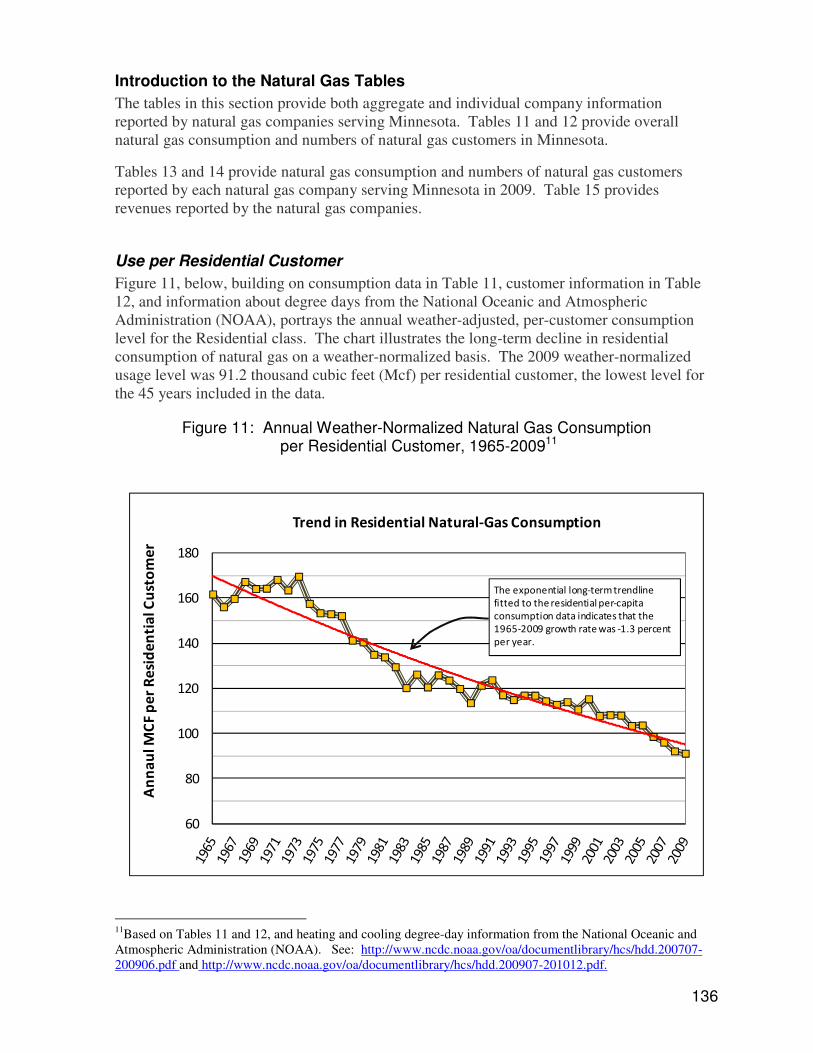
136
Introduction to the Natural Gas Tables
The tables in this section provide both aggregate and individual company information reported by natural gas companies serving Minnesota. Tables 11 and 12 provide overall natural gas consumption and numbers of natural gas customers in Minnesota.
Tables 13 and 14 provide natural gas consumption and numbers of natural gas customers reported by each natural gas company serving Minnesota in 2009. Table 15 provides revenues reported by the natural gas companies.
Use per Residential Customer
Figure 11, below, building on consumption data in Table 11, customer information in Table 12, and information about degree days from the National Oceanic and Atmospheric Administration (NOAA), portrays the annual weather-adjusted, per-customer consumption level for the Residential class. The chart illustrates the long-term decline in residential consumption of natural gas on a weather-normalized basis. The 2009 weather-normalized usage level was 91.2 thousand cubic feet (Mcf) per residential customer, the lowest level for the 45 years included in the data.
Figure 11: Annual Weather-Normalized Natural Gas Consumption per Residential Customer, 1965-200911
60
80
100
120
140
160
180
An
na
ul M
CF p
er
Re
sid
en
tia
l C
ust
om
er
Trend in Residential Natural-Gas Consumption
The exponential long-term trendline
fitted to the residential per-capita
consumption data indicates that the
1965-2009 growth rate was -1.3 percent
per year.
11Based on Tables 11 and 12, and heating and cooling degree-day information from the National Oceanic and Atmospheric Administration (NOAA). See: http://www.ncdc.noaa.gov/oa/documentlibrary/hcs/hdd.200707-200906.pdf and http://www.ncdc.noaa.gov/oa/documentlibrary/hcs/hdd.200907-201012.pdf.

137
Other Sources
The United States Energy Information Administration (EIA) has additional information about Minnesota natural-gas sources and consumption. The following link will take you to the Minnesota profile page: http://www.eia.gov/state/?sid=MN.
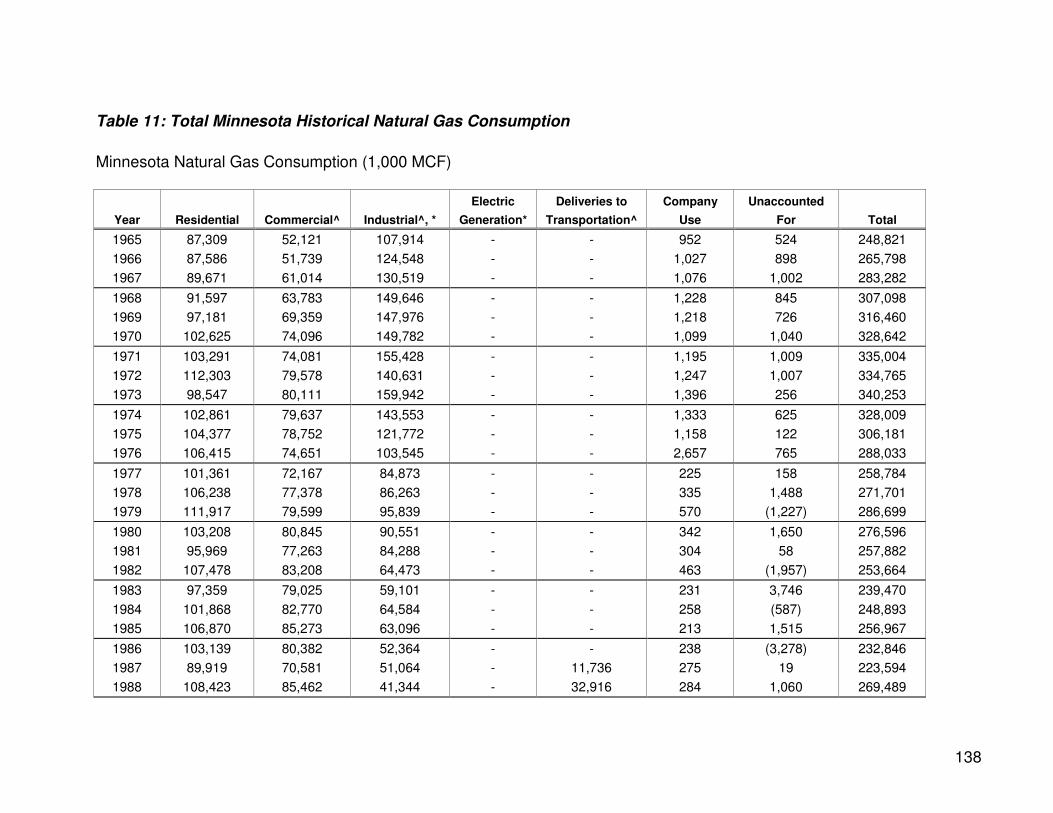
138
Table 11: Total Minnesota Historical Natural Gas Consumption
Minnesota Natural Gas Consumption (1,000 MCF)
Year Residential Commercial^ Industrial^, *
Electric
Generation*
Deliveries to
Transportation^
Company
Use
Unaccounted
For Total
1965 87,309 52,121 107,914 - - 952 524 248,821
1966 87,586 51,739 124,548 - - 1,027 898 265,798
1967 89,671 61,014 130,519 - - 1,076 1,002 283,282
1968 91,597 63,783 149,646 - - 1,228 845 307,098
1969 97,181 69,359 147,976 - - 1,218 726 316,460
1970 102,625 74,096 149,782 - - 1,099 1,040 328,642
1971 103,291 74,081 155,428 - - 1,195 1,009 335,004
1972 112,303 79,578 140,631 - - 1,247 1,007 334,765
1973 98,547 80,111 159,942 - - 1,396 256 340,253
1974 102,861 79,637 143,553 - - 1,333 625 328,009
1975 104,377 78,752 121,772 - - 1,158 122 306,181
1976 106,415 74,651 103,545 - - 2,657 765 288,033
1977 101,361 72,167 84,873 - - 225 158 258,784
1978 106,238 77,378 86,263 - - 335 1,488 271,701
1979 111,917 79,599 95,839 - - 570 (1,227) 286,699
1980 103,208 80,845 90,551 - - 342 1,650 276,596
1981 95,969 77,263 84,288 - - 304 58 257,882
1982 107,478 83,208 64,473 - - 463 (1,957) 253,664
1983 97,359 79,025 59,101 - - 231 3,746 239,470
1984 101,868 82,770 64,584 - - 258 (587) 248,893
1985 106,870 85,273 63,096 - - 213 1,515 256,967
1986 103,139 80,382 52,364 - - 238 (3,278) 232,846
1987 89,919 70,581 51,064 - 11,736 275 19 223,594
1988 108,423 85,462 41,344 - 32,916 284 1,060 269,489
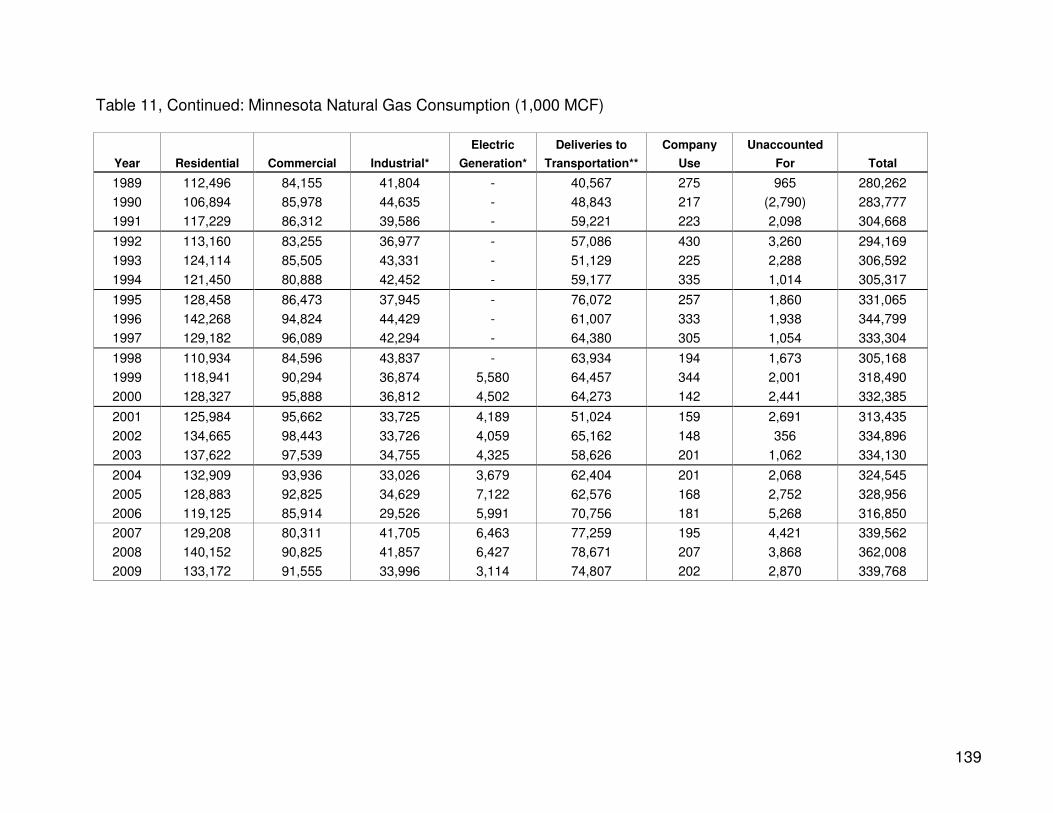
139
Table 11, Continued: Minnesota Natural Gas Consumption (1,000 MCF)
Year Residential Commercial Industrial*
Electric
Generation*
Deliveries to
Transportation**
Company
Use
Unaccounted
For Total
1989 112,496 84,155 41,804 - 40,567 275 965 280,262
1990 106,894 85,978 44,635 - 48,843 217 (2,790) 283,777
1991 117,229 86,312 39,586 - 59,221 223 2,098 304,668
1992 113,160 83,255 36,977 - 57,086 430 3,260 294,169
1993 124,114 85,505 43,331 - 51,129 225 2,288 306,592
1994 121,450 80,888 42,452 - 59,177 335 1,014 305,317
1995 128,458 86,473 37,945 - 76,072 257 1,860 331,065
1996 142,268 94,824 44,429 - 61,007 333 1,938 344,799
1997 129,182 96,089 42,294 - 64,380 305 1,054 333,304
1998 110,934 84,596 43,837 - 63,934 194 1,673 305,168
1999 118,941 90,294 36,874 5,580 64,457 344 2,001 318,490
2000 128,327 95,888 36,812 4,502 64,273 142 2,441 332,385
2001 125,984 95,662 33,725 4,189 51,024 159 2,691 313,435
2002 134,665 98,443 33,726 4,059 65,162 148 356 334,896
2003 137,622 97,539 34,755 4,325 58,626 201 1,062 334,130
2004 132,909 93,936 33,026 3,679 62,404 201 2,068 324,545
2005 128,883 92,825 34,629 7,122 62,576 168 2,752 328,956
2006 119,125 85,914 29,526 5,991 70,756 181 5,268 316,850
2007 129,208 80,311 41,705 6,463 77,259 195 4,421 339,562
2008 140,152 90,825 41,857 6,427 78,671 207 3,868 362,008
2009 133,172 91,555 33,996 3,114 74,807 202 2,870 339,768
140
Notes for Table 11
^ MERC reclassified about 3,000 NMU customers from Commercial Firm to Industrial Firm and about 8,500 PNG customers from Commercial Firm to Industrial Firm upon taking over operation of the service areas from Aquila.
*Electric Generation was included in Industrial prior to 1999.
** Some natural gas customers purchase gas supplies from unregulated natural gas suppliers and transport this gas through regulated utilities’ systems. Deliveries to Transportation was first reported as a separate category in 1987.
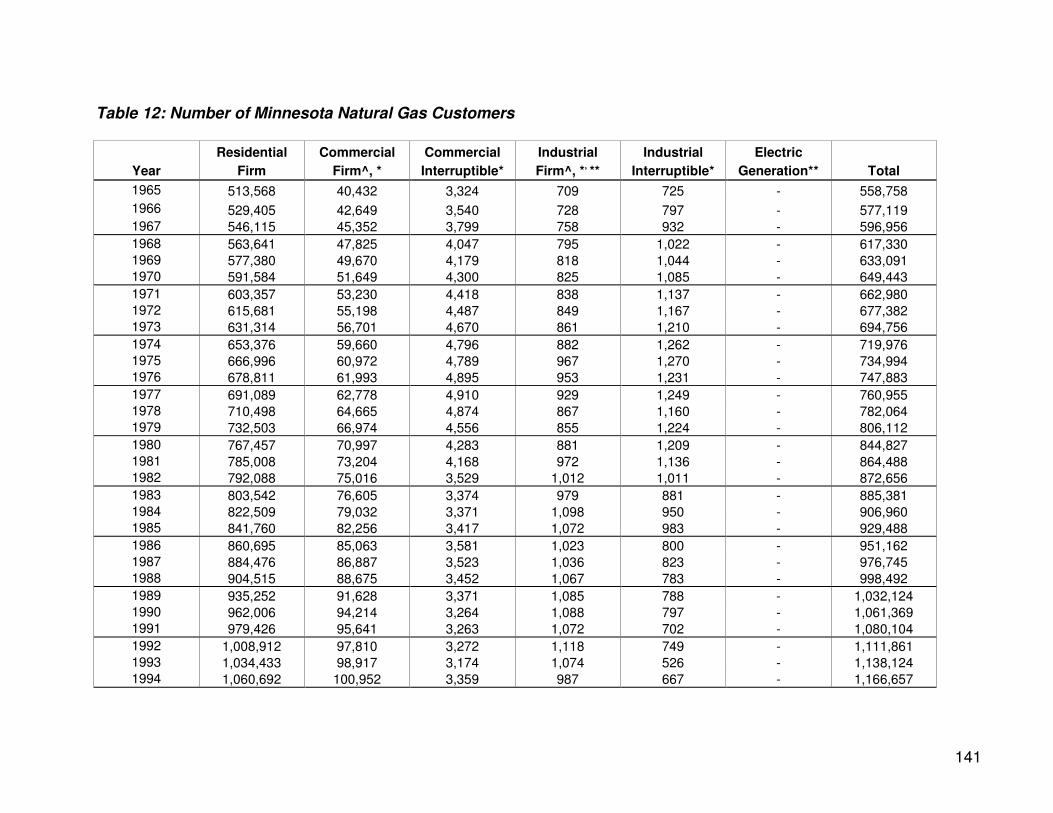
141
Table 12: Number of Minnesota Natural Gas Customers
Year
Residential
Firm
Commercial
Firm^, *
Commercial
Interruptible*
Industrial
Firm^, *, **
Industrial
Interruptible*
Electric
Generation** Total
1965 513,568 40,432 3,324 709 725 - 558,758
1966 529,405 42,649 3,540 728 797 - 577,119 1967 546,115 45,352 3,799 758 932 - 596,956
1968 563,641 47,825 4,047 795 1,022 - 617,330 1969 577,380 49,670 4,179 818 1,044 - 633,091 1970 591,584 51,649 4,300 825 1,085 - 649,443
1971 603,357 53,230 4,418 838 1,137 - 662,980 1972 615,681 55,198 4,487 849 1,167 - 677,382 1973 631,314 56,701 4,670 861 1,210 - 694,756
1974 653,376 59,660 4,796 882 1,262 - 719,976 1975 666,996 60,972 4,789 967 1,270 - 734,994 1976 678,811 61,993 4,895 953 1,231 - 747,883
1977 691,089 62,778 4,910 929 1,249 - 760,955 1978 710,498 64,665 4,874 867 1,160 - 782,064 1979 732,503 66,974 4,556 855 1,224 - 806,112
1980 767,457 70,997 4,283 881 1,209 - 844,827 1981 785,008 73,204 4,168 972 1,136 - 864,488 1982 792,088 75,016 3,529 1,012 1,011 - 872,656
1983 803,542 76,605 3,374 979 881 - 885,381 1984 822,509 79,032 3,371 1,098 950 - 906,960 1985 841,760 82,256 3,417 1,072 983 - 929,488
1986 860,695 85,063 3,581 1,023 800 - 951,162 1987 884,476 86,887 3,523 1,036 823 - 976,745 1988 904,515 88,675 3,452 1,067 783 - 998,492
1989 935,252 91,628 3,371 1,085 788 - 1,032,124 1990 962,006 94,214 3,264 1,088 797 - 1,061,369 1991 979,426 95,641 3,263 1,072 702 - 1,080,104
1992 1,008,912 97,810 3,272 1,118 749 - 1,111,861 1993 1,034,433 98,917 3,174 1,074 526 - 1,138,124 1994 1,060,692 100,952 3,359 987 667 - 1,166,657

142
Table 12, Continued: Minnesota Natural Gas Customers
Year Residential
Firm Commercial
Firm^, * Commercial Interruptible*
Industrial Firm^, *, **
Industrial Interruptible*
Electric Generation** Total
1995 1,091,477 102,097 3,343 814 672 - 1,198,403 1996 1,124,739 105,158 3,471 842 773 - 1,234,983 1997 1,151,421 107,223 3,422 772 753 - 1,263,591
1998 1,176,228 109,220 3,718 610 832 - 1,290,612 1999 1,201,349 115,901 3,875 442 986 31 1,340,315 2000 1,238,679 114,271 3,917 628 898 31 1,358,424
2001 1,263,214 116,640 3,951 661 853 32 1,385,351 2002 1,293,734 119,032 3,974 658 785 39 1,418,222 2003 1,323,721 120,598 3,882 689 809 40 1,449,739
2004 1,354,242 122,898 3,823 701 815 40 1,482,519 2005 1,378,515 123,659 3,903 704 770 42 1,507,593 2006 1,402,701 126,056 3,808 703 741 42 1,534,051 2007^ 1,410,202 115,193 3,287 12,356 1,218 40 1,542,296 2008 1,422,261 117,023 3,810 12,342 694 40 1,556,163 2009 1,430,394 117,383 3,133 12,473 1,374 32 1,564,789
Notes for Table 12
^MERC reclassified about 3,000 NMU customers from Commercial Firm to Industrial Firm and about 8,500 PNG customers from Commercial Firm to Industrial Firm upon taking over operation of the service areas from Aquila in 2007.
*Sales and transportation customers are combined in these customer-class values.
**Electric Generation is included in Industrial Firm prior to 1999.

143
Table 13: Minnesota Natural Gas Consumption by Company
Minnesota Natural Gas Consumption (MCF) by Company in 2009
2009 Residential Commercial Industrial Company
Use Unaccounted
For
Deliveries to Transportation
Customers Electric
Generation Total
Alliant Energy 835,087 641,753 263,702 1,060 (16,558) 61,853 0 1,786,897
Argyle, City of 17,376 8,582 0 0 0 0 0 25,958
Austin Utilities 1,169,770 383,973 818,194 19,248 * 0 * 2,417,120
Bagley Public Utilities 20,986 45,242 0 0 0 0 0 66,228
CenterPoint Energy 70,411,361 52,016,092 8,646,510 90,947 1,255,289 29,739,264 1,981,610 164,141,073
Circle Pines Utility dba Centennial Utilities
224,856 167,698 0 4,721 17,253 387,885 0 802,413
Cohasset, City of 54,216 21,732 30,103 0 0 0 0 106,051
Community Utilities Co. Inc.
64,697 26,774 25,551 0 0 0 0 117,022
Duluth Dept of Public Works & Utilities
2,617,107 1,480,536 729,140 0 0 189,529 0 5,016,311
Eagle Bend/Clarissa 32,825 62,673 0 0 0 0 0 95,498
Fairfax Municipal Utility 68,617 39,738 5,625 0 0 161,213 0 275,193
Fosston Municipal Utilities 22,450 28,048 162,876 0 0 0 0 213,374
Goodhue PUC 41,905 41,059 0 0 0 0 0 82,964
Great Plains Nat Gas Co 1,519,241 1,820,519 1,130,690 0 0 2,889,241 0 7,359,691
Greater Minnesota Gas, Inc.
305,405 33,167 120,341 0 0 24,872 0 483,785
Hallock, City of 46,599 15,690 0 0 0 0 0 62,289
Hawley Public Utilities 39,568 51,676 0 0 1,082 0 0 92,326
Henning Municipal Gas 35,003 30,446 0 0 0 0 0 65,449
Hibbing PUC 384,006 301,471 0 0 * 0 * 710,529
Hutchinson Utility Comm 444,371 420,843 770,258 12,230 (1,722) 0 62,927 1,708,907
Lake Park Public Utilities 21,100 14,260 0 0 0 0 0 35,360
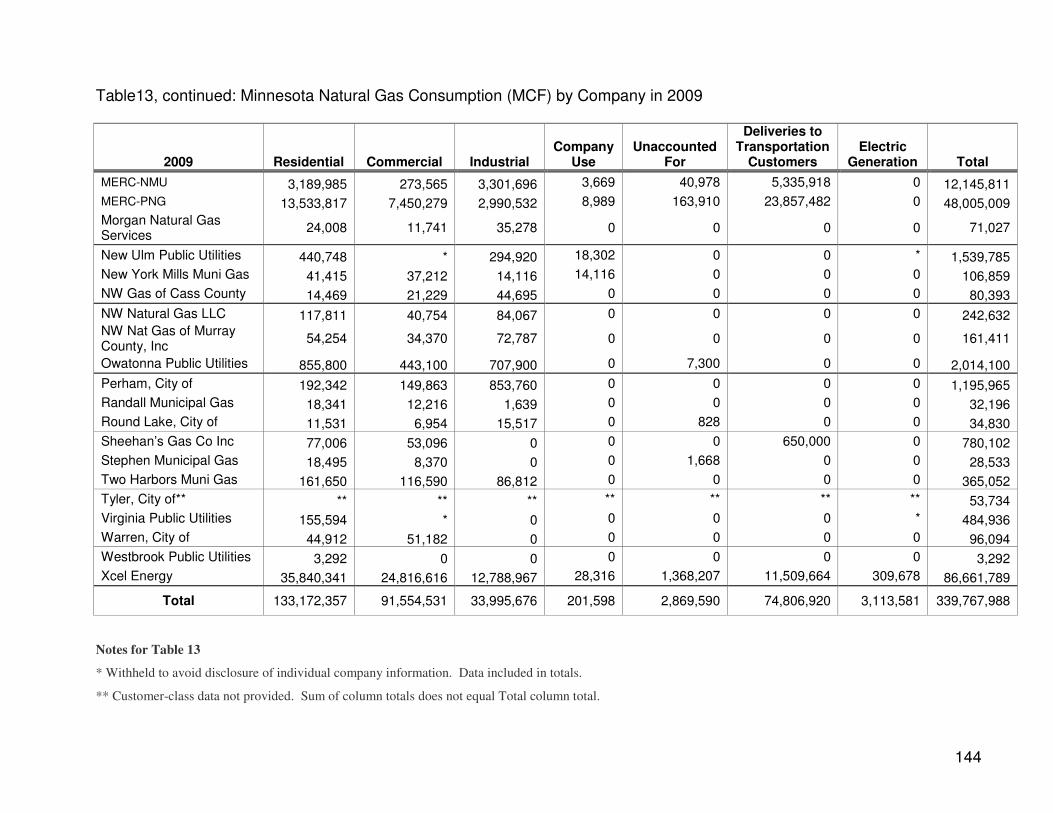
144
Table13, continued: Minnesota Natural Gas Consumption (MCF) by Company in 2009
2009 Residential Commercial Industrial Company
Use Unaccounted
For
Deliveries to Transportation
Customers Electric
Generation Total
MERC-NMU 3,189,985 273,565 3,301,696 3,669 40,978 5,335,918 0 12,145,811
MERC-PNG 13,533,817 7,450,279 2,990,532 8,989 163,910 23,857,482 0 48,005,009
Morgan Natural Gas Services
24,008 11,741 35,278 0 0 0 0 71,027
New Ulm Public Utilities 440,748 * 294,920 18,302 0 0 * 1,539,785
New York Mills Muni Gas 41,415 37,212 14,116 14,116 0 0 0 106,859
NW Gas of Cass County 14,469 21,229 44,695 0 0 0 0 80,393
NW Natural Gas LLC 117,811 40,754 84,067 0 0 0 0 242,632 NW Nat Gas of Murray County, Inc
54,254 34,370 72,787 0 0 0 0 161,411
Owatonna Public Utilities 855,800 443,100 707,900 0 7,300 0 0 2,014,100
Perham, City of 192,342 149,863 853,760 0 0 0 0 1,195,965
Randall Municipal Gas 18,341 12,216 1,639 0 0 0 0 32,196
Round Lake, City of 11,531 6,954 15,517 0 828 0 0 34,830
Sheehan’s Gas Co Inc 77,006 53,096 0 0 0 650,000 0 780,102
Stephen Municipal Gas 18,495 8,370 0 0 1,668 0 0 28,533
Two Harbors Muni Gas 161,650 116,590 86,812 0 0 0 0 365,052
Tyler, City of** ** ** ** ** ** ** ** 53,734
Virginia Public Utilities 155,594 * 0 0 0 0 * 484,936
Warren, City of 44,912 51,182 0 0 0 0 0 96,094
Westbrook Public Utilities 3,292 0 0 0 0 0 0 3,292
Xcel Energy 35,840,341 24,816,616 12,788,967 28,316 1,368,207 11,509,664 309,678 86,661,789
Total 133,172,357 91,554,531 33,995,676 201,598 2,869,590 74,806,920 3,113,581 339,767,988
Notes for Table 13
* Withheld to avoid disclosure of individual company information. Data included in totals.
** Customer-class data not provided. Sum of column totals does not equal Total column total.
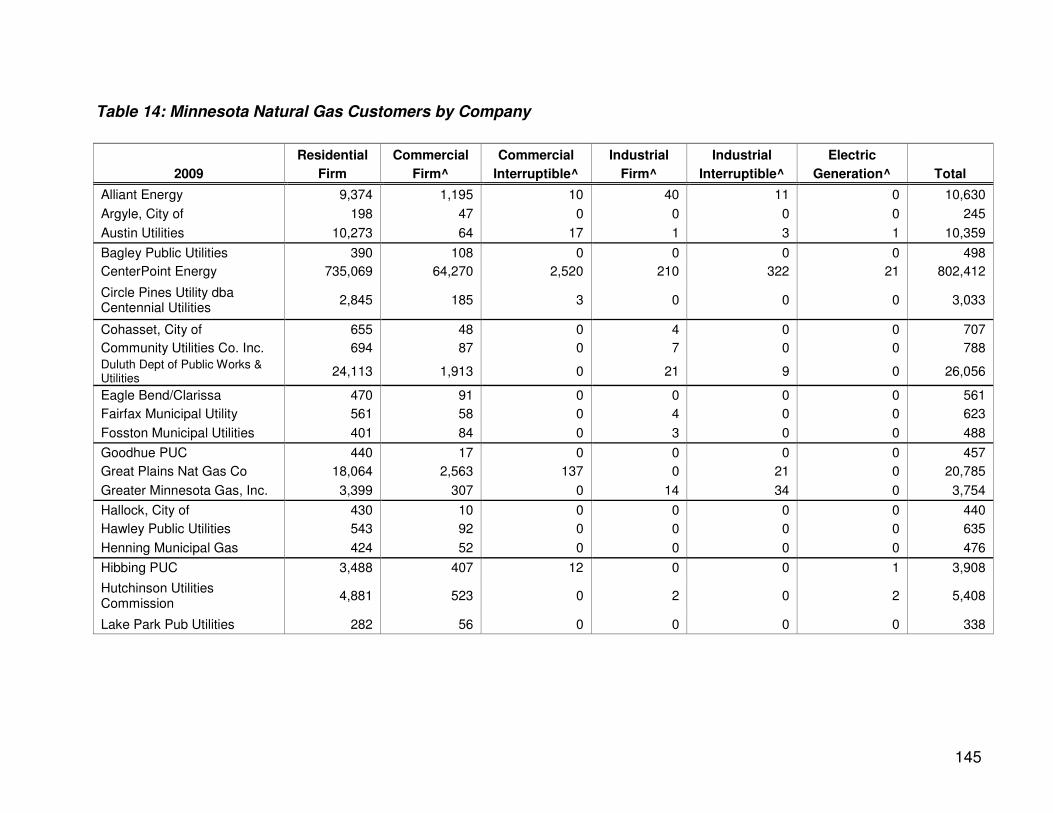
145
Table 14: Minnesota Natural Gas Customers by Company
2009
Residential
Firm
Commercial
Firm^
Commercial
Interruptible^
Industrial
Firm^
Industrial
Interruptible^
Electric
Generation^ Total
Alliant Energy 9,374 1,195 10 40 11 0 10,630
Argyle, City of 198 47 0 0 0 0 245
Austin Utilities 10,273 64 17 1 3 1 10,359
Bagley Public Utilities 390 108 0 0 0 0 498
CenterPoint Energy 735,069 64,270 2,520 210 322 21 802,412
Circle Pines Utility dba Centennial Utilities
2,845 185 3 0 0 0 3,033
Cohasset, City of 655 48 0 4 0 0 707
Community Utilities Co. Inc. 694 87 0 7 0 0 788 Duluth Dept of Public Works & Utilities
24,113 1,913 0 21 9 0 26,056
Eagle Bend/Clarissa 470 91 0 0 0 0 561
Fairfax Municipal Utility 561 58 0 4 0 0 623
Fosston Municipal Utilities 401 84 0 3 0 0 488
Goodhue PUC 440 17 0 0 0 0 457
Great Plains Nat Gas Co 18,064 2,563 137 0 21 0 20,785
Greater Minnesota Gas, Inc. 3,399 307 0 14 34 0 3,754
Hallock, City of 430 10 0 0 0 0 440
Hawley Public Utilities 543 92 0 0 0 0 635
Henning Municipal Gas 424 52 0 0 0 0 476
Hibbing PUC 3,488 407 12 0 0 1 3,908
Hutchinson Utilities Commission
4,881 523 0 2 0 2 5,408
Lake Park Pub Utilities 282 56 0 0 0 0 338
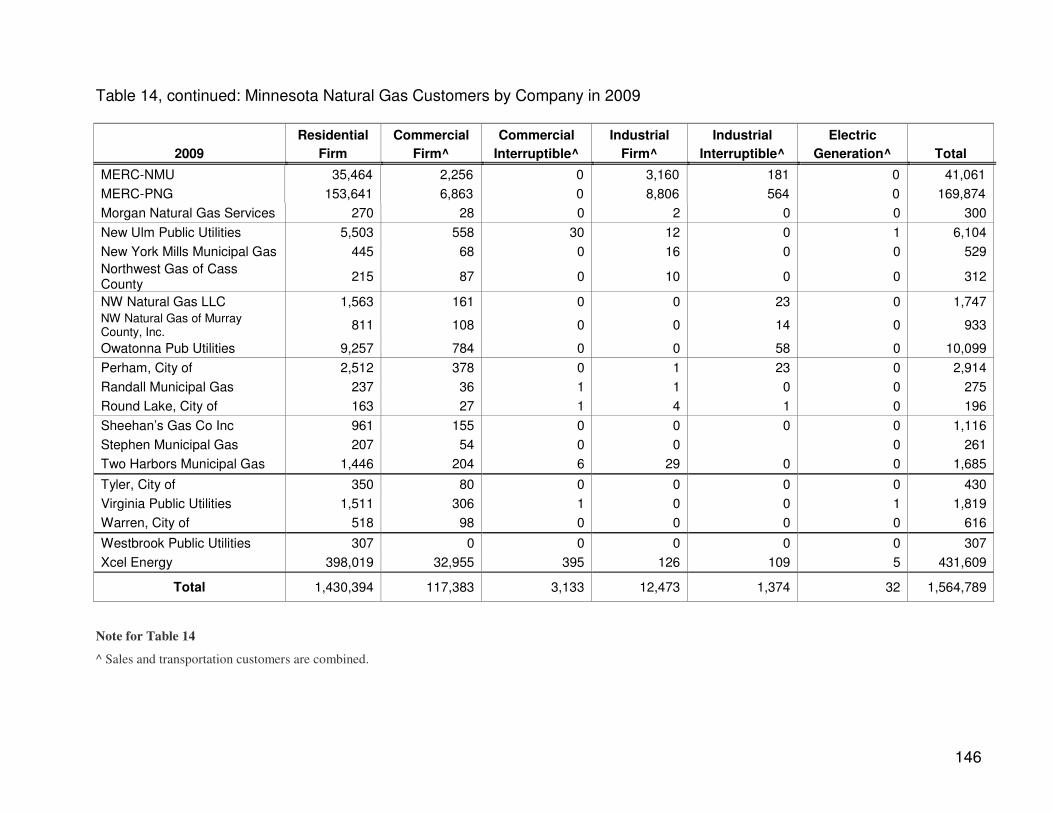
146
Table 14, continued: Minnesota Natural Gas Customers by Company in 2009
2009
Residential
Firm
Commercial
Firm^
Commercial
Interruptible^
Industrial
Firm^
Industrial
Interruptible^
Electric
Generation^ Total
MERC-NMU 35,464 2,256 0 3,160 181 0 41,061
MERC-PNG 153,641 6,863 0 8,806 564 0 169,874
Morgan Natural Gas Services 270 28 0 2 0 0 300
New Ulm Public Utilities 5,503 558 30 12 0 1 6,104
New York Mills Municipal Gas 445 68 0 16 0 0 529
Northwest Gas of Cass County
215 87 0 10 0 0 312
NW Natural Gas LLC 1,563 161 0 0 23 0 1,747 NW Natural Gas of Murray County, Inc.
811 108 0 0 14 0 933
Owatonna Pub Utilities 9,257 784 0 0 58 0 10,099
Perham, City of 2,512 378 0 1 23 0 2,914
Randall Municipal Gas 237 36 1 1 0 0 275
Round Lake, City of 163 27 1 4 1 0 196
Sheehan’s Gas Co Inc 961 155 0 0 0 0 1,116
Stephen Municipal Gas 207 54 0 0 0 261
Two Harbors Municipal Gas 1,446 204 6 29 0 0 1,685
Tyler, City of 350 80 0 0 0 0 430
Virginia Public Utilities 1,511 306 1 0 0 1 1,819
Warren, City of 518 98 0 0 0 0 616
Westbrook Public Utilities 307 0 0 0 0 0 307
Xcel Energy 398,019 32,955 395 126 109 5 431,609
Total 1,430,394 117,383 3,133 12,473 1,374 32 1,564,789
Note for Table 14
^ Sales and transportation customers are combined.
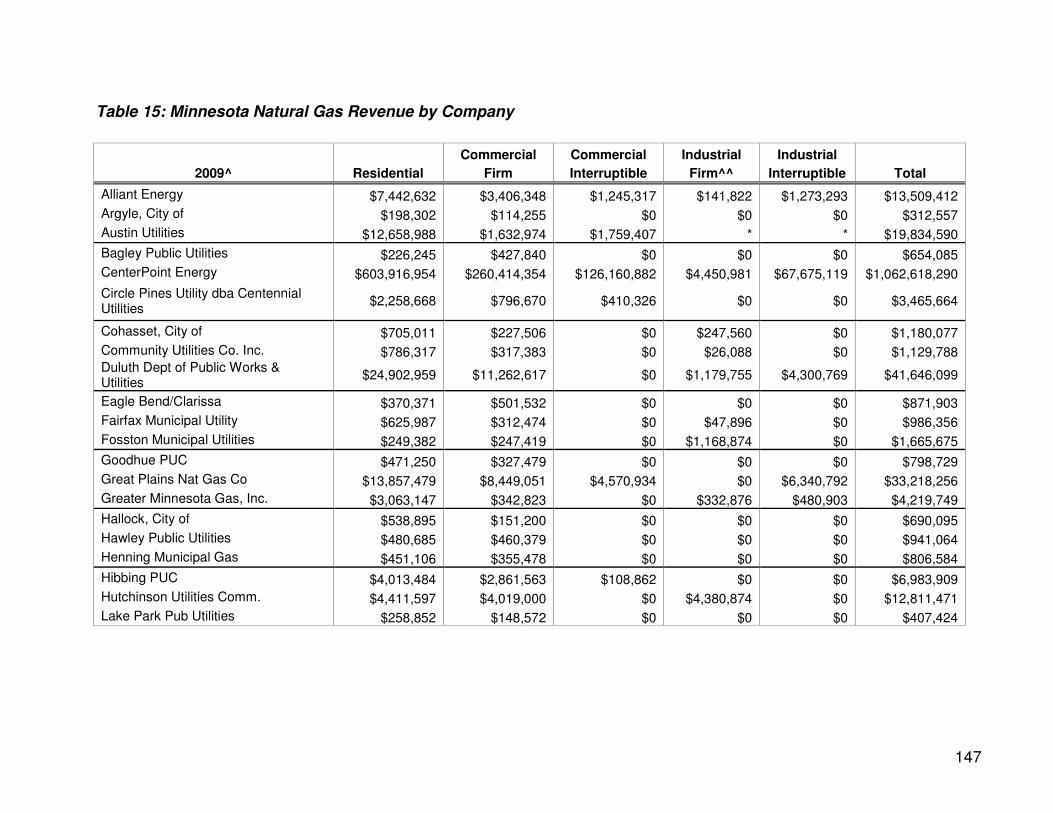
147
Table 15: Minnesota Natural Gas Revenue by Company
2009^ Residential
Commercial
Firm
Commercial
Interruptible
Industrial
Firm^^
Industrial
Interruptible Total
Alliant Energy $7,442,632 $3,406,348 $1,245,317 $141,822 $1,273,293 $13,509,412
Argyle, City of $198,302 $114,255 $0 $0 $0 $312,557
Austin Utilities $12,658,988 $1,632,974 $1,759,407 * * $19,834,590
Bagley Public Utilities $226,245 $427,840 $0 $0 $0 $654,085
CenterPoint Energy $603,916,954 $260,414,354 $126,160,882 $4,450,981 $67,675,119 $1,062,618,290
Circle Pines Utility dba Centennial Utilities
$2,258,668 $796,670 $410,326 $0 $0 $3,465,664
Cohasset, City of $705,011 $227,506 $0 $247,560 $0 $1,180,077
Community Utilities Co. Inc. $786,317 $317,383 $0 $26,088 $0 $1,129,788 Duluth Dept of Public Works & Utilities
$24,902,959 $11,262,617 $0 $1,179,755 $4,300,769 $41,646,099
Eagle Bend/Clarissa $370,371 $501,532 $0 $0 $0 $871,903
Fairfax Municipal Utility $625,987 $312,474 $0 $47,896 $0 $986,356
Fosston Municipal Utilities $249,382 $247,419 $0 $1,168,874 $0 $1,665,675
Goodhue PUC $471,250 $327,479 $0 $0 $0 $798,729
Great Plains Nat Gas Co $13,857,479 $8,449,051 $4,570,934 $0 $6,340,792 $33,218,256
Greater Minnesota Gas, Inc. $3,063,147 $342,823 $0 $332,876 $480,903 $4,219,749
Hallock, City of $538,895 $151,200 $0 $0 $0 $690,095
Hawley Public Utilities $480,685 $460,379 $0 $0 $0 $941,064
Henning Municipal Gas $451,106 $355,478 $0 $0 $0 $806,584
Hibbing PUC $4,013,484 $2,861,563 $108,862 $0 $0 $6,983,909
Hutchinson Utilities Comm. $4,411,597 $4,019,000 $0 $4,380,874 $0 $12,811,471
Lake Park Pub Utilities $258,852 $148,572 $0 $0 $0 $407,424
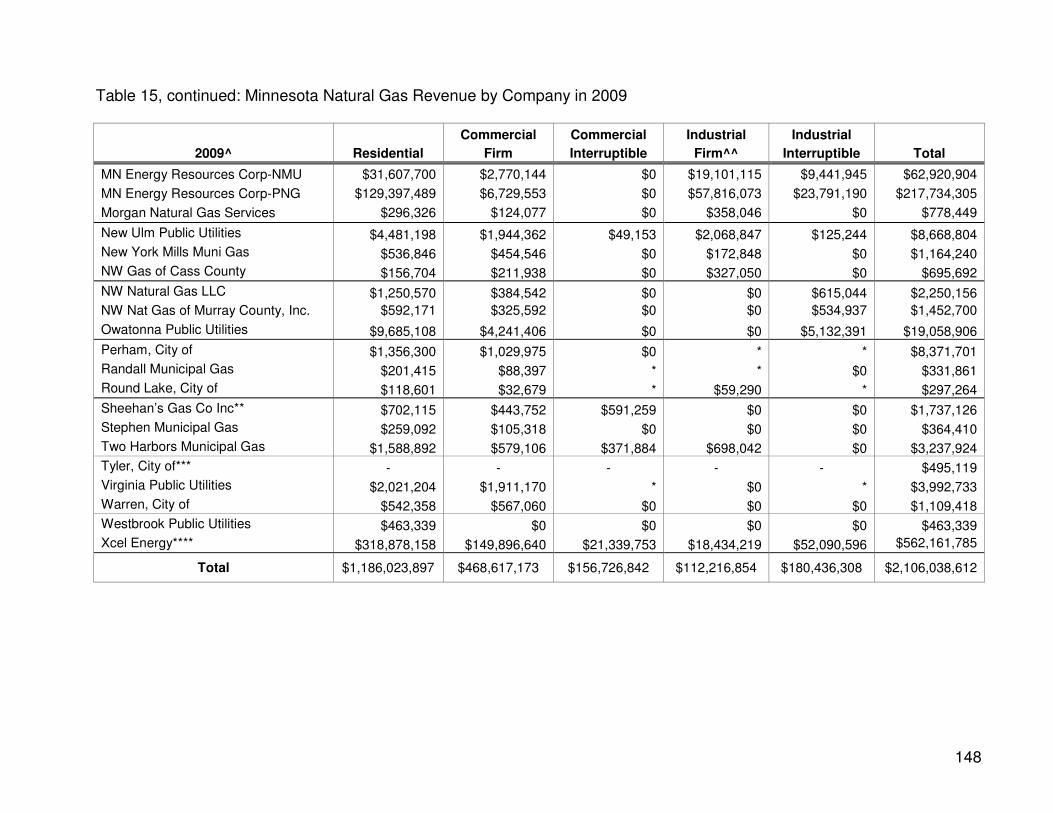
148
Table 15, continued: Minnesota Natural Gas Revenue by Company in 2009
2009^ Residential
Commercial
Firm
Commercial
Interruptible
Industrial
Firm^^
Industrial
Interruptible Total
MN Energy Resources Corp-NMU $31,607,700 $2,770,144 $0 $19,101,115 $9,441,945 $62,920,904
MN Energy Resources Corp-PNG $129,397,489 $6,729,553 $0 $57,816,073 $23,791,190 $217,734,305
Morgan Natural Gas Services $296,326 $124,077 $0 $358,046 $0 $778,449
New Ulm Public Utilities $4,481,198 $1,944,362 $49,153 $2,068,847 $125,244 $8,668,804
New York Mills Muni Gas $536,846 $454,546 $0 $172,848 $0 $1,164,240
NW Gas of Cass County $156,704 $211,938 $0 $327,050 $0 $695,692
NW Natural Gas LLC $1,250,570 $384,542 $0 $0 $615,044 $2,250,156
NW Nat Gas of Murray County, Inc. $592,171 $325,592 $0 $0 $534,937 $1,452,700
Owatonna Public Utilities $9,685,108 $4,241,406 $0 $0 $5,132,391 $19,058,906
Perham, City of $1,356,300 $1,029,975 $0 * * $8,371,701
Randall Municipal Gas $201,415 $88,397 * * $0 $331,861
Round Lake, City of $118,601 $32,679 * $59,290 * $297,264
Sheehan’s Gas Co Inc** $702,115 $443,752 $591,259 $0 $0 $1,737,126
Stephen Municipal Gas $259,092 $105,318 $0 $0 $0 $364,410
Two Harbors Municipal Gas $1,588,892 $579,106 $371,884 $698,042 $0 $3,237,924
Tyler, City of*** - - - - - $495,119
Virginia Public Utilities $2,021,204 $1,911,170 * $0 * $3,992,733
Warren, City of $542,358 $567,060 $0 $0 $0 $1,109,418
Westbrook Public Utilities $463,339 $0 $0 $0 $0 $463,339
Xcel Energy**** $318,878,158 $149,896,640 $21,339,753 $18,434,219 $52,090,596 $562,161,785
Total $1,186,023,897 $468,617,173 $156,726,842 $112,216,854 $180,436,308 $2,106,038,612
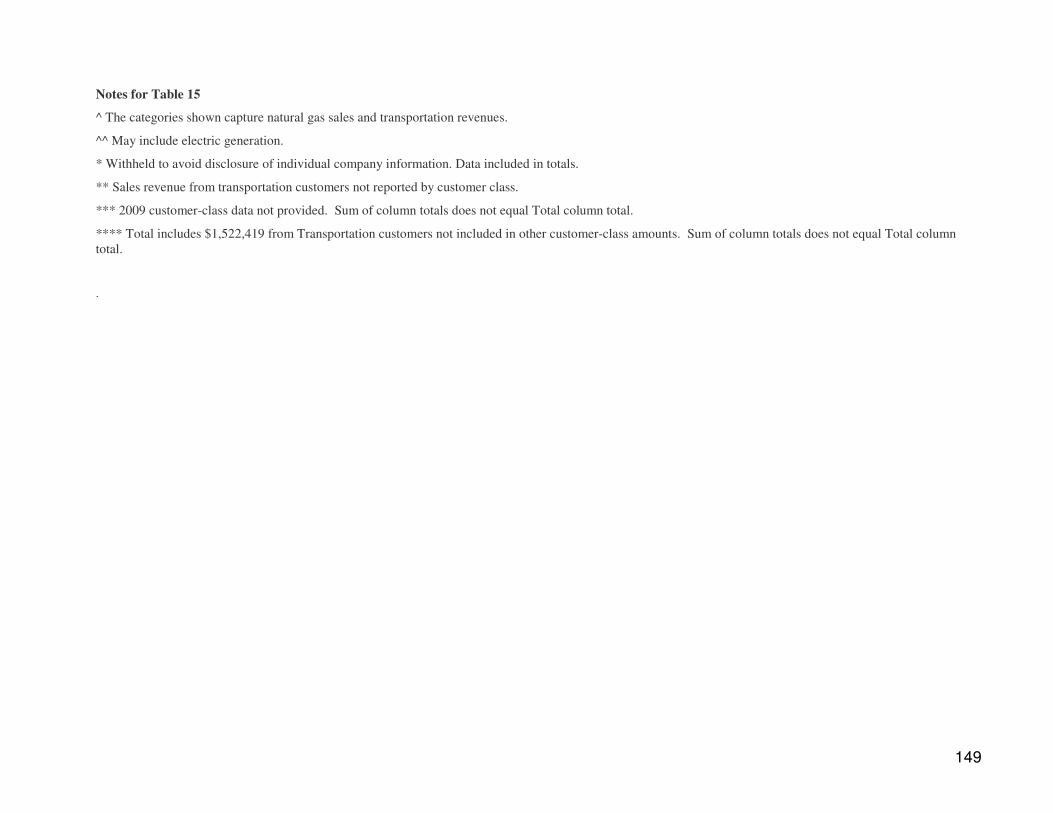
149
Notes for Table 15
^ The categories shown capture natural gas sales and transportation revenues.
^^ May include electric generation.
* Withheld to avoid disclosure of individual company information. Data included in totals.
** Sales revenue from transportation customers not reported by customer class.
*** 2009 customer-class data not provided. Sum of column totals does not equal Total column total.
**** Total includes $1,522,419 from Transportation customers not included in other customer-class amounts. Sum of column totals does not equal Total column total.
.
150
Section III: Attachments
General Notes on Data
1) Consumption. In general, electric companies report retail electric consumption as follows:
Farm. Electricity supplied to farm households and for agricultural purposes.
Residential. Electricity supplied to non-farm private households.
Commercial. Electricity supplied to small commercial and industrial power accounts. May include use by some apartment dwellers.
Industrial. Electricity supplied to large commercial and industrial power accounts, including mining accounts.
2) Missing Data. Although all utilities are required to report data used in this report annually, some utilities have provided either partial information or no information. This report notes where these utilities have not reported information.
3) Accuracy of Data. While the Department does not audit the records supporting the data companies provide, we do check the reasonableness of the data. We also correct errors in reported data where feasible. However, some data reported by smaller companies may contain a few errors or inconsistencies. These errors should not significantly affect the totals.
151
Glossary of Terms and Abbreviations
Btu: British thermal unit; the amount of heat required to raise the temperature of one pound of water one degree Fahrenheit under stated conditions of pressure and temperature (equal to 252 calories, 778 foot-pounds, 1,005 joules and 0.293 watt-hours).It is the U.S. customary unit of measuring the quality of heat, such as the heat content of fuel.
cf: cubic foot; the U.S. customary unit of measurement of gas volume. It is the amount of gas required to fill a volume of one cubic foot under stated conditions of temperature, pressure and water vapor. One cubic foot of natural gas equals 1,000 British thermal units under standard conditions of atmosphere (one) and temperature (60 degrees Fahrenheit).
Ccf: one hundred cubic feet.
Cooperative utility (“co-op”): a utility owned and operated by its members.
Department of DOC: the Minnesota Department of Commerce.
Gas turbine: a type of electric generation plant that relies on turbines driven by the combustion of natural gas or diesel fuel to produce electricity.
GWh: gigawat-hour; the unit of energy equal to that expended in one hour at a rate of one billion watts. One GWh equals 1,000 megawatt-hours.
Hydro: a type of electric generation plant that relies on a water wheel to convert falling water into electricity.
Int comb. (Internal Combustion): a type of electric generation unit that relies on an internal combustion engine to convert burned diesel, fuel oil, gasoline, or natural gas into electricity.
Investor-owned utility (IOU): Common term for an electric privately-owned utility regulated by the Minnesota Public Utilities Commission.
kW: one kilowatt or one thousand watts.
Local Distribution Company (LDC): Common term for a gas privately-owned utility regulated by the MPUC.
Mcf: one thousand cubic feet; a unit of measure of gas volume.
Minnesota Public Utilities Commission (Commission): the state agency with regulatory jurisdiction over certain Minnesota utilities.
Municipal utility (“muni”): a utility owned, operated and regulated by the city in which it resides; the most common form of publicly owned utility.
MWh: megawatt-hour; the unit of energy equal to that expended in one hour at a rate of one million watts. One MWh equals 3,414,000 Btus.
Natural Gas (gas): a mixture of hydrocarbon compounds and small quantities of various non-hydrocarbons existing in the gaseous phase or in solution with crude oil in natural underground reservoirs. It comes from the ground with or without crude oil and is generally much higher in heat content than manufactured gas.
152
Net generation: the total amount of electric energy produced by a generating unit less the electricity consumed by the generating station.
Nuclear: a type of electric generation plant that uses energy obtained by fission, fusion or by radioactive decay to drive the turbines.
Number 2 fuel oil: a distillate fuel oil used for domestic heating and in moderate capacity commercial or industrial burners as well as for generating electricity.
Number 6 fuel oil: a residual fuel oil that is heavier than distillate fuel oil and is used to generate electricity as well as in industrial burners.
Plant capacity: the amount of electric load, measured in megawatts or kilowatts, for which a generating unit is rated either by the user or the manufacturer.
Privately owned utilities: utility corporations owned by shareholders. Large privately-owned utilities are regulated by the Minnesota Public Utilities Commission.
Publicly owned utilities: utilities owned, operated and regulated by the city or legal entity in which it resides.
REIS: Regional Energy Information System; the Minnesota Department of Commerce’s computerized state energy data collection and information system. It includes energy data the DOC collects directly from energy suppliers as well as data collected by other state departments such as the Minnesota Department of Revenue, Petroleum Tax Division.
RDF: refuse-derived fuel composed of garbage, which is used in some electric generation plants.
Steam: a type of electric generation plant that relies on steam-driven turbines to generate electricity. Steam is produced in a boiler heated by several combinations of fossil, refuse-derived, or wood-waste fuels.
Transportation (of natural gas): the action taken by a retail customer who purchases natural gas supplies directly from a supplier or marketer and then moves or transports the gas through a utility’s distribution system to the customer’s destination.
Watt: the unit of measure for electric power or rate of doing work. The rate of energy transfer equivalent to one ampere flowing under pressure of one volt.
Weather-normalized information: information adjusted to remove fluctuation due to changes in weather.
Wind: a type of electric generation plant that uses turbines powered by wind to generate electricity.


![Utility Sector Energy Efficiency in Minnesota [ACEEE]](https://img.pdfslide.net/doc/110x75/577ce0111a28ab9e78b29fbb/utility-sector-energy-efficiency-in-minnesota-aceee.jpg)