Embed Size (px)
Citation preview

Chapter Four: Data analysis and interpretation 152
CHAPTER FOUR
EMPIRICAL RESEARCH DESIGN
4
4.1 INTRODUCTION
The overall aim of this study was to gain to determine to what extent the
management of the design and implementation of CTA satisfies criteria of
quality at schools in the Sedibeng-West and Sedibeng-East school districts.
Therefore this chapter, Chapter Four, outlines the empirical research design
that was followed in order to gather information that would be relevant to this
aim. In the first place, a harder look is taken at the place of a research
paradigm in sound research, making sure that the researcher points out why it
was necessary to place her study within the chosen paradigm (cf. 4.2).
The main focus of this chapter, however, will fall on a detailed discussion of
the whole empirical research plan: first off, the researcher will describe the
nature and importance of a research design as such (cf. 4.3.3.1) and
distinguish between the different research method designs as they differ,
given the choice of using quantitative, qualitative and mixed methods (cf.
4.3.3.2).
In the second place, the research strategy (cf. 4.3.4), data-collection strategy
(cf. 4.3.5), relevant reliability and validity concerns (cf. 4.3.6), sampling
procedure (cf. 4.3.7) and aspects concerning the analysis of the gathered data
(cf. 4.3.8) will also be addressed.
In the last instance, this chapter will attend to ethical concerns as they played
a part in this research (cf. 4.3.9).
4.2 RESEARCH PARADIGM
According to Bryman and Bell (2003:453), Creswell (2009:6) and Nieuwenhuis
(2007b:47), a research paradigm or a philosophical worldview is a basic set of
beliefs, assumptions or dictates about fundamental aspects of reality that
guide action.

Chapter Four: Data analysis and interpretation 153
For example, a quantitative research approach means holding a positivist
theory of beliefs, whereas a qualitative approach indicates the holding of
beliefs related with a constructivist paradigm position. These relationships are,
however, by no means fixed (Bryman & Bell, 2003:453).
MacKenzie and Knipe (2006:164) indicate that the theoretical framework of a
research study, as different from a theory, is sometimes referred to as the
paradigm and influences the way knowledge is studied and interpreted.
According to Burton and Bartlett (2009:18), a research paradigm is described
as a model of research that reveals a general agreement on the nature of the
world and how to investigate it. Within a paradigm there would be a common
consensus on the research methods that are appropriate and acceptable for
gathering data and also those which are not satisfactory. A paradigm, then, is
a network of similar ideas about the nature of the world and of the purpose of
researchers which, adhered to by a group of researchers, regulates the
patterns of their thinking and underpins their research actions (Burton &
Bartlett, 2009:18).
It is the choice of paradigm that sets down the intent, motivation and
expectations for the research.
In the next paragraphs, different paradigms will be briefly explained and the
suitability of the various paradigms for the present research will be
highlighted.
4.2.1 Pragmatism
Pragmatism as a worldview stems from initiatives, situations and problems
rather than from antecedent conditions as in positivism (Creswell, 2009:10).
Creswell (2007:46) and Armitage and Keeble-Allen (2007:31) are of the
opinion that a pragmatist links the choice of approach directly to the purpose
and nature of the research questions posed. Pragmatist research is often
multi-purpose and follows a what-works strategy that will enable the
researcher to address questions that do not fit comfortably within a wholly
quantitative or qualitative approach to design and methodology (Creswell,
2012:537).

Chapter Four: Data analysis and interpretation 154
Pragmatism is not committed to any one system of philosophy and reality. As
McMillan and Schumacher (2010:6) point out, the pragmatic paradigm offers
the academic foundation for carrying out mixed-method research.
Since the researcher of this thesis did not intend (1) studying actions,
situations and/or consequences or (2) conducting mixed-method research,
she decided against choosing pragmatism as a worldview to underpin her
study.
4.2.2 Constructivism
As far as constructivism is concerned, the research participants become
active and involved in all the phases of the process. Participants seek
understanding of the world in which they live and work (Creswell & Plano
Clark, 2007:20).
Glicken (2003:30) applauds the idea of involving participants in choosing and
formulating the research problem and in helping to formulate the measuring
instrument and the strategy to be followed in the project. Constructivism can
be regarded as a radical starting point from positivism in the sense that the
movement developed from tight control over the total process to full
engagement of the participants.
The researcher of this thesis did not follow a constructivist approach, as she
did not plan to involve her research participants in being part of formulating
the problem, the measuring instrument or the strategy.
4.2.3 Interpretive approach
The interpretive paradigm is also called the phenomenological approach, a
way that aims at understanding people (Babbie & Mouton, 2001:28).
Otherwise it is also referred to as the interpretive social science approach and
it maintains that all human beings are involved in the process of making
meaning of their worlds and continuously interpreting, creating, giving
meaning, defining, proving and rationalizing their daily actions (Babbie &
Mouton, 2001:28).
According to Neuman (2003:7), such researchers conduct a reading to
discover meaning embedded within text. In this paradigm, the researcher

Chapter Four: Data analysis and interpretation 155
often utilizes participants‟ observations and filed research, which are
strategies where many hours and days are spent in direct contact with
participants. Transcripts, discussions and video tapes may be studied in
detail in order to gain a sense of subtle non-verbal communication or to
understand the interaction in its real context (Neuman, 2003:76).
The researcher of this thesis decided against following an interpretive
approach, since she did not aim at understanding people nor did she intend to
conduct a reading in order to discover meaning that is entrenched in text.
4.2.4 Critical theory
Critical theory admits to bias being present in every action of human beings
and hopes that the findings of research will support that bias (Glicken,
2003:23). Versions of this approach are called dialectical materialism, class
analysis and structuralism. Critical theory agrees with many of the criticisms
that the interpretive approach levels at positivism, but it adds some of its own
and disagrees with interpretive social science on some points.
Patton (2002:130-131) adds critical theory as one of the most influential
orientation frame-works, which focuses on how injustice and subjugation
shape people‟s experiences and understanding of the world.
For Babbie and Mouton (2001:36), the critical approach emphasizes
becoming part of the everyday life worlds of the people to be studied, whoever
they may be, with the aim of becoming educative and ultimately
transformative. The focus of the critical paradigm is thus on transforming
human beings and their environment by being personally involved in actions
that would change their circumstances.
Since, for the purpose of this study, the researcher was not studying the
transformation of human beings, it was not proper to follow this approach.
4.2.5 Postmodernism
Patton (2002:100-101) defines postmodernism as follows: a belief in science
as generating truth was one of the cornerstones of modernism inherited from
the Enlightenment Era. Postmodernism attacked this faith in science by
questioning its ability to reveal the truth, in part because, like all human
Chapter Four: Data analysis and interpretation 156
communications, it is dependent on language by which one can view reality.
Since language is inevitably built on the worldview of the social group that
constructed it and the culture of which it is a part, language cannot fully
capture or represent reality.
It follows from this that the continuity of knowledge over time and across
cultures is called into question. Hesser-Biber and Leavy (2006:244) mention
that postmodern trends in qualitative research have opened newly created
spaces to make the voices of participants heard. In postmodern research,
there is also a focus on the explanation and interpretation of behaviour
patterns and narratives of participants in the research project.
The researcher of this thesis did not make use of the postmodern perspective
because she was not focusing on the explanation and interpretation of
behaviour patterns and narratives of participants.
4.2.6 Positivism
Silverman (2005:403) describes positivism as a representation of the design
of the research process which treats social facts as existing independently of
the activities of both participants and researchers.
It is positivism that seeks to apply the natural science model of research on
investigations of social phenomena and explanation of the social world
(Denscombe, 2008:14). According to Bryman and Bell (2003:13-16), the
problem with this stance is simply that the term positivist was used glibly and
indiscriminately by many writers and in fact became a term of abuse.
Positivism firstly involves conformity that the methods and procedures of the
natural sciences are suitable to the social sciences (Glicken, 2003:20).
The positivist also believes that an objective reality exists outside personal
past experience that has results and immutable laws and mechanisms that
can inform cause-and-effect relationships (Babbie & Mouton, 2001:23;
Neuman, 2003:75). Positivism maintains that it is possible and essential for
the researcher to adopt a distant, detached, neutral and non-interactive
position (Morris, 2006:3). For the same reason, positivists prefer analysis or
outside observer interpretations of data (Druckman, 2005:5).
Chapter Four: Data analysis and interpretation 157
A positivist researcher would propose that there is one objective truth which is
examined by the inquirer who has hardly any effect on what is being studied
(Nieuwenhuis, 2007b:53). Having ascertained the new knowledge, the
researcher can then suggest probable reasons for the reasons why things
come about on earth as they do (Nieuwenhuis, 2007b:55).
According to Neuman (2007:42), positivism views social science as an
organized way for putting together deductive logic with precise empirical
observations of individual behaviour in order to find and confirm a set of
probabilistic changing laws that can be used to predict general patterns of
human activity. Positivists believe that knowledge can be disclosed or
perceived through the use of a scientific method. The scientific method
(positivism) underpins quantitative research (Snowden, 2000:112; Maree &
Van der Westhuizen, 2007:31-32).
For the most part, this study followed a positivist paradigm (cf. 1.5.1), since
the researcher was intent on maintaining a non-interactive position while
looking for new knowledge in order to suggest reasons for the outcomes of
her research. Furthermore, she was interested in analysing her gathered data
with the aim of developing a general understanding of how CTAs are
designed, managed and implemented at Sedibeng-West and Sedibeng-East
schools that took part in the research.
4.2.7 Post-positivism
Positivism, as was indicated just above, asserts that there is a reality out there
to be studied, captured and understood; post positivists argue that the reality
can never be fully discovered (Nieuwenhuis, 2007b:65): researchers can only
make estimations (Creswell, 2009:7). Moreover, post-positivism is pointed out
as one of the research strategies, along with critical theory, that fills up the
break between positivism and constructivism (Guba & Lincoln, in
Nieuwenhuis, 2007b:65).
The post-positivist researcher focuses on the understanding of the study as it
evolves during the investigation and thus begins with an area of study and
what is relevant to that area for a fuller understanding thereof. A precise
question and hypothesis are thus not developed before starting the study

Chapter Four: Data analysis and interpretation 158
(Morris, 2006:77). Post-positivists often believe that different variables cannot
always be controlled and that positivist research is often difficult and
impractical for many forms of social research (Glicken, 2003:27).
To Glicken (2003:28), post-positivism is a much freer paradigm, since it allows
for the development of alternative research strategies that might be able to
discover information in the most unlikely ways. Researchers in this paradigm
normally believe in multiple opinions from participants rather than in a single
reality (Creswell, 2009:20).
Based on the benefit of obtaining multiple opinions from the research
participants, the researcher of this thesis decided to include a small qualitative
dimension n a post-positivist paradigm (cf. 1.51). In this way, she intended
strengthening the data collection and analysis process. Moreover, following
this paradigm would allow for the discovery of information that would have
been difficult to obtain with the use of the positivist paradigm only.
4.3 EMPIRICAL RESEARCH
In this section, the researcher will explain how the literature review and the
empirical research were conducted. The research design, research strategy,
sampling and how data were collected, analysed and interpreted will be
discussed.
4.3.1 Literature review
Phase one of the study entailed a literature study. The literature review made
use of relevant books, journals, papers presented at professional meetings,
dissertations and theses by graduate students, reports by schools and
university researchers and Government Gazettes. In order to obtain relevant
literature, a variety of electronic databases (NEXUS, EBSCO-HOST and
ERIC) and internet search engines (Google, Google Scholar and Yahoo) were
used. The resources provided information on how far research on how the
quality of the design and implementation of CTA could be managed at
Sedibeng-East and Sedibeng-West schools has progressed.
The key words and phrases used for the literature search included the
following:

Chapter Four: Data analysis and interpretation 159
Assessment; Common Task Assessment; CTA; managing quality in
assessment; features of quality assessment, moderation; evaluation;
management; reliability, authenticity, validity; fairness; transparency.
4.3.2 Aims and objectives
The overall aim of this study was to determine to what extent the management
of the design and implementation of CTA satisfies criteria of quality in the
Sedibeng-East and Sedibeng-West Districts (cf. 1.3.3).
The objectives were as follows (cf. 1.3.3):
to indicate what quality entailed in the design and implementation of CTA
(cf. 2.1; 2.3-2.2.3 – in order to construct the questionnaires in line with the
literature review);
to determine how quality in the designing and implementation of the CTA
was managed at present (cf. 3.5.5; Chapter Five: the empirical study;
to establish whether there is a difference between learner and educator
perceptions concerning quality in the design and implementation of CTA
(cf. Chapter Five); and
to suggest components and processes based on the data to be included in
the guidelines towards a management intervention plan to be used at
schools in the Sedibeng-East and Sedibeng-West Districts to improve
quality management of the design and implementation of school-based
assessment (cf. Chapter Six – where the reader will find the suggested
management intervention plan).
4.3.3 Research design
4.3.3.1 What is a research design?
As pointed out by Blaikie (2000:21), McMillan and Schumacher (2001:31),
Mouton, (2002:55 & 94), De Jong (2005:9), Kagee et al. (2006:71 & 107) and
Babbie (2007:112), a research design is a set of guidelines and instructions or
an integrated plan comparable to the activities of an architect who is designing
a building. This will outline how researchers will carry out the research project,
which includes the procedures they will follow during their studies, when and

Chapter Four: Data analysis and interpretation 160
from whom the data will be obtained and what methods of data collection will
be used.
This, therefore, means that when deciding on a research design involves
identifying what the research purpose and questions will be; what information
would appropriately answer specific research questions and which strategies
would be most effective in obtaining this. In addition, the research design is
the logical sequence that connects the empirical data to the study‟s initial
research questions and ultimately to its conclusions (Kagee et al., 2006:18).
According to the explanations given by the researchers mentioned above
(Blaikie, 2000:21; McMillan & Schumacher, 2001:31; Mouton, 2002:55 & 94;
De Jong, 2005:9; Kagee et al., 2006:71 & 107; Babbie, 2007:112), a research
design focuses on the product and all the steps in the process to achieve the
outcome anticipated.
The researcher of this thesis used the research design as a guideline
according to which she made her choice about data collection and sampling
methods. In choosing such methods, it was necessary to provide reasons for
her choices. The research design ensured that evidence obtained enabled her
to understand accurately how the design and the implementation of Common
Task Assessment (CTA) were done. In support of a positivistic research
paradigm, the research design used in this study was quantitative in nature. At
the same time, the researcher included a small qualitative dimension to probe
participants‟ viewpoints and understanding.
4.3.3.2 A distinction between various research designs
Gay and Airasian (2003:19) indicate that the consequence to be investigated
will lead the type of research design. The authors acclaim that the many types
of research can be used to investigate the same common problem. Cooper
and Schindler (2001:62) mention that a best way to approach the research
process is to indicate the basic dilemma that led the research and then to try
to develop other questions. According to Gay and Airasian (2003:19),
knowing the type of research helps one identify the important aspects to be
examined in evaluating the study (Gay & Airasian, 2003:19).

Chapter Four: Data analysis and interpretation 161
Quantitative and qualitative research designs
The reason for quantitative research is linked to control of a phenomenon,
while that of qualitative research is to understand a social situation from
participants‟ perspectives (McMillan & Schumacher, 2006:23). However,
quantitative and qualitative researches differ in their view of the world, and
they lean towards using different methods to seek knowledge (Gay & Airasian,
2003:20).
Moreover, quantitative and qualitative approaches should be viewed as
balancing methods that, when used jointly, give more options for studying an
array of important topics (Gay & Airasian, 2003:21).
Gall et al. (1996:20) affirm that in the perception of some researchers,
qualitative studies are best applied in investigating themes and relationships
at the case level, as quantitative studies are best applied in validating those
themes and relationships in samples and populations. Looking at this
perspective, qualitative research will play a discovery role, while quantitative
research plays an affirming role (Gall et al., 1996:20).
Table 4.1 below offers an explanation of the differentiated uniqueness of
quantitative and qualitative research. The purpose of including such
information is to reveal the greater depth of understanding that one can derive
from adding a qualitative approach which relies on analytic induction to the
systematic and objective process of following a quantitative approach.
Table 4.1: Differences between quantitative and qualitative research
Quantitative research Qualitative research
Assume an objective social reality Assume that social reality is
constructed by the participants in it.
Assume that social reality is constant
across time and settings
Assume that social reality is
continuously constructed in a local
situation.
View causal relationship among
social phenomena from mechanist
perspective
Assign human intentions a major role
in explaining causal relationships
among social phenomena.

Chapter Four: Data analysis and interpretation 162
Quantitative research Qualitative research
Take an objective, detached stance
towards research participants and
their settings
Become personally involved with
research participants, to the point of
sharing perspectives and assuming a
caring attitude.
Study populations or sample that
represent population
Study cases.
Study behaviour and observable
beliefs
Study meanings that individuals
create and other internal phenomena.
Study human behaviour in natural or
contrived setting
Study human action in natural
settings.
Analyse social reality into variable Make holistic observation of the total
context within which social reality is
constructed.
Use preconceived concepts and
theories to determine what data will
be gathered. Generate numerical
data to present the social
environment
Discover concept and theories after
data have been gathered; generate
verbal and pictorial data to represent
the social environment.
Use statistical methods to analyse
data
Use analytic induction to analyse
data.
Use statistical inference procedures
to generalize findings from sample to
define population
Generalize case findings by
researching for other similar cases.
Generalize findings from sample to a
defined population
Prepare reports that reflect
researchers‟ constructions of the data
and awareness so that readers will
form their own construction from what
is reported.
Chapter Four: Data analysis and interpretation 163
Quantitative research Qualitative research
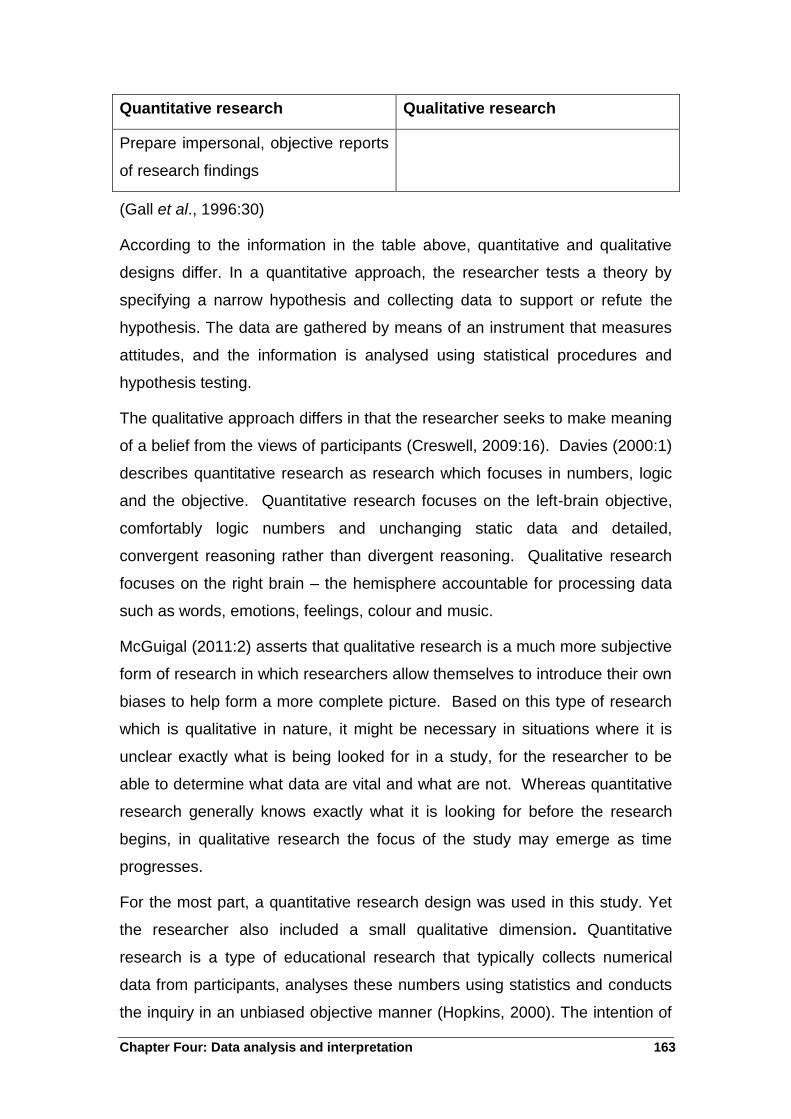
Prepare impersonal, objective reports
of research findings
(Gall et al., 1996:30)
According to the information in the table above, quantitative and qualitative
designs differ. In a quantitative approach, the researcher tests a theory by
specifying a narrow hypothesis and collecting data to support or refute the
hypothesis. The data are gathered by means of an instrument that measures
attitudes, and the information is analysed using statistical procedures and
hypothesis testing.
The qualitative approach differs in that the researcher seeks to make meaning
of a belief from the views of participants (Creswell, 2009:16). Davies (2000:1)
describes quantitative research as research which focuses in numbers, logic
and the objective. Quantitative research focuses on the left-brain objective,
comfortably logic numbers and unchanging static data and detailed,
convergent reasoning rather than divergent reasoning. Qualitative research
focuses on the right brain – the hemisphere accountable for processing data
such as words, emotions, feelings, colour and music.
McGuigal (2011:2) asserts that qualitative research is a much more subjective
form of research in which researchers allow themselves to introduce their own
biases to help form a more complete picture. Based on this type of research
which is qualitative in nature, it might be necessary in situations where it is
unclear exactly what is being looked for in a study, for the researcher to be
able to determine what data are vital and what are not. Whereas quantitative
research generally knows exactly what it is looking for before the research
begins, in qualitative research the focus of the study may emerge as time
progresses.
For the most part, a quantitative research design was used in this study. Yet
the researcher also included a small qualitative dimension. Quantitative
research is a type of educational research that typically collects numerical
data from participants, analyses these numbers using statistics and conducts
the inquiry in an unbiased objective manner (Hopkins, 2000). The intention of

Chapter Four: Data analysis and interpretation 164
the researcher in choosing a quantitative approach as the main approach to
data collection was to obtain numerical data about managing the quality of the
design and implementation of CTAs and then to describe the data.
4.3.3.3 The research design chosen for this study
As indicated in 1.5.3, this researcher decided on using a quantitative design in
order to validate findings and recommendations that followed from evidence
found in the survey about CTA classroom practice and the relevant literature.
The type of design was that of a single type quantitative design with a small
qualitative dimension (cf. 1.5.3), as will be described in the paragraphs below.
The quantitative research design was suitable to this study to capture the
descriptive nature thereof. The small qualitative dimension (cf. Questionnaire:
Section E & F) occurred in the form of a selected number of open-ended
questions, aimed at creating a better understanding of the descriptive nature
that was obtained by the quantitative questionnaire items.
As is the case in all research designs, the researcher of this thesis had to take
note of the specific advantages and disadvantages connected to conducting
research within a quantitative design. This enabled the researcher to
understand the challenges that she would have to face in order to be better
prepared.
Table 4.2: The advantages and disadvantages of quantitative research
Quantitative Advantages Quantitative disadvantages
This research design is an excellent
way of finalizing results and providing
or disproving a hypothesis.
Experiments can be difficult and
expensive and require a lot of time to
perform.
After statistical analysis of results, a
comprehensive answer is reached.
Quantitative experiments also filter
out external factors, if properly
designed, and so the results gained
can be seen as real and unbiased.
Quantitative studies require extensive
statistical analysis, which can be
difficult, due to scientific discipline and
can be difficult for non-
mathematicians.

Chapter Four: Data analysis and interpretation 165
Quantitative Advantages Quantitative disadvantages
Quantitative experiments are useful
for testing the results gained by a
series of qualitative experiments,
leading to a final answer, and a
narrowing down of possible directions
for follow up research to take.
In this method the successful
statistical confirmation of results is
very stringent; with experiments
comprehensively proving a
hypothesis; there is usually some
uncertainty. This means another
investment of time and resource must
be committed to fine-tuning results.
(Matveev, 2002:60-62)
According to Maree and Pietersen (2007c:145), quantitative research is a
route that is procedural and objective in its ways of using numerical data from
only a selected sample of a population to generalize the findings to the
population that is being studied.
The reason why the researcher of this thesis chose a quantitative research
design for the most part of her study was because she was seeking to
describe the managing of the quality of the design and implementation of
CTAs.
4.3.3.4 Research strategy
Survey research was conducted (cf. 1.2). In the subsections below the term
research strategy will be defined; and a distinction between different research
strategies, the research strategy and data collection methods chosen for this
research will also be discussed.
In the next paragraph, the researcher will explain what the term research
strategy comprises.
4.3.3.5 What is a research strategy?
According to Creswell (2009:11), ways of inquiry are types of qualitative,
quantitative and mixed method designs or models that provide specific
direction for following in a research design. Research strategies are also
called research methodologies.

Chapter Four: Data analysis and interpretation 166
4.3.3.6 A distinction between different research strategies
Research strategies differ: there are quantitative and qualitative strategies.
Quantitative research strategies
Quantitative strategies include experimental and non-experimental research
strategies (cf. 4.3.4.1). According to Maree and Pietersen (2007c:149),
experimental designs have been developed to answer a specific kind of
research question, namely the cause-and-effect question. The following three
characteristics distinguish an experimental design from other designs (Maree
& Pietersen, 2007c:150):
Manipulation takes place – some of the participants receive some kind of
treatment.
Control occurs – a number of participants are used as a control method
by not getting the treatment, while the others do receive the treatment.
Randomization is used to divide the participants into different groups (cf.
Figure 4.1).
A typical illustration of an experimental design would be using a pretest-
posttest design by means of a control group (Maree & Pietersen, 2007c:149).
For the purpose of this study, an experimental design was not appropriate in
the sense that the researcher did not intend giving any form of treatment to
her research participants.
McMillan and Schumacher (2006:215) indicate that there are five types of
non-experimental research designs which include descriptive, correlation,
comparative, surveys and ex post facto. The focus of this study was on a non-
experimental research strategy which included survey research, discussed in
4.3.3.7 below. According to Maree and Pietersen (2007c:152), the term non-
experimental implies that the researcher does not influence any data.
Moreover, most researchers choose surveys as their non-experimental
research design.

Chapter Four: Data analysis and interpretation 167
Qualitative research strategies
The qualitative strategies include ethnography, grounded theory, case studies,
phenomenological research and narrative research. In qualitative strategies,
the researcher seeks to establish the meaning of a phenomenon (Creswell,
2009:16).
4.3.3.7 The research strategy chosen for this study
In this study, this research focused on acquiring information about educators
and learners‟ opinions and attitudes regarding the management of CTAs and
their understanding of how they gave meaning to the implementation of CTA
by using survey research, which is non-experimental research.
The quantitative strategy: non-experimental descriptive survey research
In this study, the researcher made use of non-experimental descriptive survey
research (cf. 1.5.4). McMillan and Schumacher (2001:602) define survey
research as the assessment of the current status, opinions, beliefs and
attitudes by questionnaires or interviews from a known population.
Creswell (2009:12) points out that survey research permits for a numeric
description of a population‟s tendencies, outlooks or beliefs by focusing on a
sample of that population. Survey research would take account of cross-
sectional and longitudinal studies by using questionnaires or structured
interviews when collecting data, with the purpose of generalizing from the
sample to the population (Creswell, 2009:12).
Non-experimental survey research in the form of a questionnaire was utilized
to determine the perceptions of Grade 11 learners and educators who were
involved in CTA administration in 2009, regarding the way in which the design
and implementation if CTA were managed. The researcher arranged with the
principals of the respective schools for permission to administer the
questionnaires as a survey method. The researcher aimed comparing
educators‟ responses on the questionnaires with the learners‟ responses.
The advantage of a survey research was that it promised to be cost-effective
and there could be a quick turn-around when collecting the data. A
disadvantage that the researcher took note of was that some participants may

Chapter Four: Data analysis and interpretation 168
not complete the survey, increasing the possibility of non-response error
(Creswell, 2012:382).
The qualitative research strategy: phenomenological research
This researcher followed a phenomenological research approach in the small
qualitative phase of this study. In qualitative strategies, the researcher seeks
to establish the meaning of a phenomenon (Creswell, 2009:16). As pointed
out by Boeije (2010:8), phenomenological research is an approach of inquiry
during which, among others, the researcher aims at interpreting human
experiences and behaviour. Rudestam and Newton (2007:206) feel that
phenomenology focuses on how people experience a particular phenomenon
and point out their estimation that phenomenologists explore how individuals
construct meanings from the experience and how these individual meanings
shape group or cultural meanings.
Understanding the lived experiences marks phenomenology as a philosophy
as well as a method (Moustakas, in Creswell, 2009:13), and the procedure
encompasses studying a small number of participants through extensive and
prolonged involvement to develop ways and relationships of meaning. In this
process, the researcher brackets or sets sideways his/her own experiences in
order to gain those of the participants in the study (Creswell, 2009:12-13).
For the completion of this thesis, a phenomenological study was done in that
the researcher aimed at gaining a deeper understanding of the learner and
educator participants‟ viewpoints regarding particular aspects through an
open-ended part in the questionnaire that was of a qualitative nature. The
researcher aimed at gaining insight into participants‟ understanding of what
measures need to be put in place for the smooth design, implementation and
management of CTA (cf. 1.5.4).
4.3.4 Data-collection methods
Creswell (2009:161) describes a data collection instrument as a research
instrument which is used to compute, examine or report data. It could be a
test, questionnaire, tally sheet, log, observational checklist and inventory or
assessment instrument.

Chapter Four: Data analysis and interpretation 169
Surveys typically employ face-to-face interviews or written questionnaires
(Leedy & Ormrod, 2005:184). The focus of this study was on describing the
phenomenon of how the design and implementation of CTAs were being
managed at the participating schools. Survey research was appropriate for
this study as the researcher‟s concern was about the views of educators and
learners on how the design and implementation of CTAs were managed.
Survey research comprises a printed list of questions that are used in the
collection of research data. The researcher of this thesis chose questionnaires
as her method for gathering the necessary data.
4.3.4.1 The design of the questionnaire
In both questionnaires, the one for the educators and the other for learners,
the title of the study was indicated. This intended to make participants aware
of the aim of the investigation. Both questionnaires had clear and concise
instructions on how participants should complete them. The wording of the
questionnaire was simple and direct. The reason was to ensure that questions
were clearly understandable and the questions would have the same meaning
for the participants as they did for the researcher. The questionnaire was
designed in such a way that it held the participants‟ interest. The goal was to
make the participants want to complete the questionnaire. This was done by
providing the participants with a variety of items and by varying the
questioning format.
The researcher designed structured questionnaires that would serve as an
appropriate and useful data-collecting tool as they are easy and quick to
answer and sensitive questions are answered more easily. Moreover, the
questionnaires could boost the validity of her data: statistical conclusion
validity, internal validity, construct validity and external validity form the
components of the quantitative research design’s validity (cf. 4.3.5.2); content
validity, face validity and construct validity form the components of the
questionnaire as research instrument’s validity (cf. 4.3.5.2).
Moeketsi (2004:52) indicates that a badly structured questionnaire is a waste
of time for both the researcher and the participants. Questions should allow
the participants to review their own relevant experiences thoroughly, arriving

Chapter Four: Data analysis and interpretation 170
at accurate and complete responses. The researcher of this thesis
communicated some guidelines about the process of answering the
questionnaire items by providing the participants with the necessary
procedures indicated in Section A of both the questionnaires (cf. Addendum
B) to reduce complexities and ambiguities. In both questionnaires, the
educators and the learners‟ items were constructed and carefully developed in
such a way that they would measure specific aspects of the study‟s
objectives.
For instance, in the questionnaire for educators and learners, sections on the
design of CTA and its implementation – including challenges in the
implementation – were included. The questionnaire for educators also
included sections on the assessment policy and the administration of internal
practical assessment. The questionnaires for learners and educators were
designed with the concerns of Rubin and Babbie (2008:205) and Creswell
(2012:364) in mind, where they indicate that an improperly laid out
questionnaire can lead participants to miss questions, confuse them about the
data desired and, in the worst case, lead them to lose interest in completing it.
Aspects that the researcher considered when designing her
questionnaires
As pointed out by Maree and Pietersen (2007b:159-160), the design of the
questionnaire is an essential part of the research process since this is where
the data are generated. Since different types of surveys require different
types of questionnaires, the designer needs to keep in mind what type of data
will be generated by questions and which statistical techniques will be used to
analyse them. The designing of a questionnaire requires the researcher to
give attention to the following six aspects indicated below.
The appearance of a questionnaire
The appearance of the questionnaire was neat, the printing font not too small
and it was user-friendly. It encouraged the participants to take time to
complete it (Maree & Pietersen, 2007b:159).
The order of the questions

Chapter Four: Data analysis and interpretation 171
Questions were ordered in such a way as not to confuse the participant. The
researcher provided a short introductory part explaining the research to the
participant. The questionnaire started with a few easy-to-answer, non-
threatening questions such as biographical details to put the participants at
ease. Then the questionnaire moved on to the topics relevant to the study.
Questions on the same topic were put together and the topics followed a
sequential order. Questions that required similar responses were kept
together (McIntyre, 2005:170).
The data for this research were collected by means of a questionnaire
containing 55 items in the educators‟ questionnaire. The majority of these
questions were closed-ended items. There were eight open-ended items and
five questions had to be answered on a seven-point semantic scale, which
related to the assessment policy. The learner questionnaire contained 41
items of which the majority was closed-ended; three were open-ended
questions. The researcher of this thesis complied with the requirements
concerning completion time of a questionnaire.
A total of 55 questions were included in the questionnaire for educators so as
to formulate items relating to the following:
Biographic information (Section A)
The design of CTA (Section B)
The implementation of CTA (Section C)
Administration of internal practical assessment (Section F)
In the educator questionnaire, qualitative items formed part of Section E:
Administration of internal assessment; and Section F: Internal practical
assessment (cf. .Appendix H). In the learner questionnaire, the open-ended
questionnaire items were part of Section C: Implementation of the CTA (cf.
Appendix I).
The researcher aimed at gaining a deeper understanding of the educator and
learner participants‟ viewpoints and understanding regarding particular
aspects through open-ended questions which are of a qualitative nature.
Participants‟ understanding of what measures need to be put in place for the

Chapter Four: Data analysis and interpretation 172
smooth design, implementation and management of CTA, were obtained
through the open questions.
Information contained in each section of the questionnaire is indicated below.
SECTION A: BIOGRAPHIC INFORMATION
This section was divided into 6 items. Items 1-6 required of the participants to
record their personal information: aspects such as gender, age, the highest
qualification, teaching experience, present position and experience in the
present post. The items in this section in the learners‟ questionnaire are those
on gender, age, the area where they live and the language of communication
at home.
SECTION B: DESIGN OF CTA
Section B of this measuring instrument focused on eliciting information
regarding the design of CTA. The responses of the participants to this section
of the questionnaire enabled the researcher to assess if the EMS CTA was
properly designed to suit the level of Grade 9 learners and be relevant to their
lives.
SECTION C: IMPLEMENTATION OF CTA
Section C of this measuring instrument focused on eliciting information
regarding the implementation of CTA.
The responses of the participants to this section of the questionnaire enabled
the researcher to assess if validity, reliability and authenticity were visible in
the implementation of the EMS CTA as an instrument for measuring the
achievement of learners.
SECTION D: ASSESSMENT POLICY
Section D of this measuring instrument focused on eliciting information
regarding the assessment policy.
The responses of the participants to this section of the questionnaire enabled
the researcher to assess if there are measures in place to ensure that
assessment of Grade 9 learners is continuous, multi-dimensional, varied and
balanced.

Chapter Four: Data analysis and interpretation 173
SECTION E: ADMINISTRATION OF INTERNAL ASSESSMENT
Section E of this measuring instrument focused on eliciting information on the
administration of internal assessment. The responses of the participants to
this section of the questionnaire enabled the researcher to assess the
effectiveness in the administration of internal assessment.
SECTION F: ADMINISTRATION OF INTERNAL PRACTICAL
ASSESSMENT
Section F of this measuring instrument focused on eliciting information on the
administration of internal practical assessment. The responses of the
participants to this section of the questionnaire enabled the researcher to
assess the effectiveness of this aspect.
Types of questions
Bell (2005:31) lists seven types of questions which can be divided into two
main categories, namely open (or unstructured) and closed (structured)
questions. In the case of an open question, a question is asked and space is
provided for a word, phrase or even a comment. Obviously, analysing this
type of question is more difficult than is the case with closed questions.
Hopkins (in Maree & Pietersen, 2007b:159) maintains that, whereas open
questions are used to generate research hypotheses, closed questions are
used to test research hypotheses. Each of these two formats is now
discussed in some detail.
Open questions
Advantages and disadvantages of open questions as indicated by Maree and
Pietersen (2007b:161) are as follows:
The advantages of open questions
Participants can provide trustworthy answers and specifics.
The participant‟s perception route is exposed.
Difficult questions can be answered sufficiently.
Thematic examination of the participants‟ reactions will disclose attention-
grabbing information, categories and subcategories.

Chapter Four: Data analysis and interpretation 174
The disadvantages of open questions
The quantity of information required may vary among participants.
Coding the answers could be complex.
The participants might want time in order to consider and write down their
answer.
Uneducated people find open questions tricky to respond to.
Numerical analysis is also complicated.
Closed questions
A closed question provides for a set of responses from which the participant
has to choose one or sometimes more than one response. The data obtained
from the administration of closed questions is easier to analyse than the data
obtained from open questions. Bell (in Maree & Pietersen, 2007b:161) makes
a distinction between six forms of closed questions: list, ranking, category,
quantity, grid and scale.
The most widely used scale, the Likert, was used in this research. A scale is a
measure in which a researcher captures the intensity, direction, level or
potency of a variable (Neuman, 2003:191). According to Leedy and Ormrod
(2005:185), a rating scale is more useful when actions, outlook or another
happening requires evaluation according to a range of possibilities, for
example strongly disagree to strongly agree. A variation of the Likert scale is
the semantic differentiation. McMillan and Schumacher (2006:199) indicate
that the semantic scale uses adjective pairs with each adjective as an end or
anchor in a single continuum. This scale is used to elicit descriptive reactions
toward a concept or object.
The Likert scale that the researcher used required the participants to indicate
their opinions on a four point scale using the following variables: Agree
strongly; Agree; Disagree; Disagree strongly. Sections B and C were
constructed in such a way as to obtain information on how quality in the
designing and implementation of CTA is presently managed and to determine
the authenticity, reliability and validity of CTA.
Question wording

Chapter Four: Data analysis and interpretation 175
It was important to develop the questionnaire items in such a way that the
meaning of each would be interpreted the same by all participants. A
question that is not carefully structured may result in answers, and therefore
data, that are meaningless.
The following guidelines were adhered to by the researcher when compiling
questions (Maree & Pietersen, 2007b:160):
The researcher‟s questionnaires used language that all the research
participants understood - no slang or abbreviations were included.
The researcher made sure to circumvent ambiguity or imprecision by
developing plain questions so that participants could know exactly what
was being asked.
The researcher circumvented questions with two purposes or
interpretations by making only one specific statement in each case.
The researcher steered clear from including leading questions for
example, do you agree that… so as not to confuse her participants.
The researcher avoided questions that participants would find difficult to
answer, such as theoretical questions.
The researcher did not ask any double-negative questions for example,
don’t you agree that smoking is not good for you...as they could be quite
confusing.
The researcher avoided asking questions that might offend her
participants.
The researcher formulated her questionnaire items as statements, not
questions, in the first person.
Completion time of questionnaire
According to Maree and Pietersen (2007b:159), the researcher should design
the questionnaire in such a manner that the learner participants could answer
it in under half an hour and the adult participants in fewer than 20 minutes. A
structured questionnaire should therefore not have more than 100 to 120
items.

Chapter Four: Data analysis and interpretation 176
In the case of this thesis, the educator questionnaire contained 55 items and
that of learners contained 41. This time frame was confirmed by a pilot study.
It took learners 25 minutes to complete the questionnaire. Educators were
given three days to complete the questionnaire.
In the next section, the researcher will present known advantages and
disadvantages of questionnaire administration. This is of significance to the
study since it pointed out the strengths and weaknesses of the technique
before using it. In this way, the researcher could exploit the strengths while at
the same time guarding against the influences of the weaknesses.
4.3.4.2 Advantages and disadvantages of using a questionnaire
The reasons for choosing a questionnaire included that questionnaires are
generally used to collect data quickly; all participants are given the opportunity
to provide feedback that is generally anonymous. The anonymity of the
questionnaire encourages openness and honesty (Cohen et al., 2007:15).
Advantages of using questionnaires
Cohen et al. (2007:344) mention the following advantages in this regard:
Many participants can complete the questionnaire in a short space of time.
Test administrators can check the questionnaire for accuracy.
This method is relatively cheap and easy to carry out.
Participants can be reached across long distances.
The response rate is optimal.
The interviewer can immediately assist with issues in the questionnaires
that are not clear to the participants.
Looking at this type of questionnaire from a positive point of view, participants
can respond confidentially within a known environment and feeling no anxiety
that the presence of the researcher could cause. The level of anonymity is
higher when the researcher is absent and this could be seen as providing for
truthful data (Cohen et al., 2007:344).

Chapter Four: Data analysis and interpretation 177
The appropriateness of using questionnaires as research instruments for this
thesis was due to the advantage of being able to include a large number of
participants (Leedy & Ormrod, 2005:185) within a relatively short time-span
and/or across a geographically large area.
Disadvantages of using questionnaires
Cohen et al. (2007:344) mention the following disadvantages that researchers
need to be aware of in this regard:
When different administrators administer the tests, this could lead to
different responses.
The primary researcher has limited control over what happens in the field.
The conditions in which the questionnaire is administered cannot be
controlled by the primary researcher.
Costs could be rather high when using standard tests.
According to Cohen et al. (2007:15), one of the major disadvantages of a
written questionnaire is the possibility of low return rates. Low response is the
underpinning problem of statistical analysis and it can dramatically lower
people‟s confidence in the results. The researcher of this thesis intended to
distribute and collect the questionnaires herself. She planned to allow the
participants time to complete the questionnaires and collect them immediately
afterwards.
The drawback of this type of questionnaire can be summarized by reminding
researchers that it could lead to participants being unable to ask questions
and therefore either leaving out responses or simply refraining from
completing the questionnaire. Also not being able to manage the surroundings
could cause particpants to discuss their probable responses with others
instead of giving their own opinions.
The researcher of this thesis arranged ahead of time with the principals and
district offices of Sedibeng-West and Sedibeng East schools to administer the
questionnaires at a convenient time.
Chapter Four: Data analysis and interpretation 178
4.3.4.3 Distribution of the questionnaire and administrative procedures
After obtaining official research permission from the Gauteng Department of
Education, the document indicating this was made available to the District
Directors of Sedibeng-West and Sedibeng-East before the researcher went
ahead with the empirical research.
The researcher of this thesis had to take the questionnaires personally to
each participating school and give them to EMS educators who taught Grade
9 in 2009 and their managers. The researcher‟s presence was helpful in that it
enabled queries and uncertainties to be addressed immediately.
Questionnaires were also administered to all Grade 11 learners (Grade 9
during 2009) of each participating school. The administration of the
questionnaires was done after teaching time. The researcher did not mail the
questionnaires to schools, due to the demography of the Sedibeng districts.
The districts stretch from Sharpeville schools to the outskirts of Heidelberg
and from the farm schools on the outskirts of Vanderbijlpark to the informal
settlements of Orange Farm. Mailing the questionnaires would have posed a
serious delay in terms of receiving them back. In this way, the researcher
would have had to exercise control over the time for completing and returning
the questionnaire.
The researcher gave the educators and SMT members two to three days to
complete their questionnaires, while group administration of questionnaires
was done with the learners by the researcher. Their questionnaires were
collected immediately after completion. The questionnaire return rate
concerning those distributed to learners and educators was very poor. A
detailed report on the questionnaire return rate is provided in Chapter Five (cf.
5.1).
4.3.5 Reliability and validity
4.3.5.1 Reliability
Welman et al. (2005:9) define reliability as the extent to which results are
consistent over time; are a stable measurement of data, are a representation
of the total population under study and have the results of the study that can
be reproduced under a similar methodology. Thus, the results or observations

Chapter Four: Data analysis and interpretation 179
can be replicated or repeated. Delport (2005:165-166) defines reliability as a
way of making sure that the instrument will generate the same or almost the
same outcome consistently over time. The researcher of this thesis ensured
reliability in her research by increasing the length of her questionnaires. A
lengthened questionnaire generally increases reliability, according to Burns
(2000:346).
The most commonly known coefficient that is used to measure the internal
reliability of an instrument is called the Cronbach‟s alpha coefficient which is
based on the inter-item correlation (Pietersen & Maree, 2007b:216). The
guidelines suggested by Pietersen and Maree (2007b:216) and Clark and
Watson (1995:316) were used in this research.
To guarantee reliability in this research, the researcher gave the questionnaire
to learners to pre-test whether it would be able to measure what it was
supposed to measure. After the pilot study had been completed, the
researcher eliminated two of the items on the learner questionnaire (B17 &
B20) and re-worded four of them (B6, B7, B13 & B16) to make certain of
better internal consistency between these items. The researcher then
distributed the final version. The researcher made changes to adapt the
educator questionnaire.
Both questionnaires were pretested with a selected number of learner and
educator participants from the target population – who did not form part of the
actual study sample – regarding the qualities of measurement and/or
appropriateness and to review them for clarity.
Table 4.3 presents the data of the learners who took part in completing the
questionnaires during the pilot study.
Table 4.3: Pilot survey – learner Cronbach alpha/inter-item correlation
Learners (n=53) Cronbach alpha Inter-item correlation
Section B 0.927 0.297
Section C 0.883 0.264
Chapter Four: Data analysis and interpretation 180
Both the learner Cronbach alpha statistics were acceptable (cf. Table 4.3) and
indicated that they complied with reliability criteria, since they fell within the
propagated ranges of 0.7-0.9 (Pietersen & Maree, 2007b:216) and 0.6-0.9
(Simon, 2004). Moreover, both learner inter-item correlations (cf. Table 4.3)
were acceptable and indicated that they complied with reliability criteria since
they fell within the suggested average range of 0.15-0.5 as proposed by Clark
and Watson (1995:316).
Table 4.3 presents the data of the educators who took part in completing the
questionnaires during the pilot study.
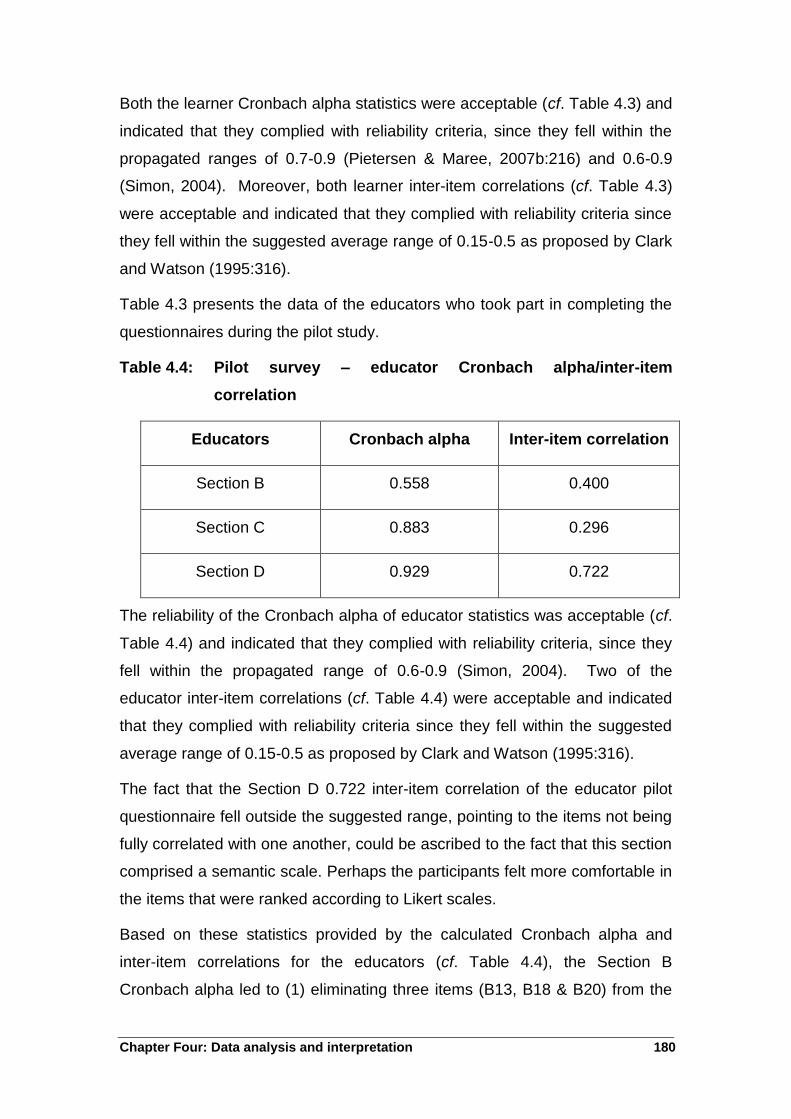
Table 4.4: Pilot survey – educator Cronbach alpha/inter-item
correlation
Educators Cronbach alpha Inter-item correlation
Section B 0.558 0.400
Section C 0.883 0.296
Section D 0.929 0.722
The reliability of the Cronbach alpha of educator statistics was acceptable (cf.
Table 4.4) and indicated that they complied with reliability criteria, since they
fell within the propagated range of 0.6-0.9 (Simon, 2004). Two of the
educator inter-item correlations (cf. Table 4.4) were acceptable and indicated
that they complied with reliability criteria since they fell within the suggested
average range of 0.15-0.5 as proposed by Clark and Watson (1995:316).
The fact that the Section D 0.722 inter-item correlation of the educator pilot
questionnaire fell outside the suggested range, pointing to the items not being
fully correlated with one another, could be ascribed to the fact that this section
comprised a semantic scale. Perhaps the participants felt more comfortable in
the items that were ranked according to Likert scales.
Based on these statistics provided by the calculated Cronbach alpha and
inter-item correlations for the educators (cf. Table 4.4), the Section B
Cronbach alpha led to (1) eliminating three items (B13, B18 & B20) from the

Chapter Four: Data analysis and interpretation 181
section and (2) re-wording two items (B14 & B16) in order to ensure better
internal consistency between the items.
The results of the actual study are reported in Chapter Five (cf. 5.2).
4.3.5.2 Validity
Validity determines whether the research accurately measures that which it
was intended to measure or how truthful the research results are. Validity
checks whether the research instrument allows the researcher to hit the bull’s
eye of the research object (Coleman & Briggs, 2002:61).
Authors such as Mills et al. (2007:5), Pietersen and Maree (2007b:216) and
Mertler (2009:125), refer to validity as denoting the degree to which research
instruments gauge that which they set out to gauge. Cohen et al. (2007:133)
remind the reader that validity has of late taken several structures.
When conducting quantitative research, the researcher can improve the
validity of the research design by (1) drawing the sample in a watchful
manner; (2) using suitable instrumentation; and (3) treating the data in a
statistically fitting way (Cohen et al., 2007:133).
Validity of the quantitative research design
According to McMillan and Schumacher (2006:134), the following four types of
validity are identified as addressing the validity of quantitative research
designs:
Statistical conclusion validity – This type of validity denotes using
statistical tests to determine whether claimed relationships mirror actual
relationships. The researcher of this thesis used the statistical services of
the North-West University (cf. 1.5.7) to establish statistical valdity.
Internal validity – This type of validity denotes the degree to which
claiming that adjustments in the independent variable cause adjustments
in the dependent variable, is accurate.
Construct validity – This type of validity denotes the point to which the
measure is in line for measuring the construct that is being scrutinized,
also supported by Vanderstoep and Johnston (2008:60). As far as the
Chapter Four: Data analysis and interpretation 182
researcher could establish, there were no existing questionniares to gauge
the constructs exactly that the researcher wanted to measure. She thus
used experts in the field to verify whether her questionnaires gauged the
constructs in question. She underpinned the construct validity of the
questionnaires by making sure that, in general, even though they
comprised of different sections, they dealt with facets that were regarded
as essential to the research topic, based on the literature review.
External validity – This type of validity dentes the generalizability of the
outcomes of the study to the other populations, people and localities. The
researcher of this thesis is aware of the fact that having chosen stratified,
purposive sampling for drawing her samples can be regarded as a
limitation in light of determining external validity. However, the intention
was not to generalize these results to wider populations, but to obtain
numerical descriptive data related to the management of the design and
implementation of CTA, and to gain a deeper understanding of the
management of the design and implementation of CTA for the districts that
were selected (cf. 1.5.7).
Validity of the questionnaire as research instrument
Content validity: The term content validity refers to the extent to which
the instrument covers the entire content of the particular construct that it
has set out to measure. To ensure content validity the researcher of this
thesis presented a provisional version of the questionnaire to experts, in
this case being the promoters of this thesis, in order for them to help
validate that the researcher has covered the entire content (Punch,
2005:97; Rubin & Babbie, 2005:194; Babbie, 2007:147).
Face validity: This type of validity refers to the extent to which an
instrument looks valid. In other words, does the instrument appear to
measure what it is supposed to measure? Gravetter and Forzano
(2003:87) suggest that this type of validity concerns the superficial
appearance of the face value of a measurement procedure. To ensure
face validity the researcher of this thesis presented the questionnaire to
her promoters for their professional judgement.

Chapter Four: Data analysis and interpretation 183
Construct validity: When referring to the validity of the questionnaire as
research instrument, construct validity is needed for standardization and
has to do with how well the construct/s covered by the instrument is/are
measured by different groups of related items. In the context of this
research, factor analysis was used to indicate the standardization of the
instrument that was used in this research to show items which belong
together (Pietersen & Maree, 2007b:217). Construct validity, as asserted
by Babbie (2007:175), is based on the logical relationship among
variables. It involves not only validation of the instrument itself, but also
theory underlying it. Another way of establishing construct validity is called
factorial validity (Grinnell & Unrau, 2008:129). Factor analysis as a
procedure is used to determine from the data the number of underlying
factors in a questionnaire of the dimensions being measured or when the
researcher wants to confirm whether the theoretical dimensions are in fact
being measured (Pietersen & Maree, 2007b:219). Due to the smaller
number of the educator participants, such a factor analysis was done
concerning the learner data of Section B and Section C. A factor analysis
was done to determine questionnaire items that belonged together and
measured the same dimension or factor.
The questionnaire was constructed in accordance with the literature review
and comprised items related to the design and implementation of CTA in a
balanced way. The researcher‟s data collection process compared learner
perceptions and educator perceptions and validated the data through the
findings from the literature review.
Validity of the qualitative research
According to Merriam (2009:211), the broad assortment of types of qualitative
research gives rise to the possibility of different criteria for, among others,
validity The researcher of this thesis followed the guidelines of Leedy and
Ormrod (2005:100), Lincoln and Guba (in Nieuwenhuis, 2007c:80) and
Mertens (2010:256-259), in attending to the four central factors of
trustworthiness:

Chapter Four: Data analysis and interpretation 184
Credibility: When conducting qualitative research, the term credibility
refers to how believable and trustworthy the gathered data, the actual
analysis of these data sets and the conclusions are (McMillan, 2008:296).
In general, qualitative researchers will evaluate the credibility of a study
from the perspective of a whole system of beliefs.
In this regard, the thesis included triangulation by gathering information
concerning various perceptions and experiences from the participants, as
well as a document analysis, to achieve credibility during the qualitative
research phase
Applicability/transferability: Babbie and Mouton (2001:277) use the term
transferability here, pointing out that it is all about the degree to which the
findings that are made could be relevant in other situations and/or with
other participants. Guba and Lincoln (2005:216) discuss purposeful
sampling as maximising the range of specific information that could be
obtained from and about that context as strategy for ensuring applicability
or transferability.
To this effect, the thesis made use of stratified purposive sampling, thus
making the most of the scope of specific information that can be gleaned
from the participating schools.
Dependability: This aspect of trustworthiness points to the extent to which
anyone interested in the research can be certain of the fact that the
findings happened as the researcher reported them and that the research
could be repeated (Durrheim & Wassenaar, in Maree, 2007:297).
Confirmability: The term confirmability addresses the important aspect of
making sure that the findings result from the focal point of the research
investigation and not from the researcher‟s own biases (Babbie & Mouton,
2001:278).
To make sure confirmability was established, the researcher reviewed the
following classes of data (Babbie & Mouton, 2001:278):
Data reconstruction – The researcher generated themes, findings,
conclusions and the report.

Chapter Four: Data analysis and interpretation 185
Process notes – The researcher kept methodological notes.
Material relevant to intentions – The researcher made personal notes.
Instrument development information – The researcher applied preliminary
schedules.
These all form part of what Lincoln and Guba (in Babbie & Mouton, 2001:278)
call a confirmability audit trail.
The following criteria, as mentioned by Nieuwenhuis (2007a:113-115), were
applied as follows in this study:
Avoiding generalization, by remembering that the findings were only
applicable to the area in which the research was conducted.
Preserving confidentiality and anonymity, by requesting all participants to
remain anonymous on the questionnaire and ensuring that each
questionnaire was treated with confidentiality.
Stating limitations of the study honestly, by remaining aware of possible
drawbacks that may hamper a successful research process and study
outcome. A limitation of this study could be ending up with incomplete
questionnaires.
Reflecting on being the instrument of data collection during the qualitative
phase, by remembering that the researcher remained the key to data
generation and interpretation. As the researcher is often involved in
sustained and extensive experiences with participants, it must be
remembered that a researcher can easily be influenced by aspects such
as (Theron & Grösser, 2010:2):
historical, social and cultural experiences – the researcher has an
black African heritage and had to visit schools comprising of a
variety of cultures;
status – the researcher is an African female and she had to visit
schools with principals form different cultural groupings;
assumptions – the researcher had to take note of specific
assumptions, as indicated below;

Chapter Four: Data analysis and interpretation 186
personal connection to site or participants – the researcher was no
longer an educator at any school, but was acquainted with some of
the educators;
steps in gaining entry – the researcher had obtained official
permission from both school districts before she approached the
principals at the participating schools; and
sensitive ethical issues – the researcher designed the necessary
letters of consent to gain the participation ethically.
Taking cognizance of one‟s own assumptions at the onset of the research
and avoiding any clouding of interpretation by sharing best guesses
honestly. In this study, the researcher made the following assumptions: (1)
most learners and educators would understand the concept Common Task
Assessment; (2) most educators would understand what was expected
from their schools in managing the design and the implementation of CTA;
(3) most schools and educators would not comply with these managerial
aspects in practice; and (4) learners would not have a clear understanding
of the educators‟ role in managing CTA.
In this research, the researcher minimized the amount of bias as much as
possible by keeping her research distance and by not leading the research
participants in any answers and/or responses.
4.3.6 Population/sample/research participants
In this section, the population and sample that were targeted for the research
will be discussed.
4.3.6.1 Distinguishing between universe, population, study population
and sample
Sampling means taking a portion or a smaller number of units of population as
a representative or having a particular features of the total population
(Kerlinger & Lee, 2000:164; Thomas, 2003:225; Denscombe, 2008:141;
Depoy & Gilson, 2008:234-235;). The description does not say that the
sample taken is in fact representative. Rather, the sample taken is perceived
to be representative. It is important to understand the concept of

Chapter Four: Data analysis and interpretation 187
representativeness and its relationships to generalizability (Graziano & Raulin,
2000:133). Generalization could be obtained in a study when it can be
assumed that the sample and the subjects were observed in any group of
subjects other than the population. In this study, the researcher‟s population
comprised all EMS learners and educators in South Africa.
The term sample always implies the simultaneous existence of a population or
universe of which a sample is a smaller section or a set of individuals selected
from a population (Gravetter & Forzano, 2003:465). The population in this
study comprised looking at the Grade 9 EMS CTA of 2009; the Grade 9 EMS
educators; and school managers responsible for EMS in South Africa.
A sample in the context of this study is a subset of a larger population, from
whom information is collected and chosen for research purposes (Walliman,
2006:232). According to Barker (in Strydom, 2011:224), a sample is the
element of the population considered for actual inclusion in the study. It is a
small portion of the total set of objects, events or persons, which together
comprise the subject of a study. It assists in explaining some facet of the
population.
As it was not possible to conduct research with the entire population, a study
population was chosen. The study population comprised Grade 11 learners
and the educators in the Sedibeng districts who had been involved in Grade 9
EMS CTA during 2009. Due to time and logistical constraints, a sample was
chosen from the study population.
4.3.6.2 Sample
Sarantakos (2000:139) indicates that the major reason for sampling is making
sure that sampling suits the study; also referred to as feasibility.
There are two types of sampling methods: the probability and non-probability
types.
Probability sampling
As has been suggested in this chapter, two major groups of sampling
procedures exist, and a suggestion has been asserted that first-probability
sampling is based on randomization. While second-non-probability sampling

Chapter Four: Data analysis and interpretation 188
is done without randomization – as stated earlier in this chapter – the
quantitative paradigm relies more on probability sampling technique and non-
probability technique can also be used, but in the qualitative paradigm, the
focus is non-probability sampling technique. It all has to do with knowing or
not knowing the population on which the intended study is planned (Grinnell &
Unrau, 2005:155). In the most general sense, according to Kirk (2010:367),
Drunkman (2005:141-142), Grinnell and Unrau (2008:143); Unrau et al.
(2007:280) and Depoy and Gilson (2008:234), the probability to be
representatively selected permits the researchers to compute an estimate of
the accuracy of the sample even before the study is done.
Gravetter and Forzano (2003:118) support the possibility that in probability
sampling the odds of selecting particular individuals are known and can be
calculated. In addition, the selection of people from a population is based on
some form of random procedure. The best-known kinds of probability
sampling are simple random sampling, systematic sampling, stratified random
sampling, cluster sampling and panel sampling.
The researcher used probability sampling (cf. 1.5.5) and chose simple random
sampling (Maree & Pietersen, 2007a:172) as the method to draw the sample
of schools for the study, ensuring the inclusion of all secondary schools in
both districts, as well as rural and urban schools in different socio-economic
milieus.
The survey population included educators and learners currently involved at
public schools in the Sedibeng-East and Sedibeng-West Districts (D7 & D8).
A variety of schools was used in the study, as the two school districts
comprised of diverse socio-economic areas.
There were 100 public secondary schools in two districts: (n = 55) in
Sedibeng-East and (n = 45) in Sedibeng-West, including single medium ex-
Model C schools, parallel medium schools and dual medium schools. This
selection of schools provided for a distribution of participants in different
conditions. Using the guidelines for sampling as proposed by Stoker (in
Strydom, 2011:225), a systematic random sample of 45% of the schools (n =
45) was selected (cf. 1.5.5).
Chapter Four: Data analysis and interpretation 189
Methods of probability sampling
Monette et al. (2005:134) succinctly state that random sampling, also known
as probability sampling, is a method of drawing a portion, or sample, of a
population so that each of a population has equal chance of being selected.
They point out, however, that this definition, although it is easily understood, is
limited. A better definition would be that random sampling is the method of
drawing a sample of a population so that all possible samples of a fixed size n
have the same probability of being selected. The types of probability sampling
include simple random sampling, systematic sampling, stratified sampling,
cluster sampling and purposive sampling.
Simple random sampling
Marlow (2005:139) says that simple random sampling is the easiest of the
sampling methods where each individual in the population theoretically has an
equal chance of being selected for the sample (Jackson, 2003:15). The
researcher used simple random sampling to identify the target population of
learners and educators (cf. 1.5.5).
Systematic sampling
Here only the first instance is selected randomly, preferably from a random
table. All subsequent selections are chosen according to a particular interval,
for instance every fifth or tenth slot on a list of names, depending on the
percentage sample needed (Rubin & Babbie, 2008:166-167). The researcher
used convenient random sampling to identify the participating schools (cf.
1.5.5).
Non-probability sampling
According to Cohen et al. (2007:113), the selectivity that is built into a non-
probability sample obtained from the researcher targeting a particular group,
in the full knowledge that it does not represent the wider population, simply
represents itself. The types of non-probability sampling methods include
convenience sampling, quota sampling, purposive sampling, dimensional
sampling, snowball sampling, volunteer sampling and theoretical sampling.

Chapter Four: Data analysis and interpretation 190
Purposive sampling
In purposive sampling, the researcher selects specific elements from the
population that would be representative or informative about the topic of
interest. A decision is made, on the basis of the researcher‟s knowledge of the
population to be researched, about which subjects should be selected to
provide the best information to address the purpose of the research (McMillan
& Schumacher, 2006:126). The researcher used purposive sampling to
identify the EMS learners and educators
From the work of Creswell and Plano Clark (2007:112), it becomes clear that
purposive sampling occurs when researchers deliberately choose those
participants for their research who are familiar with the phenomenon that is
being investigated.
Thus, the researcher planned on using purposive sampling in her study, as
the groups of learners selected would be typical of those learners in district D7
and D8.
For the purpose of this study, choosing Grade 11 EMS learners who were
involved in CTA assessment during Grade 9 in 2009 as well as EMS
educators who experienced CTA during 2009 was done by way of non-
probability purposive sampling.
The sample in this research comprised of Grade 9 educators who taught EMS
(n = 60); HODs for EMS (n = 30); and learners who were involved in CTA in
2009: Grade 11 learners (n = 450). The total number of participants was (n =
540). The schools were selected through convenient and systematic random
stratified sampling (cf. 1.5.1): every second secondary school in the two
districts was selected.
The participating educators and learners were male and female and they
came from a variety of cultural backgrounds. This information is also covered
in Chapter One (cf. 1.5.5).
The size of a sample
The issue of the minimum size sample is repeatedly addressed in the
literature. It is generally indicated that the larger the population, the smaller
the percentage of the population sample needs to be, and vice versa
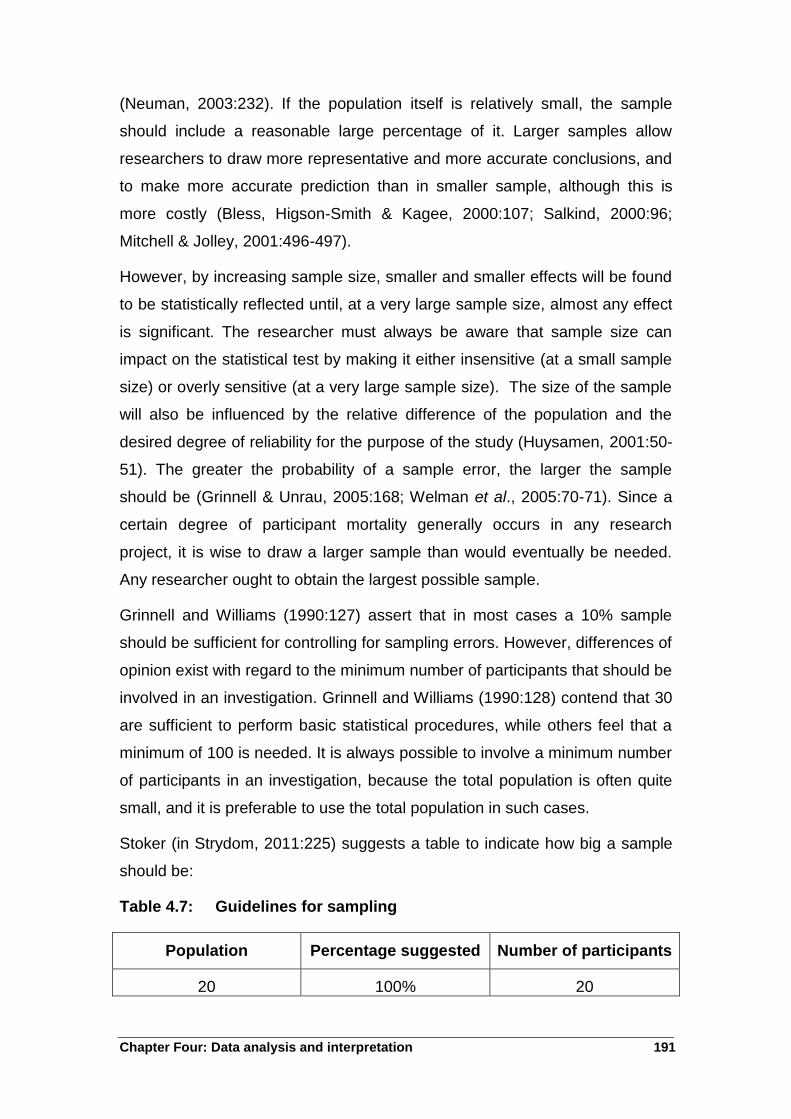
Chapter Four: Data analysis and interpretation 191
(Neuman, 2003:232). If the population itself is relatively small, the sample
should include a reasonable large percentage of it. Larger samples allow
researchers to draw more representative and more accurate conclusions, and
to make more accurate prediction than in smaller sample, although this is
more costly (Bless, Higson-Smith & Kagee, 2000:107; Salkind, 2000:96;
Mitchell & Jolley, 2001:496-497).
However, by increasing sample size, smaller and smaller effects will be found
to be statistically reflected until, at a very large sample size, almost any effect
is significant. The researcher must always be aware that sample size can
impact on the statistical test by making it either insensitive (at a small sample
size) or overly sensitive (at a very large sample size). The size of the sample
will also be influenced by the relative difference of the population and the
desired degree of reliability for the purpose of the study (Huysamen, 2001:50-
51). The greater the probability of a sample error, the larger the sample
should be (Grinnell & Unrau, 2005:168; Welman et al., 2005:70-71). Since a
certain degree of participant mortality generally occurs in any research
project, it is wise to draw a larger sample than would eventually be needed.
Any researcher ought to obtain the largest possible sample.
Grinnell and Williams (1990:127) assert that in most cases a 10% sample
should be sufficient for controlling for sampling errors. However, differences of
opinion exist with regard to the minimum number of participants that should be
involved in an investigation. Grinnell and Williams (1990:128) contend that 30
are sufficient to perform basic statistical procedures, while others feel that a
minimum of 100 is needed. It is always possible to involve a minimum number
of participants in an investigation, because the total population is often quite
small, and it is preferable to use the total population in such cases.
Stoker (in Strydom, 2011:225) suggests a table to indicate how big a sample
should be:
Table 4.7: Guidelines for sampling
Population Percentage suggested Number of participants
20 100% 20

Chapter Four: Data analysis and interpretation 192
30
50
100
200
500
1000
10 000
100 000
200 000
80%
64%
45%
32%
20%
14%
4.5%
2%
1%
24
32
45
64
100
140
450
2000
2000
The researcher of this thesis used Table 4.7 as a guideline to calculate the
size of her samples. The table below, Table 4.8, indicates the sample for this
research. The sample selection was based on all educators and Grade 9
learners in the Sedibeng-East and Sedibeng-West Districts during 2009.
Table 4.8: Sample selection of the research participants
Population Selected sample
Percentage selected
Sampling guidelines followed (Stoker)
Number of high schools in Sedibeng- East (55) and Sedibeng-West (45)
100 45 45%
Yes
EMS Educators
125 60 48% Yes
EMS HODs 45 30 66.7% Yes
EMS Learners
982 450 45.8% Yes
4.3.6.3 Representativeness of samples
The representativeness of a sample is important when researchers want to
generalize from the sample to a larger population, meaning the sample should
have approximately the same distribution of characteristics as the population
from which it has been selected (Marlow, 2005:136). If gender and socio-
economic class variables and characteristics are relevant to the research, a

Chapter Four: Data analysis and interpretation 193
representative sample will have approximately the same portion of men and
women from the middle and working classes. In this research, Grade 11 male
and female learners were represented; educators who taught Grade 9 were
also represented.
It is, nevertheless, important that all novice researchers such as the
researcher of this thesis, master the very simple practical technique of
drawing random samples using a table of random numbers of which most
methodologist textbooks usually have lists as appendices. Following the steps
above and Table 4.7 helped the researcher of this thesis in executing such
random sampling.
In this study, the researcher deliberately chose participants who are familiar
with the management and use of CTAs. Thus the researcher planned on
using purposive sampling in her study, as the groups of learners selected
were typical learners who did Grade 9 EMS CTAs during 2009 in the school
districts D7 and D8.
The following criteria for inclusion into the study were used:
Grade 9 educators who teach EMS
HODs of EMS
Learners who were involved in EMS CTA during 2009
4.3.7 Data analysis: quantitative data
The data collection, processing and analysis followed the survey research. A
statistically valid instrument with the SATISTICA software package was used
to obtain the results.
The data for this study were analysed by using the statistical package SPSS.
SPSS stands for Statistical Package for the Social Sciences. A professional
statistician of the North-West University, Vaal Triangle Campus, was
approached for support concerning the analysis and interpretation of data
collected from the questionnaires.

Chapter Four: Data analysis and interpretation 194
4.3.7.1 Descriptive statistics
As pointed out by Pietersen and Maree (2007c:183), the term descriptive
statistics is a combined name for a variety of statistical methods that are used
to systematize and sum up data in a significant manner, thus augmenting
appreciation of the properties the data have to offer (Pietersen & Maree,
2007c:183).
Blaikie (2000:236) indicates that descriptive methods are used to report the
distributions of a sample or population across a wide range of variables, using
all four of the measurements mentioned above. The aim of these methods is
to produce a scope of the characteristics of such distributions through
frequencies, measures of central tendency and measures of dispersion.
Moreover, the descriptive statistics can be presented in a graphical and/or
numerical way. The collected data were analysed by means of frequencies,
percentages, means and standard deviations.
By means of descriptive statistics, data were organized and summarized to
encourage an understanding of the data characteristics (Pietersen & Maree,
2007c:195).
This section presents the reactions gathered from the educators and learners
for each of the sections in the questionnaire. Each section focused on a
particular construct in relation to the management of the design and
implementation of CTA. Although some of the learner and educator
questionnaire items were directed to similar issues, the questions were
worded differently to suit the relevant group.
The data for the responses were summarized with frequencies, means and
percentages. Graphical and tabular depictions were provided to highlight the
prominent characteristics that radiated from the responses visually (Pietersen
& Maree, 2007c:185).
4.3.7.2 Inferential statistics
In this research, the researcher went beyond just summarizing and describing
the data she had collected. She made use of inferential statistics (cf. 1.5.7).
Inferential statistics involved using a small sample of the population and then

Chapter Four: Data analysis and interpretation 195
estimating the characteristics of the larger population from which the sample
has been drawn (Leedy & Ormrod, 2005:252). Inferential statistics, on the
other hand, use probability theory to test hypotheses, permit inferences from a
sample to a population and test whether descriptive results are likely to be
due to random factors or to a real relationship (Kruger & Neuman, 2006:350).
Blaikie (2000:237) asserts that methods of inference are used both to make
estimates of population characteristics and to establish whether relationships
within a sample can be expected to assist in predicting relationships in the
population from which the sample is drawn.
In order to determine whether there were any statistically significant
differences between the educator and learner responses derived from the
questionnaire, the responses were compared on the mean scores for each of
the questionnaire sections. T-tests were utilized to establish whether
differences that happened were statistically momentous (Pietersen & Maree,
2007a:230). In this study t-tests were administered to determine any
significant differences between the perceptions of the educators and those of
the learners where questions were similar. Correlations were drawn to
determine the strength of the relationships between the CTA-results
questionnaires of the learners and their perceptions. The comparison was
done on questions that were similar in the learner and educator
questionnaires in the Section B design and Section C implementation of CTA.
To determine the effect size of the statistical significant difference, Cohen‟s D
was calculated and the effect sizes were interpreted as follows (Cohen, in
Pietersen & Maree, 2007d:211):
0.2 – small effect
0.5 – medium effect
0.8 – large effect
The researcher made comparisons between the frequencies of the learner
and educator responses. Cramer's V was used as a way of calculating
correlations in tables which have more than 2x2 rows and columns. It is used
as a post-test to determine strengths of association after a chi-square
determined significance. Cramer's V varies between 0 and 1. Close to 0, it

Chapter Four: Data analysis and interpretation 196
shows little association between variables and close to 1, it would indicate a
strong association between learner and educator learner responses (cf. 5.8.1;
Table 5.47.
Chi-square was used to show a statistically significant relationship between
variables, but it did not say just how significant and important this is. Cramer's
V is a post-test that was used to get the additional information concerning the
effect size (Leech et al., 2008:244). The following guidelines were used to
interpret Cramer‟s V:
0.1 – small effect
0.3 – medium effect
0.5 – large effect (Cohen, in Pietersen & Maree, 2007d:212).
The researcher interpreted the numeric data by using descriptive statistics (cf.
1.5.7).
Quantitative methods of analysis fall into four main groups, according to
Blaikie (2000:236-237), but only the descriptive and inference groups were
relevant to this study.
4.3.8 Data analysis: qualitative data
The qualitative data were analysed by means of codes and themes. In this
regard, the researcher did multifaceted reasoning by using inductive and
deductive judgement during the content analysis of the qualitative data that
were gathered.
Content analysis refers to examining the gathered data for repeated
occurrences which can be identified methodically and clustered together
throughout the data set, by using some kind of coding scheme (Wilkenson,
2011:170). Moreover, according to Creswell (2013:45), following a bottom up
inclination helps a qualitative researcher to reason inductively while organizing
gathered data into categories, patterns and/or themes in order to create
abstract information units. The rationale lies in being able to work backward
and forward between the codes/themes and the data until the researcher has
established a wide-ranging theme set (Creswell, 2013:45).

Chapter Four: Data analysis and interpretation 197
Apart from using inductive thinking, Creswell (2013:45) points out the added
value of also using deductive thinking in order to construct themes that can be
matched against the data regularly. in sum, following an inductive-deductive
reasoning process when analysing qualitative data, supports researchers in
using multifaceted reasoning skills during the research process (Creswell,
2013:45).
4.3.9 Ethical considerations
According to Parse and National League for Nursing (2001:19), ethical issues
are always a vital consideration in any type of research as they are intended
to protect participants from any harm, emotional or physical, befalling them
during the course of the research study. Ethics are typically related with
morality and deal with matters of right and wrong.
According to Strydom (2005:56-57), involvement in research requires a
general awareness and acknowledgement of appropriate and inappropriate
conduct. The fact that research in the human sciences requires the
researcher to use human beings as objects of study means that the
researcher should be bound by these conducts. The researcher of this thesis
was therefore guided by, among others, the ethics of informed consent, no
deception, voluntary participation, no violation of privacy, as well as taking
responsibility towards the participants.
The researcher complied with the following four central ethical principles
(Creswell, 2009:88-92; Creswell, 2012:277-280; cf. 1.5.10):
4.3.9.1 Ethical issues in the purpose and questions
All researchers need to ensure that the rationale behind their research is clear
and that their research participants are well informed about this.
According to Welman et al. (2005:182), all research should be based on a
systematic review of the literature, with the specific purpose of determining to
what extent the research problem has already been addressed. A literature
review was conducted at the start of this study and the results revealed that
this specific research had not yet been conducted anywhere (cf. 1.1).

Chapter Four: Data analysis and interpretation 198
The researcher of this thesis developed a purpose statement that pointed out
the intent of the research clearly (cf. 1.2). Moreover, a specific primary
question was put (cf. 1.3.1), which led to clear secondary research questions
(cf. 1.3.2). She then made sure to communicate the purpose of her study to
all her research participants before the research was conducted.
4.3.9.2 Ethical issues in data collection
In collecting the data, researchers must value their participants and the places
where the research is conducted. No research participant should ever feel
under threat and populations at risk need to be revered.
In her data collection process, the researcher focused on having as little
disruption as possible at schools which participated in the research.
The promoter, Prof. Elda de Waal, has ethical clearance from the Ethics
Committee of the North-West University Committee to conduct her research
project, which would include all the postgraduate students studying under her
guidance. The ethics number is NWU-0068-11-A9 (cf. Addendum A).
Research permission was asked from and granted by the Gauteng
Department of Education (cf. Appendix B).
Informed consent, which is arguably the most fundamental principle for
ethical acceptability, is a standard procedure that the researcher follows in
order to make sure that all the participants understand potential hazards
(Babbie, 2010:67). However, Strydom (2005:59-60) adds to this that all the
detail concerning the aim of the study, the procedures and the
advantages/disadvantages also need to be made available to participants.
In the context of this research, informed consent was guaranteed by the
Sedibeng-East and Sedibeng-West school principals; EMS educators and
their Grade 11s were consulted to obtain permission for the research (cf.
Appendix C). Participants were provided with a description of what their
participation would involve and a statement indicating that their participation
was voluntary. The parents/caregivers of the underage participants were
consulted to give permission for learners to participate in this research

Chapter Four: Data analysis and interpretation 199
Moreover, the researcher involved participants in knowing about the nature
and purpose of the research, its risks and benefits, and they were allowed to
consent to participate without coercion. The researcher explained the whole
process of the administration of questionnaires, as well as the aims of the
research, to all the participants.
Wassenaar (2006:67 & 72-73) points out that participants need to consent to
taking part out of their own free will, with the option of withdrawing from the
study at any time, indicating their consent in writing by signing a document
that the researcher has prepared to that effect.
The researcher of this thesis told her participants that they were not forced to
take part in the study and that their participation was voluntary. They were
informed that they could refrain from participation at any point of the study,
should they feel like doing so. The participants were assured that any data
collected from or about them would be held in confidence (cf. Appendix F for
educators & Appendix G for learners).
Avoiding harm involves an assessment of any harm that the research may
cause. It is imperative that the researcher conducts the research in a way that
does not cause undue stress, harm or inconvenience to any participant,
especially not to learners (Welman et al., 2005:182).
The researcher ensured that the risk involved in participating in the study was
no greater than the normal risks of day-to-day living.
In addition to the above concerns during the data collection process, Welman
et al. (2005:182) discuss the significant ethical issue that no researcher
should conduct research without having acquired the relevant skills. The
researcher of this thesis acquired skills to administer questionnaires when she
was doing her Master‟s degree (M.Ed).
The goals of the study and research procedures that were followed during the
investigation were clearly stated while gathering the data, without any
deception. Participants were given ample time to ask questions relating to
the research. The research participants were informed of the fact that they
would have access to the research report if they wanted to verify any aspect
of the research (cf. Appendix C).

Chapter Four: Data analysis and interpretation 200
4.3.9.3 Ethical issues in data analysis and interpretation
Data of completed research must be safely stored for a realistic time-span,
such as 5-10 years. As done during her Master‟s degree, the researcher of
this study is aware of the fact that the analysed data needs to be kept for at
least 5 years. Her promoter, Prof Elda de Waal, will keep the data locked
away safely in her office.
Protecting participants’ identities – Babbie (2010:67) is of the opinion that
the researcher‟s most obvious concern while trying to protect participants‟
security and welfare should be that of shielding their individual identities.
Maree and Van der Westhuizen (2007:41-42) support this by referring to
protecting the identity of participants and regarding research results as
confidential as essential ethical aspects. Babbie (2010:67-68) describes
confidentiality as being guaranteed when the researcher is able to name a
given participant‟s responses, such as would be the case in a survey that
uses interviews, but pledges not to.
On the other hand, anonymity implies that the researcher cannot name a
certain response as belonging to a specific participant (Babbie, 2010:67).
The researcher of this thesis reassured all participants that they would not be
identified by their responses in the study. Their names were not used in the
returned questionnaires, thus another form of ensuring their privacy.
Access to findings – It is an important principle that any final report or
submission of findings is presented to the participants or is at least made
available to them. The findings in this research are to be presented to the
participants once the study has been finalized. Once the study has been
concluded, the researcher will send a copy of this thesis to the Gauteng
Department of Education.
4.3.9.4 Ethical issues in writing and disseminating the research
In the context of this study, the researcher noted the following three aspects
while writing up her research (Creswell, 2009:92; Creswell, 2012:277-280):
Bias – Biased language, which would cause unease concerning
gender/sexual orientation/disability/age, must be ignored as far as

Chapter Four: Data analysis and interpretation 201
possible. The researcher of this thesis steered clear of this dilemma by
using unbiased language at the relevant levels.
Falsification of results – It is unethical to fake, suppress and/or make up
findings. Therefore, while reporting on the data, the researcher of this
thesis reported only on the actual responses of the participants.
Plagiarism – It is unethical to use other researchers‟ ideas or content
without the correct and frequent acknowledgements. Therefore this
researcher took special care to re-word and paraphrase her information
while at the same time referencing frequently according to the NWU
Quoting Sources requirements. Each chapter was also put through the
Turnitin system (cf. Appendix M).
4.4 SUMMARY
The research methodology employed in this study was discussed in this
chapter. The methodology entailed the description of the research design,
strategy of inquiry, the population and sampling, the data collection methods,
the data analysis and measures to ensure validity and reliability of the study.
The study involved using mainly quantitative research in an investigation into
the management of the quality of the design and implementation of CTA.
This chapter started with an introduction to the chapter (cf. 4.1). Thereafter,
the researcher gave guidance concerning her choice of research paradigms:
she revealed that she would be following a positivist and a post positivistic
paradigm in her study (cf. 4.2). The research design was discussed (cf. 4.3).
The researcher stated that she was following a single method (quantitative)
design for the main part of her study, with a small qualitative dimension. In
the section on the strategies of inquiry (cf. 4.3.1), the researcher revealed that
the bigger quantitative component focused on description (cf. 4.3.2.1), while a
phenomenological approach was followed in the smaller qualitative
component (cf. 4.3.2.2). Brief mention was made of the comparative
education design that would be followed (cf. 4.3.2.3), which comprised that
learners and educators‟ perceptions regarding the design, implementation and
management of CTA were established. The method of choosing the research
participants was revealed, namely purposive sampling (cf. 4.3.2.4) and

Chapter Four: Data analysis and interpretation 202
thereafter the researcher made known how she planned and constructed her
closed-ended questionnaires. This included pointing out the four-point Likert
scale questionnaire items with options such as strongly agree, agree,
disagree or strongly disagree as used in her quantitative research (cf. 4.4.1).
Open-ended questions were also included in both the educators and learners‟
questionnaires (cf. Appendix F and G).
The pilot study and the data thereof were mentioned (cf. 4.4.2) and the actual
study was thereafter focused on (cf. 4.4.3). In both of these study references,
the researcher referred to reliability, validity, and the application thereof.
Internal validity, external validity, statistical conclusion reliability and validity
were considered (cf. 4.4.1.1). Concerning both of these methods, the
researcher not only indicated how they were used in her study, but also
pointed out the advantages and disadvantages of each. The role of the
researcher (cf. 4.6) and how the data analysis of the quantitative dimension
was conducted and interpreted were looked at (cf. 4.7.1). Both descriptive
and inferential procedures were used (cf. 4.6.1). The researcher paid attention
to significant ethical considerations (cf. 4.8) and gave feedback on the
research challenges that she had foreseen in Chapter One (cf. 1.7 & 4.9).
The researcher will pay attention to analysing and interpreting the data in the
next chapter, Chapter Five.
CHAPTER FIVE
DATA ANALYSIS AND INTERPRETATION
5
5.1 INTRODUCTION
Chapter Four outlined the empirical research design that was followed in order
to gather information that would be relevant to achieving the aim of this
research.
The empirical survey that was used in the context of the research determined
by means of questionnaires how the design and implementation of CTA are