Embed Size (px)
Citation preview

The Moroccan-American FTA Effects on the Agricultural and Food Sectors in Morocco
Akka Ait El Mekki
National School of Agriculture, Meknes, Morocco Wallace E. Tyner
Purdue University, West Lafayette, Indiana, USA
Over the past twenty years, there have been significant reforms in the Moroccan agricultural sector. In the early 1980s, Moroccan agriculture, indeed the Moroccan economy, was highly regulated with important state interventions throughout the system. Sectoral adjustment in the industrial sector began in the early 1980s and in agriculture in the late 1980s. Morocco was an active participant in the GATT round of trade negotiations, and even hosted the signing of the agreement in Marrakech. In accordance with its GATT offer, Morocco converted its quantitative (licensing) import restrictions to tariffs. In 1996, a major reform was implementing in its agricultural tariff regime as well as domestic marketing regulations. Private importers and domestic traders gained substantial freedom of operation. In 1998, protection was reduced on maize. In 2000, the entire system of oilseed chain protection and subsidies of vegetable oils was reformed. In 2003, another tariff reform was implemented for cereals. In Morocco, as in most countries, the most sensitive sector is agriculture, and the most sensitive products are agricultural products. In Morocco 16-20 percent of GDP and 40 percent of employment is in agriculture. Now Morocco and the US have completed negotiations on a Free Trade Agreement (FTA) that would help stimulate further reforms in agriculture. The hope and expectation is that the reforms taken to date plus additional reforms linked to the FTA will increase productivity and efficiency in Moroccan agriculture and thus lead to higher growth and economic and social well-being. Analysis of the impacts of the FTA is one input into the process of understanding the consequences of the agreement.
To address these issues and other questions that are connected to the direct and indirect effects of alternative policies on the agricultural and food sectors, a computable general equilibrium model (CGE) is used to highlight the incidence of protection changes on the variables of interest. Such variables include mainly domestic agricultural and food supply, imports and exports, terms of trade, economic growth, and welfare issues. CGE models are considered as the most appropriate analytical framework for trade policy analysis because they capture the interaction among all sectors of the economy. The present research has been conducted using the Global Trade Analysis Project (GTAP) analytical framework and data set (see Hertel and Tsigas, 1997).

2
In this paper, we first provide a review of the literature on other analyses that have been conducted of Moroccan trade liberalization. Then we provide background information on Moroccan trade patterns and other trade negotiations and agreements. Section 3 summarizes data and GE model features and reports the major results of the analysis. The analysis was completed before the negotiations, so it does not reflect the specific details of the agreement. Concluding remarks are in section 4. 1. Applied CGE Models overview
In this review, we report on CGE models that have been developed and used for analysis of various liberalization issues in Morocco. While we have reviewed the readily available literature in this area, it is still possible that other studies have been conducted that escaped our attention.
The work of Cogneau and Tapinos (1995) focused on the issue of trade liberalization as an alternative to international migration between Morocco and Europe. They used a multisectoral dynamic CGE model of the Moroccan economy to assess the likely consequences of free trade on incomes and employment and also on the distribution among sectors and social categories. The main results show that the increase of indirect taxes and the devaluation of domestic currency accompanying the diminishing import duties from liberalization tend to reduce positive effects of better factor allocation. A free trade policy would only have a limited impact on national income, total employment and poverty. Cogneau and Tapinos (1995) suggest that agricultural and manufacturing exports must be boosted to get more significant impacts from free trade with the E.U.
Rutherford et al (1994) constructed a CGE model with 39 sectors where citrus, vegetables, cereals, sugar, meet and dairy products, textiles, clothing, fisheries and phosphates are represented. The comparative static model has been used to simulate various policy options including liberalization with the EU and the rest of the world. Results show that a free trade agreement between EU and Morocco would improve Moroccan income by about 1.5 percent of GDP. The improvement increases to 2.5 percent of GDP if Morocco frees its trade with the rest of the world. Both production and employment grows in sectors like citrus, vegetables and phosphates because of better access to the European market. Conversely, employment in sectors such as cereals, meet, dairy products and sugar may shrink because of lower import prices from the EU.
The CGE model of Roland-Holst and van der Mensbrugghe (1994) was a result of a World Bank – OECD collaboration with the government of Morocco as an instrument for global economic policy analysis. Two main efforts have been undertaken for this purpose. The first one was the construction of a 1990’s Social Accounting Matrix (SAM) for Morocco with 133 sectors from which agriculture concerns 23 sectors. The second effort was the construction of the CGE model itself. The model structure includes 10 household categories and three commercial partners (EU, Rest of Europe, Rest of the World). All sectors work with constant returns of scale technology embodied in a CES system. Commodities are traded on the basis of the Armington hypothesis.

3
The model has been made available to other researchers. Thus, various policy prescriptions may be simulated with respect to the trade policy, public finance, industrial policy and agricultural policy.
Doukkali (2003) has assessed the potential gains or losses of cereal policy reforms using a GE model. The main policies that have been implemented are related to the elimination of the flour subsidy and to the tariff elimination in imports of cereals. To capture the differences among areas, the model distinguishes six ecological areas where sixteen agricultural sub-sectors have been included (3 and 13 respectively from animal and vegetal sectors). Results suggest that on balance Morocco gains in terms of national income even though there are substantial disruptions in the cereals sector. Production and price of wheat falls substantially in all scenarios.
Karaky (2002), has also addressed the cereals trade liberalization issue taking
into account climate variability in a GE model. His main findings show that the impact of trade barrier elimination on wheat improves welfare in the aggregate despite negative effects on farm output and decline in agricultural terms of trade.
Elbehri and Hertel (2003) implemented a GE model with oligopoly and scale economies to evaluate the impacts of the Morocco-EU FTA on the macroeconomic and sectoral components. Their results show that the FTA may have adverse effects on the Moroccan economy due, among others, to deteriorating terms of trade and reduction of output in most profitable sectors. In contrast, simulations of the WTO Multilateral Liberalization displays more beneficial effects that led authors to positive conclusions regarding the advantages of trade liberalization under the provisions of the Doha Development Round.
The most important objective of these CGEs was to assess Impacts of Morocco-EU trade policy changes or the impacts of multilateral liberalization. None of them addressed the USA-Morocco FTA issue and its effects on variables of interest in Morocco. The present study aims to fill this gap of information by using adaptations of existing modeling tools tailored to the Morocco-US FTA issue. In this way, it will effectively contribute to building more knowledge about the American-Moroccan economic partnership and allow policymakers and professionals to have a better understanding of what could be expected from this bilateral free trade agreement. Section 3 displays the main features of data and the model implemented in this analysis. But first we provide some basic background information on Morocco-US trade relationships. 2. Background for the Moroccan-American FTA As indicated above, Morocco was an active participant in the GATT round of multilateral negotiations. Morocco remains an active player in the Doha round of WTO trade negotiations. In addition, Morocco is engaged in trade negotiations and trade agreements with several economic partners. Morocco and the EU signed an Association Agreement in 1996, which entered in application on March 1, 2000, and is

4
intended to lead to free trade between the two partners by 2012. Currently, The EU remains the most important client and supplier of Moroccan exports and imports respectively. It accounts for around 60 to 70 percent of Moroccan trade. Agricultural commodities were largely excluded from the Morocco-EU Association Agreement. However active ongoing bilateral negotiations are in progress to expand coverage of agricultural commodities.
Morocco is also committed in FTAs with a number of Arab countries (Jordan, Egypt, Lebanon) despite the weak range of bilateral trade. There have been discussions and agreements over the years related to a Maghreb area trade agreement.
However, none of the discussions or agreements to data are as far ranging as a
possible FTA with the United States. The general pattern of such US FTAs is that after the adjustment period, the tariffs and quotas are all removed, and there is completely free trade in all commodities. So even though there is not a lot of trade between Morocco and the US today, the FTA would open the door to significantly expanded trade in the future. Abbott et al (2000) justify such opportunities by one of major features of the ‘New Economy” that bases trade on niche markets.
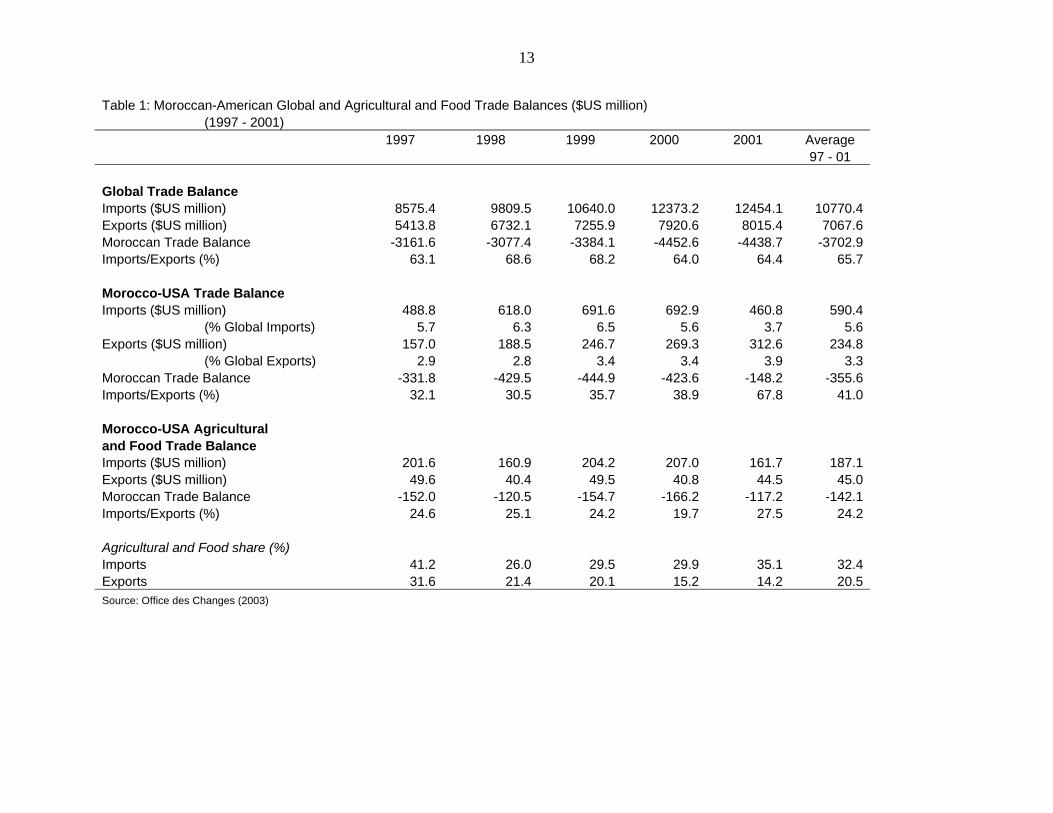
The US exports to Morocco annually about $600 million which is equivalent to 5 to 7 percent of Moroccan imports (Table 1). On average, 30 to 35 percent of these imports are agricultural products (mainly cereals). Moroccan exports to the USA amount to about $250 million, or about 3 to 4 percent of domestic exports. Agriculture and food products account for 15 to 20 percent of total exports from Morocco to the USA. So it is clear that Morocco has an important trade deficit with the US, both overall and in agricultural goods. Morocco has an average deficit of $356 for all-goods trade and $142 million for agriculture based commodities. Nevertheless, the US ranks annually fourth or fifth partner for Moroccan imports and seventh or eighth for Moroccan Exports. Conversely, contribution of trade with Morocco is almost insignificant to the USA. Exports and imports to and from Morocco represent respectively around 0.08 percent and 0.04 percent of the American total exports and imports.
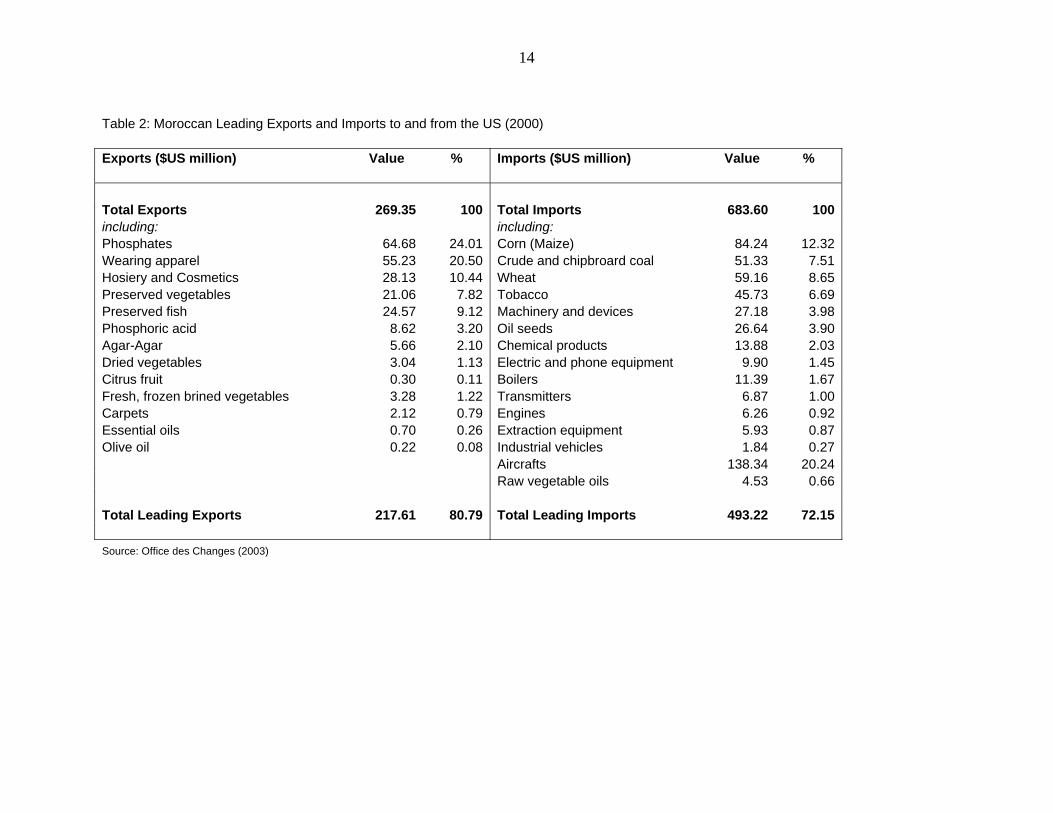
Table 2 displays the main traded commodities between the US and Morocco. Agricultural imports are dominated by cereals (corn and wheat), tobacco, and oil seeds, while fresh and processed vegetables lead agricultural exports. Industrial and natural resources exchanges concern mainly machinery and aircrafts for imports and phosphates and wearing apparel for exports. American binding import tariff rates are low in general. For Morocco, a number of basic food commodities are highly protected such as bovine meat (275 percent), chicken meat (124 percent) live bovine (251.5 percent), and soft wheat (135 percent). Theoretically, low tariffs may play a small role in determining trade and investment flows as pointed out by Abbott et al (2000). This strengthens the assumption that stronger effects will be registered for highly protected items in the FTA.

5
3. Model Implementation
This research develops policy simulations accounting for the expected new rules of trade between Morocco and the US in major agricultural and food products. As we have seen above, none of referenced models has evaluated a possible free trade scheme between the US and Morocco. Policy makers and professionals need to have at their disposal analysis which can help them anticipate the consequences of alternative policy choices. Even though the analysis focuses on the consequences of a possible Morocco-US FTA, that analysis must be taken into context with the other international agreements Morocco has, in particular with the EU. 3.1 Data and GTAP Framework
The data used for analyses implemented in this paper derive from GTAP database. GTAP 5 version of the model has data for 66 regions and 57 commodities (see Gehlhar et al, 1997). All commodities are presented in US dollar values based on 1997 national input/output tables. Flows of these commodities are also shown in terms of origin and destination among countries. For each country, domestic and imported commodities are used by private households, firms and government who pay direct and indirect taxes1. Domestic supply for each activity is either sold on the domestic market or exported. Activities or sectors purchase intermediate inputs in addition to five primary factors - namely land, unskilled labor, skilled labor, capital and natural resources. Factor sales and taxes add up to compose income which is distributed to economic agents.
In this study, we focus on those commodities that represent the main part of exchanged bundles assuming that trade is led by the comparative advantage concept. As pointed out by Abbott et al (2000), it is very difficult to predict new products and services that could be involved in trade on the future. Table 3 depicts the model commodities taking the GTAP database into account. American and Moroccan companies will have the opportunity to explore opportunities of trade on goods that could generate profits. However, the GTAP model can only help to predict trade expansion or diversion of existing commodities.
Also, the choice of regions is of great importance in this study. As is pointed out above, the EU remains the most important economic partner of Morocco. Accordingly, besides Morocco and the US, the EU is added as the third region to the model, and the rest of the world (ROW) as the fourth region.
The standard closure of the static GTAP model has been applied. However, Moroccan import tariffs were adjusted for changes that have occurred since 1997, Moroccan import tariffs have changed for cereals, oil seeds, vegetable oils and meat (Table 4). These modifications are taken into account using the Altertax command of GTAP in order to better represent the current situation. Altertax is a tool that uses a
1 In the standard GTAP version, there are five different tax instruments which are factor taxes, output taxes, domestic commodity taxes, import tariff revenue and export taxes.

6
special closure and parameters file of the model with minimum changes to the rest of database (Pearson, 2003).
For the policy experiments, we assume the standard US FTA structure of 100 percent trade liberalization following the adjustment period, although the agreement reached does not precisely conform to that standard. Since this is a comparative static analysis, no consideration is given to the transition path to this totally free bilateral trade situation. As was done in some of the earlier studies, we also simulate the results of multilateral trade liberalization in addition to the bilateral case. As we shall see, the two cases make an interesting contrast. 3.2 Results
Analysis focuses on the impact of bilateral and multilateral tariff elimination on macroeconomic and welfare issues, trade flows and domestic production in Morocco. Effects are measured in percentage changes from the 1997 baseline as corrected by the Altertax tool. The solution of the model uses the Gragg solution method, which is a multi-step procedure used for nonlinear equations such as in GTAP model (Pearson and Horridge, 2003). Results are obtained from a standard closure of the GE model assuming perfect competition and constant returns to scale. An alternative closure that reflects unemployment of unskilled labor in Morocco was tested, but results were not significantly different from standard closure outcomes. 3.2.1 Aggregate and welfare effects
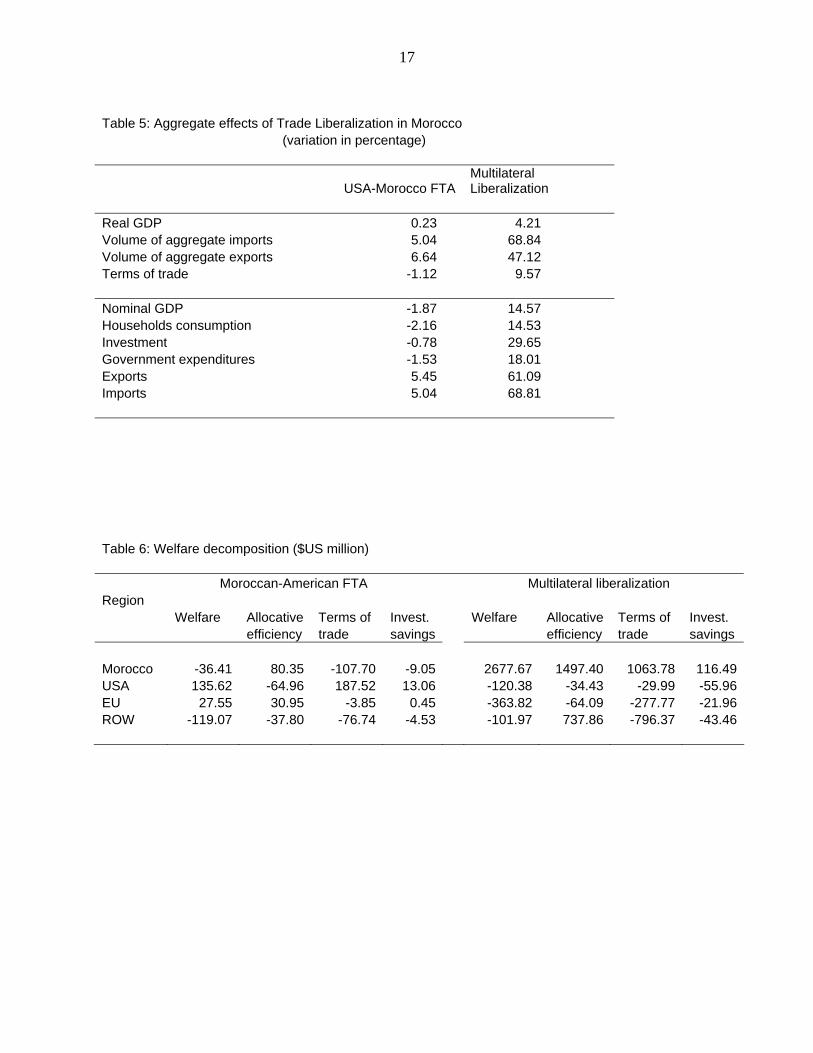
Table 5 depicts aggregate impacts on Morocco for both the FTA and multilateral liberalization scenarios. Real GDP increases slightly in the FTA experiment by 0.23 percent ($US 80 million) whereas nominal GDP decreases by 1.87 percent showing a significant reduction of the general price level (deflator). Economic welfare in Morocco falls ever so slightly by $36 million. Allocative efficiency goes up as would be expected, but the negative terms of trade effect more than offsets the allocative gains. Moroccan imports value increases 5.0 percent while exports gain 5.5 percent (Tables 5, 7-8).
To deepen this analysis, further decomposition of each component of the main
welfare contributors shows that the more important effect on allocative efficiency comes from the elimination of the import tariff itself. In fact, the elimination of Moroccan import duties towards American commodities contributes to 69 percent of the resource allocation gain. The remainder effect is due to the reduction of American duties on its imports from Morocco.
US real GDP actually decreases 65 million, which is an insignificant change.
Economic welfare increases $135 million in the US (an insignificant change) as positive terms of trade effects outweigh negative allocative effects.
Results of multilateral liberalization are much more positive than those obtained
for the FTA. For Morocco, real GDP increases 4.2 percent, while nominal GDP

7
increases 14.6 percent. Economic welfare increases $2.7 billion with $1.5 billion in allocative efficiency gains and $1.1 billion in terms of trade. Imports increase 69 percent, and exports increase 47 percent in volume and 61 percent in value. Households’ consumption, investment and government expenditures all show a 2-digit positive increase. Investment, which is a GDP component of significant interest with regards to economic growth issues, increases 30 percent.
For the multilateral liberalization, allocative efficiency gains also are due largely
to the contribution of the Moroccan import tax elimination. The decomposition of the terms of trade shows that the export prices of services, wearing apparel, processed food, vegetables and fruits and chemical products are the most important prices leading to the improvement. On the other hand, the effect of all import prices is negligible. This should be related to the Moroccan comparative advantage in producing the majority of the products that belong to the aggregated export commodities cited above. Impacts of the FTA on the EU and rest of the world welfare are minimal. The EU has a gain of $27.5 million (table 6), while the rest of the world has a loss of $119 million, also insignificant. For multilateral liberalization, the EU has a welfare loss of $364, still small, while the rest of the world shows an insignificant loss of $102 million. In both cases most of the ROW losses can be attributed to negative terms of trade effects. With the FTA experiment, The EU has a tiny positive allocative effect due mainly to the export taxes effects. 3.2.2 Sectoral effects Imports
Under the FTA, Moroccan imports increase by $514 million (Table 7). Imports from the US increase by $923 million, but EU and rest of world imports decrease by $253 and $156 respectively. In other words, of the total increase in imports from the US, 56 percent is trade creation and 44 percent trade diversion. The largest import changes are in wheat, red meat, and other industrial manufactures ($249, $224, and $120 million respectively).
The imports of other cereals (corn and barley) from the US increase by 126 percent, or $54 million. However, imports from the EU and rest of world go down almost 40 percent, so total other cereal imports increase 44 percent. Other sub-sectors with sizeable two digit absolute increases in imports are beverages and tobacco ($53 million), dairy products ($40 million), other agriculture ($38 million), machinery and equipment ($51 million), and wearing apparel ($46 million). Interestingly, other animal products, which includes poultry, increases only $12 million. The percentage changes reported in Table 7 can be very large (e.g., red meat from the US at 4,400 percent). However, it is important to note that most of these large changes are from a base near zero (Table 11). So the percentage changes are not that meaningful.

8
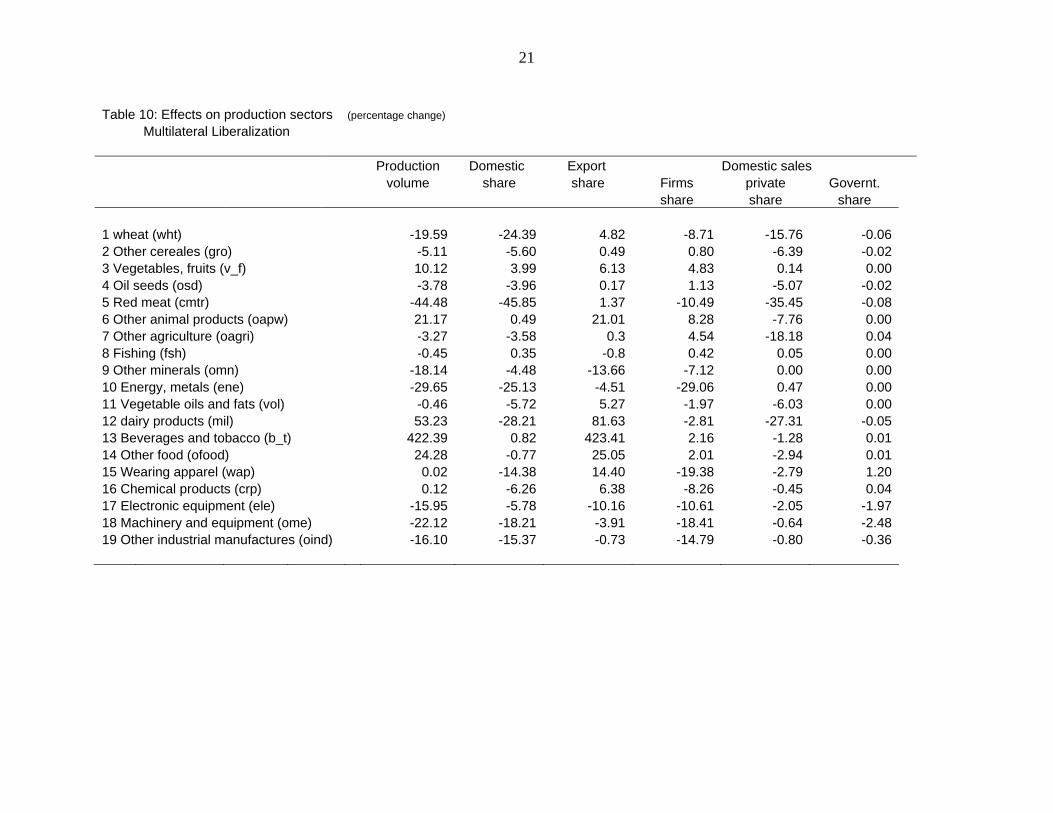
The multilateral liberalization yields quite different results in import patterns. Imports from all regions rise for almost all commodities. Wheat imports increase by about 240 percent from all regions. Similarly, other cereal imports increase by about 154 percent from all regions. There are substantial red meat imports from all regions. In total, Moroccan imports increase by $7.0 billion, and these imports are spread among all three regions (US, EU, and rest of world). Either in FTA or Multilateral Liberalization, agents’ use of imports in Morocco displays very close patterns depending on products types. However, firms have tendency to use more agriculture-originated products in ML than in FTA. For example, the firms share in using imports of cereals is 51 percent for ML against 48 percent for FTA. Dairy products, bovine meat and beverages and tobacco imports may experience a supplementary transformation before their finale use by private households. The outcome fosters the idea that with more economic openness, Morocco should concretize more industrialization of its production sectors. Food sector may be progressively important leading to a shift in households’ consumption models that could enhance the demand for transformed goods at the cost of the primary food products. Exports In general, the magnitude of export variation ($535 million increase) is lower than for imports. Moreover, with the FTA experiment, none of items shows an export reduction either to the US, the EU or the Rest of the World. This is a very interesting result because of its trade expansion effects on the production sectors in Morocco (Table 8). Exports to the US, EU, and ROW increase $151, $277, and $107 million respectively. The biggest export gain is wearing apparel, and these exports increase to all three regions. In fact, increased exports of wearing apparel account for 46 percent of the export increase. The other significant export increase is in other food, and it accounts for 20 percent of the total increase. So these two categories alone constitute two-thirds of the export increase. In contrast, the Multilateral Liberalization experiment displays quite different results for exports than those obtained at the FTA scenario. Total exports increase $5.9 billion, but exports to the US actually shrink $165 million. The major market is ROW with an increase in exports of $4.4 billion. The only significant increases in exports to the US under multilateral liberalization are wearing apparel ($35 million) and other food ($11 million). Production Tables 9 and table 10 display results of simulations on Moroccan production sectors with FTA (Table 9) and Multilateral Liberalization (Table 10). Under the FTA, production of wheat (-8%), other cereals (-4%), red meat (-22%), dairy (-3%) and

9
beverages and tobacco (-7%) all fall. The reason is that the domestic sales share of these products fall by essentially the same amount as production while exports remain unchanged. Domestic sales weaken because firms share and households share in use of domestic output fall. Effects on national production are small but positive for the rest of production categories. Moreover, the export shares of all items experience a positive change showing an increased participation of production sectors in international trade. Surprisingly, ‘other animal products’, a group which includes poultry among others, is not affected by the American-Moroccan FTA experiment. Domestic production is stable, increasing by 0.2 percent. Effects of Multilateral Liberalization on Moroccan production sectors are much more pronounced. The majority of industrial and mineral aggregations experience a 2-digit percentage decrease largely because of reduced firm demand for domestic inputs. Impacts on agricultural goods are mixed with wheat declining 20 percent, red meat falling 44 percent, and other cereals and oilseeds falling 5 and 4 percent respectively. However, other animal products (the group containing poultry) increases 21 percent, and dairy products increases 53 percent. Fruits and vegetables increase 10 percent with 60 percent of that increase destined for export. The largest increase is beverages and tobacco (422 percent) with most of the increase going to added exports. 4. Concluding Remarks This paper undertakes policy simulations using the GTAP model framework and database to anticipate consequences of the free trade agreement (FTA) between Morocco and the US. A GTAP standard closure with import tariffs updating (Altertax tool) is used along with Gragg solution method for the model implementation. The data aggregation based upon the 1997 GTAP database distinguishes twenty economic sectors and four regions (Morocco, USA, European Union and the Rest of the World). The introduction of the EU as a separate region in the model is justified by the importance of its economic partnership with Morocco. Both the FTA and complete multilateral liberalization are simulated in order to contrast the bilateral and multilateral results. The major conclusion is that Morocco gains much more from multilateral trade liberalization than from the FTA. Under multilateral liberalization, Moroccan GDP increases 4 percent, and welfare increases by $2.7 billion. Thus if both complete multilateral liberalization and an FTA were possible outcomes, Morocco would be better off pursuing the multilateral liberalization. However, as the recent Cancun failure illustrates, complete multilateral liberalization is highly unlikely. That meeting failed far short of complete liberalization. Indeed, complete liberalization has never even been discussed. So while the multilateral case is very interesting, it may not represent a realistic option. Turning to the FTA, the bottom line is that Morocco neither gains nor loses in aggregate from the agreement. There is a very small increase in real GDP, and a very

10
small decrease in welfare. In the agricultural sector, the largest production impact is on red meat followed by wheat. These results are in accordance with prior expectations. Red meat and wheat are both highly protected in Morocco at present. However, the changes are not huge with red meat falling 22 percent and wheat 8 percent. In terms of imports from the US, the largest changes are in wheat and red meat with wheat imports increasing $249 million and red meat $224 million. These changes account for over half the increase in US imports. Of course part of these increases are due to trade diverted from the EU and ROW and not net additional imports. For Moroccan exports, the picture is different. The largest change is in wearing apparel, which also is in accordance with expectations. However, exports increase more to the EU than they do to the US, including wearing apparel. In fact, exports increase for all products to all three regions. This change is largely due to the reduced prices of export goods. The results of this analysis largely confirm prior expectations. In a comparative static framework, the FTA does not offer significant gains for Morocco. The largest sector gains are for wearing apparel. But the losses in agriculture are real, albeit smaller than some have estimated. Losses in agriculture from the actual agreement reached would be even smaller as wheat and red meat imports remain limited by quotas. However, proponents of the FTA have never claimed large comparative static gains. Most of the gains will come from the policy restructuring Morocco will undertake as part of the FTA. This restructuring will render the Moroccan economy more efficient and more capable of competing in the global economy. Also, the FTA should encourage more US direct investment in Morocco, which is not captured in the comparative static analysis.

11
References Abbott P.C., T. Abdelkhalek and B.L. Salinger (2000), Future Outlook For Morocco-U.S. Trade and Investment Relations. Associates For International Resource and development. Cambridge. Cogneau D. and G. Tapinos (1995), Libre Echange, Répartition du Revenu et Migrations au Maroc. Revue d’Economie de Développement, 1/1995. Doukkali R. (2003), Etude des Effets de la Liberalisation des Cereales: Resultats de Simulations a l’Aide d’un Modele d’Equilibre General calculable. Royaume du Maroc, Ministere de l’Agriculture et du Developpement Rural/ Banque Mondiale. Elbehri A. and T. Hertel (2003), Economic Integration and Market Structure : Analysis of the EU-Morocco FTA vs. Multilateral Liberalization. Global Trade Analysis Project (GTAP), Purdue University, West Lafayette, IN, USA. Gehlhar M., D. Gray, T.W. Hertel, K. M. Huff, E. Ianchovichina, B.J. McDonald, R. McDougall, M.E. Tsigas and R. Wigle (1997), Overview of the GTAP Database. In Hertle T. W. (Ed), Global Trade Analysis : Modeling and Applications. Cambridge, Cambridge University Press. Hertel T.W. and M. E. Tsigas (1997), Structure of GTAP. In Global Trade Analysis : Modeling and Applications. Ed. Thomas W. Hertel, Purdue University. Cambridge University Press. KARAKY R. H. (2002), Climate Variability and Agricultural Policy in Morocco. PhD. Thesis, Purdue University, West Lafayette, IN, USA. Pearson K. (2003), Some GTAP Software Tools. Eleventh Annual Short Course in Global Trade Analysis, August 2-8 2003. Purdue University, West Lafayette, IN, USA. Pearson K. and Horridge M. (2003), Hands-On Computing with RunGTAP and WinGEM to Introduce GTAP and GEMPACK. Eleventh Annual Short Course in Global Trade Analysis, August 2-8 2003. Purdue University, West Lafayette, IN, USA. Roland-Holst D. and D. van der Mensbrugghe (1994), Modèle d’Equilibre Géneral Pour le Maroc. OCDE. Rutherford T. F., E. E. Rutström and D. Tarr (1994), L’Accord de Libre Echange entre le Maroc et la CEE: Une Evaluation Quantitative. Revue d’Economie et de Développement, 2/1994. Also consulted:

12
L’Economiste, Daily News paper with economic variant Web Sites www.oc.gov.ma: Office des Changes, Morocco www.statistic.gov.ma: Direction de la Statistique, Morocco www.gtap.org: Global Trade Analysis Project, Purdue University, IN, USA www.usitc.gov: US International Trade Commission, Washington DC, USA
13
Table 1: Moroccan-American Global and Agricultural and Food Trade Balances ($US million) (1997 - 2001) 1997 1998 1999 2000 2001 Average 97 - 01 Global Trade Balance Imports ($US million) 8575.4 9809.5 10640.0 12373.2 12454.1 10770.4Exports ($US million) 5413.8 6732.1 7255.9 7920.6 8015.4 7067.6Moroccan Trade Balance -3161.6 -3077.4 -3384.1 -4452.6 -4438.7 -3702.9Imports/Exports (%) 63.1 68.6 68.2 64.0 64.4 65.7 Morocco-USA Trade Balance Imports ($US million) 488.8 618.0 691.6 692.9 460.8 590.4 (% Global Imports) 5.7 6.3 6.5 5.6 3.7 5.6Exports ($US million) 157.0 188.5 246.7 269.3 312.6 234.8 (% Global Exports) 2.9 2.8 3.4 3.4 3.9 3.3Moroccan Trade Balance -331.8 -429.5 -444.9 -423.6 -148.2 -355.6Imports/Exports (%) 32.1 30.5 35.7 38.9 67.8 41.0 Morocco-USA Agricultural and Food Trade Balance Imports ($US million) 201.6 160.9 204.2 207.0 161.7 187.1Exports ($US million) 49.6 40.4 49.5 40.8 44.5 45.0Moroccan Trade Balance -152.0 -120.5 -154.7 -166.2 -117.2 -142.1Imports/Exports (%) 24.6 25.1 24.2 19.7 27.5 24.2 Agricultural and Food share (%) Imports 41.2 26.0 29.5 29.9 35.1 32.4Exports 31.6 21.4 20.1 15.2 14.2 20.5Source: Office des Changes (2003)
14
Table 2: Moroccan Leading Exports and Imports to and from the US (2000) Exports ($US million) Value % Imports ($US million) Value % Total Exports 269.35 100 Total Imports 683.60 100
including: including: Phosphates 64.68 24.01 Corn (Maize) 84.24 12.32Wearing apparel 55.23 20.50 Crude and chipbroard coal 51.33 7.51Hosiery and Cosmetics 28.13 10.44 Wheat 59.16 8.65Preserved vegetables 21.06 7.82 Tobacco 45.73 6.69Preserved fish 24.57 9.12 Machinery and devices 27.18 3.98Phosphoric acid 8.62 3.20 Oil seeds 26.64 3.90Agar-Agar 5.66 2.10 Chemical products 13.88 2.03Dried vegetables 3.04 1.13 Electric and phone equipment 9.90 1.45Citrus fruit 0.30 0.11 Boilers 11.39 1.67Fresh, frozen brined vegetables 3.28 1.22 Transmitters 6.87 1.00Carpets 2.12 0.79 Engines 6.26 0.92Essential oils 0.70 0.26 Extraction equipment 5.93 0.87Olive oil 0.22 0.08 Industrial vehicles 1.84 0.27 Aircrafts 138.34 20.24 Raw vegetable oils 4.53 0.66
Total Leading Exports 217.61 80.79 Total Leading Imports 493.22 72.15
Source: Office des Changes (2003)

15
Table 3: Commodity Aggregation Model Sector GTAP classification Agriculture and natural resources 1. Wheat (wht) wheat (wht) 2. Other cereals (gro) Cereal grains n.e.c (gro) 3. Vegetables, Fruits (v_f) Vegetables, fruits, nuts (v_f) 4. Oil seeds (osd) Oil seeds (osd) 5. Other agriculture (oagri) Paddy rice (pdr); Sugar Cane, sugar beet (c_b) Plant-based fibers (pfb); Crops nec (ocr), Wool silk-worm cocoons (wol); Bovine Cattle, Sheep and goats, horses (ctl); Raw milk (rmk) Forestry (for) 6. Fishing (fsh) Fishing (fsh) 7. Energy and mineral (ene) Coal (col); Oil (oil); Gas (gas); Ferrous metals (i_s); Metals nec (nfm); Water (wtr); 8. Other minerals (omn) Minerals nec (omn) Food Manufactures 9. Vegetable oils and fats (vol) Vegetable oils and fats (vol) 10. Dairy products (mil) Dairy products (mil) 11. Meat: cattle, sheep, Meat: cattle, sheep, goat, horse (cmt) goat, horse (cmt) 12. Animal products nec (oap) Animal products nec (oap) 13. Beverages and tobacco (b_t) Beverages and tobacco products (b_t) 14. Other food products Meat products nec (omt); sugar (sgr); processed rice (pcr); Food products nec (ofd) Industrial manufactures 15. Wearing apparel (wap) Wearing apparel (wap); Leather products (lea) Textiles (tex) 16. Chemical products Chemical, rubber, plastic products (crp) 17. Electronic equipment Electronic equipment (ele) 18. Machinery and equipment Machinery and equipment nec (ome) 19. Other industrial manufact Paper products, publishing (ppp); Mineral products nec (nmm);Metal products (fmp) Motor vehicles and parts (mvh); Transport Equipment nec (otn); Wood products (lum) Manufactures nec (omf) Services 20. Services Electricity (ely); Gas manufacture distribution (gdt); Construction (cns); Finacial services nec (ofi); Insurance (isr); Trade (trd); Transport nec (otp); Water transport (wtp); Air transport (atp); Communication (cmn); Business services nec (obs) Recreational and other services (osp); Public administ And defence, education, health (osg); Dwellings (dwe)

16
Table 4: Import Tariffs and Altertax GTAP database Altertax* Import tariffs (%) Import tariffa (%) Morocco USA Morocco USA 1 wheat (wht) 23.58 2.55 (75) 2.55 2 Other cereales (gro) 10.04 0.61 (35) 0.61 3 Vegetables, fruits (v_f) 31.73 4.69 31.73 4.69 4 Oil seeds (osd) 24.50 17.69 (2.5) (0) 5 Red meat (cmtr) 199.51 5.29 (275) 5.29 6 Other animal products (oapw) 22.35 0.59 (120) 0.59 7 Other agriculture (oagri) 18.75 11.72 (140) 11.72 8 Fishing (fsh) 0.00 0.00 0.00 0.00 9 Other minerals (omn) 0.95 0.04 0.95 0.04 10 Energy, metals (ene) 2.75 1.17 2.75 1.17 11 Vegetable oils and fats (vol) 101.46 4.27 (2.5) 4.27 12 dairy products (mil) 69.23 42.49 69.23 (0) 13 Beverages and tobacco (b_t) 29.12 3.04 29.12 3.04 14 Other food (ofood) 46.01 13.02 46.01 13.02 15 Wearing apparel (wap) 22.58 11.79 22.58 11.79 16 Chemical products (crp) 15.94 1.65 15.94 1.65 17 Electronic equipment (ele) 8.01 0.07 8.01 0.07 18 Machinery and equipment (ome) 12.69 3.29 12.69 3.29 19 Other industrial manufactures (oind) 10.55 2.60 10.55 2.60 20 Services (Svces) 0.00 0.00 0.00 0.00 *Modified tariffs in Altertax are between parentheses
17
Table 5: Aggregate effects of Trade Liberalization in Morocco (variation in percentage)
USA-Morocco FTA Multilateral Liberalization
Real GDP 0.23 4.21 Volume of aggregate imports 5.04 68.84 Volume of aggregate exports 6.64 47.12 Terms of trade -1.12 9.57 Nominal GDP -1.87 14.57 Households consumption -2.16 14.53 Investment -0.78 29.65 Government expenditures -1.53 18.01 Exports 5.45 61.09 Imports 5.04 68.81
Table 6: Welfare decomposition ($US million) Moroccan-American FTA Multilateral liberalization Region Welfare Allocative Terms of Invest. Welfare Allocative Terms of Invest. efficiency trade savings efficiency trade savings Morocco -36.41 80.35 -107.70 -9.05 2677.67 1497.40 1063.78 116.49USA 135.62 -64.96 187.52 13.06 -120.38 -34.43 -29.99 -55.96EU 27.55 30.95 -3.85 0.45 -363.82 -64.09 -277.77 -21.96ROW -119.07 -37.80 -76.74 -4.53 -101.97 737.86 -796.37 -43.46

18
Table 7: Effects on Moroccan imports(change in value ($US million) and percentage)
FTA Multilateral Liberalization From USA From EU From ROW Total From USA From EU From ROW Total
Item Variation % Variation % Variation % % Variation % Variation % Variation % %value value value value value value
1 wheat (wht) 249.21 465.93 -46.75 -50.76 -37.58 -50.84 75.22 127.96 239.94 222.18 240.99 179.21 242.48 241.502 Other cereales (gro) 53.63 126.24 -3.20 -39.13 -13.26 -39.17 44.07 65.18 153.76 12.57 153.84 52.28 154.57 154.143 Vegetables, fruits (v_f) 1.07 217.42 -0.88 -4.89 -0.91 -4.96 -1.98 0.77 158.31 28.61 158.20 29.38 159.10 158.654 Oil seeds (osd) 1.13 7.18 -0.21 -3.16 -1.89 -3.25 -1.19 6.11 39.53 2.58 39.48 23.27 39.93 39.815 Red meat (cmtr) 224.20 4399.50 -11.83 -92.36 -10.64 -92.36 685.51 76.86 1509.29 193.33 1508.60 174.18 1512.18 1510.116 Other animal products (oapw) 12.10 2900.54 -3.54 -26.87 -0.34 -26.92 55.58 3.44 825.32 108.32 824.60 10.41 827.07 824.867 Other agriculture (oagri) 37.94 4297.80 -2.60 -14.68 -12.95 -14.74 21.07 3.55 401.83 70.83 401.51 353.86 403.05 402.698 Fishing (fsh) 0.00 -0.86 -0.03 -0.85 -0.01 -0.85 -0.86 0.00 -33.72 9.75 235.43 -0.05 -27.85 224.469 Other minerals (omn) 0.00 5.50 0.02 0.09 0.12 0.08 0.04 0.01 20.13 12.53 50.58 23.07 14.53 19.4410 Energy, metals (ene) 1.33 16.07 -0.80 -0.26 -2.71 -0.27 -0.17 -0.01 -0.03 47.41 15.84 -88.58 -9.05 -3.2111 Vegetable oils and fats (vol) 3.49 5.97 -6.79 -4.51 -4.85 -4.58 -2.60 6.66 11.58 17.53 11.66 12.48 11.81 11.6812 dairy products (mil) 39.65 613.00 -10.51 -29.31 -8.14 -29.33 29.98 10.71 165.66 59.35 165.50 46.06 166.22 165.7613 Beverages and tobacco (b_t) 52.99 134.00 -10.13 -51.95 -1.62 -51.97 66.35 56.84 143.82 27.97 143.47 4.50 144.34 143.6814 Other food (ofood) 6.39 347.56 -3.22 -6.71 -12.81 -6.76 -4.03 2.61 142.12 37.10 77.35 347.80 183.39 161.7415 Wearing apparel (wap) 46.29 292.68 -16.73 -1.02 -1.42 -1.06 1.58 4.82 30.55 1687.02 103.76 48.71 36.53 97.9916 Chemical products (crp) 18.23 72.10 -13.68 -1.85 -4.39 -1.86 0.01 11.46 45.36 309.56 42.07 77.26 32.83 39.4917 Electronic equipment (ele) 10.50 48.82 -7.38 -3.29 -3.55 -3.30 -0.12 7.51 34.97 98.29 43.86 22.95 21.40 36.4618 Machinery and equipment (ome) 51.20 88.24 -40.39 -3.51 -8.43 -3.52 0.16 28.51 49.20 455.24 39.65 69.22 28.99 38.2619 Other industrial manufactures (oind) 119.89 93.41 -70.12 -5.83 -25.37 -5.84 1.38 32.32 25.22 1239.54 103.08 169.86 39.15 81.6720 Services (Svces) -6.33 -1.41 -4.33 -1.36 -4.91 -1.36 -1.38 149.40 33.16 105.45 33.16 119.09 33.22 33.14
Total 922.91 99.07 -253.10 -4.21 -155.65 -4.78 5.04 594.71 63.84 4745.17 79.00 1674.98 51.44 68.81

19
Table 8: Effects on Moroccan exports(change in value ($US million) and percentage)
FTA Multilateral Liberalization To USA To EU To ROW Total To USA To EU To ROW Total
Item Variation % Variation % Variation % % Variation % Variation % Variation % %value value value value value value
1 wheat (wht) 0.43 26.84 0.42 12.35 0.51 12.93 11.95 -0.52 -36.99 19.06 363.01 83.63 1452.49 900.852 Other cereales (gro) 0.11 14.15 0.18 10.61 0.21 10.88 8.78 -0.33 -45.03 3.51 124.62 2.53 73.56 101.223 Vegetables, fruits (v_f) 0.80 32.92 19.45 6.24 6.68 6.81 4.57 -0.67 -36.14 92.69 9.32 159.74 99.44 52.844 Oil seeds (osd) 0.01 8.83 0.02 8.53 0.02 8.79 6.69 -0.05 -47.64 -0.13 -47.03 0.57 137.84 51.175 Red meat (cmtr) 0.15 24.04 0.27 17.39 0.30 17.61 14.50 -0.26 -39.98 3.69 149.75 17.04 684.87 410.006 Other animal products (oapw) 0.19 15.11 1.88 11.41 0.55 11.69 9.08 -0.65 -51.91 -4.43 -32.54 347.37 5069.40 1216.237 Other agriculture (oagri) 5.60 89.28 2.70 7.26 1.26 7.69 12.73 2.48 29.16 -5.42 -16.81 18.17 73.89 21.598 Fishing (fsh) 0.01 1.64 0.91 1.39 0.06 1.53 1.09 -0.20 -53.23 7.83 -2.51 0.09 -10.32 10.939 Other minerals (omn) 1.05 1.74 3.86 1.61 3.77 1.61 1.29 -23.69 -38.66 -101.49 -40.33 -74.77 -32.57 -29.7610 Energy, metals (ene) 0.40 11.00 2.86 3.84 1.57 3.98 3.34 -1.38 -42.04 -30.77 -40.31 -11.23 -31.23 -29.8511 Vegetable oils and fats (vol) 2.78 37.71 5.61 14.44 0.34 14.49 13.82 -0.23 -8.59 15.36 22.16 1.19 30.19 26.4712 dairy products (mil) 0.07 12.30 0.12 12.10 1.97 10.74 8.01 -0.19 -30.64 13.94 1009.72 341.24 1314.81 1366.3813 Beverages and tobacco (b_t) 0.10 31.31 0.56 8.61 0.24 8.90 7.81 0.00 -3.48 2.92 33.10 2415.82 73777.59 21889.8414 Other food (ofood) 28.20 95.32 41.61 13.54 39.13 13.59 13.24 11.21 26.55 592.40 130.38 825.76 197.56 176.4215 Wearing apparel (wap) 89.00 127.63 144.88 6.85 10.28 7.07 8.87 35.22 40.65 1311.80 43.36 161.93 82.66 55.3716 Chemical products (crp) 0.83 9.27 8.27 2.38 12.28 2.39 1.73 -1.82 -26.15 12.12 -5.97 394.17 43.32 35.5417 Electronic equipment (ele) 3.01 4.55 11.97 4.13 1.01 4.15 3.43 -26.24 -38.67 -12.57 -11.69 -3.56 -19.28 -8.9918 Machinery and equipment (ome) 3.34 24.63 6.47 3.95 0.82 4.00 4.41 -3.40 -31.41 -42.77 -28.87 4.55 6.79 -17.1019 Other industrial manufactures (oind) 3.31 26.68 9.01 5.07 5.59 5.24 5.18 -4.19 -38.79 -55.65 -33.21 17.84 4.15 -11.5220 Services (Svces) 11.74 3.44 16.34 3.42 20.16 3.42 2.09 -150.40 -41.15 -210.73 -41.14 -255.32 -40.66 -26.63
Total 151.13 19.32 277.37 4.78 106.73 3.86 5.45 -165.31 -21.13 1611.35 27.74 4446.76 160.76 61.09

20
Table 9: Effects on production sectors (percentage change) Morocco-USA FTA Production Domestic Export Domestic sales volume share share Firms private Governt. share share share 1 wheat (wht) -8.16 -8.25 0.09 -3.69 -4.59 -0.022 Other cereales (gro) -3.53 -3.61 0.07 -1.37 -2.29 0.003 Vegetables, fruits (v_f) 1.84 0.57 1.28 0.51 0.18 0.004 Oil seeds (osd) 1.87 1.82 0.05 1.18 0.65 0.005 Red meat (cmtr) -22.02 -22.10 0.07 -5.75 -16.39 -0.046 Other animal products (oapw) 0.24 0.01 0.23 0.37 -0.36 0.007 Other agriculture (oagri) 1.55 1.19 0.35 1.47 -0.25 0.008 Fishing (fsh) 0.33 -0.01 0.34 0.09 -0.11 0.009 Other minerals (omn) 1.33 0.72 0.60 1.15 0.00 0.0010 Energy, metals (ene) 2.04 1.55 0.49 1.77 -0.01 -0.0111 Vegetable oils and fats (vol) 7.46 2.47 5.00 -0.34 3.79 0.0012 dairy products (mil) -3.44 -4.15 0.71 -0.61 -3.82 0.0013 Beverages and tobacco (b_t) -7.63 -7.81 0.18 -6.22 -1.65 -0.1014 Other food (ofood) 3.52 0.84 2.67 0.40 0.59 0.0015 Wearing apparel (wap) 4.77 1.62 3.15 2.41 0.06 -0.1116 Chemical products (crp) 1.11 0.43 0.68 0.68 -0.04 -0.0417 Electronic equipment (ele) 2.70 0.16 2.54 0.57 0.01 -0.1818 Machinery and equipment (ome) 1.13 0.33 0.80 0.53 0.00 -0.1319 Other industrial manufactures (oind) 0.33 0.11 0.22 0.22 -0.04 -0.07
21
Table 10: Effects on production sectors (percentage change) Multilateral Liberalization Production Domestic Export Domestic sales volume share share Firms private Governt. share share share 1 wheat (wht) -19.59 -24.39 4.82 -8.71 -15.76 -0.062 Other cereales (gro) -5.11 -5.60 0.49 0.80 -6.39 -0.023 Vegetables, fruits (v_f) 10.12 3.99 6.13 4.83 0.14 0.004 Oil seeds (osd) -3.78 -3.96 0.17 1.13 -5.07 -0.025 Red meat (cmtr) -44.48 -45.85 1.37 -10.49 -35.45 -0.086 Other animal products (oapw) 21.17 0.49 21.01 8.28 -7.76 0.007 Other agriculture (oagri) -3.27 -3.58 0.3 4.54 -18.18 0.048 Fishing (fsh) -0.45 0.35 -0.8 0.42 0.05 0.009 Other minerals (omn) -18.14 -4.48 -13.66 -7.12 0.00 0.0010 Energy, metals (ene) -29.65 -25.13 -4.51 -29.06 0.47 0.0011 Vegetable oils and fats (vol) -0.46 -5.72 5.27 -1.97 -6.03 0.0012 dairy products (mil) 53.23 -28.21 81.63 -2.81 -27.31 -0.0513 Beverages and tobacco (b_t) 422.39 0.82 423.41 2.16 -1.28 0.0114 Other food (ofood) 24.28 -0.77 25.05 2.01 -2.94 0.0115 Wearing apparel (wap) 0.02 -14.38 14.40 -19.38 -2.79 1.2016 Chemical products (crp) 0.12 -6.26 6.38 -8.26 -0.45 0.0417 Electronic equipment (ele) -15.95 -5.78 -10.16 -10.61 -2.05 -1.9718 Machinery and equipment (ome) -22.12 -18.21 -3.91 -18.41 -0.64 -2.4819 Other industrial manufactures (oind) -16.10 -15.37 -0.73 -14.79 -0.80 -0.36

22
Table 11: GTAP Imports, Exports and Production database ($US million)
Items Imports source Export destination Production USA UE ROW Total USA UE ROW Total 1 wheat (wht) 53.20 92.08 73.92 219.20 1.85 4.45 5.04 11.34 1787.752 Other cereales (gro) 42.36 8.17 33.84 84.37 0.91 2.20 2.53 5.64 827.013 Vegetables, fruits (v_f) 0.49 18.07 18.47 37.03 2.59 408.16 127.40 538.15 2048.364 Oil seeds (osd) 15.45 6.51 58.32 80.28 0.13 0.33 0.33 0.79 132.925 Red meat (cmtr) 5.09 12.81 11.52 29.42 0.80 2.03 2.17 5.00 1202.016 Other animal products (oapw) 0.42 13.14 1.26 14.82 1.50 21.04 5.97 28.51 1332.757 Other agriculture (oagri) 0.88 17.64 87.83 106.35 6.50 47.93 21.16 75.59 2647.238 Fishing (fsh) 0.00 4.14 0.18 4.32 0.44 80.3 4.82 85.56 294.829 Other minerals (omn) 0.02 24.71 158.38 183.11 71.93 294.8 287.68 654.41 1494.5810 Energy, metals (ene) 8.32 299.31 976.22 1283.85 3.89 91.29 48.08 143.26 1105.1711 Vegetable oils and fats (vol) 57.42 150.34 106.08 313.84 8.29 51.09 3.07 62.45 208.1212 dairy products (mil) 6.47 35.85 27.74 70.06 0.75 1.26 24.07 26.08 361.1813 Beverages and tobacco (b_t) 39.53 19.50 3.12 62.15 0.32 7.73 3.22 11.27 472.2814 Other food (ofood) 1.84 47.96 189.78 239.58 31.48 404.64 378.52 814.64 4567.8915 Wearing apparel (wap) 15.82 1626.87 133.58 1776.27 70.99 2503.29 171.58 2745.86 8134.7816 Chemical products (crp) 25.27 736.00 235.71 996.98 9.76 475.80 699.37 1184.93 3688.3817 Electronic equipment (ele) 21.51 224.10 107.47 353.08 79.45 354.71 30.03 464.19 739.9018 Machinery and equipment (ome) 58.02 1148.29 239.14 1445.45 14.06 200.06 25.04 239.16 1464.9019 Other industrial manufactures (oind) 128.33 1202.64 434.35 1765.32 12.82 207.07 124.46 344.35 8344.6320 Services (Svces) 451.19 318.07 359.13 1128.39 463.81 650.11 801.50 1915.42 33905.68Total 931.62 6006.19 3256.03 10193.84 782.26 5808.32 2766.05 9356.63 74760.34


![Impacts of a possible FTA with Mercosur on EU farm income and agricultural employment [EU]](https://img.pdfslide.net/doc/110x75/5562f3afd8b42a38778b5882/impacts-of-a-possible-fta-with-mercosur-on-eu-farm-income-and-agricultural-employment-eu.jpg)