Embed Size (px)
Citation preview

________________________________________________________________________________________________
The MPA guide to
postgraduate numbers
at Monash University, 2012
Published August 2013 ________________________________________________________________________________________________

____________________________________________________________________________________________
Monash Postgraduate Association guide to postgraduate numbers at Monash University 2012 2
The MPA guide to
postgraduate numbers
at Monash University.
The statistical data used to make the following conclusions are derived from the Monash University Planning and Statistics Unit full year student enrolment data, as at 18 June 2013, 7 June 2012, 18 July 2011, and can be found at http://opq.monash.edu.au/us/pivot-table/ Unless otherwise indicated, the figures refer to University-wide postgraduate numbers.

____________________________________________________________________________________________
Monash Postgraduate Association guide to postgraduate numbers at Monash University 2012 3
Contents page
KEY: ............................................................................................................................................... 5
EXECUTIVE SUMMARY ................................................................................................................ 6
Total number of students at Monash University by campus, 2012 ................................................... 6 Postgraduate numbers by faculty, 2012 .......................................................................................... 6 Postgraduate numbers by course type, 2012 .................................................................................. 6 Postgraduate numbers by commencing and returning, 2012 .......................................................... 7 Postgraduate numbers by international/domestic, 2012 .................................................................. 7 Postgraduate numbers by sex, 2012 ............................................................................................... 7 Postgraduate numbers by Aboriginal and Torres Strait Islander, 2012 ............................................7 Postgraduate numbers by funding source, 2012 ..............................................................................7 Postgraduate numbers by attendance type, 2012 ........................................................................... 8 Postgraduate numbers by attendance mode, 2012 ......................................................................... 8 Postgraduate numbers by student course attempt location, 2012 ................................................... 8 Postgraduate numbers by equity groups, 2012 ................................................................................8
CAMPUS ........................................................................................................................................ 9
Total number of students at Monash University by campus for 2012, 2011 and 2010 ..................... 9
FACULTY ..................................................................................................................................... 11
Postgraduate numbers by faculty by course type for 2012, 2011 and 2010 .................................. 11 Postgraduate numbers by faculty by campus, 2012 ...................................................................... 13 HDR Postgraduate numbers by faculty by campus, 2012 ............................................................. 13 GPG Postgraduate numbers by faculty by campus, 2012 ............................................................. 13
COURSE LEVEL .......................................................................................................................... 14
Course type by course level for 2012, 2011 and 2010 .................................................................. 14
COMMENCING AND RETURNING STUDENT STATUS .............................................................. 15
Commencing and returning postgraduates by course type 2012, 2011 and 2010 ......................... 15 Commencing and returning postgraduates by course type by campus, 2012 ................................ 15 Commencing and returning by course type and by faculty 2012 ................................................... 16
AGE .............................................................................................................................................. 18
Average age by course type by campus for 2012, 2011 and 2010 ................................................ 18
INTERNATIONAL POSTGRADUATES ......................................................................................... 20
International and domestic postgraduates by campus for 2012, 2011 and 2010 ........................... 20 International postgraduates by course type, commencing and returning, by campus, 2012 .......... 20

____________________________________________________________________________________________
Monash Postgraduate Association guide to postgraduate numbers at Monash University 2012 4
International postgraduates by course type by campus by year 2012, 2011 and 2010 .................. 21 International and domestic postgraduates by course type and faculty, 2012 ................................. 22 International postgraduates by faculty by course type for 2012, 2011 and 2010 ........................... 23 Country of residence of international postgraduates by course type, 2012 .................................... 25
SEX .............................................................................................................................................. 26
Sex of postgraduates by course type for 2012, 2011 and 2010 ..................................................... 26 Sex of postgraduates by campus, 2012 ........................................................................................ 26 Sex of postgraduates by course type and attendance type, 2012 ................................................. 27 Sex of postgraduates by course type and faculty, 2012 ................................................................ 27
AUSTRALIAN ABORIGINAL AND TORRES STRAIT ISLANDER (ATSI) POSTGRADUATE ENROLMENTS ............................................................................................................................. 28
ATSI postgraduates by campus, 2012, 2011 and 2010 ................................................................. 28 ATSI postgraduates by sex, 2012, 2011 and 2010 ........................................................................ 28 ATSI postgraduates by attendance type, 2012, 2011 and 2010 .................................................... 28 ATSI postgraduates by faculty and course type, 2012, 2011 and 2010 ......................................... 29 ATSI undergraduates by faculty, 2012, 2011 and 2010 ................................................................. 29
FUNDING SOURCE ..................................................................................................................... 30
Funding source by campus and by course type, 2012 .................................................................. 30
ATTENDANCE TYPE ................................................................................................................... 31
Attendance type by course type, 2012, 2011 and 2010 ................................................................. 31 Attendance type by campus 2012, 2011 and 2010........................................................................ 32
ATTENDANCE MODE .................................................................................................................. 33
Attendance mode by course type and by year 2012, 2011 and 2010 ............................................ 33 Attendance mode by campus and by year 2012, 2011 and 2010 .................................................. 34
STUDENT COURSE ATTEMPT LOCATION ................................................................................ 35
Student course attempt location, 2012 .......................................................................................... 35
EQUITY GROUPS ........................................................................................................................ 36
Equity group by faculty, 2012 ........................................................................................................ 36 Equity group by campus, 2012 ...................................................................................................... 36 Equity group by sex, 2012 ............................................................................................................. 37

____________________________________________________________________________________________
Monash Postgraduate Association guide to postgraduate numbers at Monash University 2012 5
Key:
HDR Higher degree by research refers to PhD including Professional Doctorates, and Masters by Research
GPG Graduate postgraduate refers to the following degrees; Masters by Coursework, Postgraduate qualifying/preliminary, Graduate Diploma (new/existing area) and Graduate Certificate.
Masters by Research Masters degree with a 66% or more research component.
Masters by Coursework Masters degree with a less than 66% research component.
Full-time Full-time enrolment
Part-time Part-time enrolment
Internal a course enrolment pattern in which all units of study are undertaken through attendance at the institution on a regular basis.
External a course enrolment pattern in which all units of study involve special arrangements whereby lesson materials, assignments, etc. are delivered to the student, and any associated attendance at the institution is of an incidental, irregular, special or voluntary nature.
Multi-Modal a course enrolment pattern in which at least one unit of study is undertaken by internal mode and at least one unit of study is undertaken by external mode of attendance.
RTS Research Training Scheme
CSP Commonwealth Supported Place
International Overseas/ International postgraduate
Domestic Domestic/ Local postgraduate
T&R Teaching and Research
Low SES Low socio-economic status as defined by ABS, Australian
Student course attempt location
Student course attempt location is the location, typically the campus, from where the student’s course is offered. It may be interpreted as the location where a student is enrolled in a course.
Note: non-award student numbers have been excluded

____________________________________________________________________________________________
Monash Postgraduate Association guide to postgraduate numbers at Monash University 2012 6
Executive summary
Student numbers
During 2012, there were 62,610 students enrolled at Monash University and of these 16,808 (27%) were postgraduates.
The Clayton campus had the highest number of postgraduate enrolments in 2012 with 7,909 postgraduates, compared to 5,816 postgraduates at Caulfield campus and 1,102 postgraduates at Gippsland campus. There were sixty four enrolled at Berwick campus and only thirty nine at South Africa campus
Total number of students at Monash University by campus, 2012
Clayton Caulfield Peninsula Gippsland Parkville Berwick Sunway South Africa
Total
Postgraduate 7909 5816 763 1102 656 64 459 39 16808
Undergraduate 20050 8257 3333 2753 1067 1954 5519 2869 45802
Total 27959 14073 4096 3855 1723 2018 5978 2908 62610
Source: Monash University Planning and Statistics, as at 18 June 2013.
Faculty
The Faculty of Business and Economics had the highest number of postgraduates in 2012 with 4,021 students, followed by the Faculty of Medicine, Nursing and Health Sciences with 3,523 postgraduates and then the Faculty of Education with an enrolment of 2,955 postgraduates.
Postgraduate numbers by faculty, 2012
Faculty Total
Art, Design and
Architecture
496
Arts 1644
Business and Economics 4021
Education 2955
Engineering 946
Information Technology 1024
Law 985
Medicine, Nursing and
Health Sciences
3523
Pharmacy and Pharmaceutical Sciences
656
Science 533
T&R 25
Total 16808 Source: Monash University Planning and Statistics, as at 18 June 2013.
Course type
HDRs comprised 27% of the postgraduate population and GPGs 73%.
Postgraduate numbers by course type, 2012
Higher degree by research Graduate/postgraduate Total
Postgraduate Numbers 4577 12231 16808 Source: Monash University Planning and Statistics, as at 18 June 2013.

____________________________________________________________________________________________
Monash Postgraduate Association guide to postgraduate numbers at Monash University 2012 7
Commencing and returning
Of the 4,577 HDRs, 24% were commencing in 2012 and of the 12,231 GPGs, 47% were commencing.
Postgraduate numbers by commencing and returning, 2012
Commencing Returning Total
Higher degree by research 1104 3473 4577
Graduate/postgraduate Total
5706 6810
6525 9998
12231 16808
Source: Monash University Planning and Statistics, as at 18 June 2013.
Age
While the average age of postgraduates in 2012 was 31 years, the largest proportion (47%) of HDR postgraduates were in the age range of 25 to 29 years. The largest proportion of GPGs (37%) were in the age range of 20 to 24 years.
International students
International postgraduates made up 32% of the HDR population and 34% of the GPG population. The largest number of international postgraduates were enrolled in the Faculty of Business and Economics where international postgraduates exceeded the number of domestic postgraduates.
Postgraduate numbers by international/domestic, 2012
International Domestic Total
Higher degree by research 1483 3094 4577 Graduate/postgraduate
Total
4111
5594
8120
11214
12231
16808 Source: Monash University Planning and Statistics, as at 18 June 2013.
Sex
There were substantially more female postgraduates than male postgraduates in both HDR and GPG during 2012. Female postgraduates comprised 60% of the total postgraduate population.
Postgraduate numbers by sex, 2012
Sex Female Male Total
Higher degree by research 2434 2143 4577 Graduate/postgraduate
Total
7633
10067
4598
6741
12231
16808 Source: Monash University Planning and Statistics, as at 18 June 2013.
Aboriginal and Torres Strait Islander
There were 51 Aboriginal and Torres Strait Islander (ATSI) postgraduates enrolled at Monash in 2012, 21 HDRs and 30 GPGs. While the Faculty of Education had 15 ATSI students, the highest number of any faculty, the Faculty of Engineering had no postgraduates identified as Aboriginal or Torres Strait Islander in 2012.
Funding source
While the majority of HDRs (64%) were supported by Research Training Scheme funds there were 32% international fee-paying HDRs. Of the 12,231 GPGs, 29% held Commonwealth Supported Places (CSP), 34% were international full-fee paying students and 37% were domestic full-fee paying students.

____________________________________________________________________________________________
Monash Postgraduate Association guide to postgraduate numbers at Monash University 2012 8
Attendance type
In 2012 more than twice as many HDRs were studying full-time as opposed to part-time; however, more GPGs were studying part-time rather than full-time.
Postgraduate numbers by attendance type, 2012
Attendance Type Full-time Part-time Total
Higher degree by research 3240 1337 4577
Graduate/postgraduate
Total
6001
9241
6230
7567
12231
16808 Source: Monash University Planning and Statistics, as at 18 June 2013.
Attendance mode
The majority (93%) of HDRs and 60% of GPGs were enrolled internally.
Postgraduate numbers by attendance mode, 2012
Attendance Mode Internal External Multi-modal Total
Higher degree by research 4253 278 46 4577 Graduate/postgraduate
Total
7301
11554
3773
4051
1157
1203
12231
16808 Source: Monash University Planning and Statistics, as at 18 June 2013.
Student course attempt location The Faculties of Law and Medicine, Nursing and Health Sciences had postgraduates based at locations other than the main Monash campuses. 89% of Law postgraduates were based in the city while 30% of postgraduates from the Medicine, Nursing and Health Sciences Faculty were based at various locations around Victoria, including hospitals and research centres.
Equity groups 2.5% of postgraduates identified themselves as having a disability and 7% resided in an area of low socio-economic status.

____________________________________________________________________________________________
Monash Postgraduate Association guide to postgraduate numbers at Monash University 2012 9
Campus
In 2012, 27% of students at Monash were postgraduate.
The percentage of students at each campus that were postgraduate in 2012 was:
28% of students at Clayton
41% of students at Caulfield
19% of students at Peninsula
29% of students at Gippsland
38% of students at Parkville
3% of students at Berwick
8% of students at Sunway
1% of students at South Africa
Total number of students at Monash University by campus for 2012, 2011 and 2010
Clayton Caulfield Peninsula Gippsland Parkville Berwick Sunway South
Africa
Total
2012
Postgraduate 7909 5816 763 1102 656 64 459 39 16808
Undergraduate 20050 8257 3333 2753 1067 1954 5519 2869 45802
Total 27959 14073 4096 3855 1723 2018 5978 2908 62610
2011
Postgraduate 8026 5869 852 1205 647 13 332 59 17003
Undergraduate 19767 8371 3412 2964 1027 2036 5326 2922 45825
Total 27793 14240 4264 4169 1674 2049 5658 2981 62828
2010
Postgraduate 7843 6103 868 1295 618 17 250 28 17022
Undergraduate 19549 8369 3445 2962 1056 1991 5097 2363 44832
Total 27392 14472 4313 4257 1674 2008 5347 2391 61854 Source: Monash University Planning and Statistics, as at 18 June 2013, 7 June 2012, 18 July 2011.

____________________________________________________________________________________________
Monash Postgraduate Association guide to postgraduate numbers at Monash University 2012 10
The highest number (7909) of postgraduates were enrolled at the Clayton campus while the largest proportion (41%) of postgraduates at a given campus were enrolled at Caulfield campus.
0
5000
10000
15000
20000
25000
Clayton Caulfield Peninsula Gippsland Parkville Berwick Sunway South Africa
Stu
den
t n
um
ber
s
Campus
Student numbers by campus, 2012
Postgraduate
Undergraduate
Since 2011, there has been a slight decrease in the overall postgraduate numbers. Only Parkville, Berwick and Sunway recorded an increase in postgraduate numbers from 2011 to 2012.
0
1000
2000
3000
4000
5000
6000
7000
8000
9000
Clayton Caulfield Peninsula Gippsland Parkville Berwick Sunway South Africa
Po
stgr
adu
ate
nu
mb
ers
Campus
Postgraduate numbers by campus, 2010-2012
2010
2011
2012
____________________________________________________________________________________________
Monash Postgraduate Association guide to postgraduate numbers at Monash University 2012 11
Faculty In 2012:
24% of total postgraduates were enrolled through the Faculty of Business and Economics
21% of total postgraduates were enrolled through the Faculty of Medicine, Nursing and Health Sciences
18% of total postgraduates were enrolled through the Faculty of Education
Postgraduate numbers by faculty by course type for 2012, 2011 and 2010
Faculty Higher degree research
Graduate postgraduate
Total
Art, Design and Architecture 2012 276 220 496 2011 310 187 497 2010 299 169 468 Arts 2012 719 925 1644 2011 662 1008 1670 2010 616 1062 1678 Business and Economics 2012 341 3680 4021 2011 381 3702 4083 2010 394 3933 4327 Education 2012 493 2462 2955 2011 487 2445 2932 2010 495 2547 3042 Engineering 2012 615 331 946 2011 572 360 932 2010 511 351 862 Information Technology 2012 188 836 1024 2011 201 864 1065 2010 193 892 1085 Law 2012 110 875 985 2011 105 818 923 2010 96 716 812 Medicine, Nursing and 2012 1167 2356 3523 Health Sciences 2011 1111 2599 3710 2010 1049 2586 3635 Pharmacy and 2012 135 521 656 Pharmaceutical Sciences 2011 141 506 647 2010 129 489 618 Science 2012 508 25 533 2011 471 51 522 2010 408 66 474 T&R 2012 25 0 25 2011 22 0 22 2010 21 0 21 Source: Monash University Planning and Statistics, as at 18 June 2013, 7 June 2012, 18 July 2011.

____________________________________________________________________________________________
Monash Postgraduate Association guide to postgraduate numbers at Monash University 2012 12
HDR numbers increased slightly from 2011 to 2012 in the Faculty of Arts, Education, Engineering, Law, Medicine, Nursing and Health Sciences and Science. The rest of the faculties recorded a decrease in HDR numbers in the same period.
0
200
400
600
800
1000
1200
HD
R n
um
be
rs
Faculty
HDR numbers by faculty, 2010-2012
2010
2011
2012
In the last three years, GPG numbers increased in the Faculties of Art, Design and Architecture, Law, and Pharmacy and Pharmaceutical Sciences and decreased in Arts, Business and Economics, Education, Information Technology and Science.
0
500
1000
1500
2000
2500
3000
3500
4000
GP
G n
um
ber
s
Faculty
GPG numbers by faculty, 2010-2012
2010
2011
2012
Business and Economics postgraduates formed 60% of the postgraduate population at Caulfield, 32% at Sunway and 78% at Berwick. The Faculty of Medicine, Nursing and Health Sciences had the majority of their postgraduates located at Clayton campus (67%) with smaller numbers at Caulfield (15%), Peninsula (12%) and Gippsland (5%).

____________________________________________________________________________________________
Monash Postgraduate Association guide to postgraduate numbers at Monash University 2012 13
Postgraduate numbers by faculty by campus, 2012
Clayton Caulfield Peninsula Gippsland Parkville Berwick Sunway South Africa
Total
Art, Des and
Architecture
448 48 496
Arts 1032 487 70 35 20 1644
Business and Economics
206 3508 2 125 12 149 19 4021
Education 2097 341 419 50 48 2955
Engineering 709 156 81 946
Information
Technology 60 853 80 31 1024
Law 985 985
Medicine 2346 520 420 165 2 70 3523
Pharmacy 656 656
Science 451 0 39 43 533
T&R 23 2 25
Total 7909 581 763 1102 656 64 459 39 16808 Source: Monash University Planning and Statistics, as at 18 June 2013.
HDR Postgraduate numbers by faculty by campus, 2012
Clayton Caulfield Peninsula Gippsland Parkville Berwick Sunway South
Africa
Total
Art, Des and Architecture
265 11 276
Arts 528 117 36 18 20 719
Business and
Economics 113 167 2 10 12 37
341
Education 361 83 42 7 493
Engineering 534 81 615
Information Technology
58 76 31 23 188
Law 110 110
Medicine 970 65 57 11 64 1167
Pharmacy 135 135
Science 430 35 43 508
T&R 23 2 25
Total 3127 690 142 176 135 19 268 20 4577
Source: Monash University Planning and Statistics, as at 18 June 2013.
GPG Postgraduate numbers by faculty by campus, 2012
Clayton Caulfield Peninsula Gippsland Parkville Berwick Sunway South Africa
Total
Art, Des and
Architecture
183
37 220
Arts 504 370 34 17 925
Business and
Economics 93 3341
115 112 19 3680
Education 1736 258 377 43 48 2462
Engineering 175 156 331
Information
Technology 2 777
49 8 836
Law 875 875
Medicine 1376 455 363 154 2 6 2356
Pharmacy 521 521
Science 21 4 25
T&R
Total 4782 5126 621 926 521 45 191 19 12231
Source: Monash University Planning and Statistics, as at 18 June 2013.

____________________________________________________________________________________________
Monash Postgraduate Association guide to postgraduate numbers at Monash University 2012 14
Course level
In 2012:
84% of HDRs were enrolled in PhDs
16% of HDRs were enrolled in Masters by research
79% of GPGs were enrolled in the Masters by coursework
12% of GPGs were enrolled in the Graduate diploma new area
Course type by course level for 2012, 2011 and 2010
Course level 2012 2011 2010
PhD 3848 3645 3295
Masters by research 729 818 916 HDR total 4577 4463 4211
Master by coursework 9641 9603 9593 Postgrad. Qual/Preliminary 24 38 38
Graduate diploma (new area) 1428 1615 1711 Graduate diploma (existing area) 334 452 557
Graduate certificate 804 832 912
GPG total 12231 12540 12811
Total 16808 17003 17022 Source: Monash University Planning and Statistics, as at 18 June 2013, 7 June 2012, 18 July 2011.
In 2012, the majority (84%) of HDRs were enrolled in a PhD program and the majority (79%) of GPGs were enrolled in a Masters by coursework degree.
0
1000
2000
3000
4000
5000
6000
7000
8000
9000
10000
Doctorate by research
Master's by research
Master's by coursework
Postgrad. Qual/Prelim.
Grad.(Post) Dip. - new
area
Grad.(Post) Dip. - ext
area
Graduate Certificate
Po
stgr
adu
ate
nu
mb
ers
Course level
Postgraduates by course level, 2010-2012
2010
2011
2012

____________________________________________________________________________________________
Monash Postgraduate Association guide to postgraduate numbers at Monash University 2012 15
Commencing and returning student status
In 2012:
41% of postgraduates were commencing
24% of HDR were commencing
47% of GPG were commencing
Commencing and returning postgraduates by course type 2012, 2011 and 2010
Source: Monash University Planning and Statistics, as at 18 June 2013, 7 June 2012, 18 July 2011.
In 2012:
74% of commencing postgraduates at Clayton were GPG
95% of commencing postgraduates at Caulfield were GPG
91% of commencing postgraduates at Peninsula were GPG
88% of commencing postgraduates at Gippsland were GPG
90% of commencing postgraduates at Parkville were GPG
Commencing and returning postgraduates by course type by campus, 2012
Clayton Caulfield Peninsula Gippsland Parkville Berwick Sunway
South Africa
Total
HDR
Com. 765 103 34 54 29 7 102 10 1104
HDR Ret.
2362 587 108 122 106 12 166 10 3473
GPG Com.
2191 2331 348 400 271 45 120 5706
GPG
Ret. 2591 2795 273 526 250 71 19 6525
Total 7909 5816 763 1102 656 64 459 39 16808 Source: Monash University Planning and Statistics, as at 18 June 2013.
Commencing Returning Total
2012 Higher degree by research 1104 3473 4577
Graduate/postgraduate 5706 6525 12231 Total 6810 9998 16808
2011 Higher degree by research 1053 3410 4463
Graduate/postgraduate 6010 6530 12540
Total 7063 9940 17003
2010
Higher degree by research 1145 3066 4211 Graduate/postgraduate 6124 6687 12811
Total 7269 9753 17022

____________________________________________________________________________________________
Monash Postgraduate Association guide to postgraduate numbers at Monash University 2012 16
In 2012 there were more returning HDR postgraduates than commencing in each faculty. Returning GPGs were greater than commencing GPGs in all Faculties except Education and Pharmacy and Pharmaceutical Sciences.
Commencing and returning by course type and by faculty 2012
Higher degree
research by
commencing
Higher degree
by research
returning
Graduate/
postgraduate
commencing
Graduate/
postgraduate
returning
Art, Design and Architecture
33 243 103 117
Arts 191 528 454 471
Business and Economics 48 293 1620 2060
Education 138 355 1479 983
Engineering 186 429 134 197
Information Technology 37 151 381 455
Law 23 87 267 608
Medicine, Nursing and
Health Sciences 295 872 995 1361
Pharmacy and
Pharmaceutical Sciences 29 106 271 250
Science 116 392 2 23
T&R 8 17
Source: Monash University Planning and Statistics, as at 18 June 2013.
The Faculty of Education had the largest growth (37%) of commencing HDRs in 2012, followed by Medicine, Nursing and Health Sciences (21%) and Engineering (11%). The top three faculties that recorded the largest negative growth are Art, Design and Architecture (-43%), Business and Economics (-29%) and Information Technology (-27%).
050
100150200250300
HD
R n
um
be
rs
Faculty
Commencing HDRS by faculty, 2010-2012
2010
2011
2012

____________________________________________________________________________________________
Monash Postgraduate Association guide to postgraduate numbers at Monash University 2012 17
The Faculty of Art, Design and Architecture recorded the largest growth (12%) of commencing GPGs in 2012 which was followed by Education (7%). The rest of the faculties recorded negative growth of commencing GPGs in 2012 of which the Faculty of Science had the largest reduction of GPGs of -89%.
0200400600800
10001200140016001800
GP
G N
um
ber
s
Faculty
Commencing GPG by faculty, 2010-2012
2010
2011
2012

____________________________________________________________________________________________
Monash Postgraduate Association guide to postgraduate numbers at Monash University 2012 18
Age of postgraduates
In 2012:
The average age of postgraduates at Monash was 31
The average age of HDRs at Monash was 34
The average age of GPGs at Monash was 30
The highest average age of a postgraduate group was at the Peninsula campus, with an HDR average age of 40.
The lowest average age of a postgraduate group was at the Sunway campus, with a GPG average age of 25 and at South Africa campus, the HDR average age was also 25.
Average age by course type by campus for 2012, 2011 and 2010
Clayton Caulfield Peninsula Gippsland Parkville Berwick Sunway South
Africa
Overall
average age
2012
HDR 33 39 40 36 27 37 30 27 34 GPG 34 27 33 34 28 27 29 37 30
Overall average
33 28 34 35 28 30 30 32 32
2011
HDR 33 38 40 37 27 33 30 25 34
GPG 34 27 33 35 28 - 25 38 31
Overall average
33 29 35 35 28 33 28 35 32
2010 HDR 33 39 40 38 28 35 31 25 34
GPG 34 28 34 35 28 - 26 35 31 Overall average
33 29 35 35 28 35 29 33 32
Source: Monash University Planning and Statistics, as at 18 June 2013, 7 June 2012, 18 July 2011.

____________________________________________________________________________________________
Monash Postgraduate Association guide to postgraduate numbers at Monash University 2012 19
While the average age of postgraduates was 31 years in 2012, approximately 47% of HDRs were in the age range of 25 to 29 years with numbers decreasing as age increased. The oldest HDR in 2012 was 85 years of age.
Approximately 37% of GPGs were in the age range of 20 to 24 years followed by 24% in the 25 to 29 year old range. Ages of GPGs ranged from 19 to 82 years old.

____________________________________________________________________________________________
Monash Postgraduate Association guide to postgraduate numbers at Monash University 2012 20
International postgraduates
In 2012:
33% of postgraduates were international students
22% of postgraduates on Clayton campus were international students
53% of postgraduates on Caulfield campus were international students
20% of postgraduates on Peninsula campus were international students
11% of postgraduates on Gippsland campus were international students
International and domestic postgraduates by campus for 2012, 2011 and 2010
Clayton Caulfield Peninsula Gippsland Parkville Berwick Sunway South
Africa Total
2012
Domestic 6198 2762 607 981 609 56 1 11214
International 1711 3054 156 121 47 8 458 39 5594
Total 7909 5816 763 1102 656 64 459 39 16808
2011
Domestic 6283 2936 690 1037 597 9 1 11553
International 1743 2933 162 168 50 4 331 59 5450
Total 8026 5869 852 1205 647 13 332 59 17003
2010
Domestic 6080 3139 684 1091 575 12 1 0 11582
International 1763 2964 184 204 43 5 249 28 5440
Total 7843 6103 868 1295 618 17 250 28 17022
Source: Monash University Planning and Statistics, as at 18 June 2013, 7 June 2012, 18 July 2011.
The majority (73%) of the international postgraduate population in 2012 were GPGs. Caulfield campus had the highest number of international postgraduate students than any other campus.
International postgraduates by course type, commencing and returning, by campus, 2012
Clayton Caulfield Peninsula Gippsland Parkville Berwick Sunway
South
Africa Total
HDR Com 240 26 9 16 12 101 10 414 HDR Ret 670 127 20 42 30 4 166 10 1069 HDR Total 910 153 29 58 42 4 267 20 1483
GPG Com 416 1467 64 7 2 4 120 2080
GPG Ret 385 1434 63 56 3 71 19 2031 GPG Total 801 2901 127 63 5 4 191 19 4111
Total 1711 3054 156 121 47 8 458 39 5594 Source: Monash University Planning and Statistics, as at 18 June 2013

____________________________________________________________________________________________
Monash Postgraduate Association guide to postgraduate numbers at Monash University 2012 21
Between 2010 and 2012 numbers of international postgraduates decreased at Clayton, Peninsula and Gippsland campuses. The number of international postgraduates at all other campuses increased during this time.
International postgraduates by course type by campus by year 2012, 2011 and 2010
Source: Monash University Planning and Statistics, as at 18 June 2013, 7 June 2012, 18 July 2011.
In 2012, the proportion of international postgraduates in each faculty was:
25% in Art, Design and Architecture
29% in Arts
59% in Business and Economics
28% in Education
40% in Engineering
69% in Information Technology
5% in Law
12% in Medicine, Nursing and Health Sciences
7% in Pharmacy and Pharmaceutical Sciences
42% in Science
24% in T&R
Clayton Caulfield Peninsula Gippsland Parkville Berwick Sunway South
Africa Total
2012
HDR 910 153 29 58 42 4 267 20 1483 GPG 801 2901 127 63 5 4 191 19 4111 Total 1711 3054 156 121 47 8 458 39 5594
2011
HDR 868 170 24 60 39 4 205 10 1380 GPG 875 2763 138 108 11 126 49 4070
Total 1743 2933 162 168 50 4 331 59 5450
2010 HDR 813 161 21 57 37 5 146 6 1246
GPG 950 2803 163 147 6 103 22 4194 Total 1763 2964 184 204 43 5 249 28 5440
____________________________________________________________________________________________
Monash Postgraduate Association guide to postgraduate numbers at Monash University 2012 22
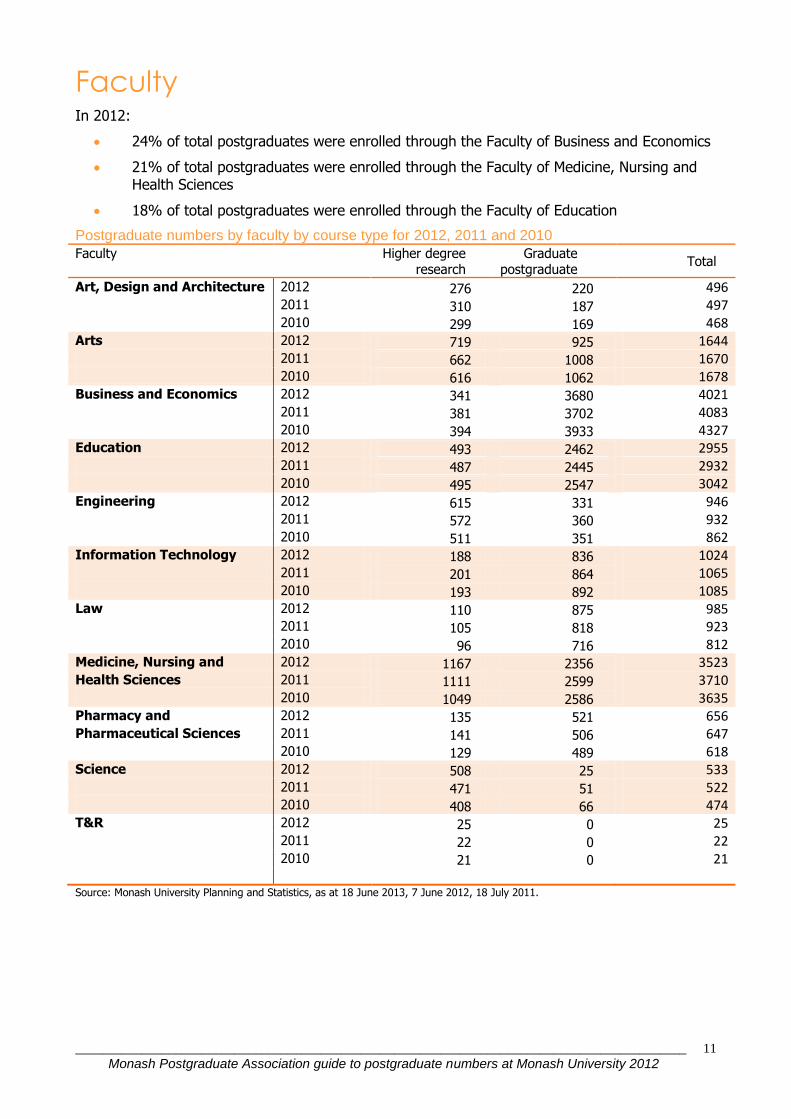
During 2012, the largest number of postgraduates were enrolled in the Faculty of Business and Economics (4,021) and more than half of these (59%) were international students, most of whom were GPGs (93%).
In the Faculty of Information Technology, in 2012, there were twice as many international postgraduates (702) as there were domestic postgraduates (322), and the majority of these international students were GPGs (84%). Similarly, there were more international (114) than domestic (74) HDRs.
The two faculties with the lowest proportion of international HDR postgraduates were Law (14%) and Art, Design and Architecture (6%).
International and domestic postgraduates by course type and faculty, 2012
Higher degree
research
Graduate/
postgraduate Total
Art, Design and Architecture
Domestic 260 114 374
International 16 106 122
Arts Domestic 562 601 1163
International 157 324 481
Business and Economics Domestic 167 1502 1669
International 174 2178 2352
Education Domestic 372 1762 2134
International 121 700 821
Engineering Domestic 264 308 572
International 351 23 374
Information Technology Domestic 74 248 322
International 114 588 702
Law Domestic 95 842 937
International 15 33 48
Medicine, Nursing and
Health Sciences
Domestic 904 2202 3106
International 263 154 417
Pharmacy and Pharmaceutical Sciences
Domestic 93 516 609
International 42 5 47 Science Domestic 284 25 309
International 224 224
T&R Domestic 19 19
International 6 6
Total 4577 12231 16808
Source: Monash University Planning and Statistics, as at 18 June 2013

____________________________________________________________________________________________
Monash Postgraduate Association guide to postgraduate numbers at Monash University 2012 23
International postgraduates by faculty by course type for 2012, 2011 and 2010
Faculty Higher degree research
Graduate postgraduate
Art, Design and Architecture 2010 15 108
2011 18 101 2012 16 106
Arts 2010 135 288 2011 147 319
2012 157 324
Business and Economics 2010 185 2079 2011 190 2041
2012 174 2178 Education 2010 119 726
2011 123 708
2012 121 700 Engineering 2010 255 50
2011 291 35 2012 351 23
Information Technology 2010 110 609 2011 117 600
2012 114 588
Law 2010 14 48 2011 17 40
2012 15 33 Medicine, Nursing and 2010 203 276
Health Sciences 2011 232 214
2012 263 154 Pharmacy and 2010 37 6
Pharmaceutical Sciences 2011 39 11 2012 42 5
Science 2010 169 4 2011 201 1
2012 224
T&R 2010 4 2011 5
2012 6 Source: Monash University Planning and Statistics, as at 18 June 2013, 7 June 2012, 18 July 2011.

____________________________________________________________________________________________
Monash Postgraduate Association guide to postgraduate numbers at Monash University 2012 24
The number of international HDRs increased in every faculty between 2010 and 2012 except for Art, Design & Architecture, Business & Economics, Education, Information Technology and Law. The faculty of Engineering recorded the largest growth (21%) in international HDR numbers from 2011 to 2012.
0
50
100
150
200
250
300
350
400
Inte
rnat
ion
al H
DR
nu
mb
ers
Faculty
International HDRs by faculty, 2010-2012
2010
2011
2012
Between 2010 and 2012, the number of international GPGs increased in the Faculty of Arts but decreased overall in Education, Engineering, Information Technolgy, Law and Medicine, Nursing and Health Sciences.
0
500
1000
1500
2000
2500
Inte
rnat
ion
al G
PG
nu
mb
ers
Faculty
International GPGs by faculty, 2010-2012
2010
2011
2012

____________________________________________________________________________________________
Monash Postgraduate Association guide to postgraduate numbers at Monash University 2012 25
In 2012:
41% of international postgraduates were from China (2270).
Malaysia had the highest number of international HDRs (309), followed by India (167) and China (156).
China had the highest number of international GPGs (2114), followed by Singapore (279) and Malaysia (226).
Country of residence of international postgraduates (total count above 50) by course type, 2012
Higher degree research
Graduate/ postgraduate Total
Bangladesh 87 28 115
Canada 21 35 56
China (excl SARs and Taiwan) 156 2114 2270
Hong Kong (SAR of China) 7 201 208
India 167 145 312
Indonesia 78 205 283
Iran 58 28 86
Malaysia 309 226 535
Saudi Arabia 55 74 129
Singapore 45 279 324
Sri Lanka 53 26 79
Thailand 20 60 80
United States of America 25 41 66
Viet Nam 48 134 182
Source: Monash University Planning and Statistics, as at 18 June 2013

____________________________________________________________________________________________
Monash Postgraduate Association guide to postgraduate numbers at Monash University 2012 26
Sex
In 2012:
60% of postgraduates were female
53% of HDRs were female
62% of GPGs were female
Sex of postgraduates by course type for 2012, 2011 and 2010
Female Male Total
2012
Higher degree by research 2434 2143 4577
Graduate/postgraduate coursework 7633 4598 12231 Total 10067 6741 16808
2011
Higher degree by research 2414 2049 4463
Graduate/postgraduate coursework 7800 4740 12540
Total 10214 6789 17003
2010
Higher degree by research 2280 1931 4211
Graduate/postgraduate coursework 7901 4910 12811
Total 10181 6841 17022
Source: Monash University Planning and Statistics, as at 18 June 2013, 7 June 2012, 18 July 2011.
In 2012 there were more female postgraduates than males at every campus. At Peninsula and Parkville campuses there were more than double the numbers of female postgraduates to male postgraduates.
Sex of postgraduates by campus, 2012
Clayton Caulfield Peninsula Gippsland Parkville Berwick Sunway
South Africa
Total
Female 4844 3182 603 656 477 41 244 20 10067
Male 3065 2634 160 446 179 23 215 19 6741
Total 7909 5816 763 1102 656 64 459 39 16808
Source: Monash University Planning and Statistics, as at 18 June 2013

____________________________________________________________________________________________
Monash Postgraduate Association guide to postgraduate numbers at Monash University 2012 27
In 2012:
75% of male HDRs and 67% of female HDRs were enrolled full-time.
52% of male GPGs and 48%% of female GPGs were enrolled full-time.
64% of the part-time postgraduate population at Monash was female.
Sex of postgraduates by course type and attendance type, 2012
Female Male Total
Higher degree by research Full-time 1629 1611 3240
Part-time 805 532 1337 Graduate/postgraduate Full-time 3632 2369 6001
Part-time 4001 2229 6230 Total 10067 6741 16808 Source: Monash University Planning and Statistics, as at 18 June 2013
There were more female HDRs than male in all faculties except Engineering, Information Technology and Science.
Of the 3,523 postgraduates in the Faculty of Medicine, Nursing and Health Sciences in 2012, 52% were female GPGs. Similarly, of the 2955 postgraduates enrolled in the Faculty of Education, 61% were female GPGs.
Sex of postgraduates by course type and faculty, 2012
Female Male Total
Art, Design and Architecture
HDR 158 118 276
GPG 140 80 220
Arts HDR 367 352 719
GPG 616 309 925
Business and
Economics
HDR 178 163 341
GPG 1995 1685 3680
Education HDR 345 148 493
GPG 1796 666 2462
Engineering HDR 173 442 615
GPG 45 286 331
Information Technology HDR 56 132 188
GPG 260 576 836
Law HDR 57 53 110
GPG 537 338 875
Medicine, Nursing and Health Sciences
HDR 784 383 1167
GPG 1825 531 2356 Pharmacy and
Pharmaceutical Sciences
HDR 70 65 135
GPG 407 114 521
Science HDR 227 281 508
GPG 12 13 25
T&R HDR 19 6 25
Total 10067 6741 16808
Source: Monash University Planning and Statistics, as at 18 June 2013

____________________________________________________________________________________________
Monash Postgraduate Association guide to postgraduate numbers at Monash University 2012 28
Australian Aboriginal and Torres Strait Islander
(ATSI) postgraduate enrolments
The overall number of Aboriginal and Torres Strait Islander postgraduates increased between 2010 and 2012.
ATSI postgraduates by campus, 2012, 2011 and 2010
Campus Clayton Caulfield Peninsula Gippsland Parkville Berwick Sunway South
Africa Total
2012 HDR 6 7 2 5 1 0 0 0 21
GPG 16 6 1 6 0 1 0 0 30
Total 22 13 3 11 1 1 0 0 51
2011
HDR 8 7 2 0 1 0 0 0 18
GPG 16 6 2 7 0 0 0 0 31
Total 24 13 4 7 1 0 0 0 49
2010
HDR 8 7 2 2 0 0 0 0 19
GPG 12 5 0 3 0 0 0 0 20
Total 20 12 2 5 0 0 0 0 39
Source: Monash University Planning and Statistics, as at 18 June 2013, 7 June 2012, 18 July 2011.
More than half of the ATSI postgraduates in 2010, 2011 and 2012 were female.
ATSI postgraduates by sex, 2012, 2011 and 2010
Sex Female Male Total
2012 33 18 51
2011 31 18 49
2010 24 15 39
Source: Monash University Planning and Statistics, as at 18 June 2013, 7 June 2012, 18 July 2011.
More than half of the ATSI postgraduates in 2010, 2011 and 2012 were part-time students.
ATSI postgraduates by attendance type, 2012, 2011 and 2010
Full-time Part-time Total
2012 20 31 51
2011 19 30 49
2010 12 27 39
Source: Monash University Planning and Statistics, as at 18 June 2013, 7 June 2012, 18 July 2011.

____________________________________________________________________________________________
Monash Postgraduate Association guide to postgraduate numbers at Monash University 2012 29
In 2012, 29% Indigenous postgraduates were enrolled in the Faculty of Education and 21% were enrolled in the Faculty of Medicine, Nursing and Health Sciences. Between 2010 and 2012, there were no Indigenous students enrolled in HDR or GPG degrees in the Faculty of Engineering.
ATSI postgraduates by faculty and course type, 2012, 2011 and 2010
Faculty 2012 2011 2010
Art, Design and Architecture HDR 7 5 5
GPG 0 1 1
Arts HDR 5 2 3
GPG 4 1 2
Business and Economics HDR 0 0 0
GPG 1 0 1
Education HDR 4 6 6
GPG 11 9 5
Engineering HDR 0 0 0
GPG 0 0 0
Information Technology HDR 0 0 0
GPG 1 2 1
Law HDR 1 1 1
GPG 4 5 3
Medicine, Nursing and Health Sciences HDR 2 1 2
GPG 9 13 7
Pharmacy and Pharmaceutical Sciences HDR 1 1 0
GPG 0 0 0
Science HDR 2 2 2
GPG 0 0 0
Total 52 49 39 Source: Monash University Planning and Statistics, as at 18 June 2013, 7 June 2012, 18 July 2011.
Between 2010 and 2012 the number of undergraduate ATSI students was highest in the Faculties of Arts, and Medicine, Nursing and Health Sciences.
ATSI undergraduates by faculty, 2012, 2011 and 2010
Faculty 2012 2011 2010
Art, Design and Architecture 4 4 3 Arts 43 36 33
Business and Economics 7 3 4
Education 11 8 10
Engineering 1 1 1
Information Technology 5 4 3
Law 8 6 5 Medicine, Nursing and Health Sciences 24 19 21 Pharmacy and Pharmaceutical Sciences 0 0 1 Science 9 11 10 Total 112 92 91
Source: Monash University Planning and Statistics, as at 18 June 2013, 7 June 2012, 18 July 2011.

____________________________________________________________________________________________
Monash Postgraduate Association guide to postgraduate numbers at Monash University 2012 30
Funding source
Of the 4577 HDRs in 2012, 68% were supported by the Research Training Scheme or were domestic and fee-exempt.
34% of GPGs were international fee-paying in 2011. While there were 8,116 domestic GPGs, 44% held Commonwealth Supported Places, 33% were fee-paying students assisted with FEE-HELP, and 23% were fee-paying without FEE-HELP.
Funding source by campus and by course type, 2012
Payment method
Clayton Caulfield Peninsula Gippsland Parkville Berwick Sunway South Africa
Total
Higher degree by research
Research Training
Scheme
2107 496 108 110 91 15 2927
International fee-paying
914 153 29 58 42 4 267 20 1487
Domestic
fee-exempt
106 41 5 8 2 162
Domestic fee-paying,
no FEE-HELP
1 1
HDR Total 3127 690 142 176 135 19 268 20 4577
Graduate postgraduate
CSP 1801 380 339 720 315 38 3593 International fee-paying 802 2904 127 63 5 4 191 19 4115 Domestic
fee-paying
with FEE-HELP 1244 1192 60 96 103 2 2697
Domestic fee-paying,
no FEE-HELP 935 650 95 47 98 1 1826 GPG Total 4782 5126 621 926 521 45 191 19 12231
Total 7909 5816 763 1102 656 64 459 39 16808 Source: Monash University Planning and Statistics, as at 18 June 2013.
____________________________________________________________________________________________
Monash Postgraduate Association guide to postgraduate numbers at Monash University 2012 31
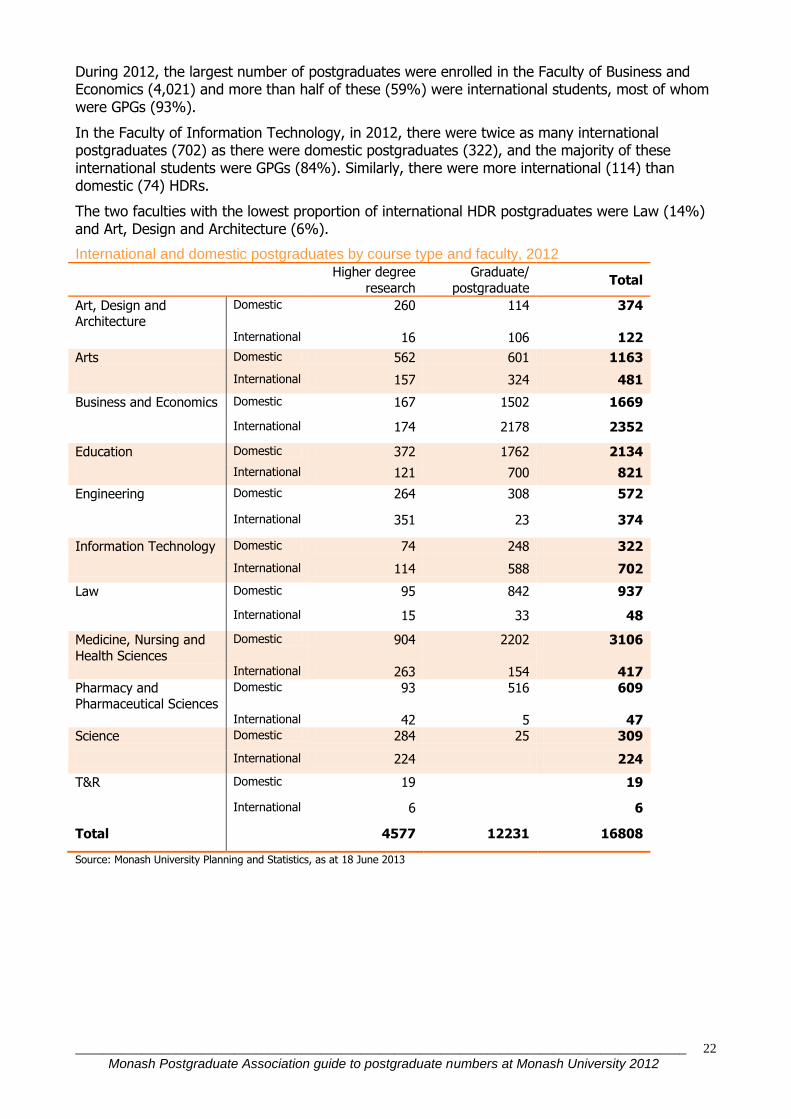
Attendance type
In 2012:
55% of postgraduates were enrolled full-time
71% of HDRs were enrolled full-time
49% of GPGs were enrolled full-time
Attendance type by course type, 2012, 2011 and 2010
Full-time Part-time Total
2012
Higher degree by research 3240 1337 4577
Graduate/postgraduate 6001 6230 12231
Total 9241 7567 16808
2011
Higher degree by research 3117 1346 4463
Graduate/postgraduate 5787 6753 12540
Total 8904 8099 17003
2010
Higher degree by research 2870 1341 4211
Graduate/postgraduate 5774 7037 12811
Total 8644 8378 17022
Source: Monash University Planning and Statistics, as at 18 June 2013, 7 June 2012, 18 July 2011.

____________________________________________________________________________________________
Monash Postgraduate Association guide to postgraduate numbers at Monash University 2012 32
In 2012:
55% of postgraduates at Clayton were enrolled full-time
65% of postgraduates at Caulfield were enrolled full-time
Numbers of part-time postgraduates were substantially higher than full-time postgraduates at:
Peninsula with 56% of the postgraduate population studying part-time
Gippsland with 77% of the postgraduate population studying part-time
Parkville with 80% of the postgraduate population studying part-time
Attendance type by campus 2012, 2011 and 2010
Clayton Caulfield Peninsula Gippsland Parkville Berwick Sunway
South Africa
Total
2012
Full-time 4325 3770 337 251 129 54 356 19 9241 Part-time 3584 2046 426 851 527 10 103 20 7567 Total 7909 5816 763 1102 656 64 459 39 16808
2011
Full-time 4178 3696 353 243 132 11 264 27 8904
Part-time 3848 2173 499 962 515 2 68 32 8099
Total 8026 5869 852 1205 647 13 332 59 17003
2010
Full-time 3925 3777 348 269 117 13 189 6 8644
Part-time 3918 2326 520 1026 501 4 61 22 8378
Total 7843 6103 868 1295 618 19 183 28 17022
Source: Monash University Planning and Statistics, as at 18 June 2013, 7 June 2012, 18 July 2011.

____________________________________________________________________________________________
Monash Postgraduate Association guide to postgraduate numbers at Monash University 2012 33
Attendance mode
In 2012:
69% of postgraduates were enrolled via internal mode
24% of postgraduates were enrolled via external mode
7% of postgraduates were enrolled via multi-mode
93% of HDRs were enrolled via internal mode
6% of HDRs were enrolled via external mode
1% of HDRs were enrolled via multi-mode
60% of GPGs were enrolled via internal mode
31% of GPGs were enrolled via external mode
9% of GPGs were enrolled via multi-mode
Attendance mode by course type and by year 2012, 2011 and 2010
Source: Monash University Planning and Statistics, as at 18 June 2013, 7 June 2012, 18 July 2011.
Internal External Multi-modal Total
2012 Higher degree by research 4253 278 46 4577 Graduate/postgraduate 7301 3773 1157 12231 Total 11554 4051 1203 16808
2011 Higher degree by research 4153 260 50 4463 Graduate/postgraduate 7248 4040 1252 12540
Total 11401 4300 1302 17003
2010 Higher degree by research 3858 314 39 4211 Graduate/postgraduate 7427 4412 972 12811
Total 11285 4726 1011 17022

____________________________________________________________________________________________
Monash Postgraduate Association guide to postgraduate numbers at Monash University 2012 34
In 2012:
70% of postgraduates at Gippsland were enrolled via external mode
53% of postgraduates at Parkville were enrolled via external mode
34% of postgraduates at Peninsula were enrolled via external mode
26% of postgraduates at Clayton were enrolled via external mode
10% of postgraduates at Caulfield were enrolled via external mode
Attendance mode by campus and by year 2012, 2011 and 2010
Source: Monash University Planning and Statistics, as at 18 June 2013, 7 June 2012, 18 July 2011.
Clayton Caulfield Peninsula Gippsland Parkville Berwick Sunway South
Africa Total
2012 Internal 5269 5053 380 217 133 54 409 39 11554
External 2088 582 260 769 348 4 4051 Multi-
modal
552 181 123 116 175 6 50 1203
Total 7909 5816 763 1102 656 64 459 39 16808
2011
Internal 5184 5053 418 217 143 13 317 56 11401 External 2261 616 280 859 283 0 0 1 4300
Multi-modal
581 200 154 129 221 0 15 2 1302
Total 8026 5869 852 1205 647 13 332 59 17003
2010 Internal 5028 5222 414 200 127 17 249 28 11285
External 2306 681 325 943 471 0 0 0 4726 Multi-
modal
509 200 129 152 20 0 1 0 1011
Total 7843 6103 868 1295 618 17 250 28 17022

____________________________________________________________________________________________
Monash Postgraduate Association guide to postgraduate numbers at Monash University 2012 35
Student course attempt location
Postgraduate student course attempt location, 2012
Law Faculty
City location 875
Law Total 875
Medicine, Nursing and Health Sciences Faculty
Alfred Hospital 213
Baker Heart Research Institute - Alfred Hospital 32
Bendigo 2
Box Hill Hospital 4
Macfarlane Burnet Inst For Med Res & Public Health Alfred 12
Moe (School Of Rural Health Only) 17
Monash Medical Centre – Clayton 129
Monash Medical School – Alfred 191
Murdoch Children’s Research Institute 1
Notting Hill 20
Peter MacCallum Cancer Institute - East Melbourne 3
Prince Henry’s Institute- MMC Clayton 17
Southbank (Department of Forensic Medicine Only) 4
The Walter & Eliza Hall Inst of Medical Research 1
Medicine, Nursing and Health Sciences Total 646
Grand Total 1521 Source: Monash University Planning and Statistics, as at 18 June 2013.
The table above lists course attempt locations excluding the eight main campuses and any externally enrolled postgraduates. The remaining locations each have postgraduates physically based at the premises for the duration of their courses.
88% of the postgraduates enrolled in the Faculty of Law were based in the city location
18% of the postgraduates enrolled in the Faculty of Medicine, Nursing and Health Sciences were based at various hospitals, research centres and other locations as described above.

____________________________________________________________________________________________
Monash Postgraduate Association guide to postgraduate numbers at Monash University 2012 36
Equity groups
In 2012:
425 or 2.5% of postgraduates identified themselves as having a disability
1097 or 6.5% of postgraduates were from an area of low socio-economic status
Equity group by faculty, 2012 Faculty Disabled Low SES
Art, Design and Architecture 18 20
Arts 78 88
Business and Economics 51 107
Education 77 238
Engineering 13 86
Information Technology 16 36
Law 54 49 Medicine, Nursing and Health Sciences
88 367 Pharmacy and Pharmaceutical Sciences 13 74 Science 17 30 T & R
2
Total 425 1097
Source: Monash University Planning and Statistics, as at 18 June 2013.
The largest number of postgraduates with a disability were enrolled through the Faculty of Medicine, Nursing and Health Sciences (88) however the greatest proportion were enrolled in the Faculties of Law (5.5%) and Art (4.7%).
The largest number of postgraduates from an area of low socio-economic status, were enrolled in the Faculty of Medicine, Nursing and Health Sciences (367) however the greatest proportion were enrolled in the Faculty of Pharmacy and Pharmaceutical Sciences (11%).
Equity group by campus, 2012
Campus Disabled Low SES
Clayton 240 548
Caulfield 106 196
Gippsland 41 176
Peninsula 17 94
Parkville 13 74
Berwick 3 9
Sunway 5
Total 425 1097
Source: Monash University Planning and Statistics, as at 18 June 2013.
The largest number of postgraduates with a disability were on the Clayton and Caulfield campuses however the greatest proportion, 5% were enrolled via Berwick campus.
Gippsland campus has the greatest proportion (16%) of postgraduate students from an area of low socio-economic status.

____________________________________________________________________________________________
Monash Postgraduate Association guide to postgraduate numbers at Monash University 2012 37
Equity group by sex, 2012
Sex Disabled Low SES
Female 264 706
Male 161 391
Total 425 1097
Source: Monash University Planning and Statistics, as at 18 June 2013.
62% of postgraduates who identified themselves as having a disability were female.
64% of postgraduates from an area of low socio-economic status were female.


![Valve terminal MPA-S - Festo USA · Pneumatic components description Valveterminalwith MPA-Spneumatics Type: MPA-FB MPA-CPI MPA-MPM-…and MPA-ASI-… 534241 1309f [8028624] Valve](https://img.pdfslide.net/doc/110x75/5c5bd85409d3f236368c6efe/valve-terminal-mpa-s-festo-usa-pneumatic-components-description-valveterminalwith.jpg)


![Ventilinsel MPA-S - festo.com · PDF fileBeschreibung Pneumatik Ventilinselmit MPA-S Pneumatik Typ: MPA-FB MPA-CPI MPA-MPM-und MPA-ASI- 534240 1309f [8028623] Ventilinsel MPA-S](https://img.pdfslide.net/doc/110x75/5a79d19f7f8b9ab83f8b7435/ventilinsel-mpa-s-festocom-pneumatik-ventilinselmit-mpa-s-pneumatik-typ-mpa-fb.jpg)