Embed Size (px)
Citation preview

NBER WORKING PAPER SERIES
THE MYSTERY OF ZERO-LEVERAGE FIRMS
Ilya A. StrebulaevBaozhong Yang
Working Paper 17946http://www.nber.org/papers/w17946
NATIONAL BUREAU OF ECONOMIC RESEARCH1050 Massachusetts Avenue
Cambridge, MA 02138March 2012
We are grateful to John Graham and Harley R. (Chip) Ryan for providing us with data. We wouldlike to thank Vikas Agarwal, Kenneth Ahern, Mark Chen, Martijn Cremers, Darrell Duffie, John Graham,Lubomir Litov, Jayant Kale, Omesh Kini, Ulrike Malmendier, Erwan Morellec, Francisco Pérez-González,Michael Roberts, Chip Ryan, Toni Whited, Jeff Zwiebel, and participants of Western Finance Association2006 meeting in Keystone, and Baruch College, Stanford GSB FRILLS and PhD seminars for thoughtfulcomments, and Paul G. Ellis for editorial advice. The views expressed herein are those of the authorsand do not necessarily reflect the views of the National Bureau of Economic Research.
NBER working papers are circulated for discussion and comment purposes. They have not been peer-reviewed or been subject to the review by the NBER Board of Directors that accompanies officialNBER publications.
© 2012 by Ilya A. Strebulaev and Baozhong Yang. All rights reserved. Short sections of text, not toexceed two paragraphs, may be quoted without explicit permission provided that full credit, including© notice, is given to the source.

The Mystery of Zero-Leverage FirmsIlya A. Strebulaev and Baozhong YangNBER Working Paper No. 17946March 2012JEL No. G3,G32,G34,G35
ABSTRACT
This paper documents the puzzling evidence that a substantial number of large public non-financialUS firms follow a zero-debt policy. Over the 1962-2009 period, on average 10.2% of such firms havezero debt and almost 22% have less than 5% book leverage ratio. Neither industry nor size can accountfor such puzzling behavior. Zero-leverage behavior is a persistent phenomenon, with 30% of zero-debtfirms refrain from debt for at least five consecutive years. Particularly surprising is the presence ofa large number of zero-leverage firms who pay dividends. They are more profitable, pay higher taxes,issue less equity, and have higher cash balances than their proxies chosen by industry and size. Thesefirms also pay substantially higher dividends than their proxies and thus their total payout ratio is virtuallyindependent of leverage. Firms with higher CEO ownership and longer CEO tenure are more likelyto follow a zero-leverage policy, especially if boards are smaller and less independent. Family firmsare also more likely to be zero-levered. Our results suggest that managerial and governance characteristicsare related to the zero-leverage phenomena in an important way.
Ilya A. StrebulaevGraduate School of BusinessStanford University655 Knight WayStanford, CA 94305and [email protected]
Baozhong YangJ. Mack Robinson College of BusinessGeorgia State University35 Broad Street, Suite 1243, Atlanta GA [email protected]

The Mystery of Zero-Leverage Firms 1
In the year 2000, 701 (or 14.0%) of large public non-financial US firms had zero outstanding
debt, including both short- and long-term debt, in their capital structure. This is neither an
outlier nor an aberration. Between 1962 and 2009, on average 10.2% of firms show no debt in
their capital structure, and 32% have zero or negative net debt. This is also not a short-term fad,
for 61% of firms that have no debt in their capital structure in any given year show no inclination
to take on any debt in the next year. We call the tendency of so many firms to eschew any debt
the zero-leverage puzzle. In this paper we document the puzzle along various dimensions and test
a number of economic mechanisms that can shed light on such an extreme corporate financial
policy.
There are a number of reasons why studying the zero-leverage phenomenon is important for
better understanding of capital structure decisions. It is closely related to the much studied low-
leverage puzzle, which refers to the stylized fact that on average firms have low leverage ratios
relative to what we would expect from various models of capital structure. The way theoretical
work has typically addressed the low-leverage puzzle is by considering plausible economics forces
that would drive the optimal average leverage ratio down (e.g., Goldstein, Ju, and Leland (2001)).
However, this reconciles empirical facts with theory only insofar as average leverage ratios are
equated. What we show is that to explain the low-leverage puzzle one really needs to explain why
some firms tend not to have debt at all rather than why firms on average have lower outstanding
debt than expected, and most of extant models fail on this dimension. For example, excluding
firms with lower than 5% of book (market) leverage (optimal leverage under a reasonable set of
parameters is higher than 5% in most theoretical models) increases the average book (market)
leverage ratio from 25% to 32% (28% to 37%). Thus, this result partially replaces the low-leverage
puzzle with a zero-leverage puzzle. In addition, corporate theorists find it difficult to explain the
coexistence of different securities (e.g. debt and equity) at the firm level (e.g., Tirole (2001)) and
zero-levered firms is the only type of public firms to resolve this coexistence puzzle.
From the empirical perspective, studying the determinants of zero-leverage behavior can shed
light on the economic mechanisms that lead firms to become low-levered as such factors are likely
to be dominating for zero-debt firms and are thus easier to identify. In addition, it is important to
investigate whether zero-leverage firms leave a substantial fraction of their value on the table by
not optimizing on tax benefits of debt, extending line of research originated by Graham (2000).
In addition to documenting the extent of the zero-leverage behavior, the paper presents evi-
dence on another surprising (given our theories of capital structure and dividend policies) stylized

The Mystery of Zero-Leverage Firms 2
fact that about a third of zero-leverage firms pay dividends. Moreover, and more intriguingly,
we find that, conditional on paying dividends, firms effectively replace interest expense with div-
idends and share repurchases, so that the total payout ratio is relatively flat across the whole
spectrum of leverage.
To understand better the nature of zero-leverage behavior, we construct for each zero-leverage
firm-year observation a reference set of proxy firms that serve as control observations. Each set
has up to four firm-observations in the same year and industry that are closest in size and have
the same dividend-paying status as the zero-leverage observation. Importantly, in constructing
reference sets, we do not condition on debt policy. Our findings strongly indicate that there
are substantial differences in fundamental characteristics between zero-leverage firms and their
proxies. Proxy firms are highly levered (on average 20%), indicating that neither industry nor
size can account for zero-debt policies.
Firms that follow zero-leverage policy have higher market-to-book ratios and higher cash
balances, are more profitable, and pay more taxes and dividends. Perhaps surprisingly, zero-
leverage firms are not younger than their control firms. Our analysis also indicates that debt
substitutes such as leasing and pension liabilities cannot account for zero-leverage behavior. Taken
together, these stylized facts provide a striking illustration of the assertion by Graham (2000) that
many profitable firms seem to be underlevered.
Dividend-paying zero-leverage firms leave a lot of money on the table by not levering up. Were
an average such firm to increase its leverage to the level of its dividend-paying proxies, potential
tax benefits amount, under the conservative scenario, to more than 7% of the market value of
equity. Were the same firm to refinance to the point where its marginal corporate tax rate is zero,
gains would be much larger at about 15% of the equity value.
Zero-leverage behavior is a highly persistent phenomenon. For example, conditioning on sur-
vival for five years, 30% of zero-leverage firms do not raise any debt in the next four years. In
the absence of persistence, simulations show that this fraction is only 0.3%. If the firm survives
for 10 years, it does not have any debt over the ten-year period in 15% of cases.
A plausible explanation of the zero-leverage phenomenon is that the manager’s personal prefer-
ences differ from those of shareholders. For example, if the manager is endowed with substantial
stock ownership and thus under-diversified, he would find debt more costly than shareholders.
Furthermore, if the board is more manager-friendly, a manager will find it easier to implement
a strategy of his personal choice. In our empirical analysis, we find strong evidence consistent
with these mechanisms. For example, for the sample of 1,006 firm-year observations with CEO

The Mystery of Zero-Leverage Firms 3
ownership above 10%, 22% of observations have no debt, double the fraction for the total sample.
Controlling for other factors, a one standard deviation increase in CEO ownership increases the
likelihood that a firm adopts (almost) zero-leverage policy by an economically significant 2.8%.
We also find that firms with longer-tenured CEOs and smaller and more independent boards are
more likely to use debt conservatively. Moreover, CEO ownership and tenure are significantly re-
lated to zero-leverage policy only in firms with smaller and less independent boards. Interestingly,
these findings are much stronger in the dividend-paying sample than in the zero-dividend sample,
indicating that economic forces related to managerial preferences have a potential to explain the
most puzzling part of zero-leverage behavior.
Family-controlled firms can also be expected to follow conservative debt policies. Becker (1981)
and Bertrand and Schoar (2006) argue that family members can be altruistic and derive utility
from passing on the family legacy and safeguarding the well being of other family members. Desire
for the long-term survival increases the perceived risk of default-risky debt. Consistent with this
intuition, we find that family firms are substantially more likely to be zero-levered.
Our paper belongs to the cohort of empirical studies that have recently investigated conser-
vatism in corporate debt policy. Graham (2000) finds that firms are substantially underlevered
from the debt tax benefits viewpoint; moreover, firms that follow conservative debt policy are more
likely to be stable and profitable. Minton and Wruck (2001) analyze the behavior of low-leverage
firms. Similar to our study, they form reference sets for low-leverage firms in their sample and an-
alyze the persistence and implications of financial conservatism. Our empirical method and set of
questions differ from theirs in a number of ways. Their low-leverage sample includes firms that had
long-term leverage in the bottom 20% of all firms for five pre-specified years, and the reference set
includes all remaining firms. Thus, their proxy construction is conditioned on leverage, while our
proxy construction specifically exclude capital structure. Our results also add to the existing body
of literature exploring relationship between managerial features and corporate capital structure
policies. One stream of literature (Agrawal and Nagarajan (1990), Berger, Ofek, and Yermack
(1997), Lewellen (2006), and Coles, Daniel, and Naveen (2006)) has examined the influence of
managerial ownership and compensation on leverage choices. Graham and Narasimhan (2004)
and Malmendier, Tate, and Yan (2011) show that CEO characteristics such as overconfidence and
Great Depression experience cause managers to reduce leverage. Our findings complement this
literature by linking the puzzling extreme debt conservatism with several salient CEO and firm
characteristics, such as CEO ownership and family status.
The rest of the paper is organized as follows. The following section presents the data, the

The Mystery of Zero-Leverage Firms 4
methodology we use to estimate capital structure and construct proxies for zero-leverage firms,
and our initial empirical analysis. Section II provides further empirical analysis on potential tax
benefits, relation between zero-debt policy and industry and size, and the persistence of zero-
debt behavior. Section III presents our analysis of the relation between zero-leverage policy and
managerial and governance variables. Section IV concludes.
I. Data Description and Initial Empirical Evidence
I.A. Data Sources, Sample Selection, and Leverage Definitions
To construct our sample, we start with the merged annual Compustat/CRSP data set over the
period 1962–2009.1 We exclude financial companies (SIC 6000–6999), utilities (SIC 4900–4999),
non-U.S. companies (entries in Compustat with FIC code not equal to USA), and non-publicly
traded firms and subsidiaries (entries in Compustat with stock-ownership variable, STKO, equal
to 1 or 2). There are 259,579 firm-year observations that satisfy these criteria. We also exclude
firm-years with total book value of assets (Compustat data item AT ) of less than $10 million
in inflation-adjusted year-2000 dollars.2 All nominal values are converted into year 2000 dollar
values using CPI index from the U.S. Bureau of Labor Statistics. In the paper, “date t” always
refers to calendar year t.3 We also require the observations to have valid market leverage and
book leverage ratios as defined below. This leaves us with 157,536 firm-year observations with
14,327 unique firms, from a minimum of 471 observations in 1962 to a maximum of 5,358 in 1997.
We define the book leverage ratio of firm i in year t by:
BLit =DLTTit +DLCit
ATit
, (1)
where DLTT is the amount of long-term debt exceeding maturity of one year and DLC is debt
in current liabilities, including long-term debt due within one year. The book leverage ratio is
defined similarly in most recent capital structure papers (e.g., Lemmon, Roberts, and Zender
(2008), Graham and Leary (2010), Leary and Roberts (2010), Lemmon and Zender (2010)).4
1The Compustat data before 1962 is biased towards large firms.2Another possibility is to exclude all firms with less than $10 million nominal value of book assets, which results
in the omission of more observations. As the exclusion of small firms is due to the presence of noise in the accountingdata, the rationale for either of the two procedures depends on the nature of noise, which can be either fixed acrossyears or proportional to average input numbers. We have replicated all the empirical analysis in the paper on theresulting second data set without any of the qualitative results being affected.
3Specifically, we use Compustat data item DATADATE which is the calendar date of the fiscal year end. Forconsistency, we also use fiscal-year end stock prices (the variable PRCC F ).
4 An alternative definition used in earlier papers is BLit =DLTTit+DLCit
DLTTit+DLCit+ATit+TXDITCit−PSTKLit−LTit
, where

The Mystery of Zero-Leverage Firms 5
By the same token, we define the (quasi-)market leverage ratio of firm i in year t by:
MLit =DLTTit +DLCit
DLTTit +DLCit + CSHOit × PRCC Fit
, (2)
where PRCC F is the fiscal year-end common share price and CSHO is the fiscal year-end
number of shares outstanding.
The choice of leverage definitions requires a special discussion in the context of our paper.
As we are interested in interpreting empirical results, we would like to use the measures most
often used in the empirical literature. From this perspective, definitions (1) and (2) are the most
common definitions of total leverage. At the same time, there is no widespread consensus on what
constitutes “debt” and one alternative is to use total liabilities (e.g., Rajan and Zingales (1995)).
However, we are interested in active capital structure choices of firms while a non-trivial portion
of non-debt liabilities (such as accounts payable) may reflect day-to-day business arrangements
rather than financing considerations.5
The choice of denominator is less important in the context of zero leverage. Also, since all U.S.
firms follow broadly the same accounting rules, there is no need to make any of the adjustments one
has to make when comparing leverage internationally (e.g., Rajan and Zingales (1995)). Finally,
using the interest-coverage ratio as our main definition does not materially change our results.
I.B. Zero/Almost Zero-Leverage Firms and Their Proxies
B.1. Zero-Leverage Firms
We define firm i in year t as a zero-leverage (ZL) firm if in that year the outstanding amounts
of both short-term debt (DLC) and long-term debt (DLTT ) equal zero.6 Column 1 of Table I
shows the fraction of ZL firms relative to the total size of the sample in each year between 1962
and 2009. On average, 10.2% of firm-years over the whole sample period exhibit zero leverage,
from a minimum of 4.3% in 1980 to a maximum of 19.9% in 2005. The table shows a substantial
variation in the fraction of unlevered firms across years. For comparison, we also calculate the
LT is the book value of total liabilities, TXDITC is deferred taxes, and PSTKL is preferred stock (see e.g. Famaand French (2002)). Defining book equity this way using accounting variables may lead to low or negative values ofbook equity causing outliers in leverage ratios. Replicating all our results using this definition of book equity whilecontrolling for outliers does not affect our results.
5The unreported analysis of other liabilities such as accounts payable confirms that these liabilities are typicallysubstantially smaller for zero-leverage firms.
6As a robustness check, we excluded from the final sample all observations with zero debt for the first time. Itdoes not change any qualitative results.

The Mystery of Zero-Leverage Firms 6
fraction of firms with zero long-term debt. Column 2 reports that about 15% of the sample [Table I
here]carry no long-term debt, implying that on average about 30% of firms with zero long-term debt
carry liabilities classified by Compustat as short-term debt. Whether these firms refinance their
short-term debt every year, or the definition of short-term debt includes items that would not be
classified as “debt” for financial, as opposed to accounting, purposes, is unclear.
We also define the second category of firms which we call almost zero-leverage (AZL) firms.
AZL firms have a marginal debt presence in their capital structure and we classify a firm as an AZL
firm if its book leverage ratio is less than 5%. There are a number of reasons why we consider these
firms in addition to ZL firms. From a theoretical standpoint, a number of models (e.g., Fisher,
Heinkel, and Zechner (1989), Leland (1994), Leland and Toft (1996), Leland (1998), Goldstein, Ju,
and Leland (2001), Ju, Parrino, Poteshman, and Weisbach (2005)) produce leverage ratios that
are well above zero. Cross-sectional dynamics modeled by Strebulaev (2007) may produce firms
that are almost zero-leverage but in his benchmark case their fraction is very low. Practically,
the finance nature of various liabilities assigned by accounting conventions to debt is ambiguous
(for example, advances to finance construction or installment obligations). While our choice of
the 5% cut-off is ad hoc, it is likely on the conservative side. Increasing the cut-off to 7% (10%)
increases the average annual fraction of AZL firms by 3.1 (7.7) percentage points. As Columns
3 of Table I shows, an astonishing 22% of firms are almost zero-levered for the whole sample
and almost 28% can be classified as AZL over the 1987–2009 period.7 To reflect on the models
mentioned above, none of them, whether dynamic or static, can produce such low leverage for
reasonable parameters (for example, in Strebulaev (2007), less than 1% of firms have leverage of
less than 5% in dynamics.)
Finally, as cash may be viewed as negative debt in some contexts, we also investigate the
fraction of firms that have non-positive net debt (NPND), where net debt is defined as the book
value of debt minus cash (CHE).8 We find that 33% (39%) of firms had non-positive net debt
over the 1962–2009 (1987–2009) period. Again, the means hide a substantial variation across
years. A comparison of ZL and NPND firms suggests that for a substantial number of firms cash
plays a more important role in their balance sheets than debt liabilities.
7Untabulated results for AZL firms defined by market leverage are qualitatively similar.8For the analysis of corporate cash policy and differences between cash and negative debt, see Gamba and
Triantis (2006), Acharya, Almeida, and Campello (2007), and Acharya, Davydenko, and Strebulaev (2011).

The Mystery of Zero-Leverage Firms 7
B.2. Proxies
The consistently large fractions of ZL and AZL firms are surprising and the obvious next
question to ask is whether comparable firms have different leverage ratios. To gauge this, we
proceed by constructing for every ZL and AZL firm-year observation a reference set of proxy firm-
years. Our benchmark construction procedure is by calendar year, industry, size, and dividend-
paying status. It is important to stress that we do not condition on leverage-related measures.
For example, proxies can be zero-levered as well. Specifically, we start by identifying for each
ZL/AZL firm-year all firms in that year with the same three-digit SIC code. Compustat reports
historical SIC codes (SICH) starting from 1987. For firm-years before 1987 we have to use the
1987 historical SIC codes or, if unavailable, the codes in Compustat primary SIC variable (SIC)
reported in 2009.9
As most industries include firms in different stages of their life, such as high-growth (by
industry standards) and mature, we condition by choosing only those proxies that follow the
same dividend policy: for zero-dividend (dividend-paying) ZL/AZL firms, proxies are chosen
among zero-dividend (dividend-paying) firms. This conditioning has been used in other studies.
For example, Fama and French (2002) justify the separation of ZD and DP firms by arguing that
it tests better the implications of the pecking order idea (Myers (1984)), and Lemmon, Roberts,
and Zender (2008) control for dividend payers in their empirical analysis of leverage ratios.10
Of all the firms in the same three-digit SIC industry in the year of the observation and the
same dividend-paying status we choose up to four firms closest to the ZL/AZL observation in size,
as measured by the natural logarithm of the book value of assets, as long as the value of book
assets is between 0.5 and 2 times the corresponding value of the ZL/AZL observation. We call
this a reference set of proxy firms. On average, for each ZL/AZL observation, this set contains
3.4 proxies. The set of proxy firms varies cross-sectionally for ZL/AZL firms within the same
industry because of differences in size and varies temporally for the same ZL/AZL firm because
of the evolution in the industry composition.
Panel A of Table II reports the range of descriptive statistics for ZL/AZL firms and their
proxies. Definitions of all the variables are given in Appendix B. To produce the statistics for
proxies, we weigh all observations equally within each reference set. All statistics are then equally [Table II
here]9In unreported analysis, using the 1987–2009 sample does not change our results qualitatively. Thus the potentialmisidentification of the industry code prior to 1987 does not seem to bias the results substantially.
10In an earlier version of the paper, we used two proxy sets for each ZL/AZL firm, with and without conditioningon the dividend-paying status. Most results hold for both proxy sets; the results are available upon request.
The Mystery of Zero-Leverage Firms 8
weighted for each year and then annual statistics are averaged.11 The table demonstrates that
proxy firms do indeed have substantially larger leverage. For the 1962–2009 period, the average
book (market) leverage ratio of proxies is 19% (20%)12. These statistics are also closer to the
average leverage ratio in the aggregate Compustat sample (which is 25% (28%) for book (market)
leverage) than to their ZL/AZL counterparts. This suggests that industry and size alone can
not account for the zero-leverage phenomenon. The unreported results for the 1987–2009 period
are similar suggesting that using constant SIC for the pre-1987 sample is unlikely to introduce a
substantial bias.
ZL/AZL firms and their proxies are also different along a number of other dimensions: on
average, they have higher market-to-book ratio, less tangible assets, are more profitable, pay
higher dividends and higher income taxes.13 An important observation is that ZL/AZL firms
have substantially higher cash balances, on average 75% more, than their proxies.14 This suggests
that zero-leverage firms may prefer having negative debt to the extent that increasing cash is a
substitute for negative debt. If that is the case, it may have non-trivial implications for standard
econometric analysis of leverage decisions for it implies that zero leverage is in fact a binding
constraint and the results reported in the first three columns of Table I may underestimate the
number of low-levered firms. At the same time, ZL/AZL firms and their proxies are similar along
other dimensions, such as “age” (defined as the number of years in Compustat), R&D expenditure,
and earnings volatility.
B.3. Dividend-Paying and Zero-Dividend Samples
While this descriptive analysis is suggestive, it overlooks the possibility that the differences
are driven by ZL firms that are high-growth firms. That very high-growth firms may prefer having
substantially less debt is not very surprising. At the same time, for the total sample, ZL/AZL
firms pay higher dividends and have higher cash balances. As a standard approach to distinguish
between high-growth firms and cash cows we study dividend-paying (DP) and zero-dividend (ZD)
samples separately. From an economic viewpoint, it would be more surprising to observe ZL
11Averaging equally across observations does not change any of the results significantly.12Note that book leverage is slightly lower than market leverage because of the way we define book leverage. See
footnote 4.13One has to be careful in interpreting the tax-related results, as the accepted GAAP measures and the actual
taxes reported to the IRS can be substantially different.14One well-known explanation of higher cash balances is that large global companies are tax-disadvantaged when
repatriating profits into the U.S. and thus keep cash in their foreign subsidiaries (Foley, Hartzell, Titman, andTwite (2007)). See also Graham and Tucker (2006) for the analysis of tax shelters in general. If we exclude thelargest zero-leverage firms, however, the result is virtually unchanged.
The Mystery of Zero-Leverage Firms 9
firms that also pay dividends thus effectively replacing payout to debtholders with payout to
equityholders.15
The table below summarizes our final classification of the sample, with the abbreviated names
for the four classes of firms. For example, firms that pay a dividend and have the book leverage
ratio of less than 5% are called AZL-DP firms. It might be of more economic importance to
document and explain the puzzling prevalence of ZL/AZL-DP firms, the issue on which we mostly
concentrate in this paper.
Zero Leverage Almost Zero Leverage
Dividend Payers ZL-DP AZL-DP
Zero Dividend ZL-ZD AZL-ZD
Panels B and C of Table II report descriptive statistics for DP and ZD firms and their proxies,
respectively. An important result is that conditioning on dividend-paying policy does not resolve
the zero-leverage puzzle: both ZL/AZL-ZD and ZL/AZL-DP firms have substantially lower lever-
age than their proxies. The characteristics of ZL/AZL-ZD firms support the contention that these
firms are high-growth: their size is smaller than that of DP firms, they are younger, their R&D
expense is higher, and, importantly, they are on average substantially less profitable than DP
firms.16 Perhaps surprisingly, ZL/AZL-ZD and ZL/AZL-DP firms are similar along a number of
other dimensions in that ZD firms also have higher cash balances and pay higher income taxes
than their proxies.
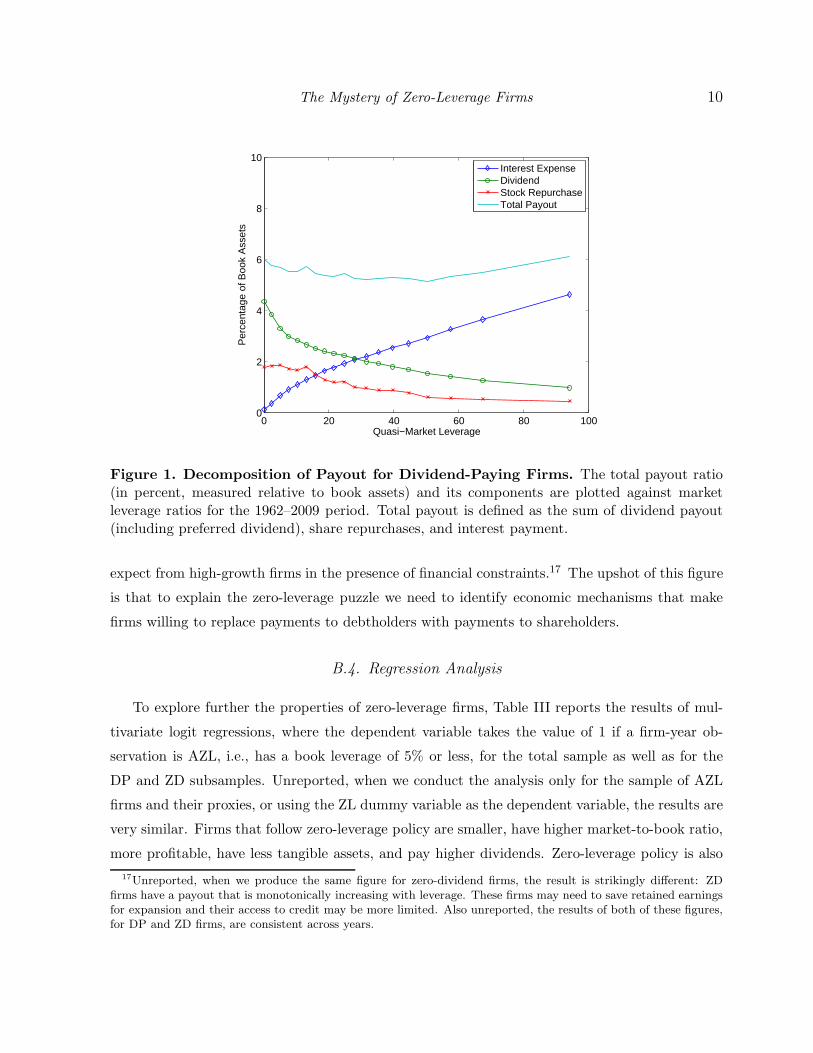
ZL-DP(AZL-DP) firms have substantially higher dividend ratios than their proxies: they pay
out on average 57% (41%) more than their proxies as measured relative to book assets. What
is then about the total payout of these firms? Figure 1 shows the decomposition of the ratio of
total payout to book assets as a function of leverage for the total sample period. It shows that, as
expected, interest expense is a monotonically increasing function of leverage. It also shows that
dividends and share repurchases are almost monotonically decreasing in leverage. A surprising
observation is that the total payout ratio is relatively stable across the leverage spectrum, between
about 5.1% to 6.1%. If anything, the payout ratio of zero-leverage firms is almost the largest of
all firms at 6.0%. This supports the intuition that ZL/AZL-DP firms do not choose to eschew
debt because they think they have to retain a higher fraction of earnings – something one would
15We also explored several alternative classification schemes, for example, based on (a) the expected tax benefitsand (b) on the total payout policy (the sum of interest and dividend payments) with qualitatively similar conclusions.
16Although many of these firms report negative GAAP profits, some still pay income taxes. We also do not takeinto account tax credits and the non-linearities in income tax schedules.
The Mystery of Zero-Leverage Firms 10
0 20 40 60 80 1000
2
4
6
8
10
Quasi−Market Leverage
Per
cent
age
of B
ook
Ass
ets
Interest ExpenseDividendStock RepurchaseTotal Payout
Figure 1. Decomposition of Payout for Dividend-Paying Firms. The total payout ratio(in percent, measured relative to book assets) and its components are plotted against marketleverage ratios for the 1962–2009 period. Total payout is defined as the sum of dividend payout(including preferred dividend), share repurchases, and interest payment.
expect from high-growth firms in the presence of financial constraints.17 The upshot of this figure
is that to explain the zero-leverage puzzle we need to identify economic mechanisms that make
firms willing to replace payments to debtholders with payments to shareholders.
B.4. Regression Analysis
To explore further the properties of zero-leverage firms, Table III reports the results of mul-
tivariate logit regressions, where the dependent variable takes the value of 1 if a firm-year ob-
servation is AZL, i.e., has a book leverage of 5% or less, for the total sample as well as for the
DP and ZD subsamples. Unreported, when we conduct the analysis only for the sample of AZL
firms and their proxies, or using the ZL dummy variable as the dependent variable, the results are
very similar. Firms that follow zero-leverage policy are smaller, have higher market-to-book ratio,
more profitable, have less tangible assets, and pay higher dividends. Zero-leverage policy is also
17Unreported, when we produce the same figure for zero-dividend firms, the result is strikingly different: ZDfirms have a payout that is monotonically increasing with leverage. These firms may need to save retained earningsfor expansion and their access to credit may be more limited. Also unreported, the results of both of these figures,for DP and ZD firms, are consistent across years.

The Mystery of Zero-Leverage Firms 11
persistent: firms that have zero leverage when they are reported in Compustat for the first time,
are more likely to have zero leverage in subsequent years. Firms are also more likely to have zero
leverage when the fraction of ZL firms is high in their three-digit SIC industry. The table also
shows the economic significance of these measures by providing the change in probability that the
firm follows a ZL policy for one standard deviation change in the independent variable (or for the
change from 0 to 1 for a dummy variable). A one standard deviation increase in profitability is
associated with an increase in propensity to become an AZL firm by between 2.1% and 3.8% and
the same change in tangibility with a decrease in propensity by between 4.9% and 8.0%.
A straightforward explanation of low leverage is that debt is squeezed out by various sub-
stitutes or non-debt tax shields (DeAngelo and Masulis (1980), Graham, Lang, and Shackleford
(2004), Graham and Tucker (2006), Shivdasani and Stefanescu (2010)). Data availability allows
us to check two such economic mechanisms. First, although capital leases are included on the
balance sheet as debt, operating leases are not. Recently, the topic of operating leases has re-
ceived renewed attention in the capital structure literature. Rampini and Viswanathan (2010)
and Rauh and Sufi (2010) propose including the capitalized value of operating leases in total
debt valuation. However, operating leases can both complement traditional debt and play the
role of its substitute (see, e.g., Ang and Petersen (1984), Lewis and Schallheim (1992), Graham,
Lemmon, and Schallheim (1998), Yan (2006), Eisfeldt and Rampini (2010)). Following Graham,
Lemmon, and Schallheim (1998), we define operating leases as the sum of current rental payment
(XRENT ) and the discounted present value of future rental commitments (MRC1, MRC2, . . .,
MRC5). The discount rate is set to be 10% for all firms as in Graham, Lemmon, and Schallheim
(1998).18 Results of univariate comparison in Table II and logit regressions Table III show that
(A)ZL firms’ use of operating leases are not significantly different from other firms, for all the
samples we consider. This finding suggests that operating leases are unlikely to play a major role
in explaining zero-leverage policy.
Second, unfunded pension and healthcare liabilities constitute potentially an important debt
substitute. These liabilities have recently played an important part in many high-profile bankrupt-
cies, such as GM and United Airlines. Shivdasani and Stefanascu (2010) find that for firms with
defined benefit pension plans, tax deductions of pension contributions equal about one-third of
that of debt interest payments. Following Shivdasani and Stefanascu, we define Pension Obliga-
tions as the sum of Projected Pension Obligations (PBPRO) and Projected Pension Obligations
18We also tried an alternative definition of operating leases using available short-term borrowing rate (BASTR).Adopting this alternative definition reduces the size of the sample by more than two thirds, but does not changeany results materially.

The Mystery of Zero-Leverage Firms 12
(Underfunded) (PBPRU), and Pension Assets as the sum of Pension Plan Assets (PPLAO) and
Pension Plan Assets (Underfunded) (PPLAU). We define (Net) Pension Liabilities as the dif-
ference between Pension Obligations and Pension Assets if Pension Obligations are greater than
or equal to Pension Assets, and as zero otherwise. We use Pension Liabilites as a proxy for the
extent of tax deductibility of pension plans.19 In our sample, only about one-tenth (16,966) of the
firm-year observations report positive Pension Liabilities. Interestingly, Tables II and III show
that zero-leverage firms have significantly less (net) pension liabilities than other firms. This
result is consistent with a stylized observation that firms with large unfunded pension plans are
also typically highly levered. Overall, it is likely that economic factors that lead to higher debt
usage also contribute to larger pension liabilities and are unlikely to explain zero-leverage policy.
The results of our regression analysis need to be taken with a large grain of salt as leverage
decisions are obviously endogenous to other financial and investment decisions. Nevertheless, the
reported correlations are suggestive: firms (and more so, dividend-paying firms) that prefer to
eschew debt are profitable, exhibit large tax payments, accumulate large cash balances, pay out
larger dividends — in fact, they replace interest payments with dividends and stock repurchases. If
anything, these firms violate the standard trade-off proposition and take to the extreme Graham’s
(2000) assertion that firms that are “large, profitable, liquid, in stable industries, and face low ex
ante costs of distress” (p. 1902) are underlevered.
II. Understanding Zero-Leverage Behavior
II.A. The Value of Potential Tax Benefits for Zero-Leverage Firms
How much in tax benefits can ZL/AZL firms potentially get if they increase their leverage?
In other words, how much money do they leave on the table by not levering up? This is a similar
question to the one investigated by Graham (2000) for a cross-section of U.S. firms. If the marginal
tax rates for ZL firms are close to zero, the potential tax benefits of borrowing are limited and
the ZL phenomenon may not be puzzling after all. Some preliminary evidence, such as that on
the extent of profitability of dividend-paying ZL/AZL firms, suggests that the marginal tax rates
of ZL firms are in fact likely to be higher than those of comparable firms. In this section, we
quantify the value of these tax shields to explore the issue in more detail.
Consider a scenario when a firm intends to raise its (market) leverage from its current ratio
19Using Pension Contributions as an alternative proxy does not generate any differences between ZL/AZL firmsand proxy firms.
The Mystery of Zero-Leverage Firms 13
L0 to the target leverage ratio L∗ by undergoing recapitalization. For tractability, we assume
that debt takes the form of perpetuity and is issued at par, and that all parameters are constant.
As long as finite maturity debt issues are expected to be routinely rolled over, this assumption is
innocuous. Let firm’s outstanding book debt is D0 and the current value of its market equity is
ME0. After restructuring, book debt and market equity values are respectively, D∗ = D0 +∆D
and ME∗. The potential tax benefits, denoted by PTB(∆D), are given by:
PTB(∆D) =
∫ D0+∆D
D0
τ(x)dx, (3)
where τ(x) is the marginal tax rate of the firm with debt level x. We assume that tax benefits
accrue to equityholders, and that any debt raised is used to pay dividends or repurchase shares.
The new market equity value is given by:
ME∗ = ME0 + PTB(∆D)−∆D, (4)
and the target leverage ratio L∗ is:
L∗ =D∗
ME∗ +D∗=
D0 +∆D
ME0 + PTB(∆D) +D0. (5)
To compute the potential tax benefits for each firm, we need marginal tax rates at all leverage
levels. For the marginal tax rate τ(D0) at the firm’s current leverage, we use both the after-
interest and before-interest marginal tax rates (Graham, Lemmon, Schallheim (1998) and Graham
(2000)).20 We then assume that τ(x) is linearly declining from x = D0 to x = Dm, where Dm is
the debt level at which the marginal tax rate first becomes 0. In other words:
τ(x) =
τ0Dm−xDm−D0
, D0 ≤ x < Dm;
0, x ≥ Dm.(6)
20Although after-interest marginal tax rates is commonly used to compute tax benefits of debt, Graham, Lem-mon, Schallheim (1998) proposes using before-interest marginal tax rates under certain circumstances to avoid theendogeneous influence of capital structure on marginal tax rates. We thank John Graham for making the dataavailable to us. Since Graham’s data starts in 1980, we restrict our sample in this section to the 1980–2009 period.The resulting subsample consists of 72,597 (81,522) observations between 1980 and 2009 if we use the before-interest(after-interest) marginal tax rate.

The Mystery of Zero-Leverage Firms 14
We estimate Dm for each firm-year as:
Dmi,t = max
(
CFmi,t
rt,D0
)
, (7)
where CFmi,t reflects the projected cash flow capability and rt is the applicable interest rate. In
essence, we assume that the firm can utilize tax benefits only to the extent it is profitable and
ignore the complications of tax carry provisions. As a conservative benchmark case, we assume
that the marginal tax rate is zero at the minimum cash flow level that the firm had over the last
N years:
CFmi,t = min
(
EBITi,t−s
ATi,t−s
: s = 0, . . . , N − 1
)
·ATi,t, (8)
where earnings are rescaled by the firm’s book assets in year t. This definition of Dm ensures
that in each period the interest payment rD∗ for debt level D∗ < Dm is smaller than any of
the cash flows in the past N years, so that this firm, if it refinances to D∗, is unlikely to face a
liquidity crisis in the future. Specifically, if in any year cash flow is negative, the marginal tax
rate is assumed zero. As a proxy for rt we use the average corporate bond interest rate in year t.
In the benchmark case, we choose N = 5 and rt = rAAt , the AA-rated corporate bond yield.21
Alternatively, we define CFmi,t to be the average (rescaled) cash flow level in the past N years:
CFmi,t =
1
N
(
N−1∑
s=0
EBITi,t−s
ATi,t−s
)
· ATi,t. (9)
This formulation is less conservative in a sense that even in the case of tax losses, it assumes that
the firm will be able to utilize them later. We also consider the alternative choice for interest rate
rt = rBBBt , the BBB-rated corporate bond yield.
With (6) and (3), the potential tax benefit function is:
PTB(∆D) =
τ0∆D(
1− ∆D2(Dm−D0)
)
, 0 ≤ ∆D < Dm −D0;
12τ0(D
m −D0), ∆D ≥ Dm −D0.(10)
21We use Moody’s AA corporate bond yield time series from Global Financial Data.

The Mystery of Zero-Leverage Firms 15
Plugging (10) into (5), the target leverage ratio is:
L∗ =
D0+∆D
ME0+τ0∆D(
1− ∆D2(Dm
−D0)
)
+D0
, 0 ≤ ∆D < Dm −D0;
D0+∆D
ME0+12τ0(Dm−D0)+D0
, ∆D ≥ Dm −D0.
(11)
The solution of ∆D in terms of the target leverage, ∆D = ∆D(L∗), is provided in Appendix A.
Table IV shows the potential tax benefits of ZL/AZL firms as a fraction of market asset values
(where the market value of equity is measured before relevering) for various target leverage ratios
and alternative assumptions. We first investigate the scenario of target leverage L∗ being the
average market leverage ratio of the reference set, which we denote by LPr.22 To control for [Table IV
here]implicit distress costs, we impose an additional upper bound of 70% (see e.g. Asquith, Gertner,
and Scharfstein (1994) for evidence of distress at high leverage). Thus, L∗ = min(LPr, 70%).23
For brevity, we discuss the results using the before-interest tax rates (Panel A) and note that
the results in Panel B are quantitatively similar. Column 1 in Panel A of Table IV shows that
dividend-paying ZL firms leave on average 7.6% (8.0% at the median) of their market value
“on the table” by not increasing leverage ratios to the level of their proxy firms. In this case,
the use of average proxy leverage can also be thought of as accounting for unobserved industry
factors. Our second choice of L∗ is the optimal leverage ratio, Lm. Again, to be conservative,
we use L∗ = min(Lm, 70%). Column 2 of Panel A shows that dividend-paying ZL firms give up
on average a striking 15.6% (17.1% at the median) of their market value by not restructuring to
optimal leverage ratios. Potential savings for dividend-paying AZL firms are of similar magnitude.
The other columns of Table IV also show that these numbers are robust to alternative assumptions
about cash flows and corporate bond interest rates. On the other hand, the tax savings for zero-
dividend ZL/AZL firms are much smaller at 2.8% (0.1%) for an average (median) ZD-ZL firm. The
difference between means and medians indicates, however, that tax benefits are also substantial
for a number of (A)ZL firms that do not pay dividends, which include such high-profile firms such
as Microsoft (until recently) and Apple.
Our assumptions in deriving potential tax benefits are mostly on the conservative side: (i)
tax savings from carry-forward/-back provisions are largely excluded; (ii) by using the minimum
cash flow in the past five years as the liquidity threshold in the benchmark case, the chances
22If the target leverage ratio L∗ is less than the current leverage ratio L0, we do not recapitalize and we let the
potential tax-benefit function be zero. This does not change any results as there can be no such cases for ZL firmsand only a few for AZL firms.
23Unreported, our results are not sensitive to an increase in the upper bound.

The Mystery of Zero-Leverage Firms 16
that the firm goes into liquidity crisis and incurs significant costs of distress are much lower; (iii)
the assumption that the marginal tax rate function is linear decreases tax benefits relative to
the case when it is concave (which is more likely to be the case in practice). Therefore, the fact
that ZL-DP firms give up substantial amount of tax benefits reinforces the mystery about their
extreme debt aversion. One issue where we are likely to have overestimated the potential tax
benefits is our lack of adjustment for personal taxes. As the level of marginal personal taxes on
income and capital gains depends on the ownership structure of firms, and firm-specific marginal
personal tax rates are not available, we leave it for further exploration.
II.B. Relation Between Zero-Leverage and Low-Leverage Puzzles
The low-leverage puzzle refers to the stylized fact that, on average, firms are lower levered than
otherwise would be expected by standard trade-off models of capital structure. For example, over
the period 1987–2003, the market leverage ratio of an average firm in the Compustat sample is
about 26%. A benchmark static capital structure model of Leland (1994) produces a leverage ratio
in the order of 70–90% under reasonable parameters. A number of studies have been trying to
identify theoretically the reasons why firms are on average low levered. For example, Goldstein, Ju,
and Leland (2001), Ju, Parrino, Poteshman, and Weisbach (2005) and Strebulaev (2007) explain
the low-leverage puzzle by considering dynamic capital structure and non-linear tax benefits to
debt. In addition, Strebulaev (2007) shows that in dynamic capital structure models typically
lead to higher leverage in dynamics compared to refinancing points. Ju et al. (2005) and Morellec
(2003) consider managerial risk-aversion and managerial entrenchment. All these studies find
that their calibrated models can produce, under reasonable parameters, lower leverage ratios,
thus explaining the average corporate leverage ratio in the economy. For example, by considering
the dynamic version of their static model, Goldstein et al. (2001) reduce the benchmark leverage
ratio in their calibrations from 55% to a more reasonable 36% at refinancing.
Characteristically, however, all these models produce a relatively high lowest leverage ratio
under the most cases they consider: the lowest leverage is 34.3% in Goldstein et al. (2001, Table
1, page 498), 6% at the 1 percentile value in the dynamic version of Strebulaev (2007, Table 3,
page 40), 9.35% in Morellec (2003, Table 1, page 274) and 8.03% in Ju et al. (2005, Table 2, page
270). The exceptions are models with endogenous investment (Hennessy and Whited (2005)) and
models which introduce fixed costs in the dynamic capital structure model with sufficiently small
firms optimally choosing zero leverage (Kurshev and Strebulaev (2006)).
These models are a long way from being able to explain the presence of ZL/AZL firms in

The Mystery of Zero-Leverage Firms 17
the economy. Broadly, our results demonstrate that these models are unlikely to explain the
cross-sectional distribution of corporate leverage ratios. This is consistent with the observation
of Graham (2003) that many low-debt firms are not firms that one would think of having high
costs of debt.
The low-leverage and zero-leverage puzzles are closely connected. Table V shows that if one
excludes ZL firms from the Compustat sample, then the average (market) leverage ratio over the
1987–2009 period increases from 24.7% to 28.6%. Moreover, if one also excludes AZL firms (as [Table V
here]most of these models can not produce almost zero leverage as well), the average leverage ratio
increases further from 28.6% to 36%, which is roughly the level of debt produced by such models as
Goldstein et al. (2001) and Strebulaev (2007). The fact that excluding ZL/AZL firms produces a
moderately “high” leverage of about 36% suggests that the explanation of the low-leverage puzzle
is likely to lie not in the behavior of the average firm, which is almost “normally” levered, but in
the extremely low-levered firms. In other words, these results show that the low-leverage puzzle
is actually an artifact of the zero-leverage puzzle and we may need a new generation of theoretical
models to explain it.
II.C. Persistence of Zero-Leverage Behavior
It is well known that corporate leverage is a persistent phenomenon (e.g. Lemmon, Roberts,
and Zender (2008)). In this section we therefore address an important question of whether zero-
leverage policy is persistent. If zero-leverage is an artifact of imbalance between maturing debt
contracts and new debt issuance, this would imply that the puzzling behavior is only of short
duration.
To analyze the persistence with which firms follow ZL/AZL policies, for each firm j in our
sample and for each k between 1 and 20, we estimate the probability that firm j follows the ZL
(AZL) policy continuously for k − 1 more years, conditional on adopting such a policy in any
given year and surviving for at least k − 1 years. To give an example, assume the firm has 25
consecutive annual observations in Compustat and has zero leverage in the first 15 years and is
highly levered in the remaining 10 years. There are 15 sequences of k = 10 consecutive years for
this firm beginning with a year in which the firm has zero debt. The firm follows the zero-debt
policy for at least 10 years for 6 out of these 15 sequences. Thus, conditional on adopting a ZL
policy, the firm continues to follow it for a further 9 years with likelihood of 0.4. By averaging
over all firms we get a measure of the k-year conditional persistence of a chosen debt policy in
the sample. Averaging over firms avoids bias in favor of more mature firms.

The Mystery of Zero-Leverage Firms 18
Table VI reports the results of this exercise. Firms have a 61% chance of continuing a ZL
policy in the next year. About 30%, 15%, and 5% (35%, 20%, and 9%) of firms that survived for
5, 10, and 20 years respectively continuously exhibit ZL (AZL) behavior. Although these numbers
are suggestive, to compare them to similar statistics in the absence of intertemporal dependence,
we construct the same persistence measure for Monte Carlo (MC) simulated economies. The MC
economy is generated by preserving the number of firms and the distribution of firms’ leverage
ratios in each year so as to be identical to the Compustat economy, but otherwise randomly
reshuffling firms cross-sectionally. Constructed in this way, the MC economy can be thought of [Table VI
here]as a benchmark economy with no persistence in debt policies, which at the same time produces
cross-sectional descriptive statistics of leverage ratios identical to the economy actually observed
in each year.
Table VI reports that in the MC economy a ZL firm stays ZL in the next year with a 9.3%
chance, compared with the actually observed 61%. For longer periods the MC economy generates
persistence values close to zero. As confirmed by t-statistics, there is a statistically significant
difference in persistence between the actual and MC economies. Such differences effectively rule
out the possibility that zero-leverage is not a persistent phenomenon. This result is consistent with
findings that firms restructure their leverage infrequently (Leary and Roberts (2005), Strebulaev
(2007)).
II.D. Industry and Zero-Leverage Firms
Results in Table III strongly indicate that zero-leverage behavior is driven in part by industry-
specific factors. To explore this further, Panel A of Table VII reports the distribution of ZL/AZL
firms in major industries. There is indeed a substantial variation of the extent of zero-leverage
behavior across industries – from 4.3% (9.4%) of firms following a ZL (AZL) policy in the Tele-
com sector to 15.0% (32.0%) of firms following ZL (AZL) policy in the Technology sector over the
1962–2009 period. The extent of ZL (AZL) behavior in healthcare and technology industries may
be consistent with the view that reputation, human capital, and asset illiquidity considerations
are influential. Nevertheless, as the table shows, there is a significant number of ZL/AZL firms in
each industry, indicating that extreme debt-aversion is a widespread rather than a specialized phe-
nomenon. The results over the two sample periods (1962–2009 and 1987–2009) also demonstrate [Table VII
Here]that the distribution of ZL firms in each industry is relatively stable over time.

The Mystery of Zero-Leverage Firms 19
III. Zero-Leverage Behavior and Corporate Governance
A plausible explanation of the puzzling zero-leverage behavior is in the preferences of corporate
decision-makers, managers and large shareholders. Firms may end up low levered if managers have
a personal preference to use debt conservatively. For example, CEOs with large stock ownership
are likely to be less diversified than institutional investors, leading to personal costs of distress
being substantially higher.24 Furthermore, when CEOs are more entrenched and face friendlier
boards, they are more likely to be successful in pursuing policies of their choice (Weisbach (1988),
Hermalin and Weisbach (1998)). In this section, we examine whether the relationship between
zero-leverage phenomena and CEO and governance variables is consistent with some of these
economic forces.
There is by now a substantial empirical literature linking managerial preferences and corpo-
rate actions. For example, Lewellen (2006) finds that the larger the stock ownership of CEOs
and the smaller their option grants the more likely their firms have lower leverage. Agrawal and
Nagarajan (1990) find that firms that had no long term debt between 1979 and 1983 have higher
managerial stockholdings than their levered industry counterparts. Coles, Daniel, and Naveen
(2006) find that managers with greater delta (sensitivity of compensation to stock prices) and
smaller vega (sensitivity of compensation to stock volatility) use less debt.25 In addition, Graham
and Narasimhan (2004) show that CEOs with Great Depression experience tend to rely more on
internal than external financing and Malmendier, Tate, and Yan (2011) show that CEO overconfi-
dence and Great Depression experience lead to more conservative leverage policy. In a theoretical
model, Hackbarth (2008) studies the implications of managerial traits such as optimism and over-
confidence on leverage decisions. Ryan and Wang (2011) find that CEOs who have worked for
more employers increase firm’s leverage. Our results complement these studies by providing links
between the extreme debt conservatism of firms and salient CEO and firm characteristics.26
24Another argument that CEOs who are large shareholders may be unwilling to lever up is that their personaltax situation is different from that of a marginal shareholder. Grinblatt and Titman (2002, p. 552) give an exampleof Microsoft, suggesting that a potential reason of Microsoft’s zero leverage is Bill Gates’s personal tax situation.
25However, in an earlier work, Berger, Ofek, and Yermack (1997) find that both CEO stock ownership and optionholdings are positively related to leverage.
26Zwiebel (1996) proposes an economic mechanism, in which managers may optimally choose higher leveragewhen faced with a possibility of hostile takeovers. Using such measures as the G-index of Gompers, Ishii, andMetrick (2003) we do not find support for this argument. However, these measures are known to be endogenousand more robust empirical methods, such as structural modeling, are needed to shed further light on this issue. Weleave it to future research.

The Mystery of Zero-Leverage Firms 20
III.A. Data and Variables
Adding CEO characteristics, as well as ownership and corporate governance measures, reduces
our sample substantially. We first introduce the new variables and discuss the resulting sample.
We use board and certain CEO characteristics from the RiskMetrics Directors database (formerly
IRRC). The database covers the S&P 1500 firms over the period 1996–2009. The variables we
use are: Board Size, the number of directors in the board; Frac. Indep. Directors, the fraction of
independent (non-insider and non-affliated) directors in the board; CEO Tenure, the number of
years that the current CEO has served as the firm’s CEO.
We also use CEO ownership and compensation variables from the Compustat ExecComp
database, which covers essentially the S&P 1500 firms over the period 1992–2009. The variables
we use are: CEO Stock Ownership, CEO holdings of the firm’s stock as a fraction of total shares
outstanding; CEO Option Holdings, CEO holdings of the firm’s stock options as a fraction of
stock shares outstanding; CEO Cash Comp., logarithm of the sum of CEO salary and bonus. In
this section, we restrict analysis to firms in our entire sample for which the above CEO and board
variables are defined. The restricted sample consists of of 13,446 observations with 1,962 unique
firms over the period 1996–2009.
III.B. Empirical Analysis
We start by describing the relationship between zero-leverage policies and CEO ownership in
our sample. Table VIII ranks all sample firm-years (Panel A) and firms (Panel B) by CEO stock
ownership and reports the fraction of ZL and AZL among these firms. The table clearly shows
that two measures are highly correlated. For example, consider 100 firms with the highest CEO [Table VIII
here]ownership. For these firms, the average CEO ownership is 24% (vs. 2.8% for the whole sample)
and the fraction of these firms that pursue ZL (AZL) policy is 20.4% (40.5%) compared to just
14.1% (27.1%) for the whole sample. Overall, the table shows a nearly monotonic relationship
between the extent of the CEO stock ownership and the zero-leverage policies.
Table IX shows the results of the logit analysis of AZL policy. For all regressions, we control for
the variables used in Table III (except Net Pension Liabilities and Operating Leases). Unreported,
the economic and statistical significance of these variables are consistent with the results in Table
III, suggesting that the determinants of ZL policy in the restricted sample have a similar impact.
Table IX shows that firms with larger CEO stock ownership are substantially more likely to
be zero-levered, consistent with managerial preference explanations. A one standard deviation [Table IX
here]

The Mystery of Zero-Leverage Firms 21
increase in CEO stock ownership increases the likelihood of AZL policy by an economically and
statistically significant 2.8 percentage points. In addition, firms in which CEOs have larger option-
based compensation packages are likely to be more levered, although this relation is less robust.
The results also indicate that poorer corporate governance is related to ZL policy: firms with
more independent directors, larger boards, and shorter CEO tenure are less likely to choose zero
leverage. In addition, unreported results show that these results are substantially stronger for
the sample of dividend-paying firms than for zero-dividend firms, suggesting that the managerial
preference story is able to explain the most puzzling part of zero-leverage behavior. Existing
empirical evidence on the relationship between board size and firm performance is ambiguous
(e.g., Yermack (1996), Eisenberg, Sundgren, and Wells (1998), Bhagat and Black (2001), and
Coles, Daniel, and Naveen (2008)). Cheng (2008) finds that firms with a larger board adopt
less extreme policies, suggesting that it is harder for a larger group to reach a consensus. This
economic mechanism can explain why a smaller board is more associated with ZL policy. In an
unreported analysis, we also find that lagged CEO and governance variables can predict firms’
decisions to adopt and abandon ZL policy. For example, larger CEO ownership is associated with
a significantly higher chance of adopting and lower chance of abandoning a zero leverage status.
The governance story suggests that CEOs should find it easier to adopt a low-debt policy with
a more favorable board. Therefore, the effects of the CEO ownership and tenure are likely to be
stronger when the board is smaller and less independent. Table X reports the results of the logit
analysis where we include the interaction terms of board and CEO characteristics. Specifically, [Table X
here]we include the interactions of a board size dummy (where Small (Large) Board is defined as the
board with the size below (above) the sample median) and a board independence dummy (where
Low (High) Independence is defined as the board with the fraction of independent directors below
(above) the sample median) with CEO stock ownership and tenure. The results suggest that the
effects of CEO stock ownership and tenure are indeed mostly driven by observations where the
boards are less independent and small.
It is important to emphasize that, although the economic mechanisms underlying our intuition
are plausible, we cannot rule out the potential explanation that firms for which zero-leverage policy
is optimal (for as yet unknown to us reasons), choose CEOs and their compensation packages
correspondingly. Our results in this section clearly indicate the need for further study of these
economic mechanisms when additional data is available.

The Mystery of Zero-Leverage Firms 22
III.C. Family Firms and Zero-Leverage Firms
The private benefits of control is another well-recognized dimension of agency costs. Large
shareholders and founders may care more about the private benefits of control and their voting
rights. With respect to family firms, Becker (1981) and Bertrand and Schoar (2006) argue that
family members can be altruistic in the sense that they can derive utility from maintaining the
family legacy or the well being of other family members. Taken together, CEOs of family firms
may be particularly averse to risks posed by the presence of debt.
To shed light on this issue, we use a hand-collected dataset that contains family firm status
for S&P 1500 firms over the 2003–2006 period.27 The definition of a family firm follows that
of Anderson and Reeb (2003), Villalonga and Amit (2006), and Li, Wang, and Ryan (2011).
Specifically, a family firm is one in which the founder or any family member of the founding
family is a director, an officer, or owns 5% or more of the outstanding equity. Our resulting
sample consists of 4,010 firm-year observations for 1,457 unique firms over 4 years.
As Table XI reports, a family firm is significantly more likely to use debt conservatively. At
the same time, most of related corporate governance variables remain significant (apart from the
board independence). Even after controlling for other variables, family firms are 7% more likely [Table XI
here]to pursue zero-leverage policy than non-family firms.28 Given the limited availability of data on
family status in our sample, a broader study of the impact of family firms can shed more light on
their relation with other CEO and governance characteristics.
IV. Concluding Remarks
This paper documents the puzzling evidence that a substantial number of large public non-
financial US firms follow a zero-debt policy. Using the Compustat data set we find that, over
the 1962–2003 period, on average 10.2% of such firms have zero leverage and almost 22% have
a less than 5% book leverage ratio. Neither industry nor size can fully explain such puzzling
behavior. Particularly surprising evidence is the presence of a large number of zero-leverage firms
who pay dividends. Zero-leverage dividend-paying firms are more profitable, pay higher taxes,
and have higher cash balances than their proxies chosen by industry and size. These firms also
pay substantially higher dividends than their proxies and thus the total payout ratio is relatively
27We thank Harley R. Ryan for generously sharing the data with us. See Li, Wang, and Ryan (2011) for a detaileddescription of the data.
28Consistent with the intuition that family members care about survival, ZL firms on average survive by about13% (10 months) longer than their proxy firms.

The Mystery of Zero-Leverage Firms 23
independent of leverage.
Were they to lever up to the level of their proxies, zero-leverage dividend-paying firms would
save about 7% of the market equity value in a conservative scenario. Nevertheless, zero-leverage
policy is found to be persistent over the long term. Firms with large CEO ownership and more
CEO-friendly boards are more likely to end up being zero-levered. Family firms are also more
likely to pursue zero-leverage policies. Overall, our results suggest that CEO and governance
features of firms are important determinants of the zero-leverage phenomena. More research
that further explores these relationships will be helpful for our understanding of the zero-leverage
puzzle and debt conservatism in general.
Appendix A. Estimation of Potential Tax Benefits
Equation (11) can be solved algebraically to find ∆D. Define:
A =L∗ME0 − (1− L∗)D0
Dm −D0
. (A1)
Since L∗ ≥ L0 = D0
D0+ME0
, it follows that A ≥ 0. There are two cases:29
(1) If 0 ≤ A < 1, then
∆D = (Dm−D0)
√
(1− τ0L∗)2 + 2τ0L∗A− (1− τ0L∗)
τ0L∗(A2)
(2) If A > 1, then
∆D = (Dm−D0)(A +
1
2τ0L
∗). (A3)
29In the trivial cases when either the current marginal tax rate τ0 = 0 or the target leverage L∗ = 0, or Dm = D0,
we set D∗ = D0 and PTB(D∗) = 0.

The Mystery of Zero-Leverage Firms 24
Appendix B. Definition of Variables
Compustat variable names (in upper case letters) are used in the definitions below.
Variable Description Definition
Book Leverage Book leverage (DLTT +DLC)/AT
Market Leverage Market leverage (DLTT +DLC)/(DLTT +
DLC+CSHO×PRCC F )
CPI Annual consumer price index from the Bureau of La-
bor Statistics
Log(Size) Natural logarithm of book assets adjusted to 2000
dollars
log(ATt × CPI2000/CPIt)
Market to Book Ratio of market assets to book assets (Tobin’s q) (LT + PSTKL −
TXDITC + CSHO ×
PRCC F )/AT
Dividend Ratio of common dividends to book assets DVC/AT
Cash Ratio of cash holdings to book assets CHE/AT
Profitability Ratio of earnings before interests, taxes and depre-
ciation to book assets
OIBDP/AT
Share Repurchases Ratio of share repurchases to book assets PRSTKC/AT
Tangibility Ratio of fixed assets to book assets PPENT/AT
Tax Ratio of taxes paid to book assets TXT/AT
R&D Ratio of R&D expenses to sales XRD/SALE
Age Number of years since the firm’s record first appears
in Compustat (Age = 0 for the first record)
Earnings Vol. Volatility of profitability calculated for the past 10
years (minimum 3 years of data required)
Capital Expenditure Ratio of capital expenditure to book assets CAPX/AT
Asset Sale Ratio of asset sales to book assets (SPPE + SIV )/AT
Net Equity Issuance Ratio of net equity issuance to book assets (SSTK − PRSTKC)/AT
Net Debt Issuance Ratio of the change in current and long-term debt to
book assets
(DLCt + DLTTt −
DLCt−1 −DLTTt−1)/ATt
Init. Book Lev. Initial book leverage of the firm (first record in Com-
pustat)
Init. Market Lev. Initial market leverage of the firm (first record in
Compustat)
Init. ZL Dummy variable: 1 if initial book leverage is zero
and 0 otherwise
Init. AZL Dummy variable: 1 if initial book leverage is 5% or
lower and 0 otherwise
Operating Leases Sum of current rental payment and the discounted
present value of future rental commitments (up to
five years)
XRENT +∑5
s=1
1
1.1sMRCs
Net Pension Liabili-
ties
Difference between pension obligations and pension
assets (=0 if the result is negative)
max(PBPRO+PBPRU −
PPLAO − PPLAU, 0)

The Mystery of Zero-Leverage Firms 25
References.
Acharya, Viral V., Heitor Almeida, and Murillo Campello, 2007, “Is cash negativedebt? A hedging perspective on corporate financial policies”, Journal of Financial Intermediation16, 515–554.
Acharya, Viral V., Sergei Davydenko, and Ilya A. Strebulaev, 2011, “Cash Holdingsand Credit Risk”, Working Paper, New York University, Stanford University, and University ofToronto.
Agrawal, Anup, and Nandu J. Nagarajan, 1990, “Corporate Capital Structure, AgencyCosts, and Ownership Control: The Case of All-Equity Firms”, Journal of Finance, 45, 1325–1331.
Anderson, R. C., and D. M. Reeb, 2003, “Founding Family Ownership and Firm Performance:Evidence from the S&P 500”, Journal of Finance 58, 1301–1329.
Ang, James, and Pamela P. Peterson, 1984, “The Leasing Puzzle”, Journal of Finance 39,1055–1065.
Asquith, Paul, Robert Gertner, and David Scharfstein, 1994, “Anatomy of FinancialDistress: An Examination of Junk Bond Issuers,” Quarterly Journal of Economics, 109, 625–658.
Becker, Gary, 1981, “Altruism in the family and selfishness in the market place”, Economica48, 1–15.
Berger, Philip G, Eli Ofek, and David L. Yermack, 1997, “Managerial entrenchment andcapital structure decisions”, Journal of Finance 52, 1411–1438.
Bertrand, M., and A. Schoar, 2006, “The role of family in family firms”, Journal of EconomicPerspective 20, 73–96.
Bhagat, Sanjai, and Bernard Black, 2001, “The non-correlation between board indepen-dence and long term firm performance”, Journal of Corporation Law 27, 231–274.
Cheng, Shijun, 2008, “Board size and the variability of corporate performance”, Journal ofFinancial Economics 87, 157–176.
Coles, Jeffrey L., Naveen D. Daniel, and Lalitha Naveen, 2006, “Managerial incentivesand risk-taking”, Journal of Financial Economics 79, 431–468.
Coles, Jeffrey L., Naveen D. Daniel, and Lalitha Naveen, 2008, “Boards: Does one-sizefit all?”, Journal of Financial Economics 87, 329–356..
DeAngelo, Harry, and Ronald W Masulis, 1980, “Optimal Capital Structure Under Cor-porate and Personal Taxation”, Journal of Financial Economics, 8, 3–29.
Eisenberg, T., S. Sundgren, and M. Wells, 1998, “Larger board size and decreasing firmvalue in small firms”, Journal of Financial Economics 48, 35–54.
Eisfeldt, Andrea, and Adriano Rampini, 2009, “Leasing, Ability to Reposess, and DebtCapacity”, Review of Financial Studies 22, 1621–1657.
Fama, Eugene F., and Kenneth R. French, 2002, “Testing Trade-Off and Pecking OrderPredictions about Dividends and Debt”, Review of Financial Studies, 15, 1–33.
Fischer, Edwin O., Robert Heinkel, and Josef Zechner, 1989, “Optimal Dynamic CapitalStructure Choice: Theory and Tests”, Journal of Finance, 44, 19–40.
Foley, C. Fritz, Jay Hartzell, Sheridan Titman, and Garry Twite, 2007. “Why DoFirms Hold So Much Cash? A Tax-Based Explanation”, Journal of Financial Economics 86,579–607.

The Mystery of Zero-Leverage Firms 26
Gamba, Andrea, and Alexander Triantis, 2008, “The Value of Financial Flexibility”, Jour-nal of Finance 63, 2263–2296.
Goldstein, Robert, Nengjiu Ju, and Hayne E. Leland, 2001, “An EBIT-Based Model ofDynamic Capital Structure”, Journal of Business, 74, 483–512.
Gompers, Paul A., Joy L. Ishii, and Andrew Metrick, 2003, “Corporate Governance andEquity Prices”, Quarterly Journal of Economics 118, 107–155.
Graham, John R., 2000, “How Big Are the Tax Benefits of Debt”, Journal of Finance 55,1901–1941.
Graham, John R., 2003, “Taxes and Corporate Finance: A Review”, Review of FinancialStudies, 16, 1074–1128.
Graham, John R., Mark H. Lang, and Douglas Shackelford, 2004, “Employee StockOptions, Corporate Taxes, and Debt Policy”, Journal of Finance, 59, 1585–1618.
Graham, John R. and Mark Leary, 2010, A Review of Empirical Capital Structure Researchand Directions for the Future, Annual Review of Financial Economics 3, forthcoming.
Graham, John R., and Krishnamoorthy Narasimhan, 2004, “Corporate Survival and Man-agerial Experiences During the Great Depression”, Working paper, Duke University.
Graham, John R., Michael Lemmon, and James Schallheim, 1998, “Debt, Leases, andTaxes and the Endogeneity of Corporate Tax Status”, Journal of Finance, 53, 131-162.
Graham, John R., and Alan L. Tucker, 2006, “Tax Shelters and Corporate Debt Policy”,Journal of Financial Economics, 81, 563–594.
Grinblatt, Mark, and Sheridan Titman, 2002, Financial Markets and Corporate Strategy,2nd Edition, McGraw-Hill.
Hackbarth, Dirk, 2008, “Managerial Traits and Capital Structure Decisions”, Journal of Fi-nancial and Quantitative Analysis, 43, 843–81.
Hermalin Benjamin E., and Michael S. Weisbach, 1998, “Endogenously Chosen Boards ofDirectors and Their Monitoring of the CEO”, American Economic Review, 88, 96–118.
Hennessy, Chris, and Toni Whited, 2005, “Debt Dynamics”, Journal of Finance, 60, 1129–1165.
Ju, Nengjiu, Robert Parrino, Allen M. Poteshman, and Michael S. Weisbach, 2005,“Horse and Rabbits? Optimal Dynamic Capital Structure from Shareholder and Manager Per-spectives”, Journal of Financial and Quantitative Analysis, 259–281.
Kurshev, Alexander, and Ilya A. Strebulaev, 2006, “Firm Size and Capital Structure”,Working Paper, Stanford Graduate School of Business.
Leary, Mark T., and Michael R. Roberts, 2005, “Do Firms Rebalance their Capital Struc-tures?” Journal of Finance, 60, 2575–2619.
Leary, Mark T., and Michael R. Roberts, 2010, “The Pecking Order, Debt Capacity, andInformation Asymmetry”, Journal of Financial Economics 95, 332–355.
Leland, Hayne E., 1994, “Corporate Debt Value, Bond Covenants, and Optimal Capital Struc-ture,” Journal of Finance, 49, 1213–1252.
Leland, Hayne E., 1998, “Agency Costs, Risk Management, and Capital Structure”, Journalof Finance, 53, 1213–1243.
Leland, Hayne E., and Klaus Toft, 1996, “Optimal Capital Structure, Endogenous Bankruptcy,and the Term Structure of Credit Spreads”, Journal of Finance, 51, 987–1019.
Lemmon, Michael L., Michael R. Roberts, and Jaime F. Zender, 2008, “Back to the
The Mystery of Zero-Leverage Firms 27
Beginning: Persistence and the Cross-Section of Corporate Capital Structure”, Journal of Finance63, 1575–1608.
Lemmon, Michael L. and Jaime F. Zender, 2010, “Debt Capacity and Tests of CapitalStructure Theories”, Journal of Financial and Quantitative Analysis 45, 1161–1187.
Lewellen, Katharina, 2006, “Financing decisions when managers are risk averse”, Journal ofFinancial Economics 82, 551–590.
Lewis, Craig M., and James S. Schallheim, 1992, “Are Debt and Leases Substitutes?”,Journal of Financial and Quantitative Analysis 27, 497–511.
Li, Zhi, Harley E. Ryan, and Lingling Wang, 2011, “Top Management CompensationIncentives in Family Firms”, Working Paper, Georgia State University and Tulane University.
Malmendier, Ulrike, Geoffrey Tate, and Jon Yan, 2011, “Overconfidence and Early-life Experiences: The Effect of Managerial Traits on Corporate Financial Policies”, Journal ofFinance 66, 1687–1733.
Minton, Bernadette A., and Karen Hopper Wruck, 2001, “Financial Conservatism: Ev-idence on Capital Structure from Low Leverage Firms”, Working paper, Ohio State University.
Morellec, Erwan, 2003, “Can Managerial Discretion Explain Observed Leverage Ratios?”,Review of Financial Studies, 17, 257-294.
Myers, Stuart C., 1984, “The Capital Structure Puzzle”, Journal of Finance, 39, 575–592.
Parrino, Robert, and Michael S. Weisbach, 1999, “Measuring investment distortions aris-ing from stockholder-bondholder conflicts”, Journal of Financial Economics, 53, 3–42.
Rajan, Raghuram G., and Luigi Zingales, 1995, “What Do We Know about Capital Struc-ture? Some Evidence from International Data”, Journal of Finance, 50, 1421–1460.
Rampini, Adriano A., and S. Viswanathan, 2010, “Collateral, risk management, and thedistribution of debt capacity”, Journal of Finance 65, 2293–2322.
Rauh, Joshua, and Amir Sufi, 2010, “Explaining Corporate Capital Structure: Product Mar-kets, Leases, and Asset Similarity”, Review of Finance, forthcoming.
Harley E. Ryan, and Lingling Wang, 2011, “CEO Mobility and the CEO-Firm Match:Evidence from CEO Employment History”, Working paper, Georgia State University and TulaneUniversity.
Shivdasani, Anil, and Irina Stefanescu, 2010, “How Do Pensions Affect Corporate CapitalStructure Decisions?”, Review of Financial Studies 23, 1287–1323.
Strebulaev, Ilya A., 2007, “Do Tests of Capital Structure Theory Mean What They Say?”,Journal of Finance 62, 2633–2671.
Tirole, Jean, 2001, “Corporate Governance”, Econometrica, 69, 1–35.
Villalonga, Belen, and Raphael Amit, 2006, “How Do Family Ownership, Control, andManagement Affect Firm Value?”, Journal of Financial Economics 80, 385–417.
Weisbach, Michael S., 1988, “Outside Directors and CEO Turnover”, Journal of FinancialEconomics, 20, 431–460.
Yan, An, 2006, “Leasing and Debt Financing: Substitutes or Complements?” Journal of Finan-cial and Quantitative Analysis 41, 709–731.
Yermack, David, 1996, “Higher market valuation of companies with a small board of directors”,Journal of Financial Economics 40, 185–212.
Zwiebel, Jeffrey, 1996, “Dynamic Capital Structure under Managerial Entrenchment”, Amer-ican Economic Review, 86, 1197–1215.

The Mystery of Zero-Leverage Firms 28
Table I: Frequency of Zero-Leverage Firms
ZL firms are firms that have zero book debt (DLTT + DLC = 0). ZLTD firmsare firms that have zero long-term debt (DLTT = 0). AZL firms are firms withbook leverage not exceeding 5% in a given year. NPND firms are firms that havenon-positive net debt in a given year, i.e., DLTT + DLC − CHE ≤ 0. ColumnsZL, ZLTD, AZL, and NPND report corresponding fractions of firms relative to thetotal sample in each year. Column N gives the number of firms of in the sample.
Year ZL ZLTD AZL NPND N
1962 12.7 17.4 23.6 39.5 4711963 12.9 17.5 25.7 42.4 4981964 11.9 17.7 24.0 39.2 5301965 10.5 16.9 21.2 34.3 6381966 9.6 15.3 16.9 25.8 1,2811967 7.9 12.2 14.8 22.2 1,3981968 8.0 12.9 16.2 24.6 1,8441969 6.4 10.5 13.9 22.1 2,1011970 5.8 9.4 12.1 18.1 2,5091971 6.2 9.6 13.3 20.3 2,7711972 6.6 10.3 15.0 22.2 3,0191973 6.1 10.2 12.8 19.9 3,0851974 4.7 8.8 11.0 16.4 3,1241975 5.4 8.6 13.2 20.2 3,0551976 5.9 9.0 13.9 23.6 3,0221977 5.6 8.5 13.6 21.7 2,9321978 4.9 7.4 12.2 19.7 3,0341979 4.3 7.0 11.2 18.1 3,1531980 4.3 6.6 11.4 18.5 3,1261981 5.0 7.8 13.0 24.0 3,4001982 5.2 7.5 13.9 24.6 3,3711983 5.8 8.7 17.7 31.3 3,5051984 5.9 8.8 17.3 29.3 3,6111985 5.9 8.9 16.4 28.7 3,5071986 6.7 10.3 16.8 29.7 3,579

The Mystery of Zero-Leverage Firms 29
Table I: Frequency of Zero-Leverage Firms (continued)
Year ZL ZLTD AZL NPND N
1987 6.7 10.6 16.7 28.6 3,7401988 6.3 10.3 15.7 27.3 3,6091989 7.1 11.5 16.8 27.4 3,4451990 7.6 11.8 18.0 28.2 3,3661991 9.4 13.5 21.1 32.2 3,4271992 10.0 14.9 24.2 34.9 3,6621993 11.3 16.8 25.6 36.7 4,0631994 11.6 16.2 25.8 35.8 4,3671995 11.3 16.3 26.2 35.8 4,7031996 13.1 18.4 29.5 39.8 5,2201997 13.2 18.5 29.6 39.6 5,3581998 13.0 18.4 27.3 36.8 5,1791999 13.1 19.2 28.7 38.0 5,1072000 14.0 20.8 31.7 42.2 5,0152001 14.8 21.5 31.2 42.7 4,4852002 15.9 22.2 31.1 43.1 4,1442003 18.0 24.3 33.0 45.9 3,9002004 19.1 24.7 34.9 48.5 3,9062005 19.9 25.5 35.6 49.0 3,8412006 19.5 25.3 34.7 47.8 3,8112007 19.8 26.2 35.5 48.3 3,7862008 18.9 26.9 32.4 44.2 3,5552009 19.5 26.9 34.2 48.3 3,283
Total 10.6 15.3 22.6 33.1 157,536
Mean (87–09) 13.6 19.2 27.8 39.2 4,129Mean (62–09) 10.2 14.8 21.5 32.0 3,282

The Mystery of Zero-Leverage Firms 30
Table II: Descriptive Statistics for Zero-Leverage and Almost Zero-Leverage Firms
This table reports the descriptive statistics for ZL/AZL firms and their proxy firms. ZL firmsare firms that have zero book debt in a given year. AZL firms are firms with book leverage notexceeding 5% in a given year. The selection procedure of proxy firms is described in Section I.B.2.All variables are defined in Appendix B. Panel A reports statistics for all ZL/AZL firms and theirproxy firms. Panel B reports the same statistics for dividend-paying (DP) ZL/AZL firms and PanelC for zero-dividend (ZD) ZL/AZL firms. The statistics of ZL/AZL firms are obtained by takingfirst means for firms in each year and then averaging over all years. To compute proxy statistics,proxy firms for each ZL/AZL observation are first equally weighted, then means are taken for eachyear, assigning equal weight to each set of proxy firms, and then means are averaged over all years.The t-statistic is obtained by applying the Fama-MacBeth procedure to the time-series of annualaverages. The absolute value of a positive (negative) sig is the number of years in which there is asignificant positive (negative) difference (at 5% level) between ZL/AZL firms and proxy firms. The‘All’ columns give the means for the total sample (all DP (ZD) firms in Panel B (C)).
Panel A: Comparison of ZL/AZL Firms and Their Proxy Firms
Variable ZL Proxy t-stat sig AZL Proxy t-stat sig All
Market Leverage 0.0 19.9 -20.39 -48 1.2 19.7 -20.19 -48 27.0Book Leverage 0.0 19.1 -36.49 -48 2.7 19.6 -32.66 -48 24.8Log(Size) 4.5 4.5 -0.23 0 4.7 4.8 -0.09 0 5.3Market-to-Book 2.4 1.9 3.96 40 2.6 2.0 5.66 48 1.7Cash 33.0 19.6 7.12 48 28.2 19.1 5.16 48 14.0Profitability 12.4 9.2 1.62 23 13.0 9.5 1.80 32 11.0Dividend 2.2 1.3 3.03 35 2.0 1.3 2.45 37 1.2Share Repurchase 1.3 1.0 2.25 25 1.3 1.0 1.95 29 1.0Tangibility 21.3 26.2 -3.81 -38 23.4 26.7 -2.53 -39 31.4Tax 6.2 3.9 3.73 47 6.2 3.9 3.85 48 3.5R&D 20.1 18.1 0.52 1 21.4 18.7 0.67 6 9.4Age 6.7 7.1 -0.52 -3 6.9 7.5 -0.84 -23 9.1Earnings Vol. 9.1 9.1 -0.06 2 8.9 8.9 0.01 3 7.0Capital Expenditure 5.9 6.8 -2.97 -16 6.9 7.0 -0.27 -2 7.3Asset Sale 3.0 2.2 1.55 25 2.4 2.2 0.57 23 1.9Net Debt Issuance -0.7 0.5 -1.12 22 -0.7 0.7 -2.89 -23 0.8Net Equity Issuance 7.8 7.0 0.70 11 9.5 6.9 2.01 33 4.0Init. ZL 58.0 16.6 19.59 48 31.7 15.9 14.56 48 12.2Init. AZL 83.0 45.8 16.48 48 77.2 45.9 14.79 48 34.4Operating Leases 8.6 9.3 -0.82 0 8.9 9.2 -0.26 0 8.7Net Pension Liabilities 0.06 0.11 -2.05 23 0.08 0.12 -1.59 23 0.2No. obs. (per year) 313 1,081 769 2,641 3,282

The Mystery of Zero-Leverage Firms 31
Table II: (Continued)
Panel B: Comparison of Dividend-Paying ZL/AZL Firms and Their Proxy Firms
Variable ZL Proxy t-stat sig AZL Proxy t-stat sig All
Market Leverage 0.0 18.3 -20.11 -48 1.3 19.0 -20.04 -48 24.4Book Leverage 0.0 16.8 -36.82 -48 1.2 17.4 -39.88 -48 22.4Log(Size) 5.0 5.0 -0.50 0 5.3 5.3 -0.30 0 6.2Market to Book 2.2 1.7 5.40 33 2.1 1.7 4.70 40 1.6Cash 26.6 15.1 12.69 47 22.0 13.8 11.55 48 10.1Profitability 21.1 17.1 6.41 36 20.6 16.9 6.87 40 16.3Dividend 4.4 2.8 11.07 43 3.8 2.7 7.96 40 2.5Share Repurchase 1.8 1.5 1.04 14 1.8 1.5 1.07 16 1.4Tangibility 25.6 29.5 -4.62 -10 26.8 29.7 -3.75 -17 34.9Tax 7.8 5.3 5.71 42 7.5 5.2 5.63 44 4.6R&D 2.2 2.1 0.26 1 2.2 2.0 0.79 0 1.2Age 11.2 11.1 0.07 1 12.0 11.8 0.14 1 13.7Earnings Vol. 5.4 5.3 0.21 2 5.0 4.9 0.34 2 4.0Capital Expenditure 5.9 6.8 -3.72 -8 6.2 6.7 -2.28 -11 7.2Asset Sale 2.7 1.9 1.79 11 2.3 1.8 1.27 11 1.5Operating Leases 7.0 7.4 -0.53 0 7.2 7.4 -0.35 0 6.7Net Pension Liabilities 0.16 0.27 -1.82 24 0.22 0.30 -1.13 24 0.5No. obs. (per year) 83 226 183 502 1,343
Panel C: Comparison of Zero-Dividend ZL/AZL Firms and Their Proxy Firms
Variable ZL Proxy tstat sig AZL Proxy tstat sig All
Market Leverage 0.0 23.3 -16.22 -44 1.3 23.0 -17.74 -46 31.1Book Leverage 0.0 23.4 -25.53 -44 1.1 23.6 -27.15 -44 28.8Log(Size) 3.9 3.9 -0.08 3 4.1 4.1 -0.08 1 4.6Market to Book 2.7 2.0 4.09 30 2.6 2.0 3.99 38 1.8Cash 35.6 20.3 7.29 46 31.3 19.5 5.85 43 15.2Profitability 8.0 4.5 1.88 9 8.9 5.7 1.77 13 7.4Dividend 0.0 0.0 47 0.0 0.0 48 0.0Share Repurchase 1.3 0.9 2.94 25 1.2 0.9 2.55 24 0.8Tangibility 17.3 24.0 -5.50 -33 19.2 25.2 -4.66 -37 29.1Tax 4.9 2.4 4.78 40 4.9 2.6 4.69 41 2.4R&D 25.6 22.3 0.73 4 24.8 20.9 0.89 5 12.6Age 5.0 5.6 -1.07 -16 5.0 5.7 -1.16 -28 6.7Earnings Vol. 11.6 11.4 0.15 4 11.0 10.8 0.21 6 8.9Capital Expenditure 6.2 7.0 -1.75 -9 6.7 7.2 -0.99 -8 7.6Asset Sale 3.4 2.6 1.42 22 2.7 2.4 0.53 22 2.2Operating Leases 10.0 10.0 0.01 3 10.2 9.9 0.39 1 9.9Net Pension Liabilities 0.05 0.08 -1.97 22 0.05 0.09 -1.75 23 0.2No. obs. (per year) 230 855 483 1,777 1,939

The Mystery of Zero-Leverage Firms 32
Table III: Determinants of (Almost) Zero-Leverage Policy
This table reports the results of logit regressions on the sample over 1962–2009. The dependentvariable is the dummy that equals 1 if a firm-year is AZL, i.e., when it has book leverage lessthan 5%. Columns (1)-(2) present results for the entire sample. Columns (3)-(4) present resultsfor the subsample of dividend payers. Columns (5)-(6) present results for the subsample of zero-dividend firms. “Ind. Frac. AZL” is the fraction of AZL firms (excluding the firm in question)in the same industry, defined by 3-digit SIC, and the same year. All other variables are definedin Appendix B. Coefficients, t-statistics (in parentheses), and economic significance are reported.Economic significance is the average change in probability for a one standard deviation changefor a continuous independent variable, or for the change from 0 to 1 for a dummy variable. Yearfixed effects for calendar years are included. All standard errors adjust for heteroscedasticity andclustering at the firm level. Coefficients marked with ***, **, and * are significant at the 1%, 5%,and 10% level, respectively.
All Firms DP Firms ZD Firms
Variables (1) (2) (3) (4) (5) (6)
Log(Size) -0.358*** -0.361*** -0.510*** -0.549*** -0.217*** -0.231***(-24.43) (-24.00) (-19.82) (-19.54) (-13.48) (-13.98)-7.6% -7.6% -10.3% -10.9% -3.7% -3.8%
Market to Book 0.231*** 0.198*** 0.155*** 0.162*** 0.232*** 0.201***(20.07) (17.26) (4.92) (5.01) (19.86) (17.08)3.5% 3.0% 1.7% 1.8% 3.8% 3.2%
Profitability 1.212*** 1.641*** 3.526*** 3.822*** 0.864*** 1.225***(15.34) (18.13) (9.78) (10.57) (11.00) (13.70)2.6% 3.4% 3.5% 3.8% 2.1% 2.8%
Tangibility -2.495*** -2.933*** -2.379*** -2.125*** -2.564*** -3.216***(-20.32) (-19.18) (-10.05) (-7.57) (-19.66) (-19.21)-6.6% -7.6% -5.6% -4.9% -6.6% -8.0%
Dividend Payer -0.050 0.022(-0.85) (0.37)-0.6% 0.3%
Dividend 24.045*** 24.413*** 22.939*** 22.379***(16.38) (16.68) (14.78) (14.29)5.0% 5.1% 5.3% 5.1%
Earnings Volatility -0.322*** -0.358*** 2.236** 1.788** -0.305*** -0.337***(-3.20) (-3.46) (2.48) (2.05) (-3.01) (-3.26)-0.5% -0.6% 1.0% 0.8% -0.6% -0.6%
Init. ZL 1.401*** 1.361*** 1.427*** 1.425*** 1.356*** 1.297***(33.19) (32.09) (18.19) (18.17) (30.02) (28.76)16.9% 16.2% 16.6% 16.3% 15.4% 14.3%
Ind. Frac. ZL 1.500*** 1.371*** 1.142*** 1.054*** 1.562*** 1.450***(14.01) (12.55) (5.57) (5.11) (13.09) (11.93)3.3% 3.0% 2.0% 1.8% 3.4% 3.1%
(Continued on the next page)

The Mystery of Zero-Leverage Firms 33
(Continued)
All Firms DP Firms ZD Firms
Variables (1) (2) (3) (4) (5) (6)
R&D 0.162*** 0.214 0.125***(7.32) (0.35) (5.79)1.2% 0.1% 1.1%
Log(Age) -0.051** 0.229*** -0.086***(-2.01) (4.12) (-3.10)-0.5% 2.1% -0.8%
Capital Expenditure 2.207*** -0.870 3.049***(8.00) (-1.49) (10.19)1.8% -0.6% 2.5%
Asset Sale 1.480*** 1.917*** 1.266***(9.62) (4.43) (7.94)1.4% 1.2% 1.3%
Operating Leases 0.019 0.334 -0.030(0.15) (1.32) (-0.23)0.0% 0.5% -0.1%
Pension Liabilities -7.286*** -13.915*** -1.295(-4.00) (-4.87) (-0.63)-1.0% -2.0% -0.2%
Constant -0.428*** -0.315* 0.435* 0.219 -2.678*** -1.443**(-2.67) (-1.89) (1.86) (0.95) (-2.83) (-2.51)
Observations 127,074 125,297 55,173 54,635 71,901 70,633Pseudo R-squared 0.259 0.264 0.296 0.302 0.239 0.244

The Mystery of Zero-Leverage Firms 34
Table IV: Potential Tax Benefits for Zero-Leverage Firms
This table reports the value of potential tax benefits as a percentage of market asset values forZL and AZL firms. Medians are reported in parentheses. The sample of DP/ZD-ZL/AZL firmsare considered separately. Panels A and B present results computed using the before-interest andafter-interest marginal tax rates, respectively. To calculate the potential tax benefits, the marginaltax rate τ(D) is assumed to decline linearly with book debt level D from the current debt levelD0 to Dm and is zero for higher debt levels. The optimal debt level Dm = Dm
i,t = CFmi,t/rt, where
CFmi,t is the minimum cash flow (rescaled to current book assets) in the past N years (including the
current year t) of firm i, and r is the average corporate bond yield. The benchmark assumptionsare N = 5 and rt = rAA
t , the AA-rated corporate bond yield. Column 1 considers the case of thetarget leverage L∗ = min(LPr, 70%), where LPr is the average market leverage ratio of the firm’sproxies. In Column 2, the target leverage L∗ = min(Lm, 70%), where Lm is the optimal leverageratio. Columns 3, 4 and 5 consider the case L∗ = min(LPr, 70%) with alternative assumptions.Column 3 changes the definition of CFm to be the current cash flow. Column 4 changes CFm
to be the average (rescaled) cash flow of the past 5 years. Column 5 changes rt to be rBBBt , the
BBB-rated corporate bond yield. Columns 6, 7 and 8 consider the case L∗ = min(Lm, 70%) withparallel assumptions as in columns 3, 4 and 5.
Scenarios1 2 3 4 5 6 7 8
Panel A. Results using before-interest marginal tax rates
DP-ZL 7.58 15.63 8.45 8.82 7.39 19.12 20.11 14.68( 7.97) (17.14) ( 8.91) ( 9.12) ( 7.70) (20.66) (21.29) (15.83)
DP-AZL 7.71 16.27 8.53 8.81 7.53 19.71 20.52 15.32( 8.22) (17.97) ( 9.01) ( 9.16) ( 8.02) (21.09) (21.46) (16.78)
ZD-ZL 2.81 6.37 3.74 4.04 2.73 9.91 10.59 5.95( 0.10) ( 0.82) ( 1.41) ( 1.92) ( 0.10) ( 8.06) ( 9.33) ( 0.76)
ZD-AZL 3.10 6.95 4.07 4.36 3.01 10.58 11.22 6.51( 0.42) ( 2.40) ( 1.97) ( 2.52) ( 0.40) ( 9.56) (10.60) ( 2.20)
Panel B. Results using after-interest marginal tax rates
DP-ZL 7.07 14.46 7.83 7.99 6.89 17.55 18.03 13.59( 7.38) (16.04) ( 8.51) ( 8.67) ( 7.12) (19.80) (20.14) (14.73)
DP-AZL 7.08 14.79 7.79 7.91 6.92 17.83 18.21 13.94( 7.67) (16.85) ( 8.57) ( 8.65) ( 7.43) (20.21) (20.48) (15.60)
ZD-ZL 2.00 4.68 2.57 2.62 1.94 7.04 7.06 4.37( 0.00) ( 0.00) ( 0.12) ( 0.16) ( 0.00) ( 0.58) ( 0.70) ( 0.00)
ZD-AZL 2.17 4.98 2.76 2.80 2.10 7.33 7.36 4.66( 0.00) ( 0.00) ( 0.14) ( 0.17) ( 0.00) ( 0.65) ( 0.78) ( 0.00)

The Mystery of Zero-Leverage Firms 35
Table V: Low-Leverage and Zero-Leverage Puzzles
This table reports means and medians of leverage ratios for the total sample, thesample excluding zero-leverage firms and excluding almost zero-leverage firms. Re-sults for the 1962–2009 and 1987–2009 periods are given in Panel A and Panel B,respectively. Columns 1 and 2 report market leverage and Columns 3 and 4 bookleverage. For consistency, in Columns 1 and 2, AZL firms are defined by marketleverage not exceeding 5%, while in Columns 3 and 4 they are defined by bookleverage not exceeding 5%.
Market Leverage Book Leverage
mean median mean median
Panel A: Period 1962–2009
All Firms 27.5 20.9 25.2 21.9Excluding ZL Firms 30.7 25.1 28.2 24.8Excluding AZL Firms 36.8 31.8 32.3 28.2
Panel B: Period 1987–2009
All Firms 24.7 16.4 24.7 19.8Excluding ZL Firms 28.6 21.7 28.5 24.3Excluding AZL Firms 36.0 30.1 33.9 29.1

The Mystery of Zero-Leverage Firms 36
Table VI: Persistence of Zero Leverage
This table reports the persistence of ZL and AZL policies. The persistence measure for ZL policy
is defined as PerZLk = 1|Ak|
∑
i∈Ak
sPerZLi,k
sZLi,k
, where Ak is the set of firms with at least one k-year
sequence of observations that begins with a ZL observation, sZLi,k is the number of k-year sequences
for firm i that begin with a ZL observation, and sPerZLi,k is the number of k-year sequences for firm i
that are all ZL observations. The persistence of AZL policy is similarly defined. Column 1 gives thenumber of consecutive years k in consideration. Columns 2 and 3 report the persistence measure(in percentage points) of the ZL policy for the Compustat sample and the Monte Carlo (MC)simulated economy. The reported benchmark measure is the average over 500 MC simulations.Column 4 reports the t-statistics of the persistence measure for Compustat sample obtained fromthe MC simulation. Columns 5 and 6 report the (average) number of firms in the set Ak for eachgiven k. Columns 7 to 11 report the same measures for AZL firms.
ZL Behavior AZL Behavior
Persistence No. of Firms Persistence No. of Firms
k Empirical MC t-stat Empirical MC Empirical MC t-stat Empirical MC
1 100.0 100.0 4,146 8,077 100.0 100.0 7,323 10,9572 60.9 9.3 236.6 3,627 7,194 63.9 20.3 184.5 6,588 9,8353 45.0 1.5 418.8 3,190 6,388 49.1 5.9 270.7 5,809 8,7724 35.8 0.5 424.3 2,804 5,670 40.4 2.3 300.9 5,160 7,8145 30.0 0.3 373.2 2,452 5,049 34.5 1.4 274.3 4,571 6,9916 24.7 0.3 311.5 2,124 4,504 29.3 1.0 250.8 4,021 6,2787 21.4 0.2 280.8 1,885 4,032 25.9 0.8 248.8 3,573 5,6698 18.1 0.2 223.3 1,659 3,618 23.0 0.7 195.3 3,201 5,1429 16.7 0.2 206.2 1,483 3,251 21.5 0.7 187.5 2,900 4,66710 14.8 0.3 145.5 1,309 2,915 19.6 0.9 136.2 2,609 4,21615 8.2 0.3 64.5 687 1,662 12.5 0.8 67.6 1,408 2,46120 5.2 0.1 41.5 385 982 8.5 0.4 48.1 776 1479

The Mystery of Zero-Leverage Firms 37
Table VII: Zero Leverage and Industries
This table reports the distribution of ZL/AZL firms in major industries as defined by the Fama-French 12-industry classification scheme. Columns 1 and 2 report the average fractions (in per-cent) of zero-leverage and almost zero-leverage observations in a given sector over the 1962–2009period, with equal weights assigned to each year. Column 3 gives the average number of firms ineach year in a sector. Columns 4 to 6 report the same results for the 1987–2009 period.
1962–2009 1987–2009
ZL AZL N ZL AZL N
Consumer NonDurables 8.7 18.3 308 9.1 19.1 298Consumer Durables 8.0 17.3 126 8.8 18.4 134Manufacturing 6.8 15.6 585 7.4 17.6 578Energy 6.7 13.3 172 8.1 15.2 200Chemicals 7.2 17.9 106 5.2 14.8 117Technology 15.0 32.0 599 23.9 46.6 917Telecom 4.3 9.4 103 4.8 12.4 157Shops 6.9 15.5 477 9.1 20.3 570Healthcare 13.1 30.2 298 19.0 38.3 502Other 9.6 19.4 509 11.7 23.2 657All 10.2 21.5 3282 13.6 27.8 4129

The Mystery of Zero-Leverage Firms 38
Table VIII: Zero Leverage and CEO Stock Ownership
This table reports the relationship between ZL/AZL policy and CEO stock ownership. In PanelA (B), all firm-years (firms) are ranked by CEO stock ownership. Columns ZL and AZL showthe fraction of firm-years (firms) with zero debt. In Panel B, for each firm, time-series average ofits CEO stock ownership is used.
Panel A. ZL/AZL Policy and CEO Stock Ownership: Firm-Years
N Firm-yearswith LargestCEO StockOwnership
CEO StockOwnership
(%)ZL (%) AZL (%)
50 50.8 44.0 58.0100 44.9 36.0 60.0200 38.5 29.5 50.0500 29.0 26.0 47.61000 21.2 21.9 43.42000 13.8 20.5 38.25000 6.4 14.9 29.3
All (13,446) 2.5 11.7 23.3
Panel B. ZL/AZL Policy and CEO Stock Ownership: Firms
N Firms withlargest CEO
Stock Ownership
Avg. CEOStock
Ownership(%)
ZL (%) AZL (%)
10 43.5 33.3 60.720 38.8 28.9 52.730 35.0 26.0 48.940 32.5 24.1 44.250 30.5 22.5 42.7100 24.0 20.4 40.5200 17.2 21.2 40.6500 9.4 20.0 36.61000 5.2 16.4 31.3
All (1,962) 2.8 14.1 27.1
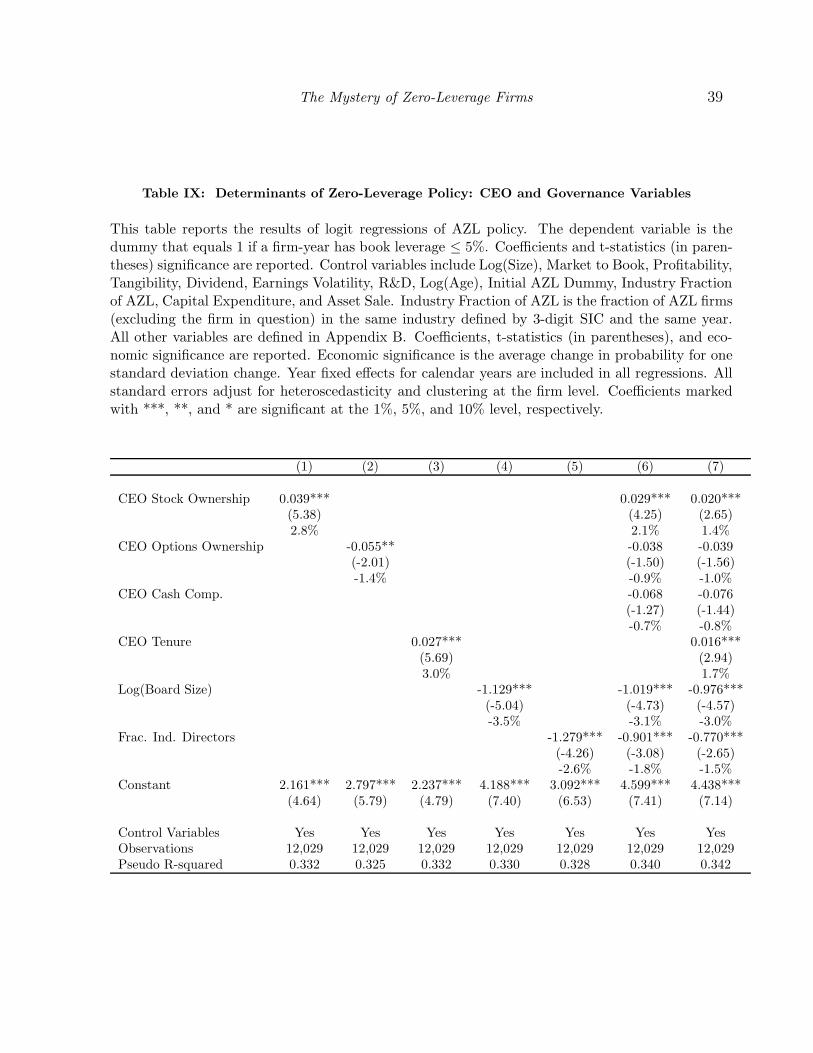
The Mystery of Zero-Leverage Firms 39
Table IX: Determinants of Zero-Leverage Policy: CEO and Governance Variables
This table reports the results of logit regressions of AZL policy. The dependent variable is thedummy that equals 1 if a firm-year has book leverage ≤ 5%. Coefficients and t-statistics (in paren-theses) significance are reported. Control variables include Log(Size), Market to Book, Profitability,Tangibility, Dividend, Earnings Volatility, R&D, Log(Age), Initial AZL Dummy, Industry Fractionof AZL, Capital Expenditure, and Asset Sale. Industry Fraction of AZL is the fraction of AZL firms(excluding the firm in question) in the same industry defined by 3-digit SIC and the same year.All other variables are defined in Appendix B. Coefficients, t-statistics (in parentheses), and eco-nomic significance are reported. Economic significance is the average change in probability for onestandard deviation change. Year fixed effects for calendar years are included in all regressions. Allstandard errors adjust for heteroscedasticity and clustering at the firm level. Coefficients markedwith ***, **, and * are significant at the 1%, 5%, and 10% level, respectively.
(1) (2) (3) (4) (5) (6) (7)
CEO Stock Ownership 0.039*** 0.029*** 0.020***(5.38) (4.25) (2.65)2.8% 2.1% 1.4%
CEO Options Ownership -0.055** -0.038 -0.039(-2.01) (-1.50) (-1.56)-1.4% -0.9% -1.0%
CEO Cash Comp. -0.068 -0.076(-1.27) (-1.44)-0.7% -0.8%
CEO Tenure 0.027*** 0.016***(5.69) (2.94)3.0% 1.7%
Log(Board Size) -1.129*** -1.019*** -0.976***(-5.04) (-4.73) (-4.57)-3.5% -3.1% -3.0%
Frac. Ind. Directors -1.279*** -0.901*** -0.770***(-4.26) (-3.08) (-2.65)-2.6% -1.8% -1.5%
Constant 2.161*** 2.797*** 2.237*** 4.188*** 3.092*** 4.599*** 4.438***(4.64) (5.79) (4.79) (7.40) (6.53) (7.41) (7.14)
Control Variables Yes Yes Yes Yes Yes Yes YesObservations 12,029 12,029 12,029 12,029 12,029 12,029 12,029Pseudo R-squared 0.332 0.325 0.332 0.330 0.328 0.340 0.342

The Mystery of Zero-Leverage Firms 40
Table X: Determinants of Zero-Leverage Policy: Interactions of CEO and GovernanceVariables
This table reports the results of logit regressions of AZL policy. The dependent variable is thedummy that equals 1 if a firm-year has book leverage ≤ 5%. Small (Large) Board Dummy is 1 ifthe board size is below (above) the sample median and 0 otherwise. Low (High) Board Indepen-dence dummy is 1 if the fraction of independent directors is below (above) the sample median and0 otherwise. Control variables include Log(Size), Market to Book, Profitability, Tangibility, Divi-dend, Earnings Volatility, R&D, Log(Age), Initial AZL Dummy, Industry Fraction of AZL, CapitalExpenditure, and Asset Sale. Industry Fraction of AZL is the fraction of AZL firms (excludingthe firm in question) in the same industry defined by 3-digit SIC and the same year. All othervariables are defined in Appendix B. Coefficients and t-statistics (in parentheses) are reported.Year fixed effects for calendar years are included in all regressions. All standard errors adjust forheteroscedasticity and clustering at the firm level. Coefficients marked with ***, **, and * aresignificant at the 1%, 5%, and 10% level, respectively.
(1) (2) (3) (4) (5) (6)
CEO Stock Ownership 0.029*** 0.026***× Small Board Dummy (3.41) (3.02)
CEO Stock Ownership -0.000 0.010× Large Board Dummy (-0.02) (0.73)
CEO Tenure 0.021*** 0.021***× Small Board Dummy (3.59) (3.40)
CEO Tenure -0.003 0.001× Large Board Dummy (-0.27) (0.08)
CEO Stock Ownership 0.030*** 0.026***× Low Board Indep. (3.50) (2.94)
CEO Stock Ownership 0.005 0.014× High Board Indep. (0.43) (1.03)
CEO Tenure 0.024*** 0.023***× Low Board Indep. (4.10) (3.86)
CEO Tenure 0.002 0.005× High Board Indep. (0.29) (0.53)
CEO Stock Ownership 0.024*** 0.023***(2.99) (2.95)
CEO Tenure 0.016*** 0.017***(3.06) (3.13)
Large Board Dummy -0.314** -0.127 -0.131 -0.385*** -0.397*** -0.394***(-2.55) (-0.81) (-0.83) (-3.32) (-3.41) (-3.38)
High Board Independence -0.179* -0.183** -0.182** -0.120 0.054 0.050(-1.93) (-1.98) (-1.97) (-1.24) (0.41) (0.38)
Constant 1.834*** 1.802*** 1.809*** 1.820*** 1.732*** 1.741***(3.95) (3.86) (3.89) (3.90) (3.71) (3.72)
Control Variables Yes Yes Yes Yes Yes YesObservations 12,038 12,038 12,038 12,038 12,038 12,038Pseudo R-squared 0.338 0.339 0.339 0.338 0.339 0.339

The Mystery of Zero-Leverage Firms 41
Table XI: Zero-Leverage Policy and Family Firms
This table reports the results of logit regressions of AZL policy. The sample includes all observa-tions over the period 2003–2006 for which CEO, governance, and family firm variables are available.The dependent variable is the dummy that equals 1 if a firm-year has book leverage ≤ 5%. Controlvariables include Log(Size), Market to Book, Profitability, Tangibility, Dividend, Earnings Volatil-ity, R&D, Log(Age), Initial AZL Dummy, Industry Fraction of AZL, Capital Expenditure, andAsset Sale. Industry Fraction of AZL is the fraction of AZL firms (excluding the firm in question)in the same industry defined by 3-digit SIC and the same year. All other variables are definedin Appendix B. Coefficients, t-statistics (in parentheses), and economic significance are reported.Economic significance is the average change in probability for one standard deviation change for acontinuous independent variable, or for the change from 0 to 1 for a dummy variable. Year fixedeffects for calendar years are included in all regressions. All standard errors adjust for heteroskedas-ticity and clustering at the firm level. Coefficients marked with ***, **, and * are significant atthe 1%, 5%, and 10% level, respectively.
(1) (2) (3) (4) (5)
CEO Stock Ownership 0.025** 0.020*(2.21) (1.88)1.9% 1.5%
CEO Options Ownership -0.011(-0.44)-0.3%
CEO Cash Comp. 0.044(0.50)0.5%
CEO Tenure 0.018**(2.29)2.1%
Log(Board Size) -1.446*** -1.376***(-4.14) (-3.95)-4.4% -4.2%
Frac. Ind. Directors -0.582 -0.461(-1.25) (-0.99)-1.1% -0.8%
Family Firm Dummy 0.534*** 0.460*** 0.651*** 0.581*** 0.537***(3.43) (2.92) (4.35) (3.82) (3.41)6.8% 5.8% 8.2% 7.4% 6.7%
Constant 2.918*** 2.170*** 4.364*** 2.639*** 5.172***(3.96) (3.26) (5.04) (3.70) (5.02)
Control Variables Yes Yes Yes Yes YesObservations 3,364 3,364 3,364 3,364 3,364Pseudo R-squared 0.321 0.322 0.326 0.318 0.329


![Dif In Dif Slides.ppt [Repaired] - Finance Departmentfinance.wharton.upenn.edu/~mrrobert/resources/Teaching/CorpFinPhD/... · Average Leverage for Delaware firms in 1992 Average Leverage](https://img.pdfslide.net/doc/110x75/5aa4909e7f8b9a517d8c15e0/dif-in-dif-repaired-finance-departmentfinancewhartonupennedumrrobertresourcesteachingcorpfinphdaverage.jpg)