Embed Size (px)
Citation preview
The Namibia Flood Dashboard Satellite Acquisition and Data Availability through the Namibia Flood Dashboard
Matt HandyNASA Goddard Space Flight Center
NOAA Satellite - April 11, 2013 - College Park MD

The Problem
•Severe flooding in Namibia (south-western Africa) with little warning
•Existing flood warning models are not very precise
- Advance warning would reduce loss of life and property
•NASA’s EO-1 mission & research stakeholders want to test the application of SensorWebs in a decision support tool for disaster management
•United Nations coordinated a partnership between stakeholders
2
Introduction
•What is a SensorWeb?• Takes disparate data feeds and unites them in cohesive display
• Used to make analyzing and responding to large datasets easier
• Area of research to EO-1 team for use in analysis of image products
• Namibia Flood Dashboard is an example of a SensorWeb, and represents an extension of a decade of EO-1 research
•Project Objectives• Aggregate information sources –> better situational awareness / decision making
• Integrate and compare data feeds -> enhanced analysis capability
• Disseminate information -> wider availability of data products and analysis
• Rapid configuration and deployment-> software can be rapidly applied to diverse situations
3
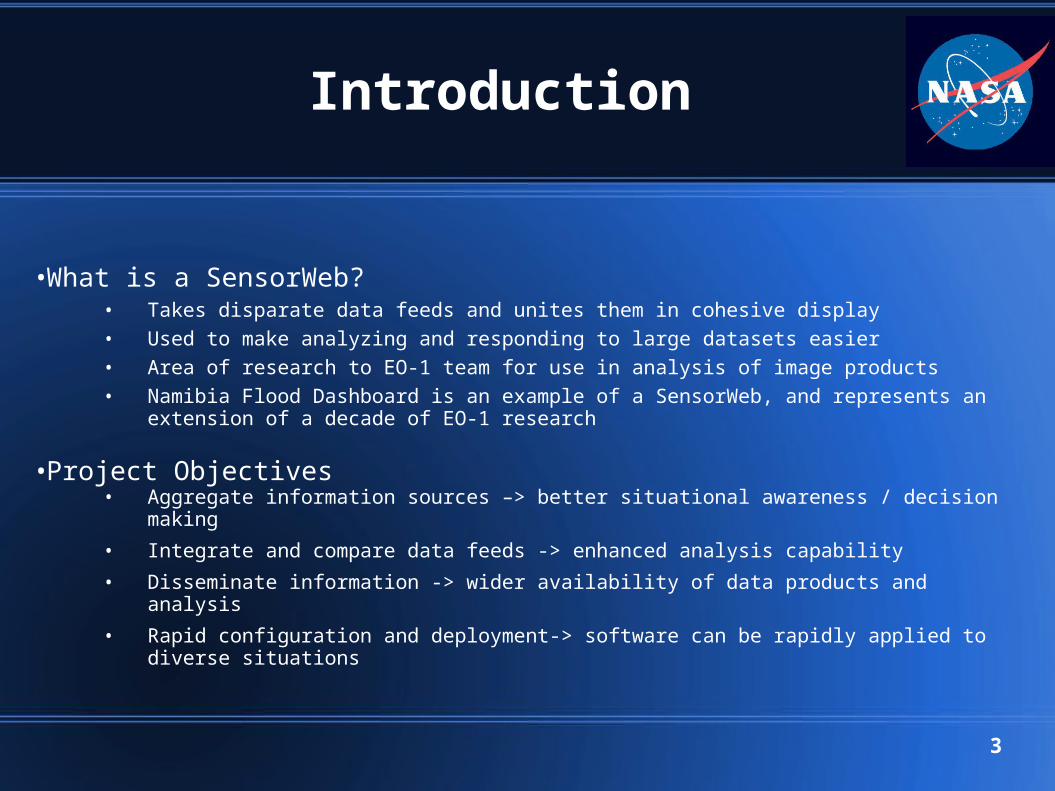
Architecture
4
The Cloud
OCC MATSU Cloud (Chicago)
The Flood Dashboard Instance (primary – runs services)
(Virtual Machine)
Cloud – Attached Storage 120+ TB
Flood Dashboard Layers & Data Sources
“Hot Copy” of EO-1 Data Products
The Flood Dashboard Instance (secondary 1 of n – serves data only)
(Virtual Machine)
Dependent Services (Web Coverage Processing Service)
(Virtual Machine)
FTP Data Ingest
HTTP Proxy InternetUsers
EO-1 Image Upload
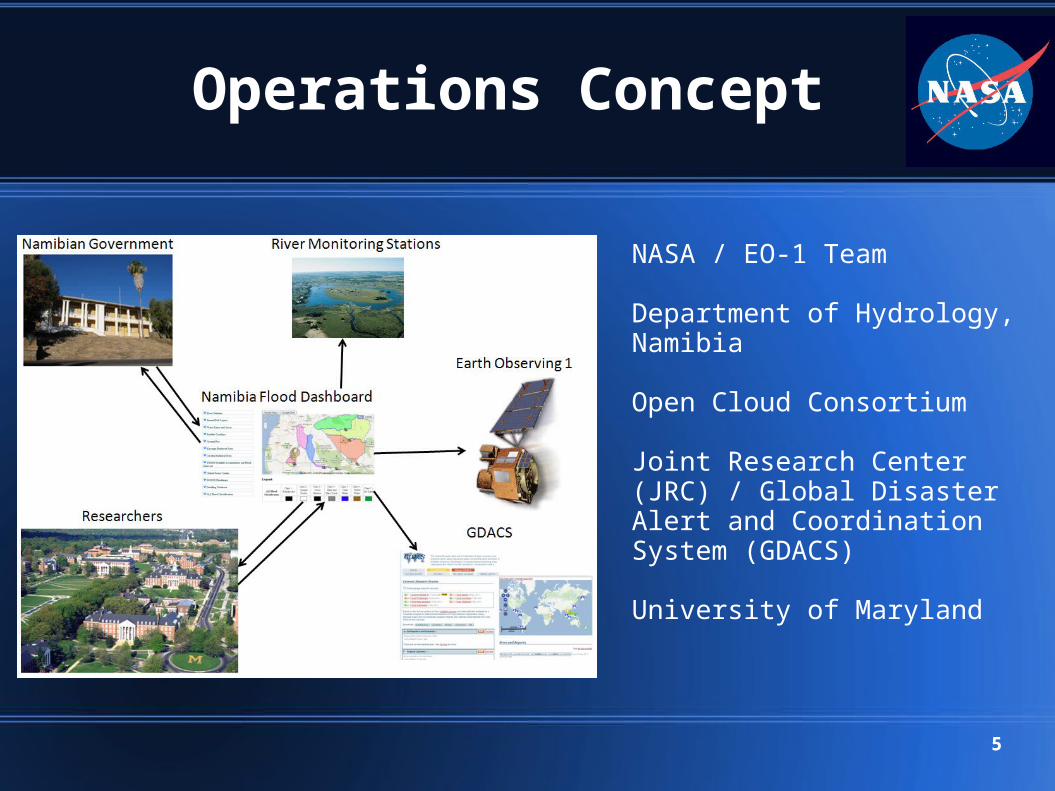
Operations Concept
5
NASA / EO-1 Team
Department of Hydrology, Namibia
Open Cloud Consortium
Joint Research Center (JRC) / Global Disaster Alert and Coordination System (GDACS)
University of Maryland
Tool Overview
• Bulletin System (current and archive)
• Google Maps/Earth powered geospatial data display
• River gauge station graphing and comparison
• Automated EO-1 Tasking (plans for more spacecraft)
6

Geospatial Display(The Big Map)
7
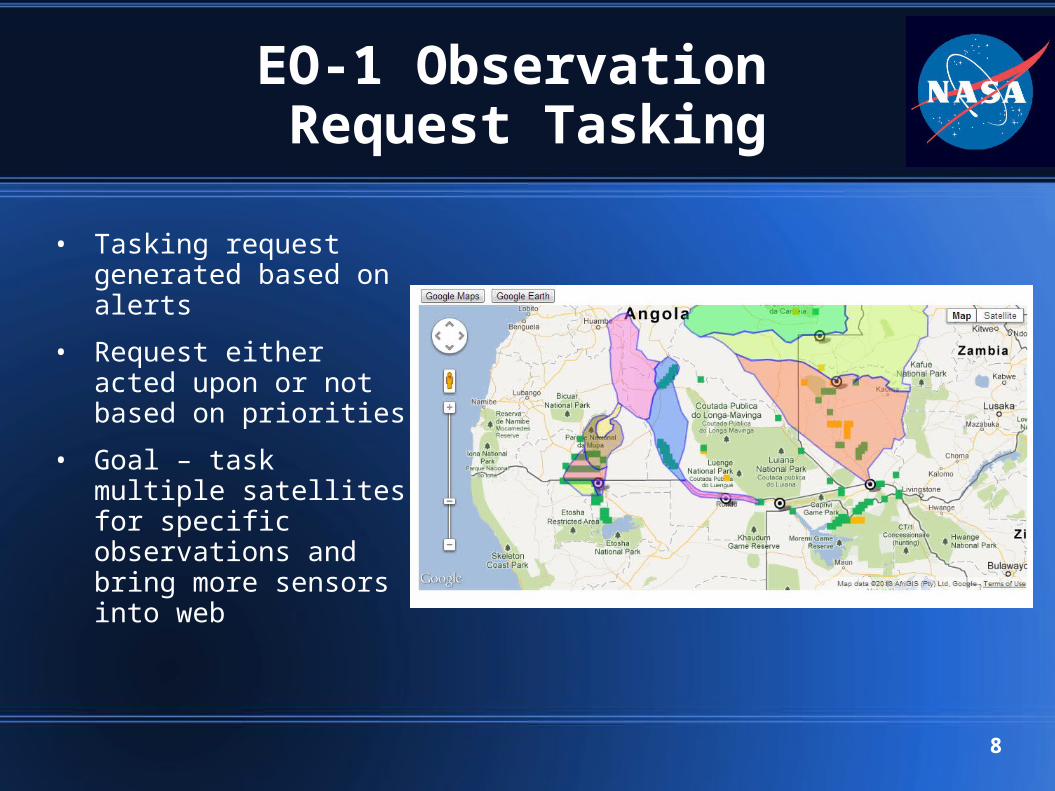
EO-1 Observation Request Tasking
8
• Tasking request generated based on alerts
• Request either acted upon or not based on priorities
• Goal – task multiple satellites for specific observations and bring more sensors into web
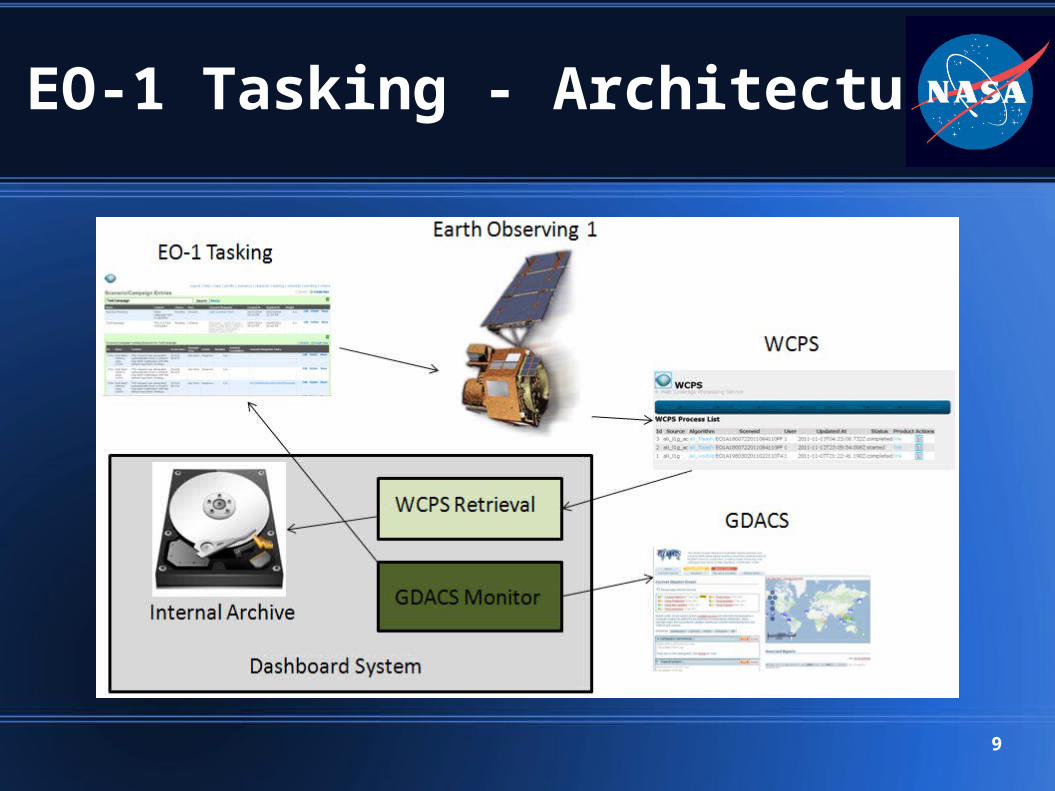
EO-1 Tasking - Architecture
9
Tool Capabilities
• Automated EO-1 Tasking
• Rapid delivery of technical information through bulletins
• Access to EO-1 Advanced Land Imager (ALI) data products
• Access to other satellite data products
• Correlation with infrastructure details
• Graphing and comparison of river levels
• Plans to allow even more powerful comparisons, such as retrieval of satellite products based on ground data comparison
10

River Gauge StationsStart with manual “Yardstick Measurements”
11
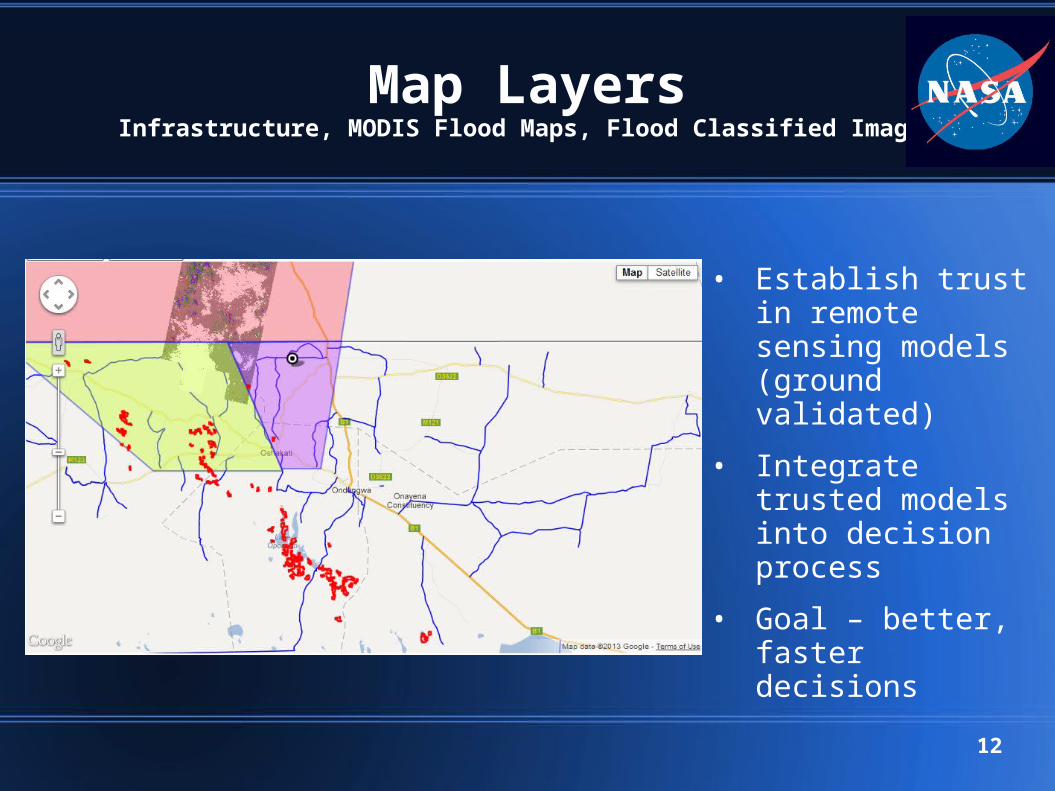
Map LayersInfrastructure, MODIS Flood Maps, Flood Classified Images
12
• Establish trust in remote sensing models (ground validated)
• Integrate trusted models into decision process
• Goal – better, faster decisions

Area of Study:Reeds & Flooded Region
13
• Determining flooded area is complicated by vegetation
• Satellite sensors may do better job than visual spot-checks
• Ground validation used to refine models
Future Plans
• Enable direct daily uplink of river levels
• Add hydrograph to satellite cross-indexing of data products
• Add Open Street Map (OSM) layer display to supplement Google Maps / Earth
• Add Tropical Rainforest Measuring Mission (TRMM) Precipitation Accumulation Calculator
• (Stretch goal) Direct social impact• i.e. – tracking and response to hippo attacks
14

Summary
• Dashboards for SensorWebs allow flexibility and rapid integration
• Cloud technology allows huge datasets, rapid processing, and improved reliability
• SensorWebs will continue to improve satellite tasking
• Global benefit for many remote sensing applications
15
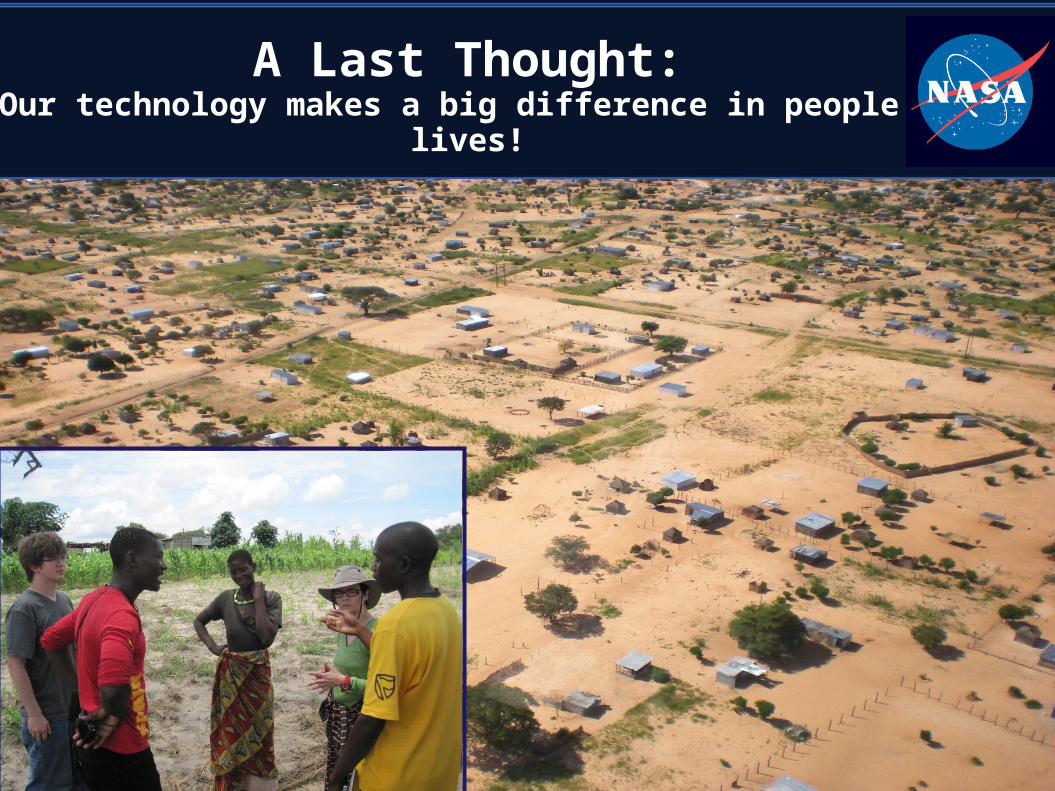
A Last Thought:Our technology makes a big difference in people’s lives!
16


![Namibia Social Statistics - d3rp5jatom3eyn.cloudfront.net · Namibia statistics Agency - Eu] ]^} ]o^ îìíìrîìíð3 Namibia Social Statistics 2010 - 2014 Published by the Namibia](https://img.pdfslide.net/doc/110x75/5d18f48888c993495f8bc54d/namibia-social-statistics-namibia-statistics-agency-eu-o-iiiiriiid3.jpg)