Embed Size (px)
Citation preview

Judgment and Decision Making, Vol. 10, No. 3, May 2015, pp. 241–264
The narrative bias revisited: What drives the biasing influence of
narrative information on risk perceptions?
Cornelia Betsch∗† Niels Haase† ‡ Frank Renkewitz† ‡ Philipp Schmid†
Abstract
When people judge risk or the probability of a risky prospect, single case narratives can bias judgments when a statistical
base-rate is also provided. In this work we investigate various methodological and procedural factors that may influence
this narrative bias. We found that narratives had the strongest effect on a non-numerical risk measure, which was also
the best predictor of behavioral intentions. In contrast, two scales for subjective probability reflected primarily statistical
variations. We observed a negativity bias on the risk measure, such that the narratives increased rather than decreased
risk perceptions, whereas the effect on probability judgments was symmetric. Additionally, we found no evidence that
the narrative bias is solely produced by adherence to conversational norms. Finally, changing the absolute number of
narratives reporting the focal event, while keeping their relative frequency constant, had no effect. Thus, individuals
extract a representation of likelihood from a sample of single-case narratives, which drives the bias. These results show
that the narrative bias is in part dependent on the measure used to assess it and underline the conceptual distinction between
subjective probability and perceived risk.
Keywords: risk perception, subjective probability, narratives, cognitive bias, negativity bias.
1 Introduction
Every day we encounter and act upon probabilistic infor-
mation. From the weather forecast to consumer reports,
individuals are regularly confronted with likelihood infor-
mation about risks (e.g., the chance of rain) to inform their
behavior in one way or another (e.g., whether to leave the
house with or without an umbrella). In the medical do-
main, the advent of the modern shared decision making
approach means that patients are increasingly involved in
treatment and preventative decisions such as choosing be-
tween bypass surgery and angioplasty or deciding for or
against vaccinations. All such decisions involve collect-
ing, processing, and weighing probabilistic information.
As a result, individual risk perception about medical mat-
ters has have been a recent focus of research.
At least 40 years of psychological research have pro-
Cornelia Betsch and Niels Haase contributed equally to this paper.
This research was financed by a research grant from the German Re-
search Foundation (BE 3970/4-1) to the first and third authors. The au-
thors are grateful to Alexandra Schmitterer for her help in conducting the
study as well as to Heather Fuchs, Jonathan Baron, Edward Cokely, Gary
Brase and one anonymous reviewer for helpful comments on a previous
draft of this article.
Copyright: © 2015. The authors license this article under the terms of
the Creative Commons Attribution 3.0 License.∗Center for Empirical Research in Economics and Behavioral Sci-
ences (CEREB), University of Erfurt, Nordhaeuser Strasse 63, 99089
Erfurt, Germany. Email: [email protected]†Department of Psychology, University of Erfurt‡CEREB, University of Erfurt
duced an extensive catalog of situations in which likeli-
hood estimates deviate from the prescriptions of proba-
bility theory (see Gilovich, Griffin, & Kahneman, 2002
for an overview). One such bias is the excessive influ-
ence of narrative information, exemplars, and testimonies,
which we refer to as narrative bias. In a classic exam-
ple, Borgida and Nisbett (1977) found that a few brief
personal accounts had a far stronger impact on students’
course choices than mean course evaluations. Such rea-
soning is considered to be biased, i.e., formally incorrect,
because it fails to weigh different samples of data accord-
ing to the respective sample size.
1.1 Assessing the narrative bias
One difficulty in understanding the mechanisms behind
the narrative bias and in coherently summarizing findings
lies in the different measures used to assess the influ-
ence of narrative information. Dependent variables vary
from subjective probability to perceived risk or actual de-
cisions (Betsch, Renkewitz, & Haase, 2013; Betsch, Ul-
shöfer, Renkewitz, & Betsch, 2011; Fagerlin, Wang, &
Ubel, 2005; Obrecht, Chapman, & Gelman, 2009).
Researchers on biases in risk perception commonly col-
lect some sort of magnitude judgment regarding the likeli-
hood of a specified event (e.g., de Wit, Das, & Vet, 2008;
Knapp, Gardner, Raynor, Woolf, & McMillan, 2010; Lee,
Schwarz, Taubman, & Hou, 2010). However, even the
most parsimonious, and also most common, definition of
perceived risk (following expected value theory) addition-
241

Judgment and Decision Making, Vol. 10, No. 3, May 2015 How narratives bias risk perceptions 242
ally includes a value dimension, i.e., the significance or
severity of a loss. Other concepts include the affective re-
action to an outcome, the perceived source of a risk, the
susceptibility to a risk, and degree of belief. Further, the
voluntariness of risk, the knowledge about, and control
over risk can also play a role in risk judgments (Brewer et
al., 2007; Eiser, 1994; Gardoni & Murphy, 2013; Loewen-
stein, Weber, Hsee, & Welch, 2001; Slovic, Finucane, Pe-
ters, & MacGregor, 2004; Slovic, Fischhoff, & Lichten-
stein, 1979; see Brun, 1994 for a comprehensive discus-
sion of this topic). Thus, it seems prudent to distinguish
between subjective probability and perceived risk.
In addition, although subjective probability and per-
ceived risk are central variables in many studies, there is
no consensus regarding their measurement. Methods in-
clude inferences from bets (Beach & Phillips, 1967), balls
and bins tasks (Goldstein & Rothschild, 2014), risk matri-
ces (Ball & Watt, 2013), and various self-report formats.
The latter typically elicit a type of magnitude judgment
and include numeric estimates, rating scales, and visual
analog scales. One goal of this paper is to compare nar-
rative biases across different measures used in previous
research (Betsch et al., 2013, 2011; Obrecht et al., 2009).
1.2 Theoretical accounts
Theoretical accounts of the highly persuasive effect of nar-
rative evidence vary in focus and scope. Some explana-
tions focus on the content of the narrative itself, which
elicits affective reactions and immersion (see Hinyard &
Kreuter, 2007 for an overview). Indeed, findings from
previous research have shown that highly emotional nar-
ratives reporting vaccine adverse events increase the per-
ceived risk of vaccination compared to less emotional nar-
ratives (Betsch et al., 2011). However, other findings
show that the narrative bias occurs even when the con-
tent of the narrative is free of emotion and contains only
the statement that the critical event occurred (Betsch et
al., 2013; Obrecht et al., 2009). In this paper, we focus
on a more formal approach that explains the narrative bias
based solely on the structure of statistical and narrative in-
formation regardless of the narratives’ qualitative content.
Previous research that presented both statistical and nar-
rative evidence to subjects has led to comparable results
but differed regarding the causal explanation put forward
by the authors. Ubel, Jepson, and Baron (2001) examined
the importance of the match between statistical and narra-
tive information and found that narratives were especially
influential when the ratio of narratives indicating success
vs. failure of a treatment was incongruent with previously
presented statistical evidence. The effect, however, disap-
peared when controlling for the absolute number of nar-
ratives. Nevertheless, this finding indicates that individ-
uals may perceive a set of narratives as a single unit of
information—comparable to statistical information—that
conveys the relative frequency of events.
Contrary to this idea, Obrecht et al. (2009) developed
the encounter frequency theory, which assumes that each
piece of information, be it a statistic or a single narrative
case, is attributed equal weight when forming a judgment.
Accordingly, individuals simply count each piece of in-
formation indicating the (non)occurrence of an event. En-
counter frequency theory does not specify the process of
how positive and negative counts are integrated. However,
this account suggests that changing the absolute number of
narratives reporting the occurrence of a focal event while
keeping their relative proportion constant will affect judg-
ments or decisions. A similar notion can be found in
research on the ratio-bias or denominator neglect—i.e.,
the phenomenon that individuals tend to prefer a gamble
with a 9
100likelihood of winning over a gamble with a 1
10
likelihood, because they tend to ignore the denominator
(Denes-Raj & Epstein, 1994; Reyna & Brainerd, 2008).
Thus, the second goal of this paper is to clarify whether
the narrative bias relies on the relative or absolute number
of narratives reporting the critical event.
1.3 Negativity bias
There is some evidence that individuals tend to weigh in-
formation regarding the presence of a risk more strongly
than information concerning its absence (Baumeister,
Bratslavsky, Finkenauer, & Vohs, 2001; Rozin & Royz-
man, 2001; Siegrist & Cvetkovich, 2001). This negativ-
ity bias means that narratives may have an asymmetric ef-
fect. Narratives implying a higher risk than the provided
statistical information would have a stronger influence on
risk perceptions than narratives implying a lower risk than
the statistical information. Therefore, a third goal is to
test whether narratives can both increase and decrease risk
perceptions, relative to the perception resulting from the
statistical information alone.
1.4 Experimental artifact
We also strive to test the narrative bias against two poten-
tial and related alternative explanations that are inherent
in the experimental procedure. First, it is possible that the
narrative bias occurs simply because subjects follow con-
versational norms. That is, as experimenters we assume
that the statistical information is the most or even only rel-
evant information for the judgment. We expect individuals
to attribute less weight to or even ignore the less reliable
narrative information. However, Grice (1975) argues that
conversation follows certain norms of cooperation, one of
which states that communicated information is to be rele-
vant. Thus, from the subjects’ point of view, all informa-

Judgment and Decision Making, Vol. 10, No. 3, May 2015 How narratives bias risk perceptions 243
tion provided by the experimenter may appear relevant for
judgment due to the simple fact that it has been provided.
Second, in most studies comparing the influence of sta-
tistical and individuating information, statistical informa-
tion is presented first followed by individuating informa-
tion. Thus, it is possible that the narrative bias is at least
partially caused by a recency effect. Expanding on the
idea of conversational norms, Krosnick, Li, and Lehman
(1990) argue that more informative and thus more impor-
tant information is typically provided last, especially when
two contradictory pieces of information are presented. Ac-
cordingly, subjects may assume that the experimenter con-
siders the second piece of information, i.e., the narrative
information, to be more important and that they should, in
turn, do the same when making a judgment.
Finally, and related to this, we will investigate whether
subjects would seek the narrative information at all if it
were not provided. The act of seeking more information
when sound statistical evidence is already available results
in added costs to the individual—at least in terms of time.
From a homo oeconomicus point of view, statistics pro-
vide the necessary likelihood information to quickly make
a decision and should, therefore, be preferred over the time
consuming evaluation of narrative reports.
1.5 Summary of research questions and
overview
Perceived risk and subjective probability are conceptually
different; and there is no consensus on how to measure ei-
ther one. Previous research has studied the narrative bias
effect on both subjective probability, assessed either as
percent estimates or by rating scales, and perceived risk
measured using a visual analog scale. Experiment 1 asks
whether the narrative bias is dependent on the task. Specif-
ically:
RQ1: Do narratives and statistical information have dif-
ferent relative effects on a numeric and a verbal measure
of subjective probability and a visual analog scale measure
of perceived risk?
In previous studies, the relative frequency of the criti-
cal event as implied by the narratives typically exceeded
that given by the statistical information, which led to an
increase in perceived risk (Betsch et al., 2013, 2011).
Research on the negativity bias (Siegrist & Cvetkovich,
2001) suggests that narratives may have an asymmetrical
influence on risk perceptions such that they will have a
greater impact when they exceed rather than fall below
statistical risk information. Experiment 1 will therefore
address the following research question:
RQ2: Is the narrative bias symmetric or asymmetric?
The same number of narratives indicating the occur-
rence of an event will lead to different risk perceptions if
we assume that the relative rather than absolute frequency
influences risk perceptions. Therefore, in Experiment 2,
we strive to answer the question:
RQ3: Is the narrative bias caused by the relative or ab-
solute number of narratives reporting the focal event?
Experiment 2 also explores questions related to the ex-
perimental procedure aimed to rule out the possibility that
the narrative bias is an experimental artifact:
RQ4: Is the narrative bias partially an artifact produced
by conversational norms in that the narratives have to
be encoded and therefore appear to be relevant for judg-
ments?
RQ5: Is the narrative bias partially caused by a recency
effect when narratives appear after the statistical informa-
tion?
RQ6: Is narrative information an attractive source of
information when statistical information about a risk is al-
ready provided?
For the experiment content domain, we use vaccination
risks. The example of vaccination risks seems particularly
relevant in this context for two reasons: a growing number
of individuals facing health related decision consult the In-
ternet for information (Fox & Duggan, 2013); and narra-
tive evidence is a common feature on anti-vaccination ac-
tivist websites that propagate alleged adverse events and
high risks of vaccination (Betsch et al., 2012; Haase &
Betsch, 2012; Kata, 2010, 2012). In both experiments,
subjects receive statistical and narrative information about
the occurrence of vaccine-adverse events (VAE). They
then judge the riskiness of the vaccination as well as the
subjective probability of VAE.
2 Experiment 1
In this experiment, we compared the effect of the narrative
bias on three related measures. We asked for a percent es-
timate of the likelihood of VAE. Only numeric measures
allow for a meaningful quantification of the narrative bias;
and this format has been shown to be the least context de-
pendent and less error-prone than judgments of relative
frequency (Haase, Renkewitz, & Betsch, 2013; Weinstein
& Diefenbach, 1997). As a second measure of subjec-
tive probability, we included a verbally labeled 7-point
rating scale in order to retain comparability with previous
studies (Betsch et al., 2011). Further, this 7-point rating
scale has been shown to be superior in behavior predic-
tion as compared to a percent measure (Weinstein et al.,
2007). We will therefore explore whether we find compa-
rable results regarding vaccination intentions. Finally, we
assessed perceived risk by means of a visual analog scale.
Since subjective probability and perceived risk are distinct
constructs, we assessed all dependent variables for every
subject and varied the order of assessment between sub-
jects. In our analyses of the narrative bias, we examined

Judgment and Decision Making, Vol. 10, No. 3, May 2015 How narratives bias risk perceptions 244
only the first measure completed by each subject in order
to exclude carry-over effects.
Because we differentiate between subjective probability
and perceived risk, and definitions of risk typically include
a value dimension, we additionally assessed the perceived
severity of VAE. We also assessed the intention to get vac-
cinated in order to compare the different measures in terms
of behavior prediction.
2.1 Method
2.1.1 Subjects and design
A total of 290 students at the University of Erfurt (24.5%
male; MAGE = 22.16, SD = 3.159) participated in this lab-
experiment in exchange for a small gift and the chance
to win one of ten C50 notes (approx. US$67.50). Thir-
teen subjects were excluded because they had either taken
part in a similar experiment before or reported in a post-
experimental interview that they were unsure about the
handling of the scales. Thus, the final sample includes
N = 277 subjects, with n’s for individual analyses ranging
from 22 to 27.
Each subject was randomly assigned to one of 12 condi-
tions, resulting from a 2 × 2 × 3 between-subjects design
with the relative number of narratives reporting VAE as the
independent variable (1 or 8 narratives of 20, equaling 5%
and 40%), the statistical probability of VAE (5% or 40%)
as a second factor, and the first dependent variable as a
third factor (7-point rating scale, percent estimate or visual
analog scale). In addition, we assessed subjects’ numer-
acy, as previous work suggests that individuals with low
numeracy may be especially prone to biases due to nar-
rative information (Dieckmann, Slovic, & Peters, 2009;
Peters, 2008).
2.1.2 Materials and procedure
Procedure. All materials were presented on a computer
screen. Subjects were provided with information about
a fictitious severe disease (dysomeria) and the recom-
mended vaccination. This was accompanied by a statistic
reporting the likelihood of VAE occurring. Subsequently,
subjects were asked to imagine that they found additional
information about experiences with the vaccination on an
Internet bulletin board. The narratives there reported ei-
ther the occurrence (positive) or non-occurrence (nega-
tive) of VAE. Afterwards, subjects completed the depen-
dent variable measures.
Manipulation of the statistical probability of adverse
events. The statistical probability of VAE was explicitly
expressed in percent together with a pictograph, i.e., a ma-
trix of 100 elements colored in one of two ways which
indicated the presence or absence of VAE (created with
http://www.iconarray.com, last accessed on October 24,
2014). Pictographs have been shown to reduce the effect
of narrative information (Fagerlin et al., 2005). We ma-
nipulated the statistical probability of VAE (5% vs. 40%)
between conditions.
Manipulation of relative frequency of narratives re-
porting adverse events. The narratives reported either
the occurrence or non-occurrence of adverse events, with
the number of narratives reporting VAE depending on con-
dition (1 vs. 8 of 20 reports, resulting in 5% and 40%,
respectively). The narratives were approximately equal in
length (mean number of words = 57.5 and 52.2 for positive
and negative narratives, respectively). In addition, posi-
tive narratives were pretested on 9-point rating scales con-
cerning the severity of reported VAE, emotionality of con-
tent, and credibility. We selected narratives with moderate
severity and emotionality, i.e., ratings did not differ from
a midpoint rating of 5 (severity: all t’s ≤ 1.66, emotion-
ality: all t’s ≤ 1.98). The narratives were rated as equally
credible (mean ratings did not differ from a rating of 6,
all t’s ≤ 1.48). The fictional authors’ first names for all
narratives were balanced for gender. The narratives were
displayed as single cases, with one narrative per page. The
pages were displayed in random order. In order to mini-
mize any systematic influence due to additional informa-
tion in the text, e.g., concerning the vaccination procedure,
narratives were elected at random when the whole sample
was not needed. For example, in the 5% condition, one
positive narrative out of a total of eight positive narratives
(that were used in the 40% condition) was drawn for each
subject. Appendix A presents four example narratives.
Dependent variables. Table 1 provides an overview of
all dependent variables. Subjects completed all measures;
however, the order of the following measures was varied
between subjects: the subjective probability of the occur-
rence of adverse events (measured via two measures: nu-
meric estimate in percent and probability rating on a 7-
point rating scale) and the perceived risk of the vaccina-
tion (visual analog scale). For perceived risk, we used a
non-numeric format so as to avoid making the probability
dimension especially salient. However, to allow for com-
parisons with the subjective probability judgments and a
quantification of the narrative bias, the visual analog scale
provided scores between 0 and 100. No numeric feedback
was provided to subjects.
In the subjective probability conditions, subjects pro-
vided their ratings on the specific subjective probability
measure followed by the respective other measure and the
visual analog scale to assess perceived risk. In the per-
ceived risk condition, risk was assessed on the visual ana-
log scale followed by the subjective probability measures
in counterbalanced order. After all three measures were
Judgment and Decision Making, Vol. 10, No. 3, May 2015 How narratives bias risk perceptions 245
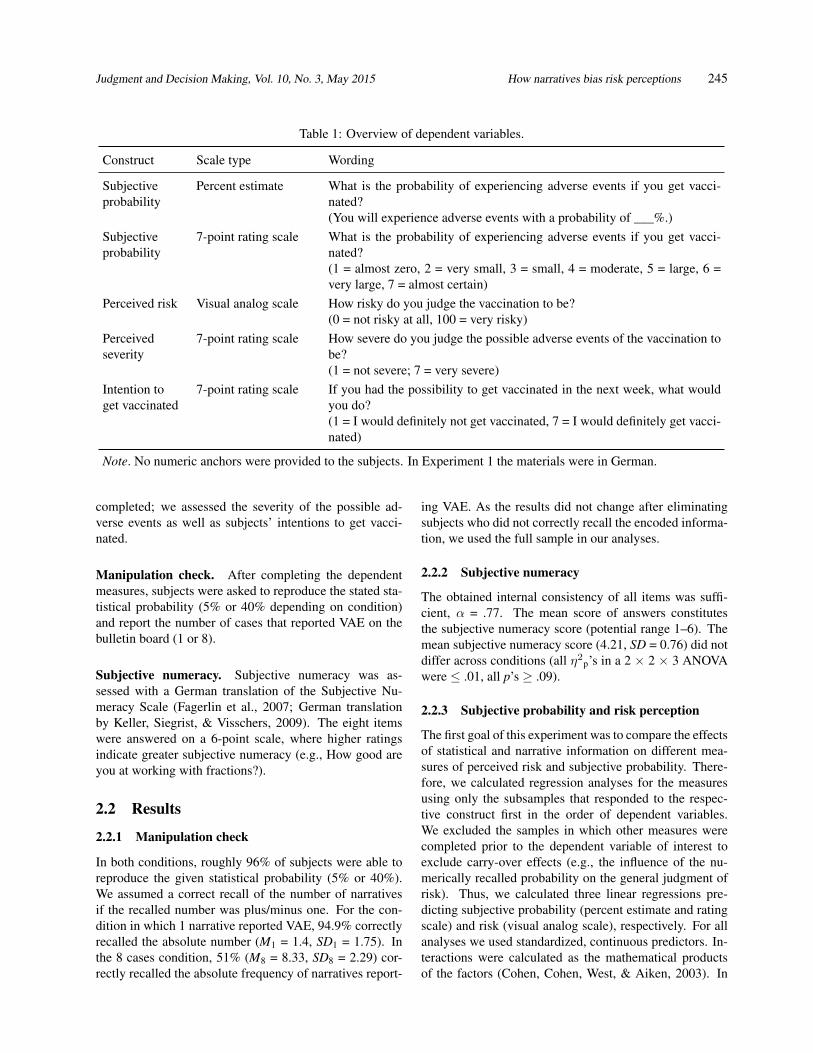
Table 1: Overview of dependent variables.
Construct Scale type Wording
Subjective
probability
Percent estimate What is the probability of experiencing adverse events if you get vacci-
nated?
(You will experience adverse events with a probability of ___%.)
Subjective
probability
7-point rating scale What is the probability of experiencing adverse events if you get vacci-
nated?
(1 = almost zero, 2 = very small, 3 = small, 4 = moderate, 5 = large, 6 =
very large, 7 = almost certain)
Perceived risk Visual analog scale How risky do you judge the vaccination to be?
(0 = not risky at all, 100 = very risky)
Perceived
severity
7-point rating scale How severe do you judge the possible adverse events of the vaccination to
be?
(1 = not severe; 7 = very severe)
Intention to
get vaccinated
7-point rating scale If you had the possibility to get vaccinated in the next week, what would
you do?
(1 = I would definitely not get vaccinated, 7 = I would definitely get vacci-
nated)
Note. No numeric anchors were provided to the subjects. In Experiment 1 the materials were in German.
completed; we assessed the severity of the possible ad-
verse events as well as subjects’ intentions to get vacci-
nated.
Manipulation check. After completing the dependent
measures, subjects were asked to reproduce the stated sta-
tistical probability (5% or 40% depending on condition)
and report the number of cases that reported VAE on the
bulletin board (1 or 8).
Subjective numeracy. Subjective numeracy was as-
sessed with a German translation of the Subjective Nu-
meracy Scale (Fagerlin et al., 2007; German translation
by Keller, Siegrist, & Visschers, 2009). The eight items
were answered on a 6-point scale, where higher ratings
indicate greater subjective numeracy (e.g., How good are
you at working with fractions?).
2.2 Results
2.2.1 Manipulation check
In both conditions, roughly 96% of subjects were able to
reproduce the given statistical probability (5% or 40%).
We assumed a correct recall of the number of narratives
if the recalled number was plus/minus one. For the con-
dition in which 1 narrative reported VAE, 94.9% correctly
recalled the absolute number (M1 = 1.4, SD1 = 1.75). In
the 8 cases condition, 51% (M8 = 8.33, SD8 = 2.29) cor-
rectly recalled the absolute frequency of narratives report-
ing VAE. As the results did not change after eliminating
subjects who did not correctly recall the encoded informa-
tion, we used the full sample in our analyses.
2.2.2 Subjective numeracy
The obtained internal consistency of all items was suffi-
cient, α = .77. The mean score of answers constitutes
the subjective numeracy score (potential range 1–6). The
mean subjective numeracy score (4.21, SD = 0.76) did not
differ across conditions (all η2p’s in a 2 × 2 × 3 ANOVA
were ≤ .01, all p’s ≥ .09).
2.2.3 Subjective probability and risk perception
The first goal of this experiment was to compare the effects
of statistical and narrative information on different mea-
sures of perceived risk and subjective probability. There-
fore, we calculated regression analyses for the measures
using only the subsamples that responded to the respec-
tive construct first in the order of dependent variables.
We excluded the samples in which other measures were
completed prior to the dependent variable of interest to
exclude carry-over effects (e.g., the influence of the nu-
merically recalled probability on the general judgment of
risk). Thus, we calculated three linear regressions pre-
dicting subjective probability (percent estimate and rating
scale) and risk (visual analog scale), respectively. For all
analyses we used standardized, continuous predictors. In-
teractions were calculated as the mathematical products
of the factors (Cohen, Cohen, West, & Aiken, 2003). In

Judgment and Decision Making, Vol. 10, No. 3, May 2015 How narratives bias risk perceptions 246
Table 2: Subjective probability (percent estimate, 7-point rating scale) and perceived risk as a function of the statistical
base-rate, relative frequency of narratives reporting VAE, and subjective numeracy (Experiment 1).
Subjective probability (percent estimate)
n = 89 β p β p
Statistical base-rate (5% vs. 40%) .81 <.001 .83 <.001
Narratives: frequency of VAE (5% vs. 40%) .15 .02 .14 .03
Statistical base-rate × narratives .00 .97 −.02 .79
Subj. numeracy −.01 .84
Subj. numeracy × statistical base-rate .10 .12
Subj. numeracy × narratives −.14 .02
Subj. numeracy × statistical base-rate × narratives −.03 .58
R2 .68 .71
Subjective probability (7-point rating scale)
n = 94 β p β p
Statistical base-rate (5% vs. 40%) .56 <.001 .55 <.001
Narratives: frequency of VAE (5% vs. 40%) .16 .07 .17 .06
Statistical base-rate × narratives .07 .43 .03 .71
Subj. numeracy .03 .75
Subj. numeracy × statistical base-rate .22 .02
Subj. numeracy × narratives .09 .30
Subj. numeracy × statistical base-rate × narratives .07 .42
R2 .35 .39
Perceived risk (visual analog scale)
n = 94 β p β p
Statistical base-rate (5% vs. 40%) .29 .002 .29 .002
Narratives: frequency of VAE (5% vs. 40%) .43 <.001 .42 <.001
Statistical base-rate × narratives −.13 .14 −.14 .14
Subj. numeracy .01 .93
Subj. numeracy × statistical base-rate .02 .85
Subj. numeracy × narratives −.03 .74
Subj. numeracy × statistical base-rate × narratives −.06 .51
R2 .29 .30
Note. Standardized betas (β) and respective p-values of significant effects are shown in boldface.
a first regression, we entered the manipulated factors and
their interaction. In a second regression, we added sub-
jective numeracy and the interactions of the factors with
subjective numeracy.1
The main results of the separate regressions are dis-
1As multiple regression can obscure relationships between variables
Appendix B presents a full correlation matrix of the independent and
dependent variables as well as numeracy.
played in Table 2. The narrative biases are displayed in
Figure 1. Both the statistical base-rate (β = .81) and the
narratives (β = .15) significantly influenced the subjective
probability of experiencing adverse events assessed as per-
cent estimate. The statistical information had a stronger
influence than the narrative information. A similar pat-
tern of effects occurred when subjective probability was
assessed by means of a 7-point rating scale (statistical

Judgment and Decision Making, Vol. 10, No. 3, May 2015 How narratives bias risk perceptions 247
Figure 1: Subjective probability (A: n = 89, B: n = 94)
and perceived risk (C: n = 94) as a function of statistical
and narrative information. All factors were manipulated
between subjects. Error bars = 95% CI.
base-rate: β = .56, narratives: β = .16), although the narra-
tives’ influence was not significant. For perceived risk as-
sessed with the visual analog scale, however, the influence
of the statistical base-rate information was lower than that
of the narratives (statistical base-rate: β = .29, narratives:
β = .43), indicating a stronger narrative bias.
In order to assess the different effects of narratives and
statistics on the three dependent measures we also corre-
lated each of the three dependent measures with the dif-
Figure 2: Perceived risk (n = 183) as a function of the sta-
tistical and narrative information. Subjective probability
was assessed before the risk judgment. All factors were
manipulated between subjects. Error bars = 95% CI.
ference between the statistical and narrative information.
This was done only for those subjects for whom narrative
information differed from the statistical base-rate. Dif-
ferences were calculated by subtracting the frequency of
VAE from the statistical base-rate, so a difference of −35%
represents a low base-rate and a higher probability in the
narratives, a difference of 35% represents the opposite.
This way, a negative correlation indicates a stronger effect
of narratives, a positive one a stronger effect of the statis-
tical information. The correlations were r = .67, p < .001
for the percent estimate (n = 44), r = .41, p = .005 for
the 7-point rating scale (n = 46), and r = −.15, p = .34
for the visual analog scale (n = 45). The last of these
differed significantly from the other two (Percent esti-
mate: Fisher’s z = 4.38, p < .001, 7-point rating scale:
Fisher’s z = 2.7, p = .007).
When we entered subjective numeracy into the regres-
sion model, the percent estimate was a function of the
number of narratives only when subjects had low sub-
jective numeracy scores. Subjects high in subjective nu-
meracy were unaffected by the number of narratives when
judging the probability of VAE. This is evident in a sig-
nificant interaction between subjective numeracy and the
relative number of narratives (β = −.14).
When subjects judged the probability of VAE on the 7-
point rating scale, the resulting judgments differed more
strongly between the 5% and 40% statistical conditions for
subjects high in subjective numeracy. Judgments by sub-
jects low in subjective numeracy were more similar across
statistical conditions. This was indicated by a significant
interaction of subjective numeracy and statistical proba-
bility of VAE (β = .22).
Subjective numeracy did not affect ratings on the risk
measure (visual analog scale; all β’s n.s.).
Judgment and Decision Making, Vol. 10, No. 3, May 2015 How narratives bias risk perceptions 248
Carry-over effects. The results above suggest that risk
judgments and subjective probability judgments are in-
deed very different—the probability judgments were less
biased by narrative information than the risk judgment and
depended more on the statistical base-rate. Judging prob-
abilities before judging risk, therefore, may increase the
saliency of the probability dimension of risk, resulting in
a larger effect of the statistical base-rate on risk judgments.
Conversely, judging risk before probability might increase
the influence of narrative information. Both kinds of influ-
ence should manifest themselves in carry-over effects. To
test this, we calculated three additional regression analy-
ses with the respective other subsample, i.e., we predicted
ratings on the probability scales using only subjects that
had first judged perceived risk and, vice versa, predicted
risk judgments of subjects who had first estimated subjec-
tive probability of VAE.
Percent estimates were not affected by a prior risk judg-
ment (Statistic: β = .81, p < .001, Narratives: β = .19,
p = .002). Subjective numeracy had no influence (all other
T’s ≤ 1.45; R2 = .72, F(7,86) = 31.62, p < .001).
For the 7-point rating scale, on the other hand, we
found a similar significant influence of statistical variation
(β = .56, p < .001) but also a significant effect of the nar-
ratives (β = .25, p = .003). Again, there was no effect
of subjective numeracy (all other T’s ≤ 1.48; R2 = .41,
F(7,86) = 8.36, p < .001). This indicates that considering
the whole risk construct first renders a probability judg-
ment more susceptible to the influence of irrelevant infor-
mation.
For the risk measure, we found that judging probabil-
ity first reversed the relative influence of both informa-
tion types, thus resulting in a stronger influence of sta-
tistical information (β = .51, p < .001) than of the narra-
tives (β = .16, p = .012; all other T’s ≤ 1.21; R2 = .32,
F(7,175) = 11.86, p < .001) on subsequent risk judgments.
Note that increasing the salience of the probability dimen-
sion not only increased the effect of statistical information
but also decreased the narratives’ influence (see Figure 2
compared to Figure 1C).
2.2.4 Symmetry of the narrative bias
In order to assess whether the narrative bias is symmetric,
we compared the effect sizes of the conditions when nar-
ratives were expected to increase vs. decrease the resulting
judgments. The bars on the left in Figure 1 represent the
case in which narratives should increase ratings of sub-
jective probability and risk, because the relative frequency
of narratives reporting VAE is equal to or greater than the
statistical base-rate of 5%. The bars on the right represent
the case in which narratives report an equal to or lower
probability of VAE than the statistical information. If the
narrative bias is symmetric, effect sizes displayed in Fig-
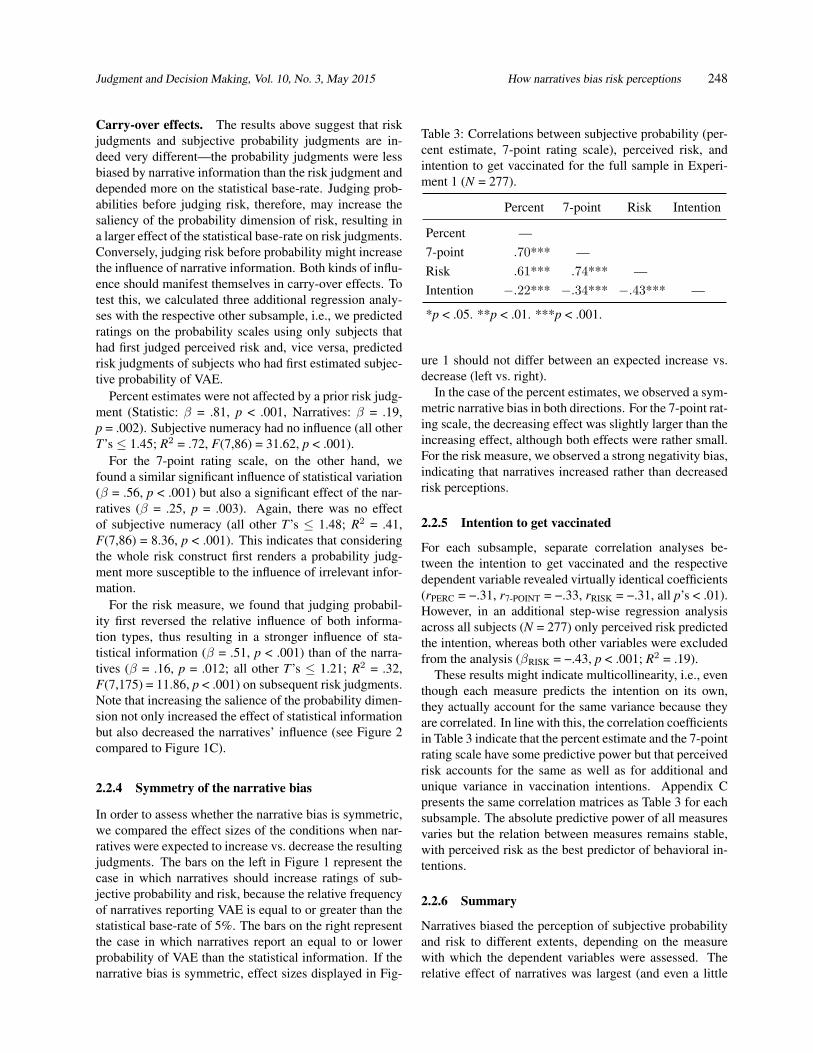
Table 3: Correlations between subjective probability (per-
cent estimate, 7-point rating scale), perceived risk, and
intention to get vaccinated for the full sample in Experi-
ment 1 (N = 277).
Percent 7-point Risk Intention
Percent —
7-point .70*** —
Risk .61*** .74*** —
Intention −.22*** −.34*** −.43*** —
*p < .05. **p < .01. ***p < .001.
ure 1 should not differ between an expected increase vs.
decrease (left vs. right).
In the case of the percent estimates, we observed a sym-
metric narrative bias in both directions. For the 7-point rat-
ing scale, the decreasing effect was slightly larger than the
increasing effect, although both effects were rather small.
For the risk measure, we observed a strong negativity bias,
indicating that narratives increased rather than decreased
risk perceptions.
2.2.5 Intention to get vaccinated
For each subsample, separate correlation analyses be-
tween the intention to get vaccinated and the respective
dependent variable revealed virtually identical coefficients
(rPERC = −.31, r7-POINT = −.33, rRISK = −.31, all p’s < .01).
However, in an additional step-wise regression analysis
across all subjects (N = 277) only perceived risk predicted
the intention, whereas both other variables were excluded
from the analysis (βRISK = −.43, p < .001; R2 = .19).
These results might indicate multicollinearity, i.e., even
though each measure predicts the intention on its own,
they actually account for the same variance because they
are correlated. In line with this, the correlation coefficients
in Table 3 indicate that the percent estimate and the 7-point
rating scale have some predictive power but that perceived
risk accounts for the same as well as for additional and
unique variance in vaccination intentions. Appendix C
presents the same correlation matrices as Table 3 for each
subsample. The absolute predictive power of all measures
varies but the relation between measures remains stable,
with perceived risk as the best predictor of behavioral in-
tentions.
2.2.6 Summary
Narratives biased the perception of subjective probability
and risk to different extents, depending on the measure
with which the dependent variables were assessed. The
relative effect of narratives was largest (and even a little

Judgment and Decision Making, Vol. 10, No. 3, May 2015 How narratives bias risk perceptions 249
larger than the effect of the statistical information) on per-
ceived risk assessed with a visual analog scale. The narra-
tives had a similar but smaller to negligible effect on both
measures of subjective probability (RQ1). Variations in
statistical information, on the other hand, had the greatest
effect on subjective probability assessed as a percent es-
timate and the smallest effect on perceived risk assessed
with a visual analog scale. These results underline the im-
portant conceptual distinction between subjective proba-
bility and perceived risk. Risk perception is often oper-
ationalized as a likelihood judgment. However, the ma-
nipulation of probabilistic information (all other variables
were held constant) affected judgments of subjective prob-
ability and perceived risk differently. This is especially
apparent when considering RQ2. The narrative bias was
symmetric only when subjective probability was assessed
in percent—i.e., when narratives suggested a lower like-
lihood than the statistical base-rate, subjective probability
decreased; it increased to the same extent when narratives
suggested a higher likelihood compared to the statistical
base-rate. Contrary to this finding, we observed a strong
negativity bias on the risk measure—i.e., a greater increase
than decrease in risk perceptions due to narratives.
Previous research indicates that the 7-point rating scale
is less sensitive to variations in objective probabilities
(Betsch et al., 2011; Haase et al., 2013), which is sup-
ported by the present results: The 7-point rating scale was
less able to map differences in the statistical base-rates
than the percent estimates. In addition, the effect of nar-
ratives was smallest on this scale. If quantifying the effect
of narratives on subjective probability is a goal, subjective
probability should be assessed as percent estimates. Ex-
periment 2 will therefore omit the 7-point rating scale.
In additional analyses, we found that individual differ-
ences in subjective numeracy play a differential role con-
cerning the judgment of subjective probability both as a
percent estimate and on a rating scale. Low subjective
numeracy increased the influence of narratives when pro-
viding percent estimates, which matches previous findings
(Dieckmann et al., 2009). For the 7-point rating scale,
low subjective numeracy was related to less differentiation
between statistical base-rates. Highly numerate subjects
used the 7-point rating scale more broadly to differenti-
ate between the 5% and 40% base-rate. In line with this,
Peters and Bjalkebring (2014) found higher subjective nu-
meracy to be related to better performance in a symbolic-
number mapping task.
3 Experiment 2
Experiment 1 implicitly assumes that the relative fre-
quency of narratives reporting the critical event influences
risk perceptions. However, as stated in the introduction,
encounter frequency theory and research on the ratio-bias
suggest that the absolute number of narratives may drive
this effect. In the current experimental paradigm, indi-
viduals would then perceive different risks when 8 of 20
narratives report VAE than when 4 of 10 do so. Thus, in
this experiment we vary the absolute number of narratives
while keeping the relative number of positive cases con-
stant (RQ3).
In order to investigate whether the narrative bias is in
part an experimental artifact, additional experimental con-
ditions offer subjects the option to decide whether they
want to view the narrative information in addition to the
statistical information. This should communicate to sub-
jects that the statistical information is sufficient to make a
judgment (RQ4) and will also allow us to address the ques-
tion whether narratives are an attractive source of informa-
tion that are sought out even when statistical information is
already available (RQ6). Further, in certain conditions we
vary the sequence of statistical and narrative information
to exclude recency as an alternative explanation (RQ5).
3.1 Method
The experimental set-up strongly resembled the first ex-
periment.
3.1.1 Subjects and design
Subjects were recruited via Amazon Mechanical Turk and
were paid US$1 (hourly wage: approx. US$4.14) through
the Mechanical Turk payment system. Of the 515 individ-
uals who clicked on the link to the survey, 479 completed
the study. We excluded one individual who copied text
from the page into a textbox, indicating that he or she did
not read the instructions. In addition, we excluded three
subjects who completed the survey in less than 5 minutes
(M = 13 min 56 s, SD = 6 min), which falls below the
minimum completion-time. Finally, 11 subjects indicated
that they had previously participated in a similar study and
were therefore excluded from the sample. Thus, analyses
were calculated with a sample of N = 464 subjects, with
the n for individual conditions ranging from 24 to 31.
Subjects were randomly assigned to 16 conditions, re-
sulting from a 2 × 2 × 3 between-subjects design plus four
additional conditions described below (see Figure 3). The
main design is constituted by the following factors: 2 (se-
quence of dependent variables: risk perception followed
by subjective probability and vice versa) × 2 (sample size:
10 vs. 20 cases) × 3 (relative frequency of narratives re-
porting adverse events: 10% vs. 20% vs. 40%). The sta-
tistical base-rate information was equal in all conditions
(20%). Additionally, we assessed subjects’ numeracy.
In order to test whether the narrative bias occurs due
to a conversational norm indicating that all information

Judgment and Decision Making, Vol. 10, No. 3, May 2015 How narratives bias risk perceptions 250
Figure 3: Design of Experiment 2. Top of the figure shows
the main 2 × 2 × 3 design, the bottom shows both subde-
signs. Dashed borders indicate cells from the main design
used for comparison with the subdesigns.
Subjective probability(percent estimate)
10
10%
20%
40%
20
10%
20%
40%
Perceived risk(visual analog scale)
10
10%
20%
40%
20
10%
20%
40%
First dependent variable
Sample size: total number of narratives
Narratives:frequency of VAE
Main design: 2 (first dependent variable) � 2 (sample size) �3 (narratives: frequency of VAE).
Statistical information before narratives. Required encoding of narratives.
Narratives before statistical information
10%
40%
Optional encodingof narratives
10%
40%
Subdesign: required vs. optional encoding of narratives
Subdesign: sequence of statistical and narrative information
provided must be relevant, we added two cells in which
reading the narratives was optional, in contrast to all the
above mentioned conditions in which reading the narra-
tives was required. We did so in a 2 × 2 between-subjects
subdesign, using two cells from the design reported above:
2 (relative frequency of adverse events: 10% vs. 40%)
× 2 (encoding of narrative information: required vs. op-
tional). If an interaction suggests that the narrative bias
disappears when encoding of the narratives is optional
rather than required, we can assume that at least part of
the narrative bias occurs due to the subjects’ tendency to
view all materials presented by the experimenter as rele-
vant. For economic reasons, we decided to use only the
risk measure as a dependent variable.
In order to test whether the narrative bias occurs due
to a recency effect, we added two additional conditions in
which we varied the order of the statistical and narrative
information. Thus, the resulting 2 × 2 between-subjects
subdesign was constituted by the following factors: 2 (rel-
ative frequency of adverse events: 10% vs. 40%) × 2 (se-
quence of information: statistic–narratives and vice versa).
If an interaction suggests that the narrative bias disappears
when the statistical information is presented after the nar-
ratives and before the dependent variables, we can assume
that at least part of the narrative bias occurs due to a re-
cency effect. Again, we used only the risk measure.
3.1.2 Materials and procedure
Procedure. As in Experiment 1, subjects read about the
disease, the vaccine recommendation, and the statistical
likelihood of VAE in written and graphic form. They
were then presented with the narrative information within
a simulated bulletin board. Finally, we collected depen-
dent variables, manipulation checks, and control variables.
Statistical probability of adverse events. As in the first
experiment, the statistical probability of VAE was stated
explicitly in percent and displayed by means of a picto-
graph and was fixed at 20% in all conditions. The narra-
tives either matched, exceeded, or fell below the statistical
information.
Manipulation of relative frequency of narratives re-
porting adverse events. In all conditions, either 1, 2 or
4 of 10 or 2, 4 or 8 of 20 narratives reported VAE (result-
ing in relative frequencies of 10%, 20% and 40%, respec-
tively). All reported adverse events were categorized as
mild (e.g., insomnia, fever, rash; as identified in a pretest,
see Experiment 1). The remaining cases reported unprob-
lematic vaccination experiences. As in Experiment 1, the
narratives were of equal length, randomized in their se-
quence, and displayed one at a time.
Required vs. optional reading of narratives. Two con-
ditions offered subjects the choice to either view the narra-
tive information or skip the simulated bulletin board. Sub-
jects were asked: "Next, you have the opportunity to read
a number of posts from an online message-board where
people share their personal experiences with the vaccine.
Would you like to read the posts?" (yes or no). In all other
conditions, subjects were informed that on the subsequent
pages they will see "a number of posts from an online
message-board where people share their personal experi-
ences with the vaccine". The instructions asked them to
read all messages carefully.
Sequence of statistical and narrative information. All
subjects learned that their doctor provided them with the
statistical information. In two conditions, the statistical
information appeared after the narrative information. In
all other conditions, the statistical base-rate information
was provided first.

Judgment and Decision Making, Vol. 10, No. 3, May 2015 How narratives bias risk perceptions 251
Dependent variables. As dependent variables, we as-
sessed perceived risk and subjective probability in the
same manner as in Experiment 1 (Table 1). As a measure
for subjective probability, we asked for percent estimates.
Half of the subjects judged the subjective probability of
VAE first and then rated their perceived risk and vice versa
for the other half.
Manipulation checks. We asked subjects to recall the
initially stated base-rate of VAE (20%) as well as the num-
ber of narratives that reported adverse events (1, 2, or 4 of
10 or 2, 4, or 8 of 20). We asked for the number of nar-
ratives only if the subjects had either seen them by default
or if they had decided to read them.
Numeracy. In this experiment, we employed a more
objective measure of numeracy—a combination of the
3-item scale by Schwartz, Woloshin, Black, and Welch
(1997) and the Berlin Numeracy Test (Cokely, Galesic,
Schulz, Ghazal, & Garcia-Retamero, 2012). The seven
items involve short mathematical quizzes (e.g., "Imagine
we are throwing a five-sided die 50 times. On average,
out of these 50 throws, how many times would this five-
sided die show an odd number (1, 3 or 5)?", correct an-
swer = 30).
3.2 Results
3.2.1 Manipulation check
Ninety-two percent of subjects correctly recalled that the
statistical base-rate was 20% (M20 = 21.16, SD20 = 9.12);
4% reported that it was below 20%, whereas 4% reported
a base-rate greater than 20%.
We assumed a correct recall of the number of narratives
if the recalled number was plus/minus one. For the con-
dition in which 1 narrative reported VAE, 95.3% correctly
recalled the absolute number (M1 = 1.30, SD1 = 1.32). In
the 2 cases condition, 93.2% (M2 = 2.45, SD2 = 1.77), in
the 4 cases condition 85.1% (M4 = 4.71, SD4 = 4.12), and
in the 8 cases condition 41.4% (M8 = 8.97, SD8 = 11.78)
correctly recalled the absolute frequency of narratives re-
porting VAE.
3.2.2 Numeracy
The sum score of all correctly solved numeracy items con-
stitutes the numeracy score (potential range 0–7). The
mean numeracy score (3.50, SD = 1.79) did not differ
across conditions (all η2p’s in a 3 × 2 × 2 ANOVA were
≤ .003, all p’s ≥ .32).
3.2.3 Subjective probability and risk perception
The goal of this experiment was to assess whether the nar-
rative bias occurs due to the relative or absolute frequency
of narratives reporting VAE (RQ3). A main effect show-
ing an increase with sample size (number of messages on
the bulletin board) would indicate that the absolute num-
ber of narratives reporting VAE (possibly as well as the
relative number) influences the dependent variables, be-
cause the absolute number of narratives is higher in the 20
cases condition (2, 4, 8) than in the 10 cases condition (1,
2, 4).
For all analyses, we calculated regression analyses with
standardized, continuous predictors. Two separate linear
regressions were calculated, predicting subjective proba-
bility (percent estimates) and perceived risk (visual ana-
log scale). We again used only the subsamples in which
the respective dependent variable was assessed first to ex-
clude carry-over effects. Interactions were calculated as
the mathematical products of the standardized predictors
(Cohen et al., 2003). In a first regression, we entered the
manipulated factors and their interaction. In a second re-
gression, we added numeracy and the interactions of the
factors with numeracy.2
Table 4 displays the results of the regression analyses.
Subjective probability tended to be influenced by the rela-
tive frequency of positive narratives when the sample was
small (10 cases) and was not influenced when it was large
(20 cases), as indicated by an almost significant interaction
of narratives and sample size (β = −.14). The effect was
somewhat weaker when numeracy and the respective in-
teractions were also entered into the regression. No other
effects were significant.
Figure 4: Unstandardized simple slopes of frequency of
VAE predicting perceived risk for the small and the large
sample.
15
20
25
30
35
40
Perc
eiv
ed r
isk
Small sample Large sample
0
5
10
15
Low frequency of VAE High frequency of VAE
Perc
eiv
ed r
isk
2See Appendix B for a full correlation matrix.

Judgment and Decision Making, Vol. 10, No. 3, May 2015 How narratives bias risk perceptions 252
Table 4: Subjective probability and perceived risk as a function of sample size, frequency of VAE, and numeracy
(Experiment 2).
Subjective probability (percent estimate)
n = 181 β p β p
Sample size (10 vs. 20) −.04 .61 −.03 .70
Narratives: frequency of VAE (10% vs. 20% vs. 40%) .10 .16 .09 .26
Sample size × narratives −.14 .06 −.13 .09
Numeracy −.02 .80
Numeracy × sample size .05 .50
Numeracy × narratives −.10 .19
Numeracy × sample size × narratives .11 .15
R2 .03 .06
Perceived risk (visual analog scale)
n = 168 β p β p
Sample size (10 vs. 20) −.07 .36 −.07 .35
Narratives: frequency of VAE (10% vs. 20% vs. 40%) .38 <.001 .37 <.001
Sample size × narratives .04 .60 .04 .62
Numeracy −.14 .05
Numeracy × sample size .02 .76
Numeracy × narratives −.14 .05
Numeracy × sample size × narratives .13 .06
R2 .15 .20
Note. Standardized betas (β) and respective p-values of significant effects are shown in boldface.
Figure 5: Unstandardized simple slopes of frequency of
VAE predicting perceived risk for 1 SD below and 1 SD
above the mean of numeracy.
15
20
25
30
35
40
Perc
eiv
ed r
isk
Low numeracy High numeracy
0
5
10
15
Low frequency of VAE High frequency of VAE
Perc
eiv
ed r
isk
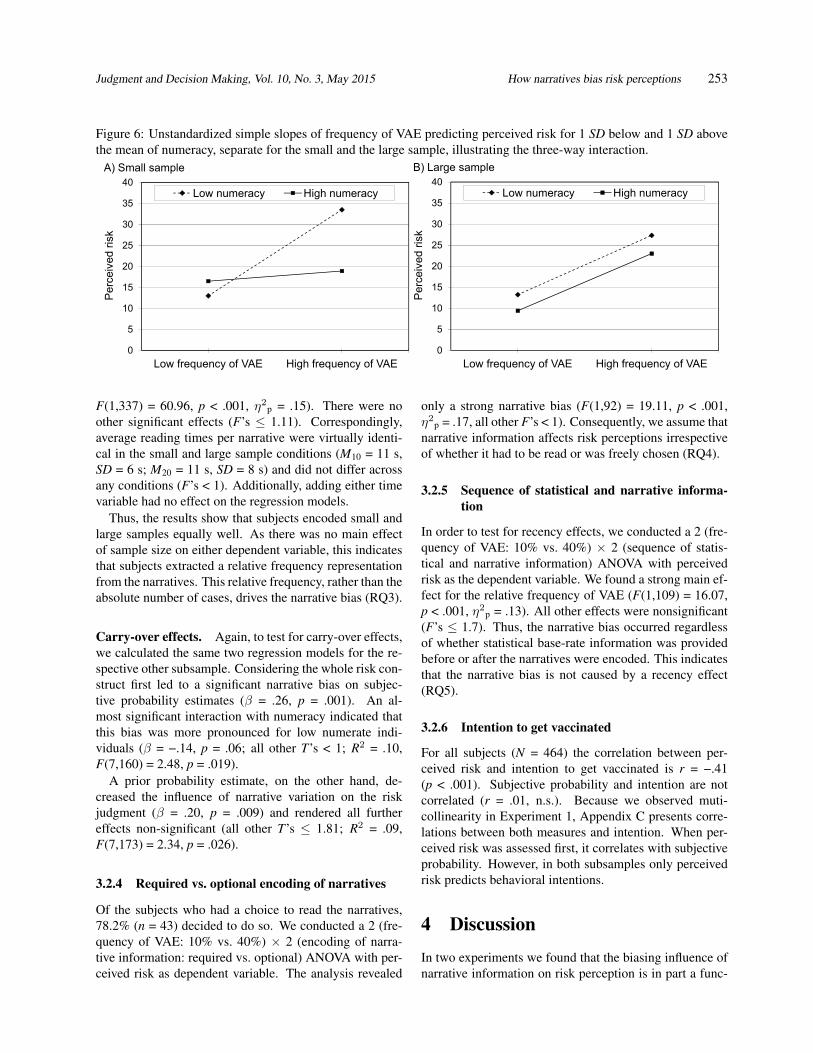
Perceived risk was a function of the relative frequency
of narratives reporting VAE (β = .38), with subjects in con-
ditions with a higher relative frequency perceiving higher
vaccination risks. The sample size did not affect perceived
risk (Figure 4).3
Subjects with high numeracy generally perceived lower
risk (β = −.14). Two interaction effects qualified this main
effect. For highly numerate subjects, there was a weaker
narrative bias, whereas the bias was stronger for subjects
with low numeracy (Figure 5). The almost significant
three-way interaction is displayed in Figures 6A and 6B,
which show that there was no narrative bias for highly nu-
merate subjects when the sample size was small.
In order to rule out the possibility that the lack of an
effect of sample size was due to subjects not encoding
the larger number of narratives as carefully as the small
number, we analyzed reading times. We conducted two
separate 2 × 2 × 3 ANOVAs with the total amount of
time spent reading the narratives and the average amount
of time per narrative as respective dependent variables.
Subjects took almost exactly twice as long to encode 20
narratives (M20 = 3 min 31 s, SD = 2 min 5 s) as com-
pared to 10 narratives (M10 = 1 min 46 s, SD = 57 s;
3Simple slope figures were created with an Excel plotting sheet by
Winnifred Louis, available at: http://www2.psy.uq.edu.au/ uqwloui1/,
last accessed on March 3, 2015.
Judgment and Decision Making, Vol. 10, No. 3, May 2015 How narratives bias risk perceptions 253
Figure 6: Unstandardized simple slopes of frequency of VAE predicting perceived risk for 1 SD below and 1 SD above
the mean of numeracy, separate for the small and the large sample, illustrating the three-way interaction.
20
25
30
35
40
Perc
eiv
ed r
isk
A) Small sample
Low numeracy High numeracy
0
5
10
15
Low frequency of VAE High frequency of VAE
Perc
eiv
ed r
isk
20
25
30
35
40
Perc
eiv
ed r
isk
B) Large sample
Low numeracy High numeracy
0
5
10
15
Low frequency of VAE High frequency of VAE
Perc
eiv
ed r
isk
F(1,337) = 60.96, p < .001, η2p = .15). There were no
other significant effects (F’s ≤ 1.11). Correspondingly,
average reading times per narrative were virtually identi-
cal in the small and large sample conditions (M10 = 11 s,
SD = 6 s; M20 = 11 s, SD = 8 s) and did not differ across
any conditions (F’s < 1). Additionally, adding either time
variable had no effect on the regression models.
Thus, the results show that subjects encoded small and
large samples equally well. As there was no main effect
of sample size on either dependent variable, this indicates
that subjects extracted a relative frequency representation
from the narratives. This relative frequency, rather than the
absolute number of cases, drives the narrative bias (RQ3).
Carry-over effects. Again, to test for carry-over effects,
we calculated the same two regression models for the re-
spective other subsample. Considering the whole risk con-
struct first led to a significant narrative bias on subjec-
tive probability estimates (β = .26, p = .001). An al-
most significant interaction with numeracy indicated that
this bias was more pronounced for low numerate indi-
viduals (β = −.14, p = .06; all other T’s < 1; R2 = .10,
F(7,160) = 2.48, p = .019).
A prior probability estimate, on the other hand, de-
creased the influence of narrative variation on the risk
judgment (β = .20, p = .009) and rendered all further
effects non-significant (all other T’s ≤ 1.81; R2 = .09,
F(7,173) = 2.34, p = .026).
3.2.4 Required vs. optional encoding of narratives
Of the subjects who had a choice to read the narratives,
78.2% (n = 43) decided to do so. We conducted a 2 (fre-
quency of VAE: 10% vs. 40%) × 2 (encoding of narra-
tive information: required vs. optional) ANOVA with per-
ceived risk as dependent variable. The analysis revealed
only a strong narrative bias (F(1,92) = 19.11, p < .001,
η2p = .17, all other F’s < 1). Consequently, we assume that
narrative information affects risk perceptions irrespective
of whether it had to be read or was freely chosen (RQ4).
3.2.5 Sequence of statistical and narrative informa-
tion
In order to test for recency effects, we conducted a 2 (fre-
quency of VAE: 10% vs. 40%) × 2 (sequence of statis-
tical and narrative information) ANOVA with perceived
risk as the dependent variable. We found a strong main ef-
fect for the relative frequency of VAE (F(1,109) = 16.07,
p < .001, η2p = .13). All other effects were nonsignificant
(F’s ≤ 1.7). Thus, the narrative bias occurred regardless
of whether statistical base-rate information was provided
before or after the narratives were encoded. This indicates
that the narrative bias is not caused by a recency effect
(RQ5).
3.2.6 Intention to get vaccinated
For all subjects (N = 464) the correlation between per-
ceived risk and intention to get vaccinated is r = −.41
(p < .001). Subjective probability and intention are not
correlated (r = .01, n.s.). Because we observed muti-
collinearity in Experiment 1, Appendix C presents corre-
lations between both measures and intention. When per-
ceived risk was assessed first, it correlates with subjective
probability. However, in both subsamples only perceived
risk predicts behavioral intentions.
4 Discussion
In two experiments we found that the biasing influence of
narrative information on risk perception is in part a func-

Judgment and Decision Making, Vol. 10, No. 3, May 2015 How narratives bias risk perceptions 254
tion of the dependent measure used to assess it. Narra-
tives had the largest effect on a non-numerical risk mea-
sure, whereas two scales for subjective probability re-
flected mostly statistical variations. This stresses the im-
portance of differentiating between the constructs risk and
probability. Further, two-way carry-over effects between
the respective measures indicated that the use of all scales
was context dependent, e.g., considering the risk construct
first increased the influence of narrative information on
subsequent probability judgments. Additionally, the risk
measure was the best predictor of behavioral intentions,
and only for the risk measure did we observe a negativ-
ity bias. Moreover, results indicate that subjects extracted
a representation of relative frequency from the narratives,
as changing the absolute number of single events while
keeping their relative number constant did not change the
narrative bias. Subjective and objective numeracy had op-
posing and somewhat weak effects on judgments. Finally,
the option to freely choose whether to read the narrative
information did not affect the narrative bias in any way. In
addition, we found no indication of a recency effect as an
explanation for the narratives’ influence.
4.1 Issues of measurement
Regarding the task dependence of the narrative bias, three
aspects of measuring risk perception must be considered:
the representation on which a judgment is based, the scale
used for assessment, and the context in which the scale is
used.
Various theoretical approaches propose that risk judg-
ments rely on two distinct representations or processes.
These theories make diverse yet conceptually related dif-
ferentiations between cognitive vs. affective risk evalua-
tions, a belief in objective probabilities vs. an intuitive
perception of risk, and verbatim vs. gist representations.
The two respective components are understood to be dis-
tinct but may interact in the reasoning process, which
moves along a continuum between them (Loewenstein et
al., 2001; Reyna, 2008, 2012; Slovic et al., 2004; van
Gelder, de Vries, & van der Pligt, 2009; Windschitl, Mar-
tin, & Flugstad, 2002).
The scales we used differ along at least two dimen-
sions. First, whereas the rating scale offers only seven
discrete categories for judgment, the percent format and
the visual analog risk scale allow for quasi-continuous es-
timates, i.e., 101 discrete categories, as responses were
restricted to integers. This difference in resolution pro-
vides the latter scales with a natural advantage in terms
of sensitivity to changes in subjective probability (Haase
et al., 2013). Second, while the percent format is purely
numeric, the rating scale and risk measure provide verbal
labels. It has been argued that numeric probability mea-
sures induce rule-based reasoning in individuals and elicit
beliefs in objective probability, whereas verbal scales lead
to a more associative reasoning style and elicit rather in-
tuitive thoughts about an uncertain prospect. These in-
tuitive beliefs entail more than just a maximally accurate
representation of likelihood. Rather, they also include no-
tions of the value of a prospect, affective reactions to it,
and its meaning in a given situation—all of which may
make them more comparable to real-life situations. Ac-
cordingly, verbal probability scales have been shown to
be more sensitive to context and framing effects as well
as to be better predictors of preferences, behavioral inten-
tions, and behavior than numeric scales. The risk measure
extends this idea on an explicit conceptual level, as risk
by definition encompasses more than mere probability. In
addition, risk measures have been found to perform even
better in predicting behavior (Baghal, 2011; Weinstein et
al., 2007; Windschitl, 2002; Windschitl & Wells, 1996).
Finally, the interpretation of a question and the use
of a response format have been shown to be affected by
the context such as a preceding question (Schwarz, 1999,
2007). Building on these premises, we suggest that judg-
ments in research on biased risk perception are in part
task-dependent (RQ1). Subjects base their estimates on
beliefs in objective likelihood and intuitive risk represen-
tations and engage in rule-based and associative reason-
ing styles. The degree to which these two representations
inform the judgment and the manner in which they are
weighed and processed are in part a function of the re-
sponse scale provided, as well as prior elicitations of re-
lated constructs.
In line with this notion, narrative and statistical infor-
mation affected the three dependent variables differently.
Judgments on the 7-point rating scale were not influenced
by variations in the narrative information (Experiment 1),
which can partly be explained by the scale’s low sensi-
tivity, as even the explicitly stated statistical probabilities
of 5% and 40% were mapped very close to each other
on the rating scale. However, the verbal qualifiers of this
scale make judgments prone to reflecting not only a like-
lihood representation but also other aspects of the uncer-
tain prospect, e.g., the severity of VAE (Weber & Hilton,
1990), which may have masked the effect of the narrative
manipulation. Indeed, controlling for perceived severity
(β = .19, p = .02) in the regression model not only signif-
icantly increased the amount of explained variance (from
R2 = .39 to R2 = .43, F(1,85) = 5.31, p = .02) but also ren-
dered the variation in narratives a significant predictor of
subjective probability (β = .17, p = .05, all other effects un-
changed). We assume that these subjects attempted to pro-
vide judgments which, for the most part, reflect their be-
liefs in objective probability, as this was the first question
asked. In contrast to this, estimates by subjects who had
first considered the whole risk construct showed a clear
narrative bias, indicating that subjects’ interpretation of

Judgment and Decision Making, Vol. 10, No. 3, May 2015 How narratives bias risk perceptions 255
the 7-point rating scale—as a pure probability measure vs.
a general risk measure—varies as a function of contextual
factors.
The percent format, in comparison, elicits responses
that are almost exclusively expressions of rule-based rea-
soning processes concerning numeric probabilities. The
effect of variations in narrative information was smaller
(Experiment 1) or negligible (Experiment 2) and symmet-
ric as compared to the effect on risk judgments. Further,
adding severity to the regression model had no effect in
either of the experiments. Subjects encoded the likelihood
of VAE in percent and were later asked for an estimate in
percent. Thus, the format might have cued the retrieval
of this specific information rather than a subjective repre-
sentation of probability. However, even the percent format
is not fully resistant to context effects—in Experiment 2,
asking for a general risk judgment beforehand led to a nar-
rative bias.
Finally, we observed the strongest narrative bias on
the visual analog risk scale. In Experiment 1, narra-
tives had a stronger effect on risk perceptions than the
statistic. In Experiment 2, only risk perceptions were af-
fected by narrative information. Further, perceived sever-
ity proved a strong predictor of perceived risk and im-
proved the model to a large degree in both experiments
(Experiment 1: β = .31, p = .001; from R2 = .30 to
R2 = .39, F(1,85) = 12.17, p = .001; Experiment 2: β = .48,
p < .001; from R2 = .20 to R2 = .42, F(1,159) = 61.36,
p < .001; all other effects unchanged). As individuals ex-
pressed more than just a likelihood representation in their
risk judgments, these estimates might be especially sus-
ceptible to contextual factors. Accordingly, asking for a
probability estimate first increased the influence of sta-
tistical information on perceived risk (Experiment 1) and
decreased the effect of narrative variation (both experi-
ments). Still, risk estimates did not represent merely an
analytic integration of likelihood and value. Additionally
controlling for subjective probability estimates in the re-
gression models eliminated the effect of statistical varia-
tion (Experiment 1) but not the effect of narratives on risk
judgments (both experiments).
In line with previous research and our reasoning thus
far, we found that the risk measure predicted behavioral
intentions best. Decisions and behavior under risk, of
course, have more antecedents than just the likelihood of a
given outcome. Thus, a measure that elicits more than this
likelihood representation will consequently lead to supe-
rior predictions. Our findings regarding the symmetry of
the narrative bias (RQ2) lend further support to this expla-
nation. When asked to provide percent estimates, subjects
engaged in rule-based integration akin to a calculation,
which, since the presented frequencies were symmetric,
resulted in a symmetric bias. A more intuitive risk mea-
sure, on the other hand, led to a clear negativity bias. One
explanation for the stronger impact of negative informa-
tion is that it possesses greater diagnostic value. Consider
the potential cost of ignoring a danger versus mistakenly
missing out on a benefit. If judgments of perceived risk are
more relevant for actual behavior, it would make sense to
assign negative information more weight. However, when
the judgment process follows a normative understanding
of mathematics, equal numbers will receive equal weights
(Baumeister et al., 2001; Siegrist & Cvetkovich, 2001;
Skowronski & Carlston, 1989).
4.2 Narratives as a source of probabilistic
information
The narrative information provided subjects with exem-
plars of the occurrence and non-occurrence of an uncertain
outcome, i.e., VAE. The encoding of such event frequen-
cies is a predominantly automatic and accurate process
(Hasher & Zacks, 1979; Zacks & Hasher, 2002). Accord-
ingly, the manipulation checks showed that subjects were
able to track the number of narratives reporting VAE, al-
though there was some decline in accuracy when this num-
ber was larger. Nonetheless, results indicate that individu-
als perceived the absolute frequency of an uncertain event,
yet extracted a relative frequency representation for sub-
sequent risk judgments, as a change in total sample size
did not affect the biasing influence of narrative informa-
tion (RQ3).
This finding stands in contrast to some existing litera-
ture. Research on the ratio bias, for instance, would have
predicted that subjects perceive a higher likelihood or risk
when 8 of 20 narratives report VAE rather than 4 of 10,
as they concentrate on the absolute frequency of the fo-
cal event and fail to take into account the total number
of events (Denes-Raj & Epstein, 1994; Reyna & Brain-
erd, 2008). However, the occurrence of the ratio-bias ap-
pears to depend on within-subjects comparisons (Lefeb-
vre, Vieider, & Villeval, 2010), whereas the present study
used a between-subjects design.
Similarly, Obrecht et al. (2009) employed a within-
subjects design in their encounter frequency account.
However, while 4 of 10 and 8 of 20 narratives would result
in equal ratios of positive and negative encounters, their
theory hinges on the idea that the statistic enters the judg-
ment process as simply one more instance indicating ei-
ther the occurrence or non-occurrence of an event. This
extra piece of information leads to differing ratios and,
subsequently, differing predictions of perceived probabil-
ity. There may be some merit to this theory if the statistic
offers clear-cut evidence, i.e., the likelihood is extremely
high or low. However, a probability of 20% clearly indi-
cates a certain amount of risk; one would be hard-pressed
to simply interpret it as a non-occurrence of an event be-
cause it is numerically below 50%.

Judgment and Decision Making, Vol. 10, No. 3, May 2015 How narratives bias risk perceptions 256
Taken together, our findings indicate that subjects inter-
preted the narratives as representing one sample of events
conveying a probability and the statistic as another such
sample. We did observe two almost significant interaction
effects of sample size: First, probability estimates were
biased by the narrative information only when the sample
was small. This might be due to a more accurate track-
ing of event frequencies when only ten exemplars were
presented. Second, individuals high in numeracy showed
no narrative bias on the risk measure in a small sample as
compared to a large one. This might indicate that these
subjects did in fact consider sample size in their judg-
ments, as a larger sample of 20 events does have a higher
diagnostic value than a smaller sample of 10 cases. As
both effects were barely significant and rather small, we
do not believe that they impede our previous reasoning.
4.3 Numeracy
We observed opposing effects of numeracy on the respec-
tive dependent measures in the two experiments. It is im-
portant to note, however, that we employed two different
instruments to assess numeracy. The Subjective Numeracy
Scale in Experiment 1 measures self-assessed ability and
preferences to understand and apply numbers, whereas the
combined test in Experiment 2 objectively assesses the
ability to perform mathematical operations with percent-
ages and proportions. Even though the former measure
was developed to serve as a proxy for objective perfor-
mance tests, inconsistent results have been observed pre-
viously. In addition, it has been shown recently that sub-
jective and objective numeracy scales share only a lim-
ited amount of variance and differ in their predictions of
various biases (Hess, Visschers & Siegrist, 2011; Liber-
ali, Reyna, Furlan, Stein, & Pardo, 2012, Peters & Bjalke-
bring, 2014).
In Experiment 1, only the measures of subjective prob-
ability were affected by subjective numeracy, although in
different ways. The statistical variation led to more ex-
treme values on the 7-point rating scale for individuals
higher in subjective numeracy, which implies a relation
to the way individuals use a given scale for mapping like-
lihood. In contrast, higher subjective numeracy resulted in
percent estimates that were less biased by narrative infor-
mation, indicating significance for the process of integrat-
ing probabilities. In Experiment 2, we observed that ob-
jective numeracy decreased risk perceptions in general and
moderated the narrative bias. Percent estimates of subjec-
tive probability were moderated only by objective numer-
acy when risk was assessed first, leading to a narrative bias
in the first place.
The question of whether a unitary construct underlies
the various observed effects or lack thereof has been an
ongoing debate (e.g., Nelson, Moser, & Han, 2013; Reyna,
Nelson, Han, & Dieckmann, 2009). Subjective numeracy
appears to reflect motivation and confidence regarding the
use of numerical information, i.e., it relates to how people
approach a task. Thus, the lack of an effect on the risk
measure in Experiment 1 is in line with our thinking that
the risk judgments were approached in a more intuitive
rather than rule-based manner. Of course, the processing
of proportions is still relevant in the actual formation of
a risk judgment, as the results regarding the sample size
in Experiment 2 clearly demonstrate. Thus, the effect of
objective numeracy, which appears to drive actual number
operations, does not contradict the findings from Experi-
ment 1. These findings support the notion of two related
but not identical numeracy constructs (Peters & Bjalke-
bring, 2014).
4.4 Experimental artifact and the motiva-
tion to understand risky outcomes
We addressed two potential experimental artifacts as alter-
native explanations for the narrative bias that both relate
to conversational norms. First, encoding of the individ-
uating information is typically mandatory in experiments
like this. Thus, subjects might assume that it is relevant to
the task at hand and thus only use it for this reason (Grice,
1975). We offered subjects a choice and found that, when
reading the narratives was optional, the narrative bias oc-
curred just as strongly (r = .39, p < .01) as when it was
required (r = .44, p < .01; RQ4).
Second, it has been argued that, when two conflicting
pieces of information are presented, conversational norms
indicate that the more informative and thus more impor-
tant information is typically placed last (Krosnick at al.,
1990). As the individuating information is generally pre-
sented after a base-rate in most related research, we varied
the sequence of narrative and statistical information to ex-
clude the possibility that the narrative bias is driven by
recency. The results show that the narrative bias occurred
independently of the narratives’ position in the sequence
of information (RQ5).
Thus, we found no evidence in favor of the hypothesis
that the narrative bias is based on adherence to conver-
sational norms. On the other hand, we also cannot rule
out their significance. Even in the optional encoding con-
ditions, the narratives were still provided by the experi-
menter. Therefore, it is still possible that the subjects as-
sumed that they are relevant for their judgments. The fact
that nearly 80% of subjects chose to read the narratives in
addition to the statistical information might support this
interpretation.
Ultimately, the importance of conversational norms in
research on cognitive biases due to irrelevant information
cannot be ascertained conclusively in an experiment, as all
information is always provided by the experimenter. How-

Judgment and Decision Making, Vol. 10, No. 3, May 2015 How narratives bias risk perceptions 257
ever, the motivation of the majority of subjects to read
the narratives in this experiment might be explained dif-
ferently. Huber, Wider, and Huber (1997) found that indi-
viduals are often more interested in the outcomes of risky
situations rather than the likelihood of negative outcomes.
This behavior appears to have biological roots, as fish and
birds behave in a similar manner. The costly information
hypothesis states that when information (e.g., concerning
vaccine safety) is too costly to be acquired personally (be-
cause it might harm the organism), animals will take ad-
vantage of the relatively low-cost information provided
by others (Boyd & Richerson, 1985; Webster & Laland,
2008).
Taken together, narratives appear to represent an attrac-
tive source of information, as they deliver details on spe-
cific outcomes of risky situations (RQ6). Whether people
deem them to be relevant for their risk assessments due to
their specificity (see for example Bar-Hillel, 1980) or sim-
ply because they have been presented cannot be answered
decisively. However, the fact that in the present research
both procedural manipulations had no effect at all on risk
perceptions renders experimental artifacts as sole drivers
of the narrative bias less likely.
4.5 Limitations
One goal of this study was to investigate the biasing ef-
fect of narrative information as a function of different self-
report measures. However, a general concern in this line
of research is a potential lack of external validity due to
the use of hypothetical scenarios, meaning that presenting
a bias incurs no cost to the subjects. Indeed, some biases
have been found to decrease or disappear when payment is
dependent on performance (Lefebvre et al., 2010). Future
research should strive to substantiate the present findings
by incentivizing non-biased judgments (Hertwig & Ort-
mann, 2001).
The data in Experiment 2 were collected through Ama-
zon Mechanical Turk. The data quality may be affected
by increased error variance if a greater number of sub-
jects did not take their participation seriously. For this
reason, we eliminated subjects whose time to complete the
study suggested non-serious participation. Further, previ-
ous research has shown an advantage of Mechanical Turk
samples in heterogeneity compared to the standard student
sample as well as sufficient quality according to the psy-
chometric publication standards (Buhrmester, Kwang &
Gosling, 2011; Mason & Suri, 2012; Paolacci, Chandler
& Ipeirotis, 2010).
4.6 Conclusion
The biasing effect of a small sample of single-case narra-
tives is in part dependent on the measure used to assess it.
Scales that gauge the likelihood dimension of an uncertain
prospect are least affected. Narratives have the strongest
effect on measures of a more extensive risk representa-
tion, which may entail a value dimension as well as other
aspects, e.g., an affective appraisal of the uncertain event.
This more comprehensive idea of a risk appears to be of
greater importance in guiding decisions and behavior than
a strict likelihood representation. On the other hand, judg-
ments of subjective probability as well as of perceived risk
appear to be ad hoc constructions and are therefore suscep-
tible to wording and framing effects. Attempts to predict
preferences and behavior should therefore be viewed cau-
tiously, as risk perception might change from the time of
assessment to the time of action due to a change of con-
text. Further, systematic review or overview articles need
to not only specify the exact wording and scale format of
the instruments that were used in the original research but
also take concomitant assessments of related constructs
into account. Individuals do extract a representation of
likelihood from single-case exemplars. This representa-
tion drives the narrative bias. However, the effect is much
smaller on scales that assess only the perceived likelihood
as compared to a measure of a broader and more intuitive
concept of risk.
Taken together, these results underline the important
conceptual distinction between judgments of subjective
probability and perceived risk. When individuals judge a
risk, they take many other aspects of the risky prospect
into account than merely its probability of occurrence.
Next to its severity, characteristics such as the voluntari-
ness of, knowledge about, and control over risk play a
role in risk perception. Affective reactions, personal sus-
ceptibility, and the source of a risk are additional poten-
tially relevant factors. The measures we investigated re-
flect these different concepts to differing degrees. For in-
stance, the perceived severity of VAE had no effect on per-
cent estimates of probability, a small effect on a verbal
probability measure, and a strong effect on a measure of
risk.
However, the narrative bias we observed cannot be at-
tributed to any of these additional aspects of risk, as they
were either held constant across subjects, e.g., the emo-
tionality of narratives, or controlled for through random-
ization. Further, Experiment 2 clearly indicates that the
bias was driven by a representation of relative frequency,
i.e., probability. This representation had small effects on
measures of probability, i.e., instruments that are designed
to solely assess this very representation. On the other
hand, it had large effects on an inherently multidimen-
sional measure of risk. Thus, we conclude that the re-
lationship between representations of subjective probabil-
ity and perceived risk is not yet fully understood. Future
research should strive to understand what role likelihood
representations play in the formation of risk perceptions.

Judgment and Decision Making, Vol. 10, No. 3, May 2015 How narratives bias risk perceptions 258
References
Baghal, T. (2011). The measurement of risk percep-
tions: The case of smoking. Journal of Risk Research,
14(3), 351–364. http://dx.doi.org/10.1080/13669877.
2010.541559.
Ball, D. J., & Watt, J. (2013). Further thoughts on the
utility of risk matrices. Risk Analysis, 33(11), 2068–
2078. http://dx.doi.org/10.1111/risa.12057.
Bar-Hillel, M. (1980). The base-rate fallacy in probability
judgments. Acta Psychologica, 44(3), 211-233. http://
dx.doi.org/10.1016/0001-6918(80)90046-3.
Baumeister, R. F., Bratslavsky, E., Finkenauer, C., & Vohs,
K. D. (2001). Bad is stronger than good. Review of
General Psychology, 5(4), 323–370. http://dx.doi.org/
10.1037//1089-2680.5.4.323.
Beach, L. R., & Phillips, L. D. (1967). Subjective proba-
bilities inferred from estimates and bets. Journal of Ex-
perimental Psychology, 75(3), 354–359. http://dx.doi.
org/10.1037/h0025061.
Betsch, C., Brewer, N. T., Brocard, P., Davies, P., Gaiss-
maier, W., Haase, N., . . . Stryk, M. (2012). Opportu-
nities and challenges of Web 2.0 for vaccination deci-
sions. Vaccine, 30(25), 3727–3733. http://dx.doi.org/
10.1016/j.vaccine.2012.02.025.
Betsch, C., Renkewitz, F., & Haase, N. (2013). Effect of
narrative reports about vaccine adverse events and bias-
awareness disclaimers on vaccine decisions: A simula-
tion of an online patient social network. Medical De-
cision Making, 33(1), 14–25. http://dx.doi.org/10.1177/
0272989X12452342.
Betsch, C., Ulshöfer, C., Renkewitz, F., & Betsch, T.
(2011). The influence of narrative v. statistical infor-
mation on perceiving vaccination risks. Medical De-
cision Making, 31(5), 742–753. http://dx.doi.org/10.
1177/0272989X11400419.
Borgida, E., & Nisbett, R. (1977). The differential impact
of abstract vs. concrete information on decisions. Jour-
nal of Applied Social Psychology, 7(3), 258–271. http://
dx.doi.org/10.1111/j.1559-1816.1977.tb00750.x.
Boyd, R., & Richerson, P. J. (1985). Culture and the
evolutionary process. Chicago: University of Chicago
Press.
Brewer, N. T., Chapman, G. B., Gibbons, F. X., Gerrard,
M., McCaul, K. D., & Weinstein, N. D. (2007). Meta-
analysis of the relationship between risk perception and
health behavior: The example of vaccination. Health
Psychology, 26(2), 136–45. http://dx.doi.org/10.1037/
0278-6133.26.2.136.
Brun, W. (1994). Risk perception: Main issues, ap-
proaches and findings. In G. Wright & P. Ayton (Eds.),
Subjective probability (pp. 295–320). Chichester, Eng-
land: Jon Wiley & Sons.
Buhrmester, M., Kwang, T., & Gosling, S. D. (2011).
Amazon’s Mechanical Turk: A new source of inexpen-
sive, yet high-quality, data? Perspectives on Psycho-
logical Science, 6(1), 3–5. http://dx.doi.org/10.1177/
1745691610393980.
Cohen, J., Cohen, P., West, S. G., & Aiken, L. S. (2003).
Applied multiple regression/correlation analysis for the
behavioral sciences (3rd ed.). Mahwah, NJ: Lawrence
Erlbaum Associates Publishers.
Cokely, E. T., Galesic, M., Schulz, E., Ghazal, S., &
Garcia-Retamero, R. (2012). Measuring risk literacy:
The Berlin Numeracy Test. Judgment and Decision
Making, 7(1), 25–47. Retrieved from http://journal.
sjdm.org/11/11808/jdm11808.pdf.
de Wit, J. B. F., Das, E., & Vet, R. (2008). What works
best: Objective statistics or a personal testimonial? An
assessment of the persuasive effects of different types of
message evidence on risk perception. Health Psychol-
ogy, 27(1), 110–115. http://dx.doi.org/10.1037/0278-
6133.27.1.110.
Denes-Raj, V., & Epstein, S. (1994). Conflict between
intuitive and rational processing: When people behave
against their better judgment. Journal of Personality
and Social Psychology, 66(5), 819–829. http://dx.doi.
org/10.1037/0022-3514.66.5.819.
Dieckmann, N. F., Slovic, P., & Peters, E. M. (2009).
The use of narrative evidence and explicit likelihood
by decisionmakers varying in numeracy. Risk Analysis,
29(10), 1473–1488. http://dx.doi.org/10.1111/j.1539-
6924.2009.01279.x.
Eiser, J. R. (1994). Risk judgements reflect belief strength,
not bias. Psychology and Health, 9(3), 197–199. http://
dx.doi.org/10.1080/08870449408407479.
Fagerlin, A., Wang, C., & Ubel, P. A. (2005). Reducing
the influence of anecdotal reasoning on people’s health
care decisions: Is a picture worth a thousand statistics?
Medical Decision Making, 25(4), 398–405. http://dx.
doi.org/10.1177/0272989X05278931.
Fagerlin, A., Zikmund-Fisher, B. J., Ubel, P. A., Jankovic,
A., Derry, H. A., & Smith, D. M. (2007). Measur-
ing numeracy without a math test: Development of
the Subjective Numeracy Scale. Medical Decision
Making, 27(5), 672–680. http://dx.doi.org/10.1177/
0272989X07304449.
Fox, S., & Duggan, M. (2013). Health online
2013. Retrieved from PEW Internet & American Life
Project website: http://www.pewinternet.org/2013/01/
15/health-online-2013.
Gardoni, P., & Murphy, C. (2013). A scale of risk. Risk
Analysis, 34(7), 1208–1227. http://dx.doi.org/10.1111/
risa.12150.
Gilovich, T., Griffin, D., & Kahneman, D. (Eds.). (2002).
Heuristics and biases: The psychology of intuitive judg-
ment. Cambridge, England: Cambridge University
Judgment and Decision Making, Vol. 10, No. 3, May 2015 How narratives bias risk perceptions 259
Press.
Goldstein, D. G., & Rothschild, D. (2014). Lay under-
standing of probability distributions. Judgment and
Decision Making, 9(1), 1–14. Retrieved from http://
journal.sjdm.org/13/131029/jdm131029.pdf.
Grice, H. P. (1975). Logic and conversation. In P. Cole
& J. L. Morgan (Eds.) Syntax and semantics, 3: Speech
acts (pp. 41–58). New York: Academic Press.
Haase, N. & Betsch, C. (2012). Parents trust other par-
ents: Lay vaccination narratives on the web may cre-
ate doubt about vaccination safety. Medical Deci-
sion Making, 32(4), 645. http://dx.doi.org/10.1177/
0272989X12445286.
Haase, N., Renkewitz, F., & Betsch, C. (2013). The mea-
surement of subjective probability: Evaluating the sen-
sitivity and accuracy of various scales. Risk Analy-
sis, 33(10), 1812–1828. http://dx.doi.org/10.1111/risa.
12025.
Hasher, L., & Zacks, R. (1979). Automatic and effort-
ful processes in memory. Journal of Experimental Psy-
chology: General, 108(3), 356–388. http://dx.doi.org/
10.1037/0096-3445.108.3.356.
Hertwig, R., & Ortmann, A. (2001). Experimental prac-
tices in economics: A methodological challenge for
psychologists? Behavioral and Brain Sciences, 24(03),
383–403.
Hess, R., Visschers, V. H. M. & Siegrist, M. (2011). Risk
communication with pictographs: The role of numeracy
and graph processing. Judgment and Decision Making,
6(3), 263–274. Retrieved from http://journal.sjdm.org/
11/10630/jdm10630.pdf.
Hinyard, L. J., & Kreuter, M. W. (2007). Using narrative
communication as a tool for health behavior change: A
conceptual, theoretical, and empirical overview. Health
Education & Behavior, 34(5), 777–792. http://dx.doi.
org/10.1177/1090198106291963.
Huber, O.,Wider, R., & Huber, O.W. (1997), Active in-
formation search and complete information presenta-
tion in naturalistic risky decision tasks. Acta Psycho-
logica, 95(1), 15–29. http://dx.doi.org/10.1016/S0001-
6918(96)00028-5.
Kata, A. (2010). A postmodern Pandora’s box: Anti-
vaccination misinformation on the Internet. Vaccine,
28(7), 1709–1716. http://dx.doi.org/10.1016/j.vaccine.
2009.12.022.
Kata, A. (2012). Anti-vaccine activists, Web 2.0, and
the postmodern paradigm – An overview of tactics and
tropes used online by the anti-vaccination movement.
Vaccine, 30(25), 3778–3789. http://dx.doi.org/10.1016/
j.vaccine.2011.11.112.
Keller, C., Siegrist, M., & Visschers, V. (2009). Effect of
risk ladder format on risk perception in high- and low-
numerate individuals. Risk Analysis, 29(9), 1255–1264.
http://dx.doi.org/10.1111/j.1539-6924.2009.01261.x.
Knapp, P., Gardner, P. H., Raynor, D. K., Woolf, E.,
& McMillan, B. (2010). Perceived risk of tamoxifen
side effects: A study of the use of absolute frequen-
cies or frequency bands, with or without verbal descrip-
tors. Patient Education and Counseling, 79(2), 267–
271. http://dx.doi.org/10.1016/j.pec.2009.10.002.
Krosnick, J. A., Li, F., & Lehman, D. R. (1990). Conver-
sational conventions, order of information acquisition,
and the effect of base rates and individuating informa-
tion on social judgments. Journal of Personality and
Social Psychology, 59(6), 1140–1152. http://dx.doi.org/
10.1037/0022-3514.59.6.1140.
Lee, S. W. S., Schwarz, N., Taubman, D., & Hou, M.
(2010). Sneezing in times of a flu pandemic: Pub-
lic sneezing increases perception of unrelated risks and
shifts preferences for federal spending. Psychologi-
cal Science, 21(3), 375–377. http://dx.doi.org/10.1177/
0956797609359876.
Lefebvre, M., Vieider, F. M., & Villeval, M. C. (2010).
The ratio bias phenomenon: Fact or artifact? Theory
and Decision, 71(4), 615–641. http://dx.doi.org/10.
1007/s11238-010-9212-9.
Liberali, J. M., Reyna, V. F., Furlan, S., Stein, L. M., &
Pardo, S. T. (2012). Individual differences in numer-
acy and cognitive reflection, with implications for bi-
ases and fallacies in probability judgment. Journal of
Behavioral Decision Making, 25(4), 361–381. http://
dx.doi.org/10.1002/bdm.752.
Loewenstein, G. F., Weber, E. U., Hsee, C. K., &
Welch, N. (2001). Risk as feelings. Psychological
Bulletin, 127(2), 267–286. http://dx.doi.org/10.1037//
0033-2909.127.2.267.
Mason, W., & Suri, S. (2012). Conducting behavioral
research on Amazon’s Mechanical Turk. Behavior
Research Methods, 44(1), 1–23. http://dx.doi.org/10.
3758/s13428-011-0124-6.
Nelson, W. L., Moser, R. P., & Han, P. K. J. (2013). Ex-
ploring objective and subjective numeracy at a popula-
tion level: Findings from the 2007 Health Information
National Trends Survey (HINTS). Journal of Health
Communication, 18(2), 192–205. http://dx.doi.org/10.
1080/10810730.2012.688450.
Obrecht, N. A., Chapman, G. B., & Gelman, R. (2009).
An encounter frequency account of how experience
affects likelihood estimation. Memory & Cognition,
37(5), 632–643. http://dx.doi.org/10.3758/MC.37.5.
632.
Paolacci, G., Chandler, J., & Ipeirotis, P. G. (2010).
Running experiments on Amazon Mechanical Turk.
Judgment and Decision Making, 5(5), 411–419.
Retrieved from http://journal.sjdm.org/10/10630a/
jdm10630a.pdf.
Peters, E. (2008). Numeracy and the perception and com-
munication of risk. Annals of the New York Academy of

Judgment and Decision Making, Vol. 10, No. 3, May 2015 How narratives bias risk perceptions 260
Sciences, 1128, 1–7. http://dx.doi.org/10.1196/annals.
1399.001.
Peters, E. & Bjalkebring, P. (2014). Multiple numeric
competencies: When a number is not just a number.
Journal of Personality and Social Psychology. Ad-
vance online publication. http://dx.doi.org/10.1037/
pspp0000019.
Reyna, V. F. (2008). A theory of medical decision mak-
ing and health: Fuzzy trace theory. Medical Decision
Making, 28(6), 850–865. http://dx.doi.org/10.1177/
0272989X08327066.
Reyna, V. F. (2012). Risk perception and communication
in vaccination decisions: a fuzzy-trace theory approach.
Vaccine, 30(25), 3790–3797. http://dx.doi.org/10.1016/
j.vaccine.2011.11.070.
Reyna, V. F., & Brainerd, C. J. (2008). Numeracy, ratio
bias, and denominator neglect in judgments of risk and
probability. Learning and Individual Differences, 18(1),
89–107. http://dx.doi.org/10.1016/j.lindif.2007.03.011.
Reyna, V. F., Nelson, W. L., Han, P. K., & Dieckmann,
N. F. (2009). How numeracy influences risk compre-
hension and medical decision making. Psychological
Bulletin, 135(6), 943–973. http://dx.doi.org/10.1037/
a0017327.
Rozin, P., & Royzman, E. B. (2001). Negativity bias, neg-
ativity dominance, and contagion. Personality and So-
cial Psychology Review, 5(4), 296–320. http://dx.doi.
org/10.1207/S15327957PSPR0504_2.
Schwartz, L. M. L., Woloshin, S. S., Black, W. C.
W., & Welch, H. G. H. (1997). The role of numer-
acy in understanding the benefit of screening mam-
mography. Annals of Internal Medicine, 127(11),
966–972. http://dx.doi.org/10.7326/0003-4819-127-
11-199712010-00003.
Schwarz, N. (1999). Self-reports: How the questions
shape the answers. American Psychologist, 54(2), 93–
105. http://dx.doi.org/10.1037/0003-066X.54.2.93.
Schwarz, N. (2007). Cognitive aspects of survey method-
ology. Applied Cognitive Psychology, 21(2), 277–287.
http://dx.doi.org/10.1002/acp.1340.
Siegrist, M., & Cvetkovich, G. (2001). Better negative
than positive? Evidence of a bias for negative infor-
mation about possible health dangers. Risk Analysis,
21(1), 199–206. http://dx.doi.org/10.1111/0272-4332.
211102.
Skowronski, J. J., & Carlston, D. E. (1989). Negativity
and extremity biases in impression formation: A review
of explanations. Psychological Bulletin, 105(1), 131–
142. http://dx.doi.org/10.1037/0033-2909.105.1.131.
Slovic, P., Finucane, M. L., Peters, E., & MacGregor, D.
G. (2004). Risk as analysis and risk as feelings: Some
thoughts about affect, reason, risk, and rationality. Risk
Analysis, 24(2), 311–322. http://dx.doi.org/10.1111/j.
0272-4332.2004.00433.x.
Slovic, P., Fischhoff, B, & Lichtenstein, S. (1979). Rating
the risks. Environment, 21(3), 14-20, 36-39.
Ubel, P. A., Jepson, C., & Baron, J. (2001). The inclusion
of patient testimonials in decision aids effects on treat-
ment choices. Medical Decision Making, 21(1), 60–68.
http://dx.doi.org/10.1177/0272989X0102100108.
van Gelder, J.-L., de Vries, R. E., & van der Pligt, J.
(2009). Evaluating a dual-process model of risk: Affect
and cognition as determinants of risky choice. Journal
of Behavioral Decision Making, 22(1), 45–61. http://
dx.doi.org/10.1002/bdm.610.
Weber, E., & Hilton, D. (1990). Contextual effects in
the interpretations of probability words: Perceived base
rate and severity of events. Journal of Experimen-
tal Psychology: Human Perception and Performance,
16(4), 781–789. http://dx.doi.org/10.1037/0096-1523.
16.4.781.
Webster, M. M., & Laland, K. N. (2008). Social learning
strategies and predation risk: Minnows copy only when
using private information would be costly. Proceedings
of the Royal Society B: Biological Sciences, 275(1653),
2869–2876. http://dx.doi.org/10.1098/rspb.2008.0817.
Weinstein, N. D., & Diefenbach, M. A. (1997). Percentage
and verbal category measures of risk likelihood. Health
Education Research, 12(1), 139–141. http://dx.doi.org/
10.1093/her/12.1.139.
Weinstein, N. D., Kwitel, A., McCaul, K. D., Magnan, R.
E., Gerrard, M., & Gibbons, F. X. (2007). Risk percep-
tions: Assessment and relationship to influenza vacci-
nation. Health Psychology, 26(2), 146–151. http://dx.
doi.org/10.1037/0278-6133.26.2.146.
Windschitl, P. D. (2002). Judging the accuracy of a like-
lihood judgment: The case of smoking risk. Journal of
Behavioral Decision Making, 15(1), 19–35. http://dx.
doi.org/10.1002/bdm.401.
Windschitl, P. D., Martin, R., & Flugstad, A. R. (2002).
Context and the interpretation of likelihood informa-
tion: The role of intergroup comparisons on perceived
vulnerability. Journal of Personality and Social Psy-
chology, 82(5), 742–755. http://dx.doi.org/10.1037//
0022-3514.82.5.742.
Windschitl, P. D., & Wells, G. L. (1996). Measuring
psychological uncertainty: Verbal versus numeric meth-
ods. Journal of Experimental Psychology: Applied,
2(4), 343–364. http://dx.doi.org/10.1037//1076-898X.
2.4.343.
Zacks, R. T., & Hasher, L. (2002). Frequency processing:
A twenty-five year perspective. In P. Sedlmeier & T.
Betsch (Eds.), Etc. Frequency processing and cognition
(pp. 21–36). Oxford, England: University Press.

Judgment and Decision Making, Vol. 10, No. 3, May 2015 How narratives bias risk perceptions 261
Appendix A: Sample narratives used
in both experiments
Note that in Experiment 1 the materials were in German.
Negative narratives
Hi everyone! Well I just got my dysomeria shot at my
family doctor’s office in town. I got an appointment right
away and had no adverse effects whatsoever. Everything
went just fine and was easy. So, all in all, no reason to
complain or worry. John
My doctor had told me that I should get vaccinated
against dysomeria. Well I’m not really a fan of needles,
but last week I just went and got it over with. Afterwards:
no problems at all and I actually went to the gym to do
my regular work out right afterwards. No biggie. Sarah
Positive narratives
Well, I went to the doctor a week ago to get my dysomeria
immunization. Usually I’m not very fragile but after this
shot I felt dizzy for days and could hardly ride my bike.
Let me tell you, not very appealing to constantly stagger
trying not to fall over all the time! Julie
I had about a week of fever after my dysomeria vac-
cination. I do not know if that was a side effect but I was
confined to the bed for quite a while and could hardly
move a muscle. I’m just glad it’s over now and I can get
back to normal life. Bill
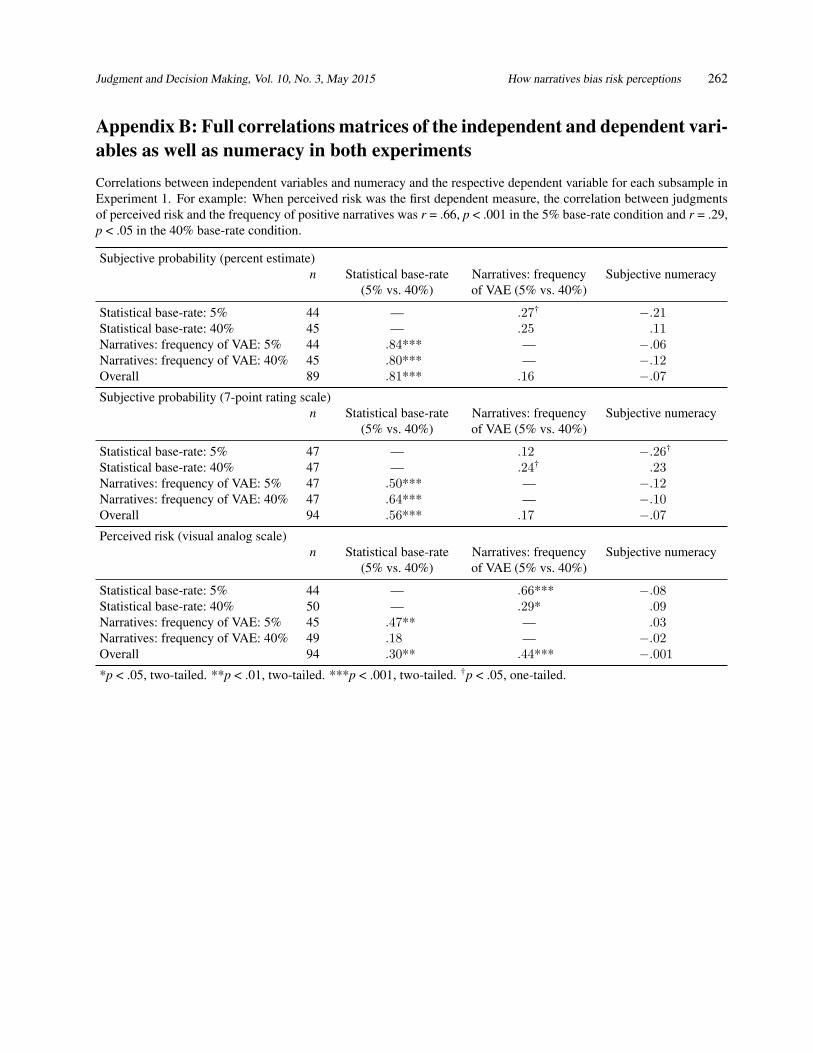
Judgment and Decision Making, Vol. 10, No. 3, May 2015 How narratives bias risk perceptions 262
Appendix B: Full correlations matrices of the independent and dependent vari-
ables as well as numeracy in both experiments
Correlations between independent variables and numeracy and the respective dependent variable for each subsample in
Experiment 1. For example: When perceived risk was the first dependent measure, the correlation between judgments
of perceived risk and the frequency of positive narratives was r = .66, p < .001 in the 5% base-rate condition and r = .29,
p < .05 in the 40% base-rate condition.
Subjective probability (percent estimate)
n Statistical base-rate
(5% vs. 40%)
Narratives: frequency
of VAE (5% vs. 40%)
Subjective numeracy
Statistical base-rate: 5% 44 — .27† −.21
Statistical base-rate: 40% 45 — .25 .11
Narratives: frequency of VAE: 5% 44 .84*** — −.06
Narratives: frequency of VAE: 40% 45 .80*** — −.12
Overall 89 .81*** .16 −.07
Subjective probability (7-point rating scale)
n Statistical base-rate
(5% vs. 40%)
Narratives: frequency
of VAE (5% vs. 40%)
Subjective numeracy
Statistical base-rate: 5% 47 — .12 −.26†
Statistical base-rate: 40% 47 — .24† .23
Narratives: frequency of VAE: 5% 47 .50*** — −.12
Narratives: frequency of VAE: 40% 47 .64*** — −.10
Overall 94 .56*** .17 −.07
Perceived risk (visual analog scale)
n Statistical base-rate
(5% vs. 40%)
Narratives: frequency
of VAE (5% vs. 40%)
Subjective numeracy
Statistical base-rate: 5% 44 — .66*** −.08
Statistical base-rate: 40% 50 — .29* .09
Narratives: frequency of VAE: 5% 45 .47** — .03
Narratives: frequency of VAE: 40% 49 .18 — −.02
Overall 94 .30** .44*** −.001
*p < .05, two-tailed. **p < .01, two-tailed. ***p < .001, two-tailed. †p < .05, one-tailed.

Judgment and Decision Making, Vol. 10, No. 3, May 2015 How narratives bias risk perceptions 263
Correlations between independent variables and numeracy and the respective dependent variable for each subsample in
Experiment 2.
Subjective probability (percent estimate)
n Sample size
(10 vs. 20)
Narratives: frequency of VAE
(10% vs. 20% vs. 40%)
Numeracy
Sample size: 10 88 — .23* −.09
Sample size: 20 93 — −.04 .03
Narratives: frequency of VAE: 10% 61 .12 — .09
Narratives: frequency of VAE: 20% 61 −.10 — −.06
Narratives: frequency of VAE: 40% 59 −.19 — −.17
Overall 181 −.04 .10 −.04
Perceived risk (visual analog scale)
n Sample size
(10 vs. 20)
Narratives: frequency of VAE
(10% vs. 20% vs. 40%)
Numeracy
Sample size: 10 83 — .31** −.11
Sample size: 20 85 — .46*** −.17
Narratives: frequency of VAE: 10% 55 .07 — −.08
Narratives: frequency of VAE: 20% 60 −.31* — −.02
Narratives: frequency of VAE: 40% 53 .05 — −.27*
Overall 168 −.07 .38*** −.14†
*p < .05, two-tailed. **p < .01, two-tailed. ***p < .001, two-tailed. †p < .05, one-tailed.

Judgment and Decision Making, Vol. 10, No. 3, May 2015 How narratives bias risk perceptions 264
Appendix C: Correlations between dependent measures and intention to get
vaccinated
Correlations between subjective probability (percent esti-
mate, 7-point rating scale), perceived risk, and intention to
get vaccinated for the full sample and the respective sub-
samples in Experiment 1.
Full sample
N = 277 Percent 7-point Risk Intention
Percent —
7-point .70*** —
Risk .61*** .74*** —
Intention −.22*** −.34*** −.43*** —
Subjective probability (percent estimate)
n = 89 Percent 7-point Risk Intention
Percent —
7-point .75*** —
Risk .69*** .83*** —
Intention −.31** −.42*** −.47*** —
Subjective probability (7-point rating scale)
n = 94 Percent 7-point Risk Intention
Percent —
7-point .66*** —
Risk .64*** .74*** —
Intention −.24* −.33** −.53*** —
Perceived risk (visual analog scale)
n = 94 Percent 7-point Risk Intention
Percent —
7-point .69*** —
Risk .49*** .64*** —
Intention −.11 −.28** −.31** —
Note. The correlation matrix for the full sample is in-
cluded again (see Table 3) to facilitate comparison.
*p < .05. **p < .01. ***p < .001.
Correlations between subjective probability, perceived
risk, and intention to get vaccinated for the full sample
and the respective subsamples in Experiment 2.
Full sample
N = 464 Percent Risk Intention
Percent —
Risk .22*** —
Intention .01 −.41*** —
Subjective probability (percent estimate)
n = 181 Percent Risk Intention
Percent —
Risk .05 —
Intention .02 −.48*** —
Perceived risk (visual analog scale)
n = 283 Percent Risk Intention
Percent —
Risk .31*** —
Intention −.004 −.37*** —
Note. The subsample that judged perceived risk first
includes the subjects from the two subdesigns.
*p < .05. **p < .01. ***p < .001.
![· 2018. 10. 20. · 13. What are the methods for biasing? [MAY/JUNE-09,10][ NOV/DEC-09,12] The transistor needs two bias voltages V BB and V CC. The V BB supply is used for biasing](https://img.pdfslide.net/doc/110x75/5fee5803750297196f0e8b6e/2018-10-20-13-what-are-the-methods-for-biasing-mayjune-0910-novdec-0912.jpg)


![Chapter 5 BJT Biasing Circuits Engineering/833... · 2017. 12. 8. · BJT Biasing Circuits 5.1 The DC Operation Point [5] DC Bias: Bias establishes the dc operating point for proper](https://img.pdfslide.net/doc/110x75/6109b3612d57d967952ea81a/chapter-5-bjt-biasing-circuits-engineering833-2017-12-8-bjt-biasing-circuits.jpg)