Embed Size (px)
Citation preview
RESEARCH Open Access
The national employment guarantee scheme andinequities in household spending on food andnon-food determinants of health in rural IndiaTR Dilip1, Rakhi Dandona1 and Lalit Dandona1,2*
Abstract
Introduction: Inequities in a population in spending on food and non-food items can contribute to disparities inhealth status. The Mahatma Gandhi National Rural Employment Guarantee Scheme (MGNREGS) was launched inrural India in 2006, aimed at providing at least 100 days of manual work to a member in needy households.
Methods: We used nationally representative data from the consumer expenditure surveys of 2004–05 and 2009–10and the employment survey of 2009–10 conducted by National Sample Survey Organisation to assess the effect ofMGNREGS in reducing inequities in consumption of food and non-food items between poor and non-poorhouseholds in the states of India. Variations among the states in implementation of MGNREGS were examined usingthe employment and unemployment survey data, and compared with official programme data up to 2012–13.Inequity in spending on food and non-food items was assessed using the ratio of monthly per capita consumerexpenditure (MPCE) between the most vulnerable (labourer) and least vulnerable categories of households.
Results: The survey data suggested 1.42 billion person-days of MGNRGES employment in the 2009–10 financial year,whereas the official programme data reported 2.84 billion person-days. According to the official data, the person-daysof MGNRGES employment decreased by 43.3% from 2009–10 to 2012–13 for the 9 large less developed states of India.Survey data revealed that the average number of MGNREGS work days in a year per household varied from 42 days inRajasthan to less than 10 days in 14 of the 20 major states in India in 2009–10. Rajasthan with the highestimplementation of MGNRGES among the 9 less developed states of India had the highest relative decline of 10.4% inthe food spending inequity from 2004–05 to 2009–10 between the most vulnerable and less vulnerable households.The changes in inequity for non-food spending did not have any particular pattern across the less developed states. Inthe most vulnerable category, the households in Rajasthan that got 100 or more days of work in a year underMGNREGS had a 25.9% increase in MPCE.
Conclusion: MGNREGS seems to have contributed to the reduction in food consumption inequity in rural Rajasthan in2009–10, and has the potential of making a similar contribution with higher level of implementation of thisprogramme in other states. Non-food consumption inequities benefited less from MGNRGES until 2009–10. Thereported decrease in the MGNRGES employment person-days in the less developed states of India from 2009–10 to2012–13 is of concern.
Keywords: Consumption expenditure, Employment scheme, Food, Health, India, Inequity
* Correspondence: [email protected] Health Foundation of India, ISID Campus, 4 Institutional Area, VasantKunj, New Delhi 110070, India2Institute for Health Metrics and Evaluation, University of Washington, 2301Fifth Avenue, Suite 600, Seattle, WA 98103, USA
© 2013 Dilip et al.; licensee BioMed Central Ltd. This is an open access article distributed under the terms of the CreativeCommons Attribution License (http://creativecommons.org/licenses/by/2.0), which permits unrestricted use, distribution, andreproduction in any medium, provided the original work is properly cited.
Dilip et al. International Journal for Equity in Health 2013, 12:84http://www.equityhealthj.com/content/12/1/84
BackgroundDisparities in health status among sub-groups in apopulation are influenced by broader determinants,commonly referred to as social determinants of health[1]. Accordingly, reduction in differences in basic livingconditions between different population groups in a coun-try could contribute to reduction of health inequalities.The Government of India legislated the Mahatma GandhiNational Rural Employment Guarantee Act in 2005 whichguarantees at least 100 days of wage employment in afinancial year to every household where an adult mem-ber volunteers to do unskilled manual work [2]. TheMahatma Gandhi National Employment Guarantee Scheme(MGNREGS) was started in a phased manner in 2006 andis now operational in rural areas of all districts in India sinceApril 2008. According to the official data, this social protec-tion scheme provided 2.25 billion days of employment toabout 50 million households in the year 2012–13 withan estimated expenditure of Indian Rupees 393 billion(US$ 7.2 billion) [3]. The level of participation in MGNREGShas been noted to be relatively higher among the poor andthe socially vulnerable sections of the population as thisscheme offers unskilled manual labour employment [4,5].Previous studies have suggested that in addition to
directly increasing household income of the beneficiary,MGNREGS may also be contributing to improving work-ing conditions in labour market through increasing thebargaining power of poor men and women, reducing tem-porary migration for work from rural areas, and reducingwage gaps between males and females [5-10]. It has alsobeen suggested that this employment scheme has contrib-uted to improvements in schooling of girl children in thebeneficiary households [9]. The potential of MGNREGS tocontribute to improving food and non-food consumptionthat could reduce health inequities in the population hasnot yet been reported. In this paper we report this analysisusing data from the national employment and consumerexpenditure surveys conducted by the National SampleSurvey Organisation of India.
MethodsDataWe used data from the following nationwide surveys of theNational Sample Survey Organisation (NSSO): consumerexpenditure surveys of 2004–05 and 2009–10, and the em-ployment and unemployment survey of 2009–10 [4,11,12].The consumer expenditure survey of 2004–05 representsthe pre-MGNREGS period and the 2009–10 consumersurvey represents the post-MGNREGS period. These sur-veys used stratified multistage sampling of householdswith the aim of having the sample representative of eachstate of India. The 2004–05 consumer expenditure surveyhad a sample of 79,298 rural households in India and the2009–10 survey had a sample of 59,097 rural households.
These consumer surveys provide data on expenditureby each sampled household and the break-up of thisexpenditure by several categories. Food expenditure isavailable by cereals, pulses, milk and milk products,sugar, salt, edible oil, egg, fish and meat, vegetables,fresh fruits, dry fruits, spices and beverages. Non-fooditems include expenses on pan, tobacco, intoxicants, fueland light, clothing, bedding, footwear education, medical(inpatient and outpatient separately), entertainment,minor durable type goods, toilet articles, other house-hold consumables, consumer services, conveyance, rent,consumer taxes and cess, and purchase and construction(including maintenance and repair) of various durablegoods for domestic use. The reference period for collec-tion of consumption expenditure data from householdswas 365 days for education, inpatient treatment, clothing,bedding, footwear and durable goods. For all other itemsthe reference period was 30 days.The 2009–10 consumer expenditure survey did not ask
whether the household participated in MGNREGS. Datafrom NSSO’s nationwide employment and unemploymentsurvey of 2009–10, which included 59,128 rural householdsand documented participation in MGNREGS, were usedto study the differentials in consumption of food andnon-food items between beneficiaries of this scheme andthe non-beneficiaries. This survey provides data on whetherhouseholds registered for MGNREGS, the number of daysof work received in a year by a household under MGNREGSand details of the consumption expenditure by eachhousehold. We compared the person-days of employmentdue to MGNREGS estimated from the employment andunemployment survey of 2009–10 with those reportedby the official programme data [3], and the change from2009–10 to 2012–13 reported by the official data.The NSSO surveys classify sample households based on
its major source of income (that contributes more than50% of household income) in these categories [4]: laboureragriculture, labourer non-agriculture, self-employed agri-culture, self-employed non-agriculture, others. Based onthe anticipated economic vulnerability of these categor-ies, we considered these three categories for our analysisrepresenting the highest to the lowest vulnerability inthis order: labourer (agriculture and non-agriculture),self-employed agriculture, and others (self-employednon-agriculture and others).
Assessment of inequitiesInequity was defined as the ratio of household monthlyper capita expenditure (MPCE) between the least and mostvulnerable occupation categories (others and labourers,respectively). The impact of MGNREGS in reducinginequities in the household monthly per capita expenditurewas examined for all commodities together, all fooditems, and all non-food items. In addition, the impact
Dilip et al. International Journal for Equity in Health 2013, 12:84 Page 2 of 11http://www.equityhealthj.com/content/12/1/84
was assessed separately for the cereal and non-cerealfood items, as cereals are relatively less expensive basicfood whereas non-cereal items are more expensive.With non-cereal food items, we also assessed the impact onthe sub-category of milk, fruits and their products, whichare generally procured after the need for other essentialfood items is met. Among the non-food items we alsoassessed the impact on expenditure for medical careand education separately.We examined variations in implementation of MGNREGS
across 19 large states of India with population more than10 million in the 2011 census. The inequity analysiswas restricted to nine less developed states that havebeen identified by the Government of India for specialfocus while implementing health programmes [13], whichinclude Assam, Bihar, Chhattisgarh, Jharkhand, MadhyaPradesh, Odisha, Rajasthan, Uttar Pradesh and UttaranchalThe changes in monthly MPCE and the expenditureinequity for food and non-food items across these stateswere assessed using the consumer expenditure surveys of2004–05 (pre-MGNREGS) and 2009–10 (post-MGNREGS).Constant prices for 2004–05 were used for the compari-sons. Percent change in the inequity ratio from 2004–05 to2009–10 was computed. A change was defined as statisti-cally significant if the 95% confidence intervals of the esti-mates for 2004–05 and 2009–10 did not overlap.
Assessment of consumption expenditure trendsin RajasthanRajasthan was the only Indian state where more than 50percent of the rural households had participated inMGNREGS as estimated from the employment survey2009–10 data [4]. More detailed analysis of the con-sumption patterns of the various occupation categories,and the changes from 2004–05 to 2009–10 was there-fore done for Rajasthan using data from the two roundsof consumption surveys.Using the employment survey data for 2009–10, we
assessed participation of the various occupation categoriesin MGNRGES. We estimated the potential contributionof MGNREGS to the rise in MPCE for a household bymultiplying the average number of work days availed bythat household through MGNREGS in a month with thewage rate for a day’s work under MGNRGES in 2009–10 for Rajasthan (INR 100). This was done for the vari-ous categories of occupations. We assumed that thewages earned through MGNRGES were all spent onconsumption, as the potential to save from this mini-mum wage is considered quite limited [14].
ResultsImplementation of MGNREGS across Indian StatesThe number of person-days of employment due toMGNREGS estimated from the NSSO employment and
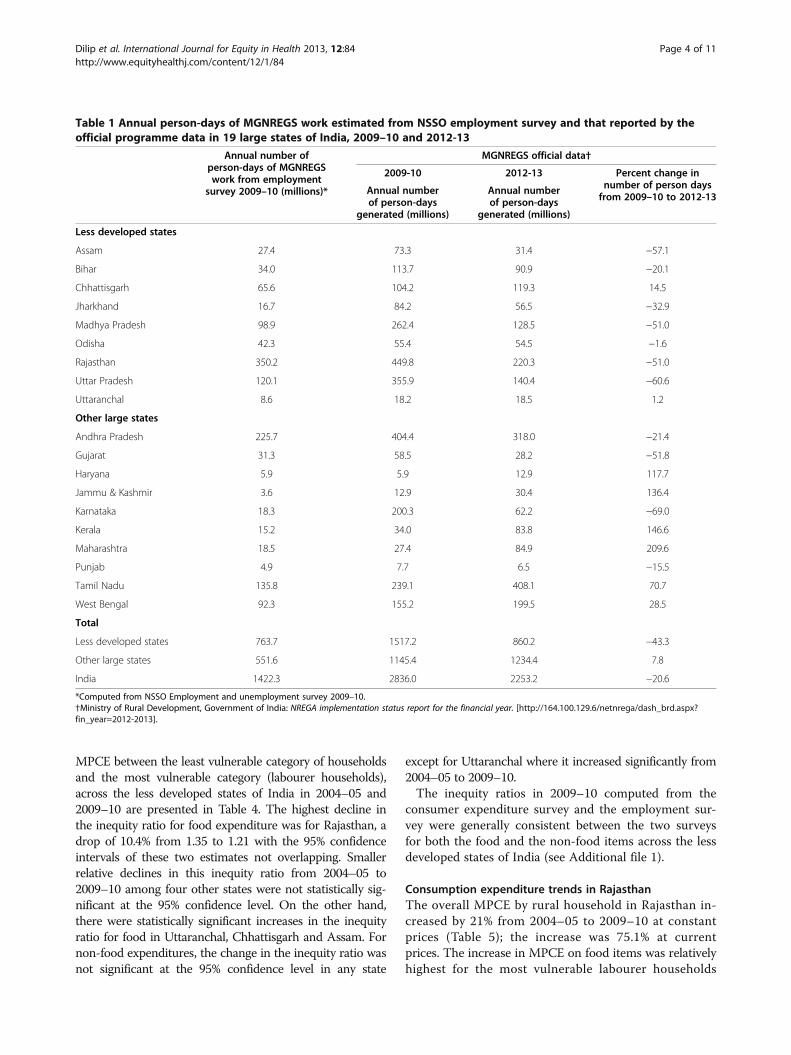
unemployment survey was 1.42 billion in India for the2009–10 financial year, which was half of the 2.84 billionperson-days reported by the official programme data(Table 1). The number of person-days of MGNREGSemployment reported by the official data for 2012–13was 2.25 billion, a 20.6% decrease from that reported for2009–10 by the official data. Interestingly, these officialdata report a 43.3% decrease in the number of person-daysof MGNREGS employment in the nine less developedstates from 2009–10 to 2012–13, as compared with a 7.8%increase in the other large ten states of India (Table 1).According to the NSSO employment survey data, of
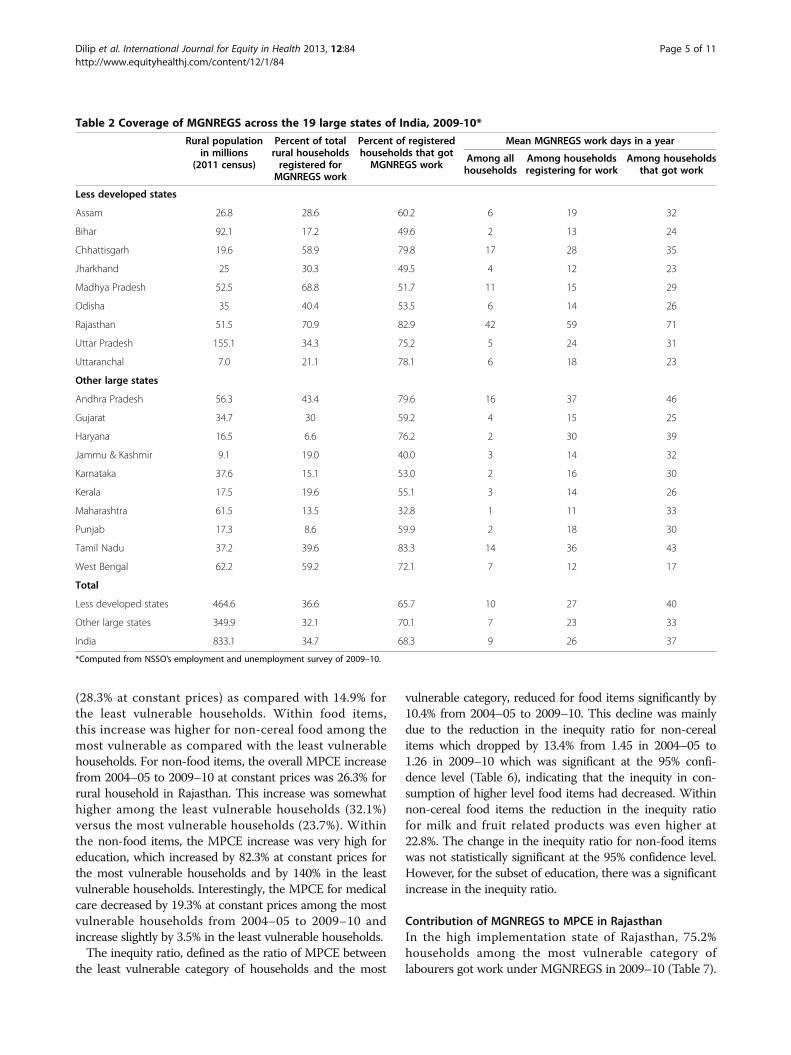
the rural households in states across India, 34.7% hadregistered for work under the MGNREGS in 2009–10(Table 2). This proportion varied from a high of 71% inRajasthan to a low of 6.6% in Haryana. While 24.2% ofthe total rural households in India were able to get workunder MGNREGS in 2009–10, Rajasthan with 59% andChhattisgarh with 47.9% were able to provide work forsubstantial proportion of rural households, while otherstates had lower coverage. Of the households registeredfor MGNRGES work, the proportion getting work wasvariable across the states, with Rajasthan the highestamong the less developed states. Overall, in the less de-veloped states, 65.6% of the rural households registeredfor MGNRGES got work through this programme withan average of 27 person-days per household in a year.The corresponding figures for the other states were79% of registered households and 23 person-days perhousehold in a year.Though the objective of MGNREGS is to provide
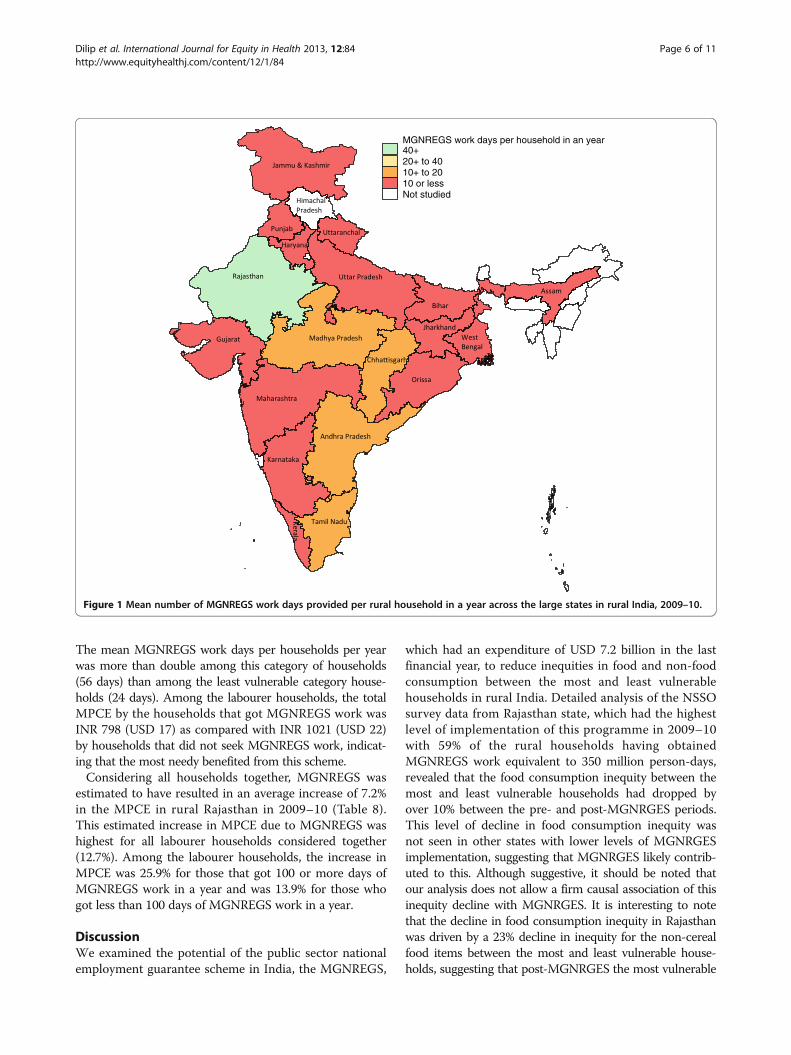
100 days of unskilled manual labour to households willingto do work in a year, none of the states were close toachieving this target. Rajasthan provided 71 work days onaverage to the households that got work under MGNREGS,which was the highest, with the next highest being 46work days on average in Andhra Pradesh. Consideringall rural household in each state, the average days ofMGNREGS work provided to a household in a year washighest for Rajasthan at 42, with Chhattisgarh a distantsecond at 17 days; 14 of the 19 large states provided lessthan 10 days of work on average for each rural household(Table 2, Figure 1). These findings reveal that amongthe less developed states of India only Rajasthan hadclose to reasonable coverage of MGNREGS among therural household in 2009–10.
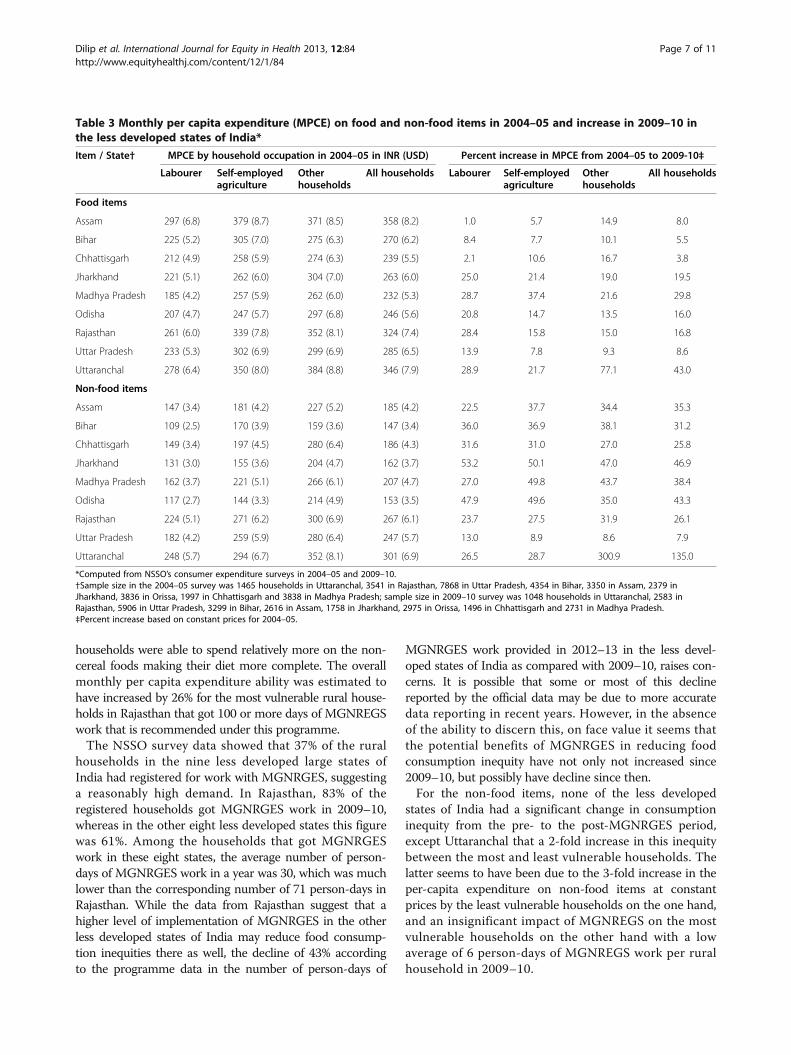
Inequities in food and non-food expenditure across lessdeveloped statesTable 3 shows the MPCE on food and non-food itemsacross the less developed states of India in 2004–05 andthe percent increase to 2009–10 at constant prices amonghousehold in the three categories of occupations used inour analysis. The inequity ratios, defined as the ratio of
Dilip et al. International Journal for Equity in Health 2013, 12:84 Page 3 of 11http://www.equityhealthj.com/content/12/1/84
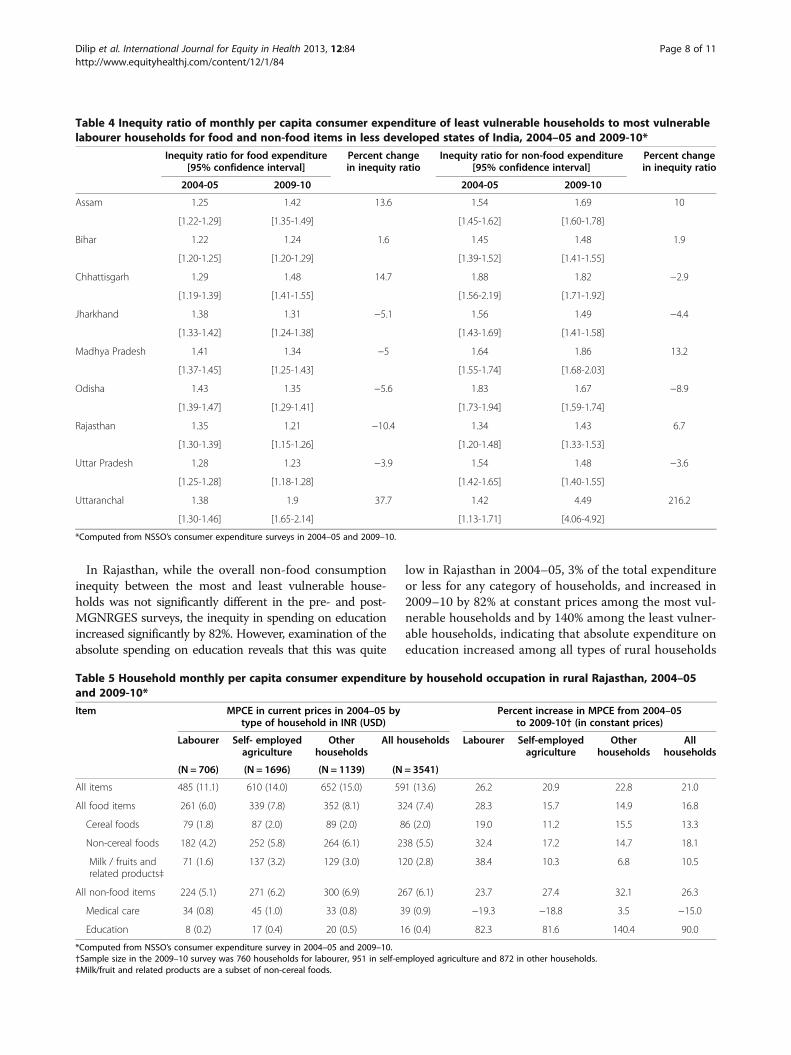
MPCE between the least vulnerable category of householdsand the most vulnerable category (labourer households),across the less developed states of India in 2004–05 and2009–10 are presented in Table 4. The highest decline inthe inequity ratio for food expenditure was for Rajasthan, adrop of 10.4% from 1.35 to 1.21 with the 95% confidenceintervals of these two estimates not overlapping. Smallerrelative declines in this inequity ratio from 2004–05 to2009–10 among four other states were not statistically sig-nificant at the 95% confidence level. On the other hand,there were statistically significant increases in the inequityratio for food in Uttaranchal, Chhattisgarh and Assam. Fornon-food expenditures, the change in the inequity ratio wasnot significant at the 95% confidence level in any state
except for Uttaranchal where it increased significantly from2004–05 to 2009–10.The inequity ratios in 2009–10 computed from the
consumer expenditure survey and the employment sur-vey were generally consistent between the two surveysfor both the food and the non-food items across the lessdeveloped states of India (see Additional file 1).
Consumption expenditure trends in RajasthanThe overall MPCE by rural household in Rajasthan in-creased by 21% from 2004–05 to 2009–10 at constantprices (Table 5); the increase was 75.1% at currentprices. The increase in MPCE on food items was relativelyhighest for the most vulnerable labourer households
Table 1 Annual person-days of MGNREGS work estimated from NSSO employment survey and that reported by theofficial programme data in 19 large states of India, 2009–10 and 2012-13
Annual number ofperson-days of MGNREGSwork from employment
survey 2009–10 (millions)*
MGNREGS official data†
2009-10 2012-13 Percent change innumber of person daysfrom 2009–10 to 2012-13
Annual numberof person-days
generated (millions)
Annual numberof person-days
generated (millions)
Less developed states
Assam 27.4 73.3 31.4 −57.1
Bihar 34.0 113.7 90.9 −20.1
Chhattisgarh 65.6 104.2 119.3 14.5
Jharkhand 16.7 84.2 56.5 −32.9
Madhya Pradesh 98.9 262.4 128.5 −51.0
Odisha 42.3 55.4 54.5 −1.6
Rajasthan 350.2 449.8 220.3 −51.0
Uttar Pradesh 120.1 355.9 140.4 −60.6
Uttaranchal 8.6 18.2 18.5 1.2
Other large states
Andhra Pradesh 225.7 404.4 318.0 −21.4
Gujarat 31.3 58.5 28.2 −51.8
Haryana 5.9 5.9 12.9 117.7
Jammu & Kashmir 3.6 12.9 30.4 136.4
Karnataka 18.3 200.3 62.2 −69.0
Kerala 15.2 34.0 83.8 146.6
Maharashtra 18.5 27.4 84.9 209.6
Punjab 4.9 7.7 6.5 −15.5
Tamil Nadu 135.8 239.1 408.1 70.7
West Bengal 92.3 155.2 199.5 28.5
Total
Less developed states 763.7 1517.2 860.2 −43.3
Other large states 551.6 1145.4 1234.4 7.8
India 1422.3 2836.0 2253.2 −20.6
*Computed from NSSO Employment and unemployment survey 2009–10.†Ministry of Rural Development, Government of India: NREGA implementation status report for the financial year. [http://164.100.129.6/netnrega/dash_brd.aspx?fin_year=2012-2013].
Dilip et al. International Journal for Equity in Health 2013, 12:84 Page 4 of 11http://www.equityhealthj.com/content/12/1/84
(28.3% at constant prices) as compared with 14.9% forthe least vulnerable households. Within food items,this increase was higher for non-cereal food among themost vulnerable as compared with the least vulnerablehouseholds. For non-food items, the overall MPCE increasefrom 2004–05 to 2009–10 at constant prices was 26.3% forrural household in Rajasthan. This increase was somewhathigher among the least vulnerable households (32.1%)versus the most vulnerable households (23.7%). Withinthe non-food items, the MPCE increase was very high foreducation, which increased by 82.3% at constant prices forthe most vulnerable households and by 140% in the leastvulnerable households. Interestingly, the MPCE for medicalcare decreased by 19.3% at constant prices among the mostvulnerable households from 2004–05 to 2009–10 andincrease slightly by 3.5% in the least vulnerable households.The inequity ratio, defined as the ratio of MPCE between
the least vulnerable category of households and the most
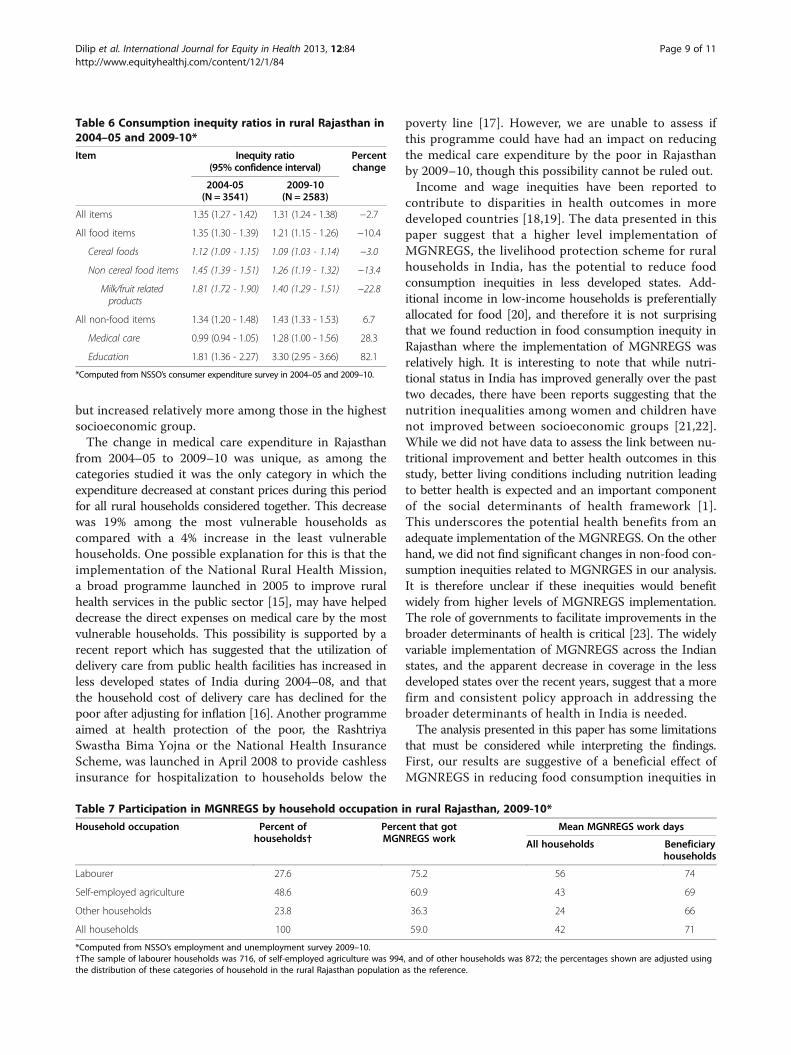
vulnerable category, reduced for food items significantly by10.4% from 2004–05 to 2009–10. This decline was mainlydue to the reduction in the inequity ratio for non-cerealitems which dropped by 13.4% from 1.45 in 2004–05 to1.26 in 2009–10 which was significant at the 95% confi-dence level (Table 6), indicating that the inequity in con-sumption of higher level food items had decreased. Withinnon-cereal food items the reduction in the inequity ratiofor milk and fruit related products was even higher at22.8%. The change in the inequity ratio for non-food itemswas not statistically significant at the 95% confidence level.However, for the subset of education, there was a significantincrease in the inequity ratio.
Contribution of MGNREGS to MPCE in RajasthanIn the high implementation state of Rajasthan, 75.2%households among the most vulnerable category oflabourers got work under MGNREGS in 2009–10 (Table 7).
Table 2 Coverage of MGNREGS across the 19 large states of India, 2009-10*
Rural populationin millions
(2011 census)
Percent of totalrural householdsregistered forMGNREGS work
Percent of registeredhouseholds that gotMGNREGS work
Mean MGNREGS work days in a year
Among allhouseholds
Among householdsregistering for work
Among householdsthat got work
Less developed states
Assam 26.8 28.6 60.2 6 19 32
Bihar 92.1 17.2 49.6 2 13 24
Chhattisgarh 19.6 58.9 79.8 17 28 35
Jharkhand 25 30.3 49.5 4 12 23
Madhya Pradesh 52.5 68.8 51.7 11 15 29
Odisha 35 40.4 53.5 6 14 26
Rajasthan 51.5 70.9 82.9 42 59 71
Uttar Pradesh 155.1 34.3 75.2 5 24 31
Uttaranchal 7.0 21.1 78.1 6 18 23
Other large states
Andhra Pradesh 56.3 43.4 79.6 16 37 46
Gujarat 34.7 30 59.2 4 15 25
Haryana 16.5 6.6 76.2 2 30 39
Jammu & Kashmir 9.1 19.0 40.0 3 14 32
Karnataka 37.6 15.1 53.0 2 16 30
Kerala 17.5 19.6 55.1 3 14 26
Maharashtra 61.5 13.5 32.8 1 11 33
Punjab 17.3 8.6 59.9 2 18 30
Tamil Nadu 37.2 39.6 83.3 14 36 43
West Bengal 62.2 59.2 72.1 7 12 17
Total
Less developed states 464.6 36.6 65.7 10 27 40
Other large states 349.9 32.1 70.1 7 23 33
India 833.1 34.7 68.3 9 26 37
*Computed from NSSO’s employment and unemployment survey of 2009–10.
Dilip et al. International Journal for Equity in Health 2013, 12:84 Page 5 of 11http://www.equityhealthj.com/content/12/1/84
The mean MGNREGS work days per households per yearwas more than double among this category of households(56 days) than among the least vulnerable category house-holds (24 days). Among the labourer households, the totalMPCE by the households that got MGNREGS work wasINR 798 (USD 17) as compared with INR 1021 (USD 22)by households that did not seek MGNREGS work, indicat-ing that the most needy benefited from this scheme.Considering all households together, MGNREGS was
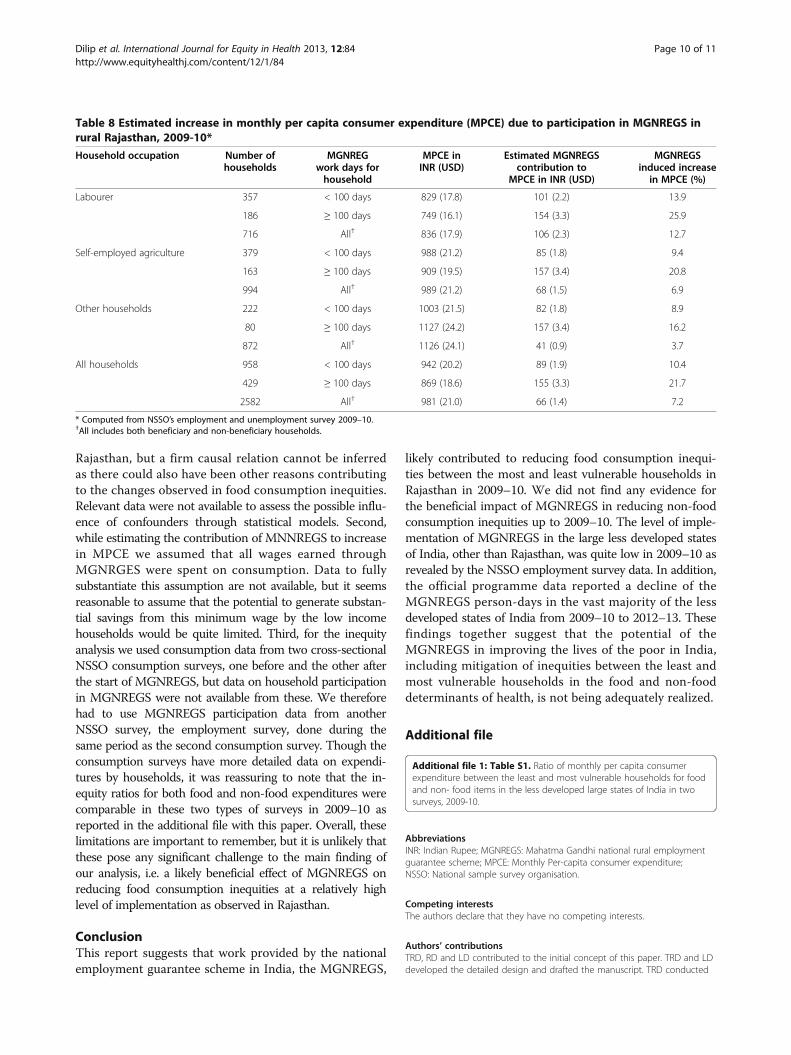
estimated to have resulted in an average increase of 7.2%in the MPCE in rural Rajasthan in 2009–10 (Table 8).This estimated increase in MPCE due to MGNREGS washighest for all labourer households considered together(12.7%). Among the labourer households, the increase inMPCE was 25.9% for those that got 100 or more days ofMGNREGS work in a year and was 13.9% for those whogot less than 100 days of MGNREGS work in a year.
DiscussionWe examined the potential of the public sector nationalemployment guarantee scheme in India, the MGNREGS,
which had an expenditure of USD 7.2 billion in the lastfinancial year, to reduce inequities in food and non-foodconsumption between the most and least vulnerablehouseholds in rural India. Detailed analysis of the NSSOsurvey data from Rajasthan state, which had the highestlevel of implementation of this programme in 2009–10with 59% of the rural households having obtainedMGNREGS work equivalent to 350 million person-days,revealed that the food consumption inequity between themost and least vulnerable households had dropped byover 10% between the pre- and post-MGNRGES periods.This level of decline in food consumption inequity wasnot seen in other states with lower levels of MGNRGESimplementation, suggesting that MGNRGES likely contrib-uted to this. Although suggestive, it should be noted thatour analysis does not allow a firm causal association of thisinequity decline with MGNRGES. It is interesting to notethat the decline in food consumption inequity in Rajasthanwas driven by a 23% decline in inequity for the non-cerealfood items between the most and least vulnerable house-holds, suggesting that post-MGNRGES the most vulnerable
MGNREGS work days per household in an year40+20+ to 4010+ to 2010 or lessNot studied
Figure 1 Mean number of MGNREGS work days provided per rural household in a year across the large states in rural India, 2009–10.
Dilip et al. International Journal for Equity in Health 2013, 12:84 Page 6 of 11http://www.equityhealthj.com/content/12/1/84
households were able to spend relatively more on the non-cereal foods making their diet more complete. The overallmonthly per capita expenditure ability was estimated tohave increased by 26% for the most vulnerable rural house-holds in Rajasthan that got 100 or more days of MGNREGSwork that is recommended under this programme.The NSSO survey data showed that 37% of the rural
households in the nine less developed large states ofIndia had registered for work with MGNRGES, suggestinga reasonably high demand. In Rajasthan, 83% of theregistered households got MGNRGES work in 2009–10,whereas in the other eight less developed states this figurewas 61%. Among the households that got MGNRGESwork in these eight states, the average number of person-days of MGNRGES work in a year was 30, which was muchlower than the corresponding number of 71 person-days inRajasthan. While the data from Rajasthan suggest that ahigher level of implementation of MGNRGES in the otherless developed states of India may reduce food consump-tion inequities there as well, the decline of 43% accordingto the programme data in the number of person-days of
MGNRGES work provided in 2012–13 in the less devel-oped states of India as compared with 2009–10, raises con-cerns. It is possible that some or most of this declinereported by the official data may be due to more accuratedata reporting in recent years. However, in the absenceof the ability to discern this, on face value it seems thatthe potential benefits of MGNRGES in reducing foodconsumption inequity have not only not increased since2009–10, but possibly have decline since then.For the non-food items, none of the less developed
states of India had a significant change in consumptioninequity from the pre- to the post-MGNRGES period,except Uttaranchal that a 2-fold increase in this inequitybetween the most and least vulnerable households. Thelatter seems to have been due to the 3-fold increase in theper-capita expenditure on non-food items at constantprices by the least vulnerable households on the one hand,and an insignificant impact of MGNREGS on the mostvulnerable households on the other hand with a lowaverage of 6 person-days of MGNREGS work per ruralhousehold in 2009–10.
Table 3 Monthly per capita expenditure (MPCE) on food and non-food items in 2004–05 and increase in 2009–10 inthe less developed states of India*
Item / State† MPCE by household occupation in 2004–05 in INR (USD) Percent increase in MPCE from 2004–05 to 2009-10‡
Labourer Self-employedagriculture
Otherhouseholds
All households Labourer Self-employedagriculture
Otherhouseholds
All households
Food items
Assam 297 (6.8) 379 (8.7) 371 (8.5) 358 (8.2) 1.0 5.7 14.9 8.0
Bihar 225 (5.2) 305 (7.0) 275 (6.3) 270 (6.2) 8.4 7.7 10.1 5.5
Chhattisgarh 212 (4.9) 258 (5.9) 274 (6.3) 239 (5.5) 2.1 10.6 16.7 3.8
Jharkhand 221 (5.1) 262 (6.0) 304 (7.0) 263 (6.0) 25.0 21.4 19.0 19.5
Madhya Pradesh 185 (4.2) 257 (5.9) 262 (6.0) 232 (5.3) 28.7 37.4 21.6 29.8
Odisha 207 (4.7) 247 (5.7) 297 (6.8) 246 (5.6) 20.8 14.7 13.5 16.0
Rajasthan 261 (6.0) 339 (7.8) 352 (8.1) 324 (7.4) 28.4 15.8 15.0 16.8
Uttar Pradesh 233 (5.3) 302 (6.9) 299 (6.9) 285 (6.5) 13.9 7.8 9.3 8.6
Uttaranchal 278 (6.4) 350 (8.0) 384 (8.8) 346 (7.9) 28.9 21.7 77.1 43.0
Non-food items
Assam 147 (3.4) 181 (4.2) 227 (5.2) 185 (4.2) 22.5 37.7 34.4 35.3
Bihar 109 (2.5) 170 (3.9) 159 (3.6) 147 (3.4) 36.0 36.9 38.1 31.2
Chhattisgarh 149 (3.4) 197 (4.5) 280 (6.4) 186 (4.3) 31.6 31.0 27.0 25.8
Jharkhand 131 (3.0) 155 (3.6) 204 (4.7) 162 (3.7) 53.2 50.1 47.0 46.9
Madhya Pradesh 162 (3.7) 221 (5.1) 266 (6.1) 207 (4.7) 27.0 49.8 43.7 38.4
Odisha 117 (2.7) 144 (3.3) 214 (4.9) 153 (3.5) 47.9 49.6 35.0 43.3
Rajasthan 224 (5.1) 271 (6.2) 300 (6.9) 267 (6.1) 23.7 27.5 31.9 26.1
Uttar Pradesh 182 (4.2) 259 (5.9) 280 (6.4) 247 (5.7) 13.0 8.9 8.6 7.9
Uttaranchal 248 (5.7) 294 (6.7) 352 (8.1) 301 (6.9) 26.5 28.7 300.9 135.0
*Computed from NSSO’s consumer expenditure surveys in 2004–05 and 2009–10.†Sample size in the 2004–05 survey was 1465 households in Uttaranchal, 3541 in Rajasthan, 7868 in Uttar Pradesh, 4354 in Bihar, 3350 in Assam, 2379 inJharkhand, 3836 in Orissa, 1997 in Chhattisgarh and 3838 in Madhya Pradesh; sample size in 2009–10 survey was 1048 households in Uttaranchal, 2583 inRajasthan, 5906 in Uttar Pradesh, 3299 in Bihar, 2616 in Assam, 1758 in Jharkhand, 2975 in Orissa, 1496 in Chhattisgarh and 2731 in Madhya Pradesh.‡Percent increase based on constant prices for 2004–05.
Dilip et al. International Journal for Equity in Health 2013, 12:84 Page 7 of 11http://www.equityhealthj.com/content/12/1/84
In Rajasthan, while the overall non-food consumptioninequity between the most and least vulnerable house-holds was not significantly different in the pre- and post-MGNRGES surveys, the inequity in spending on educationincreased significantly by 82%. However, examination of theabsolute spending on education reveals that this was quite
low in Rajasthan in 2004–05, 3% of the total expenditureor less for any category of households, and increased in2009–10 by 82% at constant prices among the most vul-nerable households and by 140% among the least vulner-able households, indicating that absolute expenditure oneducation increased among all types of rural households
Table 4 Inequity ratio of monthly per capita consumer expenditure of least vulnerable households to most vulnerablelabourer households for food and non-food items in less developed states of India, 2004–05 and 2009-10*
Inequity ratio for food expenditure Percent changein inequity ratio
Inequity ratio for non-food expenditure Percent changein inequity ratio[95% confidence interval] [95% confidence interval]
2004-05 2009-10 2004-05 2009-10
Assam 1.25 1.42 13.6 1.54 1.69 10
[1.22-1.29] [1.35-1.49] [1.45-1.62] [1.60-1.78]
Bihar 1.22 1.24 1.6 1.45 1.48 1.9
[1.20-1.25] [1.20-1.29] [1.39-1.52] [1.41-1.55]
Chhattisgarh 1.29 1.48 14.7 1.88 1.82 −2.9
[1.19-1.39] [1.41-1.55] [1.56-2.19] [1.71-1.92]
Jharkhand 1.38 1.31 −5.1 1.56 1.49 −4.4
[1.33-1.42] [1.24-1.38] [1.43-1.69] [1.41-1.58]
Madhya Pradesh 1.41 1.34 −5 1.64 1.86 13.2
[1.37-1.45] [1.25-1.43] [1.55-1.74] [1.68-2.03]
Odisha 1.43 1.35 −5.6 1.83 1.67 −8.9
[1.39-1.47] [1.29-1.41] [1.73-1.94] [1.59-1.74]
Rajasthan 1.35 1.21 −10.4 1.34 1.43 6.7
[1.30-1.39] [1.15-1.26] [1.20-1.48] [1.33-1.53]
Uttar Pradesh 1.28 1.23 −3.9 1.54 1.48 −3.6
[1.25-1.28] [1.18-1.28] [1.42-1.65] [1.40-1.55]
Uttaranchal 1.38 1.9 37.7 1.42 4.49 216.2
[1.30-1.46] [1.65-2.14] [1.13-1.71] [4.06-4.92]
*Computed from NSSO’s consumer expenditure surveys in 2004–05 and 2009–10.
Table 5 Household monthly per capita consumer expenditure by household occupation in rural Rajasthan, 2004–05and 2009-10*
Item MPCE in current prices in 2004–05 bytype of household in INR (USD)
Percent increase in MPCE from 2004–05to 2009-10† (in constant prices)
Labourer Self- employedagriculture
Otherhouseholds
All households Labourer Self-employedagriculture
Otherhouseholds
Allhouseholds
(N = 706) (N = 1696) (N = 1139) (N = 3541)
All items 485 (11.1) 610 (14.0) 652 (15.0) 591 (13.6) 26.2 20.9 22.8 21.0
All food items 261 (6.0) 339 (7.8) 352 (8.1) 324 (7.4) 28.3 15.7 14.9 16.8
Cereal foods 79 (1.8) 87 (2.0) 89 (2.0) 86 (2.0) 19.0 11.2 15.5 13.3
Non-cereal foods 182 (4.2) 252 (5.8) 264 (6.1) 238 (5.5) 32.4 17.2 14.7 18.1
Milk / fruits andrelated products‡
71 (1.6) 137 (3.2) 129 (3.0) 120 (2.8) 38.4 10.3 6.8 10.5
All non-food items 224 (5.1) 271 (6.2) 300 (6.9) 267 (6.1) 23.7 27.4 32.1 26.3
Medical care 34 (0.8) 45 (1.0) 33 (0.8) 39 (0.9) −19.3 −18.8 3.5 −15.0
Education 8 (0.2) 17 (0.4) 20 (0.5) 16 (0.4) 82.3 81.6 140.4 90.0
*Computed from NSSO’s consumer expenditure survey in 2004–05 and 2009–10.†Sample size in the 2009–10 survey was 760 households for labourer, 951 in self-employed agriculture and 872 in other households.‡Milk/fruit and related products are a subset of non-cereal foods.
Dilip et al. International Journal for Equity in Health 2013, 12:84 Page 8 of 11http://www.equityhealthj.com/content/12/1/84
but increased relatively more among those in the highestsocioeconomic group.The change in medical care expenditure in Rajasthan
from 2004–05 to 2009–10 was unique, as among thecategories studied it was the only category in which theexpenditure decreased at constant prices during this periodfor all rural households considered together. This decreasewas 19% among the most vulnerable households ascompared with a 4% increase in the least vulnerablehouseholds. One possible explanation for this is that theimplementation of the National Rural Health Mission,a broad programme launched in 2005 to improve ruralhealth services in the public sector [15], may have helpeddecrease the direct expenses on medical care by the mostvulnerable households. This possibility is supported by arecent report which has suggested that the utilization ofdelivery care from public health facilities has increased inless developed states of India during 2004–08, and thatthe household cost of delivery care has declined for thepoor after adjusting for inflation [16]. Another programmeaimed at health protection of the poor, the RashtriyaSwastha Bima Yojna or the National Health InsuranceScheme, was launched in April 2008 to provide cashlessinsurance for hospitalization to households below the
poverty line [17]. However, we are unable to assess ifthis programme could have had an impact on reducingthe medical care expenditure by the poor in Rajasthanby 2009–10, though this possibility cannot be ruled out.Income and wage inequities have been reported to
contribute to disparities in health outcomes in moredeveloped countries [18,19]. The data presented in thispaper suggest that a higher level implementation ofMGNREGS, the livelihood protection scheme for ruralhouseholds in India, has the potential to reduce foodconsumption inequities in less developed states. Add-itional income in low-income households is preferentiallyallocated for food [20], and therefore it is not surprisingthat we found reduction in food consumption inequity inRajasthan where the implementation of MGNREGS wasrelatively high. It is interesting to note that while nutri-tional status in India has improved generally over the pasttwo decades, there have been reports suggesting that thenutrition inequalities among women and children havenot improved between socioeconomic groups [21,22].While we did not have data to assess the link between nu-tritional improvement and better health outcomes in thisstudy, better living conditions including nutrition leadingto better health is expected and an important componentof the social determinants of health framework [1].This underscores the potential health benefits from anadequate implementation of the MGNREGS. On the otherhand, we did not find significant changes in non-food con-sumption inequities related to MGNRGES in our analysis.It is therefore unclear if these inequities would benefitwidely from higher levels of MGNREGS implementation.The role of governments to facilitate improvements in thebroader determinants of health is critical [23]. The widelyvariable implementation of MGNREGS across the Indianstates, and the apparent decrease in coverage in the lessdeveloped states over the recent years, suggest that a morefirm and consistent policy approach in addressing thebroader determinants of health in India is needed.The analysis presented in this paper has some limitations
that must be considered while interpreting the findings.First, our results are suggestive of a beneficial effect ofMGNREGS in reducing food consumption inequities in
Table 6 Consumption inequity ratios in rural Rajasthan in2004–05 and 2009-10*
Item Inequity ratio(95% confidence interval)
Percentchange
2004-05(N = 3541)
2009-10(N = 2583)
All items 1.35 (1.27 - 1.42) 1.31 (1.24 - 1.38) −2.7
All food items 1.35 (1.30 - 1.39) 1.21 (1.15 - 1.26) −10.4
Cereal foods 1.12 (1.09 - 1.15) 1.09 (1.03 - 1.14) −3.0
Non cereal food items 1.45 (1.39 - 1.51) 1.26 (1.19 - 1.32) −13.4
Milk/fruit relatedproducts
1.81 (1.72 - 1.90) 1.40 (1.29 - 1.51) −22.8
All non-food items 1.34 (1.20 - 1.48) 1.43 (1.33 - 1.53) 6.7
Medical care 0.99 (0.94 - 1.05) 1.28 (1.00 - 1.56) 28.3
Education 1.81 (1.36 - 2.27) 3.30 (2.95 - 3.66) 82.1
*Computed from NSSO’s consumer expenditure survey in 2004–05 and 2009–10.
Table 7 Participation in MGNREGS by household occupation in rural Rajasthan, 2009-10*
Household occupation Percent ofhouseholds†
Percent that gotMGNREGS work
Mean MGNREGS work days
All households Beneficiaryhouseholds
Labourer 27.6 75.2 56 74
Self-employed agriculture 48.6 60.9 43 69
Other households 23.8 36.3 24 66
All households 100 59.0 42 71
*Computed from NSSO’s employment and unemployment survey 2009–10.†The sample of labourer households was 716, of self-employed agriculture was 994, and of other households was 872; the percentages shown are adjusted usingthe distribution of these categories of household in the rural Rajasthan population as the reference.
Dilip et al. International Journal for Equity in Health 2013, 12:84 Page 9 of 11http://www.equityhealthj.com/content/12/1/84
Rajasthan, but a firm causal relation cannot be inferredas there could also have been other reasons contributingto the changes observed in food consumption inequities.Relevant data were not available to assess the possible influ-ence of confounders through statistical models. Second,while estimating the contribution of MNNREGS to increasein MPCE we assumed that all wages earned throughMGNRGES were spent on consumption. Data to fullysubstantiate this assumption are not available, but it seemsreasonable to assume that the potential to generate substan-tial savings from this minimum wage by the low incomehouseholds would be quite limited. Third, for the inequityanalysis we used consumption data from two cross-sectionalNSSO consumption surveys, one before and the other afterthe start of MGNREGS, but data on household participationin MGNREGS were not available from these. We thereforehad to use MGNREGS participation data from anotherNSSO survey, the employment survey, done during thesame period as the second consumption survey. Though theconsumption surveys have more detailed data on expendi-tures by households, it was reassuring to note that the in-equity ratios for both food and non-food expenditures werecomparable in these two types of surveys in 2009–10 asreported in the additional file with this paper. Overall, theselimitations are important to remember, but it is unlikely thatthese pose any significant challenge to the main finding ofour analysis, i.e. a likely beneficial effect of MGNREGS onreducing food consumption inequities at a relatively highlevel of implementation as observed in Rajasthan.
ConclusionThis report suggests that work provided by the nationalemployment guarantee scheme in India, the MGNREGS,
likely contributed to reducing food consumption inequi-ties between the most and least vulnerable households inRajasthan in 2009–10. We did not find any evidence forthe beneficial impact of MGNREGS in reducing non-foodconsumption inequities up to 2009–10. The level of imple-mentation of MGNREGS in the large less developed statesof India, other than Rajasthan, was quite low in 2009–10 asrevealed by the NSSO employment survey data. In addition,the official programme data reported a decline of theMGNREGS person-days in the vast majority of the lessdeveloped states of India from 2009–10 to 2012–13. Thesefindings together suggest that the potential of theMGNREGS in improving the lives of the poor in India,including mitigation of inequities between the least andmost vulnerable households in the food and non-fooddeterminants of health, is not being adequately realized.
Additional file
Additional file 1: Table S1. Ratio of monthly per capita consumerexpenditure between the least and most vulnerable households for foodand non- food items in the less developed large states of India in twosurveys, 2009-10.
AbbreviationsINR: Indian Rupee; MGNREGS: Mahatma Gandhi national rural employmentguarantee scheme; MPCE: Monthly Per-capita consumer expenditure;NSSO: National sample survey organisation.
Competing interestsThe authors declare that they have no competing interests.
Authors’ contributionsTRD, RD and LD contributed to the initial concept of this paper. TRD and LDdeveloped the detailed design and drafted the manuscript. TRD conducted
Table 8 Estimated increase in monthly per capita consumer expenditure (MPCE) due to participation in MGNREGS inrural Rajasthan, 2009-10*
Household occupation Number ofhouseholds
MGNREGwork days forhousehold
MPCE inINR (USD)
Estimated MGNREGScontribution to
MPCE in INR (USD)
MGNREGSinduced increase
in MPCE (%)
Labourer 357 < 100 days 829 (17.8) 101 (2.2) 13.9
186 ≥ 100 days 749 (16.1) 154 (3.3) 25.9
716 All† 836 (17.9) 106 (2.3) 12.7
Self-employed agriculture 379 < 100 days 988 (21.2) 85 (1.8) 9.4
163 ≥ 100 days 909 (19.5) 157 (3.4) 20.8
994 All† 989 (21.2) 68 (1.5) 6.9
Other households 222 < 100 days 1003 (21.5) 82 (1.8) 8.9
80 ≥ 100 days 1127 (24.2) 157 (3.4) 16.2
872 All† 1126 (24.1) 41 (0.9) 3.7
All households 958 < 100 days 942 (20.2) 89 (1.9) 10.4
429 ≥ 100 days 869 (18.6) 155 (3.3) 21.7
2582 All† 981 (21.0) 66 (1.4) 7.2
* Computed from NSSO’s employment and unemployment survey 2009–10.†All includes both beneficiary and non-beneficiary households.
Dilip et al. International Journal for Equity in Health 2013, 12:84 Page 10 of 11http://www.equityhealthj.com/content/12/1/84
the statistical analysis. All authors contributed to the interpretation of thefindings and agreed with the final version of the manuscript.
AcknowledgmentsThis research was supported by funding from the BUPA Foundation, UK.
Received: 21 June 2013 Accepted: 7 October 2013Published: 15 October 2013
References1. WHO Commission on Social Determinats of Health: Closing the gap in a
generation: health equity through action on social determinants of health.Geneva: World Health Organization; 2008.
2. Ministry of Rural Development: Mahatma Gandhi national rural employmentguarantee Act 2005: report to the people 2nd Feb 2006 to 2nd Feb 2010. NewDelhi: Ministry of Rural Development, Government of India; 2010.
3. Ministry of Rural Development, Government of India: NREGA implementationstatus report for the financial year. [http://164.100.129.6/netnrega/dash_brd.aspx?fin_year=2012-2013]
4. National Sample Survey Organisation: Employment and unemployment situationin India 2009–10. In In NSS report No 537(66/10/1). New Delhi: Ministry ofStatistics and Programme Implementation, Government of India; 2011.
5. Dutta P, Murgai R, Ravallion M, Walle DV: Does india’s employment guaranteescheme guarantee employment? In policy research working paper 6003.Washington DC: South Asia Social Protection Unit, Development ResearchGroup, The World Bank; 2012.
6. Ghose AK: Addressing the employment challenge: India’s MGNREGA. In workingpaper No 105. Geneva: International Labour Organization; 2012.
7. Dreze J, Khera R: The battle for employment guarantee; 2008 [http://knowledge.nrega.net/1099/1/Public%2520workd_The%2520battle%2520for%2520employment%2520guarantee.pdf]
8. Mukherjee D, Sinha UB: Understanding NREGA: a simple theory and somefacts. In CDE working paper No 196. New Delhi: Centre for DevelopmentEconomics, Delhi School of Economics; 2011.
9. Afridi F, Mukhopadhyay A, Sahoo SS: Female labour force participationand child education in India: the effect of the national rural employmentguarantee scheme. In IZA discussion paper no 6593. Bonn: Institute forStudy of Labor; 2012.
10. Ministry of Rural Development, Government of India: In MGNREGAsameeksha - an anthology of research studies on the mahatma Gandhinational rural employment guarantee act, 2005 2006–2012. Edited by Shah M.New Delhi: Orient Black Swan; 2012.
11. National Sample Survey Organisation: Level and pattern of consumerexpenditure 2009–10. In NSSO report No 538(66/10/1). New Delhi: Ministry ofStatistics and Programme Implementation, Government of India; 2011.
12. National Sample Survey Organisation: Level and pattern of consumerexpenditure 2004–05. In NSSO report No 508(61/10/1). New Delhi: Ministry ofStatistics and Programme Implementation, Government of India; 2006.
13. Ministry of Health and Family Welfare: Annual report to the people onhealth. New Delhi: Ministry of Health and Family Welfare, Government ofIndia; 2011.
14. Samarthan: Impact assessment of MGNREGS in Rajasthan. In Reportsubmitted to state planning commission. Madhya Pradesh. Bhopal:Samarthan; 2010.
15. Ministry of Health and Family Welfare: National rural health mission - frameworkfor implementation. New Delhi: Ministry of Health and Family Welfare,Government of India; 2007.
16. Mohanty SK, Srivastava A: Cost and utilisation of hospital based deliverycare in empowered action group (EAG) states of India. Matern ChildHealth J 2013, 17:1441-1451.
17. Palacios R, Das J, Sun C: India’s Health insurance scheme for the poor:evidence from early experience of Rashtriya Swasthya Bhima Yojana. Centrefor Policy Research: New Delhi; 2011.
18. Deaton AS, Paxson CH: Aging and inequality in income and health.Am Econ Rev, Pap and Proc (U S ) 1998, 88:248–253.
19. Macinko JA, Shi L, Starfield B: Wage inequality, the health system, andinfant mortality in wealthy industrialized countries, 1970–1996.Soc Sci Med 2004, 58:279–292.
20. Planning Commmission of India: Report of the expert group to recommendthe detailed methodology for identication of families below poverty line in theurban areas. New Delhi: Government of India; 2012.
21. Subramanyam MA, Kawachi I, Berkman LF, Subramanian SV: Socioeconomicinequalities in childhood undernutrition in India: analyzing trendsbetween 1992 and 2005. PLoS One 2010, 5:e11392.
22. Balarajan YS, Fawzi WW, Subramanian SV: Changing patterns of socialinequalities in anaemia among women in India: cross-sectional studyusing nationally representative data. BMJ Open 2013, 3:e002233.
23. Blas E, Gilson L, Kelly MP, Labonte R, Lapitan J, Muntaner C, Ostlin P, PopayJ, Sadana R, Sen G, et al: Addressing social determinants of healthinequities: what can the state and civil society do? Lancet 2008,372:1684–1689.
doi:10.1186/1475-9276-12-84Cite this article as: Dilip et al.: The national employment guaranteescheme and inequities in household spending on food and non-fooddeterminants of health in rural India. International Journal for Equity inHealth 2013 12:84.
Submit your next manuscript to BioMed Centraland take full advantage of:
• Convenient online submission
• Thorough peer review
• No space constraints or color figure charges
• Immediate publication on acceptance
• Inclusion in PubMed, CAS, Scopus and Google Scholar
• Research which is freely available for redistribution
Submit your manuscript at www.biomedcentral.com/submit
Dilip et al. International Journal for Equity in Health 2013, 12:84 Page 11 of 11http://www.equityhealthj.com/content/12/1/84