Embed Size (px)
Citation preview

Ch
apte
r 1:
Riv
er e
nviro
nmen
ts
1
evaporation
solar energy
the sealake/freshwater
surface store
run off
evapo-transpiration
interception
precipitation
condensation
surface run off river
ice sheet
glacier
clouds
snow
infi ltration
percolation
groundwater fl ow
soil rock
Key
Stores
Flows (transfers)
Section A: The natural environment and people
Figure 1.1: Stores and fl ows in the hydrological cycle
Stores
During the hydrological cycle, water is held in a number of stores and then moves between them by means of a series of fl ows or transfers. The stores in the cycle are:
● the atmosphere – here the water exists either as water vapour or as minute droplets in clouds
● the land – here water is stored on the surface in rivers, lakes and reservoirs. Water is also taken in by plants and temporarily stored in vegetation. It is also stored below ground in the soil or bedrock. This is known as the groundwater store. Generally speaking, water exists in these stores in a liquid form. However, it can also exist in a solid form as snow and ice, as for example in ice sheets, glaciers and snowfi elds.
Chapter 1: River environments
1.1 The hydrological cycleFresh water is essential for life on Earth. This water is constantly being recycled as it moves through a cycle known as the hydrological cycle or water cycle. This is a global circulation of water − it is a giant closed system (Figure 1.1). This means that there is a fi xed amount of water in the system because water neither enters nor leaves the Earth and its atmosphere.
IntroductionThis chapter is about rivers. They are a vital part of the global circulation of water. They are responsible for the creation of landforms found throughout the world. They are valuable to us because they supply much of the water we use in our everyday lives. At the same time, because of the risk of fl ooding, they can become hazards that threaten people and their settlements.

2
Ch
apte
r 1:
Riv
er e
nviro
nmen
ts
● the sea – it is estimated that over 95% of the Earth’s water is stored in the sea. This is overwhelmingly held in liquid form (water), but also in the form of ice, for example the icebergs in high-latitude seas.
While the amount of water in the global hydrological cycle cannot change, the proportion held in the different stores can. The latter changes are triggered by changes in the Sun’s energy. For example, an increase in the Sun’s energy will lead to more evaporation and possibly to the melting of ice sheets and glaciers.
Flows (or transfers)
The transfers of water that take place between stores do so by means of a variety of flows as follows (Figure 1.2):
● evaporation – we might say that the hydrological cycle starts with evaporation by the heat of the Sun. Water is converted from a liquid into a gas (water vapour). This takes place from the surface of the sea and from water surfaces (ponds, lakes, etc.) on land. Evaporation is particularly important in the transfer of water from the sea store into the atmosphere
● transpiration – plants take up liquid water from the soil and ‘breathe’ it into atmosphere as water vapour
● condensation – this is the change in the atmosphere when water vapour cools and changes to liquid. The liquid takes the form of water droplets that appear in the atmosphere as clouds
● precipitation – this is the transfer of water in any form (rain, hail or snow) from the atmosphere to the land or sea surface
precipitation
evaporationrun off
surfacewater
infiltration
groundwater
Figure 1.2 The hydrological cycle flows simplified
Locate and names the stores on a tracing or copy of Figure 1.2.
3
Ch
apte
r 1:
Riv
er e
nviro
nmen
ts
● overland flow – most of the precipitation that hits the ground moves under gravity and eventually enters a stream, river or lake. This is also known as run off
● infiltration and percolation – this is the transfer of water downwards through the soil and rock into the aquifer or groundwater store
● throughflow – this takes place between the ground surface and the top of the groundwater store. Under the influence of gravity, water moves slowly through the soil until it reaches a stream or river
● groundwater flow – this takes place in the aquifer and is the underground transfer of water to rivers, lakes and the sea.
All of these transfers fit together to form a circle involving the three major stores (the atmosphere, the land and the sea). We might imagine that the cycle starts and finishes in the sea. However, some of the water that falls as rain on the land may never reach the sea. Instead it may be returned directly back to the atmosphere from the land by the transpiration of plants and evaporation from both soil and water bodies.
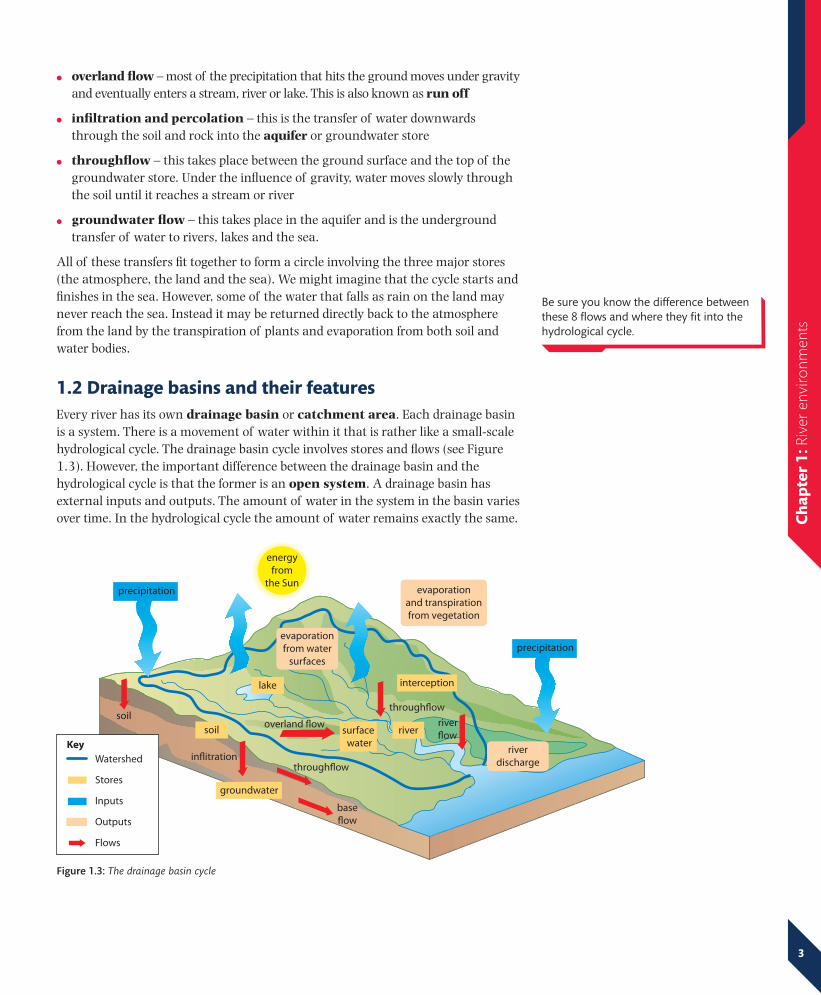
1.2 Drainage basins and their featuresEvery river has its own drainage basin or catchment area. Each drainage basin is a system. There is a movement of water within it that is rather like a small-scale hydrological cycle. The drainage basin cycle involves stores and flows (see Figure 1.3). However, the important difference between the drainage basin and the hydrological cycle is that the former is an open system. A drainage basin has external inputs and outputs. The amount of water in the system in the basin varies over time. In the hydrological cycle the amount of water remains exactly the same.
precipitation
precipitation
energyfrom
the Sun
evaporationfrom water
surfaces
evaporationand transpirationfrom vegetation
riverdischarge
lake
soilsoil
river
interception
groundwater
overland flow
inflitrationthroughflow
throughflow
river flow
baseflow
Watershed
Stores
Inputs
Outputs
Flows
Keysurface
water
Figure 1.3: The drainage basin cycle
Be sure you know the difference between these 8 flows and where they fit into the hydrological cycle.

4
Ch
apte
r 1:
Riv
er e
nviro
nmen
ts
The inputs of a drainage basin are:
● energy from the Sun
● precipitation formed from moisture picked up outside the basin
● possibly water from tributary drainage basins – this is not shown in Figure 1.3; an explanation is given below.
Most of the flows and stores are broadly the same as in the hydrological cycle.
The outputs are:
● the river’s discharge
● the water in its basin from which evaporation and transpiration take place and which eventually falls as precipitation in another drainage basin.
As Figure 1.4 shows, it is possible to draw a dividing line between neighbouring drainage basins. It follows the tops of the hills and is called the watershed. The main river has its source in the higher parts of the basin close to the watershed. This is where most precipitation falls. Smaller streams or tributaries enter the main river channel at locations known as confluences. The mouth or estuary of the river is where it flows out into the sea.
Drainage basins can be of at least three broad types. Not all of them simply collect and deliver water directly to the sea. Some of them are just parts of much larger drainage basins. For example, the basin of the River Negro in Brazil is a tributary or part of the huge drainage basin of the River Amazon. The water it collects is conveyed to the Amazon and then eventually to the sea. Some drainage basins do not lead, either directly or indirectly, to the open sea. Rather they lead to ‘inland’ seas or lakes such as the Caspian Sea, the Aral Sea or Lake Victoria in Kenya.
The drainage network is the system of surface and underground channels that collect and transport the precipitation falling on the drainage basin. Figure 1.4
Figure 1.4: Basic features of the drainage basin
confluence
source
tributary
mouth
B
B
A
A Key
drainage basins
watershed
lowland
upland
Why is the hydrological cycle a closed system and the drainage basin cycle an open system?
For more on systems, see:
• Chapter2.6(page54)
• Chapter5.2(page116)
• Chapter5.5(page123)

5
Ch
apte
r 1:
Riv
er e
nviro
nmen
ts
shows the channel networks of two drainage basins, A and B. Basin A’s network is less dense (has fewer channels) than B’s, though the main channel is shorter. Channel networks can be mapped and their lengths and densities (number of channels per unit area) measured. The network can change over short periods of time. For example, during flooding drainage basins often have many more and longer channels than they do in periods of low or normal rainfall.
Each drainage basin is unique in its combination of a range of features. These features include size, shape, rock type, relief and land use. The features become factors that determine how quickly or slowly water moves through the basin.
Figure 1.5 shows how some of these features can affect overland flow or run off. Rock type and relief are physical factors over which people have little control. However, land use can be easily changed by people. Woodland can hold water and slow overland flow. However, once it is cleared for cultivation, run off will speed up. The built-up areas of towns and cities can speed up run off even more. Rainwater hits solid surfaces such as roofs, pavements and roads. It is then quickly channelled into drains which speed its delivery into a stream or river.
1.3 Hydrographs and river regimesIt can be important to know how quickly any rain falling in a drainage basin or catchment area will reach the drainage network. It is also important to know how much a river’s channel can hold. If the rainwater reaches the river quickly, the channel may not be able to cope and flooding will occur. The amount of water carried by a river at any one time is known as its discharge. This is measured in cumecs − that is, in cubic metres of water per second moving past a particular point along the river’s course.
rapid run off–steep slopes; impermeable rock
little run off– permeable rock; rivers have disappeared underground
woodland–slows rate of run off
urban area–speeds up rate of runoff
grit
Key
limestone clay
Figure 1.5: Factors affecting run off
Are you sure you know the difference between permeable and impermeable rocks?

6
Ch
apte
r 1:
Riv
er e
nviro
nmen
ts
River discharges vary throughout the year, from month to month, from day to day. These variations make up what is termed the river regime. In most rivers, the regime closely reflects local climatic conditions, particularly the rainfall regime. Figure 1.6 shows the average monthly discharge of the River Ganges as it passes through Bangladesh. This diagram is a hydrograph. Clearly, mean (average) discharge is high between June and October. This period of high discharge from the river coincides with the monsoon season, during which total rainfall can exceed 275 cm.
Figure 1.7 shows the regime of the River Thames (England) during one year. Unlike the Ganges, the highest discharges generally occur in the winter, in February and March. Another feature of the hydrograph is its ‘jaggedness’. Discharge clearly varies from day to day. The peaks reflect the impact of passing showers and short periods of heavy rainfall.
The majority of the world’s drainage basins are home to many people. The big attraction of such areas to people was their fertile soils and the ability to grow food. Today much money is invested, not just in farmland, but also in homes, businesses and transport in these drainage basins. Thus it is important that we know how rivers will behave following a period of heavy rainfall. How great will be the risk of flooding – and over what area? This is where a storm hydrograph comes in useful.
A storm hydrograph records the changing discharge of a river after a passing rainstorm. The bars in the left-hand corner of Figure 1.8 show the input of rain. It takes time for the rain to reach the river and cause river levels to rise once it has hit the ground. This delay between peak rainfall and peak discharge is called the lag time. The shorter the lag time, the quicker the water reaches the river channel. A short lag time will cause the river discharge to rise steeply. The steeper the rise in discharge, the greater the chances of flooding. It is possible to mark on the storm hydrograph the level of discharge above which the river will flood. Once the storm and its peak discharge have passed, the amount of water in the river starts to decrease.
The storm hydrograph shows that discharge of the river as being made up of two flows:
● the base flow − the ‘normal’ discharge of the river
● the storm flow – the additional discharge of the river directly related to the passing of the rainstorm.
Figure 1.6: A hydrograph of the River Ganges in Bangladesh
0
10 000
20 000
30 000
40 000
50 000
DecNovOctSeptAugJulyJuneMayAprMarFebJan
Average monthly discharge in cubic metres per second
150
140
130
120
110
100
90
80
70
Oct2001 2002
Dis
char
ge (c
umec
s)
Nov Dec Jan Feb Mar Apr May Jun Jul Aug Sep
60
50
40
30
20
10
0
Figure 1.7: Hydrograph showing the regime of the Thames at Reading, 2001–2002
Figure 1.8: A storm hydrograph
level of water discharge above which the river will flood
high river discharge
low river discharge
channel water levelat A
channel water levelat B
rainfall peak
discharge of river
A
B
lag time
base flow
rainstorm
rain
fall

7
Ch
apte
r 1:
Riv
er e
nviro
nmen
ts
There are a number of factors affecting the critical time lag of a storm. These include:
● the amount and the intensity of the rain – heavy rain will not sink into the ground; instead it will become overland flow or run off and quickly reach the river
● temperatures are significant because they affect the form of precipitation. For example, if temperatures are below freezing, precipitation will be in the form of snow. This can take weeks to melt. If the ground remains frozen, melting snow on the surface can reach the river quickly
● land use − trees and plants will intercept and delay the rain reaching the ground. Bare soil and rock will speed up runoff and reduce the time lag. So too will urban areas covered by tarmac and concrete
● steep slopes will cause rapid surface runoff, so water will reach the river more quickly. Flat and gently sloping land may lead to water sinking into the soil. This will delay it reaching the river
● rock type – impermeable rocks will not allow rainwater to sink into it, so will speed up runoff. Permeable rock will allow infiltration and percolation of water into the bedrock. This in turn will slow the delivery of the water to the river
● dams and reservoirs regulate and even out discharges. They hold back discharge and so reduce the risk of flooding downstream (Figure 1.9).
1.4 River processes
Weathering and mass movement
Rivers play a major part in shaping landforms. They do this work by means of three processes – erosion, transport and deposition. These river processes act in a sort of partnership with two other processes – weathering and mass movement. Let us take a look at these two processes before looking more closely at the work that rivers actually do.
Weathering involves elements of the weather, particularly rainfall and temperatures (Table 1.1).
1500
1000
OctMonths
Dis
char
ge (c
ubic
met
res
per
sec
ond)
Nov DecJan Feb Mar Apr May
impact of dam and water
abstraction
storm hydrograph
Jun Jul Aug Sep
500
0
Figure 1.9: The impact of a dam and water abstraction on a river’s storm hydrograph
In your own words, describe the differences between the two hydrographs in Figure 1.9. Try to explain those differences.

8
Ch
apte
r 1:
Riv
er e
nviro
nmen
ts
Physical weathering This breaks rock down into smaller and smaller pieces. It is done by changes in temperature and by rainfall freezing and thawing in rock cracks.
Chemicalweathering This causes rock to decay and disintegrate. It is largely done by slightly acidic rainfall seeping into porous rock.
Biological weathering The roots of plants, especially trees, growing in cracks in the rocks gradually split the rock apart.
Table 1.1: Different types of weathering
Figure 1.10: A landslide – a hazardous form of mass movement
All this destructive activity takes place where rocks outcrop (are above the surface of the surrounding land). Once rocks are really broken down, the weathered material starts to move down the slope under the influence of gravity. This is mass movement. It takes several different forms. In river valleys, there are two main types of mass movement:
● slumping – this occurs when the bottom of a valley side slope is cut away by the river flowing at its base. This makes the slope unstable and weathered material slumps down towards the river. Slumping is also helped when the weathered material on the slope is saturated by heavy rain. The water does two things. It makes the weathered material heavier and acts as a lubricant. Figure 1.10 is an example of sudden slumping leading to a major landslide.
● soil creep – weathered material moves slowly down slope under the influence of gravity. It collects at the bottom of the valley side and is eroded by the river.
What made the landslide in Figure 1.10 into a serious hazard and natural disaster?
Formoreonhazards,seeChapter3.

9
Ch
apte
r 1:
Riv
er e
nviro
nmen
ts
Erosion
There are several different ways in which rivers erode their channels and valleys (Table 1.2).
Hydraulic action
Water hits the river bed and banks with such force that material is dislodged and carried away. This is particularly important during periods when the river’s discharge is high.
Abrasion The material being carried by a river is rubbed against the the sides and floor of the channel. This ‘sandpaper’ action widens and deepens the channel.
Corrosion Minerals in the rocks forming the sides of the river channel are dissolved by the water flowing past them.
Table 1.2: The processes of river erosion
Attrition is another river process. It involves particles of material being carried by a river becoming rounder and smaller as they constantly collide with each other. This process doesn’t erode river channels and valleys.
Transport
This is the movement of material (known as the load) by the river. The load is made up of material that has been washed or fallen into river. It also made up of materials eroded by the river itself from the sides of the channel. The load can be transported in a number of different ways (Figure 1.11).
Figure 1.11: Ways in which rivers transport their load
large boulders rolled on the bed
small boulders bounced along the bed
lighter material carried along by
river flow
material dissolved in the water
solution
traction
saltation
suspension
Why is attrition not included in Table 1.2?
Explain why the size of load material affects the way it is transported by a river.

10
Ch
apte
r 1:
Riv
er e
nviro
nmen
ts
Deposition
Deposition is the laying down of material transported by the river. This occurs when there is a decrease in the energy, speed and discharge of the river. This is most likely to happen when a river enters a lake or the sea. It will also happen wherever there is a decrease in the gradient of the river’s channel.
1.5 River landformsThe long profile of a river runs from its source to the point where it enters the sea, a lake or joins another and larger river. The character of the long profile changes downstream. Overall it has a smooth concave shape. It is steep and in places irregular where the river is flowing well above sea level in upland country. The irregularities occur where hard rock outcrops run across the valley. Natural lakes and reservoirs can also disrupt the smoothness of the long profile. However, the profile becomes much gentler and smoother as the river runs through lowland country and reaches its destination. Changes in the character of river landforms are associated with these changes in the long profile. For this reason, we should distinguish between upland and lowland river landforms.
Upland landforms
The main river landforms found in upland areas are: steep V-shaped valleys, interlocking spurs, waterfalls and gorges (see Figure 1.12). They have all been formed mainly by the processes of river erosion already described in Part 1.4. The processes of weathering and mass movement have also played a part.
In the uplands, the long profile is steep and the river flows fast. Much of the river’s energy is spent cutting downwards. The processes of hydraulic action (erosive force exerted by water) and abrasion, in particular, erode the river bed and thus make the valley deeper (Figure 1.12A). Because of the steepness and deepness of the valley, there is mass movement of material down the sides of the valley. Some of this material becomes river load and helps the abrasion process. The valley floor is narrow and often completely occupied by the river.
Interlocking spurs are formed where the river swings from side to side (Figure 1.12B). Again the main work of the river is vertically downwards into its bed. This means that the river cuts down to flow between spurs of higher land on alternate sides of the valley.
Waterfalls occur where a band of hard rock outcrops that is much more resistant to erosion than the softer rock below it (Figure 1.12C and D). This softer rock is readily eroded by the force of the water as it falls over the hard cap rock. Gradually, the falling water excavates a plunge pool at the bottom of the falls. Slowly the hard rock is eroded back by the river and so the waterfall gradually retreats upstream leaving a gorge below it. The gorge is protected from being widened by its capping of hard rock. The Iguaça Falls in South America are a spectacular example and attract many tourists (Figure 1.13).
Figure 1.12: The origin of river landforms in upland areas
river swings from side to side
hard cap rock – difficult to erode
waterfall retreats
plunge pool
softer rock – easier to erode
original position of waterfall
direction of waterfall retreat
KeyS – interlocking spurs
A
B
C
D
river has been cut down by vertical erosionV-shaped valley –
cross-section
mass movement of material down the
valley sides
river cutting down
river cutting down
gorge
hard rock
present waterfall
gorge

11
Ch
apte
r 1:
Riv
er e
nviro
nmen
ts
Lowland landforms
The river and its landforms change when the river leaves the uplands and flows across lowlands (Figure 1.14). The river channel becomes wider, deeper and smoother. Because of this, both the velocity (speed) and discharge of the river continue to increase, despite the gentler gradient. The river course in plan (map) view becomes less straight and is characterised by a series of meanders. The valley cross section is wider and flatter. The floor is occupied by a floodplain with its distinctive levees, meanders and ox-bow lakes (Figure 1.15). Near the end of its course, the flood plain spreads out to become either a delta or an estuary.
ARGENTINA
Iguaçu
Iguaça River
0 2 4 6 8 10 km
Y
X
ARGENTINA
Falls
BRAZIL
Iguaçu National Park, southern Brazil
Difference in height between X and Y is 82 metres
international border
Key
roadairporthotel
N
Figure 1.13: Map and photograph of the Iguaçu Falls
Figure 1.14: River and valley features
rock
river
ox-bowlake
levees
smaller loadmaterial
wide and deep
floodplain
Uplands
Channelcross-section
Valleycross-section
Channelcross-section
Valleycross-section
Lowlands
meander
delta
distributaries
alluvium or silt
Plan of the river

12
Ch
apte
r 1:
Riv
er e
nviro
nmen
ts
During its lowland course, the river is still an agent of erosion. However, vertical erosion is less important because the river is too close to sea level. More important is lateral erosion where the river wears away the sides of the channel, especially on the outside of meanders. The river becomes an agent of deposition as well. Such a large load of material has been picked up that, once the river loses energy, it drops some of that load, usually mud, stones and other organic matter. The greatest thickness of river-deposited material, known as alluvium, is on the flood plain. As its names suggests, the flood plain is an area of flat land formed by flooding. Every time the river leaves its channel, its velocity (speed) decreases. Once this happens, alluvium is deposited across the valley floor. A great thickness of alluvial material builds up. The largest amount of deposition is always on the banks of the channel, which builds up to a greater height than the rest of the floodplain to form levees (Figure 1.15).
A study of the formation of meanders and ox-bow lakes shows how the river both deposits and erodes laterally (Figure 1.16). The force of the water undercuts the bank on the outside of a bend to form a steep bank to the channel, called a river cliff or bluff. An underwater current with a spiral flow carries the eroded material to the inside of the bend where the flow of water is slower. Here the material is deposited to form a gentle bank, called a slip-off slope or point bar.
silt or alluvium
leveelevee
river in flood
layers of deposits build up in great thickness
the river’s energy is reduced when itleaves the channel
Figure 1.15: The formation of a floodplain and levees
Figure 1.16: Formation of meanders and oxbows
fastestflow onoutsidebends
slip-off slope
river cliff muchlargermeander
fastest waterflow here
rivercliff
sealed bydeposits
narrow neckof land
river nowflows straight
steep river bank
x
y
deposits of sandand silt in channel
outside benderodedmore sharplyby river current
ox-bowlake
cut off
deposited materialon the slip-off slope
Channel cross-section x–y
x y
CBA
slowerflow oninsidebends

13
Ch
apte
r 1:
Riv
er e
nviro
nmen
ts
As lateral erosion continues, the bend of a meander becomes even more pronounced (Figure 1.16). Especially in times of flood, when the river’s energy is much greater, the narrow neck of the meander may be breached (broken and crossed) so that the river flows straight again. The redundant meander loop retains some water and becomes an ox-bow lake. Deposition during the flooding helps to seal off the edges and ends of the lake.
Lateral erosion on the outside banks of meanders helps to widen the flood plain. Flood plains have great value for people. Flat land with rich, thick alluvial soils and nearby, plentiful water is attractive to agriculture, industry and urban settlements. Rivers meander naturally. The meanders migrate across the flood plain as the outside of the meander erodes laterally (sideways). Figure 1.17 shows a small part of the complicated meander pattern of the Mississippi River.
Figure 1.17: Mississippi meanders and ox-bow lakes
Figure 1.18: Satellite image of part of the Ganges−Brahmaputra delta. It also shows huge amounts of silt being deposited in the waters of the Bay of Bengal.
Try researching two facts about the Mississippi River:
• theactuallengthoftheriverfromitssource to the sea
• thestraight-linedistancefromitssource to the sea.
What does this tell you about the amount of meandering the river does?

14
Ch
apte
r 1:
Riv
er e
nviro
nmen
ts
The delta is the final landform of the river’s journey from its source to the sea or lake. Deltas are vast areas of alluvium at the mouths of rivers. The Ganges− Brahmaputra delta is one of the largest in the world (Figure 1.18). It is located at the head of the Bay of Bengal. The rivers that have built it up carry huge quantities of sediment, derived mainly from the Himalayas, down to the delta. It is estimated that they deliver about 1.7 billion tonnes of sediment each year. The flows of the combined rivers are slowed as they meet the denser sea water in the Bay. The result is that much of the load being carried is dropped. In fact, it is deposited faster than the tides can remove it out to sea. The river flow is blocked by so much deposition that the rivers split up into smaller channels known as distributaries. These distributaries help deposit sediment over a wide area, creating new land where there was once sea.
Case study: The River Tay (UK) and its valley
In the uplands
The River Tay is fed by streams which drain the slopes of the Grampian Mountains in the Highlands of Scotland. Precipitation in the upland parts of thedrainagebasinishigh(wellover1000mmayear)andslopesaresteep.
0 1km
A
B
55
54
53
52
51
5088
N
89
© Crown copyright
90 91 92
Figure 1.19: Part of the upland course of the River Tay
For more information about deltas, see Casestudiesonpages30and51.
Not all rivers build up deltas as they enter the sea. Many have open mouths or estuaries.
Look at an atlas map of the British Isles to locate the drainage basin of the River Tay.

15
Ch
apte
r 1:
Riv
er e
nviro
nmen
ts
The height of the drainage basin and the steep slopes result in large amounts of run off. The Tay is already about 100 metres across in that part of its course as shownontheOrdnanceSurveymapextract(Figure1.19).Thecurvingnatureoftherivercoursesuggeststhat it is flowing between interlocking spurs.
Thevalleycross-sectionisshowninFigure1.20A.ItisV-shapedandsteep-sided.Theriverfillsthevalleyfloor.Thecross-sectionshowsthattheriverisstillflowingatsome height above sea level. Erosion by the river appears to be vertical rather than lateral.
In the lowlands
Figure1.20Bshowsthevalleycross-sectionnearthesea.Theflatandlow-lyinglandisthefloodplain.Itis0.6kmwide where the tributary River Earn meets the main River Tay. Notice the big meander loop on the tributary throughgridsquares1718and1717(Figure1.21).Theblack dashes marked around its banks show the levees.
Figure 1.20: Cross sections across the Tay valley
Figure 1.21: Part of the floodplain and estuary of the River Tay
River EarnRiver Tay
500
400
300
200
100
sea levelC D
B In the lowlands
met
res
Line of section = C ➞D on Figure 1.21
500
400
300
200
100
sea level
River Tay
A B
A In the uplands
Line of section = A ➞B on Figure 1.19
met
res
C
D
22
21
20
19
18
17
16
15
N
16
© Crown copyright
17 18 19 20 21 22 230 1km
16
Ch
apte
r 1:
Riv
er e
nviro
nmen
ts
1.6 Water uses, demand and supply
Uses
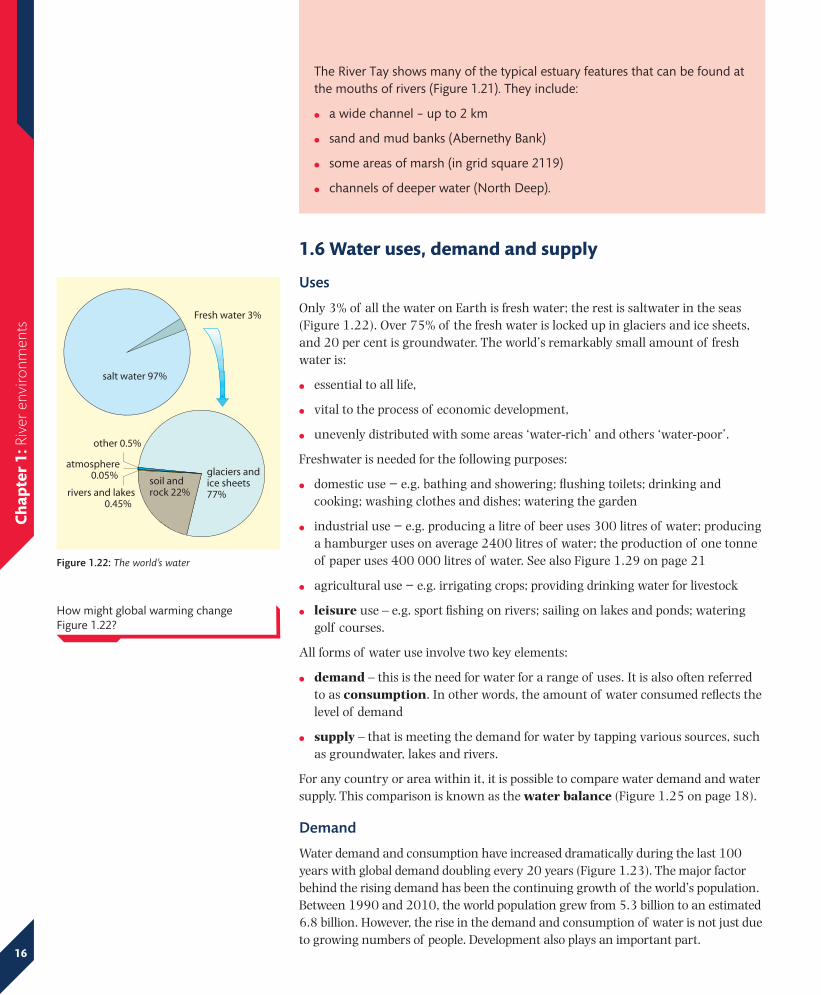
Only 3% of all the water on Earth is fresh water; the rest is saltwater in the seas (Figure 1.22). Over 75% of the fresh water is locked up in glaciers and ice sheets, and 20 per cent is groundwater. The world’s remarkably small amount of fresh water is:
● essential to all life,
● vital to the process of economic development,
● unevenly distributed with some areas ‘water-rich’ and others ‘water-poor’.
Freshwater is needed for the following purposes:
● domestic use − e.g. bathing and showering; flushing toilets; drinking and cooking; washing clothes and dishes; watering the garden
● industrial use − e.g. producing a litre of beer uses 300 litres of water; producing a hamburger uses on average 2400 litres of water; the production of one tonne of paper uses 400 000 litres of water. See also Figure 1.29 on page 21
● agricultural use − e.g. irrigating crops; providing drinking water for livestock
● leisure use – e.g. sport fishing on rivers; sailing on lakes and ponds; watering golf courses.
All forms of water use involve two key elements:
● demand – this is the need for water for a range of uses. It is also often referred to as consumption. In other words, the amount of water consumed reflects the level of demand
● supply – that is meeting the demand for water by tapping various sources, such as groundwater, lakes and rivers.
For any country or area within it, it is possible to compare water demand and water supply. This comparison is known as the water balance (Figure 1.25 on page 18).
Demand
Water demand and consumption have increased dramatically during the last 100 years with global demand doubling every 20 years (Figure 1.23). The major factor behind the rising demand has been the continuing growth of the world’s population. Between 1990 and 2010, the world population grew from 5.3 billion to an estimated 6.8 billion. However, the rise in the demand and consumption of water is not just due to growing numbers of people. Development also plays an important part.
The River Tay shows many of the typical estuary features that can be found at themouthsofrivers(Figure1.21).Theyinclude:
● a wide channel – up to 2 km
● sandandmudbanks(AbernethyBank)
● someareasofmarsh(ingridsquare2119)
● channelsofdeeperwater(NorthDeep).
Fresh water 3%
glaciers andice sheets 77%
soil and rock 22%
other 0.5%
salt water 97%
atmosphere 0.05%
rivers and lakes0.45%
Figure 1.22: The world’s water
How might global warming change Figure 1.22?

17
Ch
apte
r 1:
Riv
er e
nviro
nmen
ts
● The rising standard of living that is part of development increases the domestic use of water. More houses with piped water, flush toilets, showers and baths, washing machines, and even swimming pools mean much higher water consumption.
● The rise in agricultural productivity needed to feed a growing population increases the use of water, particularly for irrigation.
● Industrialisation is a key part of development. Most factories are large consumers of water. Water is used for cooling machinery. It is also used in the generation of electricity for powering industry.
Given the link between development and water consumption, we can recognise two ‘worlds of water’. There are big differences between water consumption in high-income countries (HICs) and in low-income countries (LICs). Water consumption in HICs is very high. On average, each person in an HIC uses about 1200 cubic metres of water each year. This is about three times as much as a person in a LIC where consumption is around 400 cubic metres per year.
There are also some big differences in the use of that water (Figure 1.24). In LICs most water is used by agriculture and relatively little by industry or in the home. In HICs industry uses the most water followed closely by agriculture. Domestic use of water is relatively small, but the percentage is over three times greater than in LICs.
Supply
Having looked at one side of the water equation, let us now look at the other – water supply. In many parts of the world, the water needed to meet the increasing demand comes from three main sources:
● rivers and lakes – possibly this was the source of supply used by the earliest humans
● reservoirs – these are artificial lakes created by building a dam across a valley and allowing it to flood. The water collected and stored behind the dam can become an important water supply
● aquifers and wells − much of the world’s fresh water supply lies underground. It is stored in porous rocks known as aquifers. This groundwater can be extracted by drilling wells or boreholes down to the aquifer. The water is then raised to the surface by buckets, pumps or under its own pressure.
Water surplus and deficit
If we were to draw up two world maps, one showing the distribution of water demand or consumption and the other, water supply, we would find that the two maps show quite different patterns. If we laid one map on top of the other, we would be able to pick out three types of area:
● areas where the water balance is negative – in other words where water demand exceeds supply. These are referred to as water-deficit areas
● areas where the water balance is positive – in other words water-surplus areas where the supply or availability of water exceeds demand
5000
4000
3000
1950
Agriculture
Industry
Domestic
Cu
bic
Km
/yea
r
1960 1970 1980 1990 2000
2000
1000
0
HIC water consumption
4%5%
91%
LIC water consumption
14%
47%
39%
Agriculture
Industry
Domestic
Figure 1.23: World water consumption, 1950−2000
Figure 1.24: Water consumption in LICs and HICs

18
Ch
apte
r 1:
Riv
er e
nviro
nmen
ts
● areas where water demand and supply are roughly the same – water-neutral areas where the water balance is literally evenly balanced.
Waterdeficit
Watersurplus
Figure 1.25: Water-surplus and water-deficit areas of the world
Case study: Meeting the rising demand for water in England and Wales
DailywaterconsumptioninEnglandandWalesisabout120litresperpersonperday.Thatisnotaparticularlyhighfigure.Itcompareswith309litresforFranceand185litresforGermany.
Water consumption in Britain has been rising in harmony with the growth of population. However, it has been given a number of pushes over the last 200 years. First, it was the growth in manufacturing in the early 19th century. With deindustrialisation in the second half of the 20th century, manufacturing
Figure 1.25 shows the results of overlaying the two world maps – one of demand and the other of supply. Once again we see that there are ‘two worlds of water’. There are, in fact, very few truly water-surplus areas. However, there are large areas where the water balance is slightly in surplus. These are typically remote, mountainous regions with high annual rainfall, few people and low water demand. On the other hand, there are many water-deficit areas. These are most obvious in Africa and the Middle East, in Australia and parts of North and South America. Many of these areas are in deficit because they receive little precipitation during the course of a year. Others are in deficit because of large populations and rising development. Good examples of such an area is India.
There are ways of moving water from surplus to deficit areas. The most widely used way is by long-distance pipelines. However, water can also be transported by motor vehicles and even tanker ships.
ThevariousshadesofgreeninFigure1.25show those parts of the world where water supply just about meets water demand.Describethemainareaswherethis is the case.

19
Ch
apte
r 1:
Riv
er e
nviro
nmen
ts
Figure 1.27; Water demand and supply in England and Wales
useslesswater(now14%)(Figure1.26).Otherconsumersnowaccountformore water use. Most notable is the use of water in the generation of electricity(now43%).Morewaterisbeingusedtodaytoirrigatecrops(14%)andBritishcitizensareusingmorewaterintheirhomes(20%).Morehomestoday have washing machines, dishwashers and swimming pools.
agricultureand fisheries
14%domestic20%
services9%
energy andwater43%
manufacturing14%
Major reservoirs
Rivers
Transfers of water by pipeline
Over 1000 mm rainfall per year(high water supply)
Less than1000 mm rainfall per year (low water supply)
0 50 km
Major urban areas(high water demand)
N
Figure 1.26: Water use in the UK
Water is important in making electricity in two ways:
• itisuseddirectlytoturntheturbinesthat generate the electricity, as in HEP
• itisconvertedintosteambytheburning of fossil fuels and the steam turns the turbines.
It would be wrong to think that there are no reservoirs in the drier parts of England. For example, London has a number of them on its northern and western outskirts. These are used both to collect water and store recycled water.
Research the names of some large reservoirs in ‘dry’ England.

20
Ch
apte
r 1:
Riv
er e
nviro
nmen
ts
The problem that faces England and Wales is that the distribution pattern of waterdemandisdifferentfromthatofwatersupply(Figure1.27).Thehighestwater demand is in SE England which happens to be the driest part of the country.Waterismostreadilyavailable(therainfallishighest)inuplandareasthat are mainly located in Wales and the north of England. The mismatch between demand and supply creates different levels of water stress(Figure1.28).Clearlythegreatestwaterstressliesinthesouth-eastofEngland.Itisbeing tackled as follows:
● extracting as much water as possible from the aquifers of SE England
● constructing reservoirs in the north and west of the country to collect as much rainfall as possible. Famous reservoirs schemes include Lake Vyrnwy in Wales and Kielder in NE England
● transfering this collected water by pipeline to the main areas of water deficit, i.e. the major cities of the Midlands and South.
There is no doubt that meeting the rising demand for water is a challenge for the UK. Attempts are being made to reduce water consumption by encouraging a much more efficient use of the available water and to eliminatewaterwastage(seePart1.7).
Figure 1.28: England – levels of water stress
Serious
Moderate
Low
Not assessed
N
Water stress can be a seasonal or temporary condition, as during a climate’s dry season or during occasional droughts.
Conversely,waterstresscanberelievedtemporarily by periods of unusually heavy rainfall.
Suggest some ways of saving water and using it more efficiently.
21
Ch
apte
r 1:
Riv
er e
nviro
nmen
ts
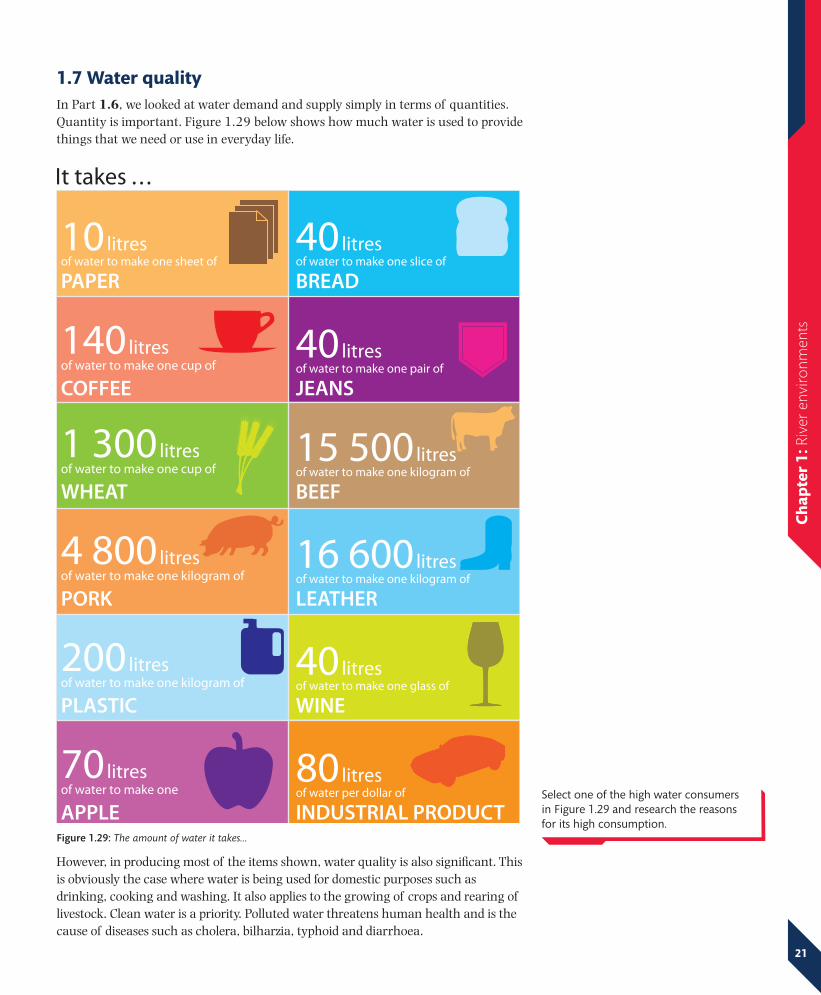
1.7 Water qualityIn Part 1.6, we looked at water demand and supply simply in terms of quantities. Quantity is important. Figure 1.29 below shows how much water is used to provide things that we need or use in everyday life.
However, in producing most of the items shown, water quality is also significant. This is obviously the case where water is being used for domestic purposes such as drinking, cooking and washing. It also applies to the growing of crops and rearing of livestock. Clean water is a priority. Polluted water threatens human health and is the cause of diseases such as cholera, bilharzia, typhoid and diarrhoea.
10 litresof water to make one sheet of
PAPER
40 litresof water to make one slice of
BREAD
40 litresof water to make one pair of
JEANS
15 500 litresof water to make one kilogram of
BEEF
140 litresof water to make one cup of
COFFEE
1 300 litresof water to make one cup of
WHEAT
16 600 litresof water to make one kilogram of
LEATHER
4 800 litresof water to make one kilogram of
PORK
40 litresof water to make one glass of
WINE
200 litresof water to make one kilogram of
PLASTIC
80 litresof water per dollar of
INDUSTRIAL PRODUCT
70 litresof water to make one
APPLE
It takes . . .
Figure 1.29: The amount of water it takes...
Select one of the high water consumers in Figure 1.29 and research the reasons for its high consumption.

22
Ch
apte
r 1:
Riv
er e
nviro
nmen
ts
Water quality varies from place to place for a variety of reasons. For example, water quality is generally poorer in dry climates or where the climate has a marked dry season. During dry periods, any water that remains on the surface becomes stagnant and can be a breeding ground for diseases. Pollution is another key factor that affects water quality, and this varies greatly from place to place. Levels of pollution are particularly high in urban areas and especially in LIC cities.
Sources of water pollution
There are many sources of water pollution. It is helpful to group them under the headings of the three main water users – agriculture, industry and domestic uses. Figure 1.30 shows some of them in what we might call the ‘cycle of water pollution’.
urban pollution
sewage soaked Beaches
oilslick
sewagebarge
untreated sewage discharged into the sea
SEA
bathing b
eachmoisture formscloud and rain
mountain valley dammedto make reservoir. Drinkingwater piped to towns and cities
farms: liquid from silage and slurry from farm animals enters river. Fertiliser and pesticides enter ground water and river
National Rivers Authority offices: responsible for controlling pollution
power station: warm water from station enters river
fishing boats’ catch is reduced and some fish are deformed because of pollutants
offshore dumping of sewage sludge gets incorporated into the marine food chain. This can be returned to the land when fish stocks are harvested
coastal marshes: breeding grounds for birds. These are often contaminated by water-born pollutants
oil refinery: oil spillages can cause oil slicks, harmful to birds and marine life
sewage works: treated waste enters river. In one year 60 out of 400 sewage works on the Thames broke the law by over-polluting the river
industrial area: waste from factories are discharged into river
paper and pulp mill in forest area puts chemical waste into river
mountain streams flowing with clean water
water from the sea, lakes, rivers and vegetation is evaporated by heat from the sun. The cycle begins again
Figure 1.30: The cycle of water pollution

23
Ch
apte
r 1:
Riv
er e
nviro
nmen
ts
Agriculture
● Liquid from farm silage and slurry from farm animals enters rivers
● Fertilisers and pesticides seep into the groundwater
● Deforestation – run off carries soil and silt into rivers, with serious effects on aquatic life and humans who drink the water
Industry
● Taking cooling water for an electric power station from a river and returning it to the source at a higher temperature upsets river ecosystems
● Spillages from industrial plants such as oil refineries
● Working of metallic minerals and the heavy use of water in processing ore − toxic substances eventually find their way into rivers
Domestic purposes
● The discharge of untreated sewage from houses – even treated sewage pollutes
● Use of river for washing clothes and bathing
● Emptying highly chlorinated water from swimming pools
Access to safe water
Safe water is water that is safe for human consumption. It is not contaminated by pollutants and is free from disease. It is estimated that more than 1 billion people in the world do not have access to safe water.
Figure 1.31 shows that the countries with the lowest access to clean water (i.e. less than 50% of the population enjoying safe water) are mainly located in Africa and in parts of southern Asia. As a consequence, many people suffer ill health and an early death. In most HICs, more than 90% of the population have access to clean water. It is surprising that the map shows there is no data about clean water for a number of European countries.
>90%
No data
76–90%
51–75%
<25%
% of population who have access to safe water
26–50%
Figure 1.31: Access to safe water
Canyouthinkofwaysinwhichrecreation and tourism pollute water?
DescribethemainfeaturesshownbyFigure1.31.
24
Ch
apte
r 1:
Riv
er e
nviro
nmen
ts
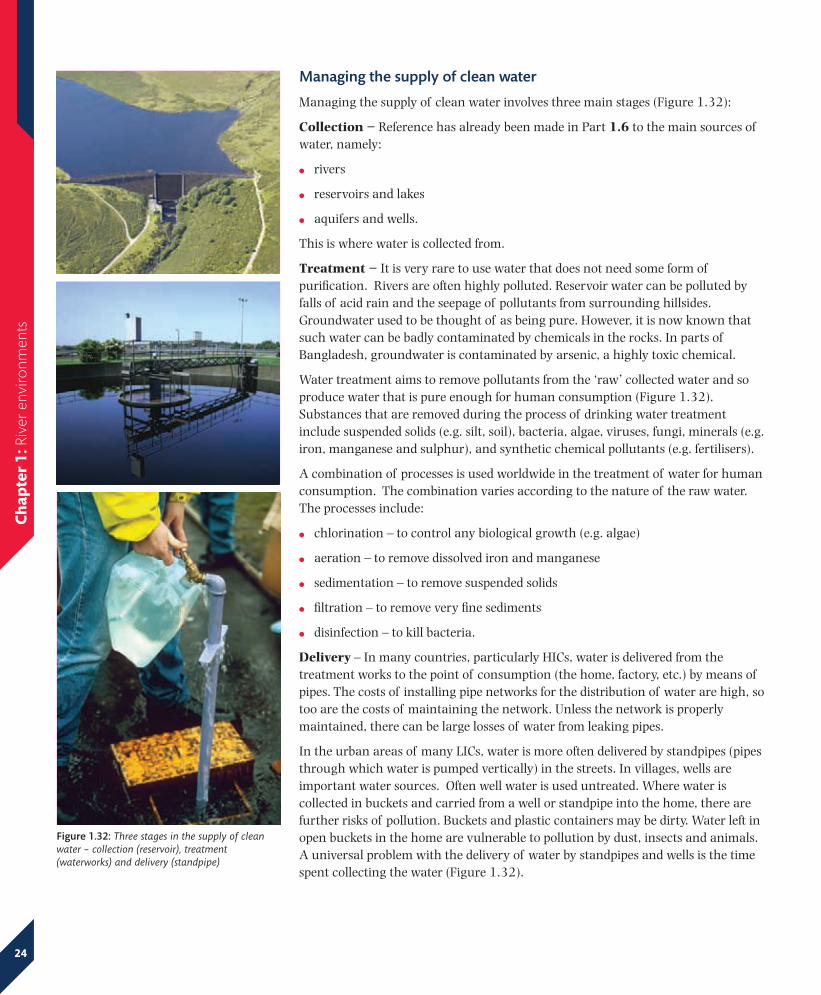
Managing the supply of clean water
Managing the supply of clean water involves three main stages (Figure 1.32):
Collection − Reference has already been made in Part 1.6 to the main sources of water, namely:
● rivers
● reservoirs and lakes
● aquifers and wells.
This is where water is collected from.
Treatment − It is very rare to use water that does not need some form of purification. Rivers are often highly polluted. Reservoir water can be polluted by falls of acid rain and the seepage of pollutants from surrounding hillsides. Groundwater used to be thought of as being pure. However, it is now known that such water can be badly contaminated by chemicals in the rocks. In parts of Bangladesh, groundwater is contaminated by arsenic, a highly toxic chemical.
Water treatment aims to remove pollutants from the ‘raw’ collected water and so produce water that is pure enough for human consumption (Figure 1.32). Substances that are removed during the process of drinking water treatment include suspended solids (e.g. silt, soil), bacteria, algae, viruses, fungi, minerals (e.g. iron, manganese and sulphur), and synthetic chemical pollutants (e.g. fertilisers).
A combination of processes is used worldwide in the treatment of water for human consumption. The combination varies according to the nature of the raw water. The processes include:
● chlorination – to control any biological growth (e.g. algae)
● aeration – to remove dissolved iron and manganese
● sedimentation – to remove suspended solids
● filtration – to remove very fine sediments
● disinfection – to kill bacteria.
Delivery – In many countries, particularly HICs, water is delivered from the treatment works to the point of consumption (the home, factory, etc.) by means of pipes. The costs of installing pipe networks for the distribution of water are high, so too are the costs of maintaining the network. Unless the network is properly maintained, there can be large losses of water from leaking pipes.
In the urban areas of many LICs, water is more often delivered by standpipes (pipes through which water is pumped vertically) in the streets. In villages, wells are important water sources. Often well water is used untreated. Where water is collected in buckets and carried from a well or standpipe into the home, there are further risks of pollution. Buckets and plastic containers may be dirty. Water left in open buckets in the home are vulnerable to pollution by dust, insects and animals. A universal problem with the delivery of water by standpipes and wells is the time spent collecting the water (Figure 1.32).
Figure 1.32: Three stages in the supply of clean water – collection (reservoir), treatment (waterworks) and delivery (standpipe)

25
Ch
apte
r 1:
Riv
er e
nviro
nmen
ts
There is a fourth and relatively new way of delivering water – in plastic bottles filled at a source such as a spring. This is a very expensive way to deliver water because of the cost of the plastic containers, and of filling and transporting them to the point of sale. It is interesting to note that the biggest sales of bottled water occur in HICs. Some people are worried that drinking piped domestic water might be risky. In other words, they are concerned about water quality and the efficiency of water treatment, even in HICs.
Water management is not just about ensuring a good supply of clean water. Dams and reservoirs can serve a number of different purposes, such as generating electricity, supplying irrigation water, flood control and improving navigation. This multi-purpose use of water, or river management is well illustrated by the Three Gorges Dam project in China.
Case study: The Three Gorges Dam project (China)
The project, started in 1997, has been undertaken mainly for electricity productionandfloodcontrol.Figure1.33showsthelocationoftheprojectinthemiddleofChinaandonitslongestriver,theYangtze.Thedamwasfinishedin2009andisthelargestintheworld.Itis185mhighandalmost 2 km wide. The reservoir of water that will build up behind the dam is expectedtobeupto600kmlong.Hydro-electricgeneratorsatthedamwillproduceabout10%ofChina’spresentelectricityneeds.Chinabadlyneedsthis electricity if it is to continue to industrialise. In the interests of reducing globalwarming,Chinaneedstoburnlesscoal.
The major disadvantage of building such a massive reservoir is that more than 1 million people have lost their homes and had to be resettled. By the time it isfull,thereservoirwillhavedrowned13cities,140townsand1350villages.ThefloodingoftheYangtzevalleyhasmeantlosingsomeofthecountry’sbestand most fertile farmland. It is also likely that silt will be trapped behind the dam,makingthefarmlandlowerdowntheYangtzelessfertileovertime.
C H I N A
Three Gorges Dam project
Chongqingdam
Yichang Shanghai
Beijing
Yangtze River
Wuhan
0 500km
N
Figure 1.33: The location of the Three Gorges Dam project
What do you think are the advantages and disadvantages of bottled water?
In what ways will the Three Gorges DamprojecthelpthegrowthofindustryinChina?

26
Ch
apte
r 1:
Riv
er e
nviro
nmen
ts
Tonnes of industrial and human waste will also be trapped behind the dam. A major concern is whether the dam will be able to withstand the earthquakes thatoftenoccurinthispartofChina.Ifthedamweretocollapsemanymillions of people would die.
Environmentalists have questioned the wisdom of the whole project. They arguethataseriesofsmallerhydro-electricdamsonthetributariesoftheYangtzewouldhavebeenamoreefficientwayofgeneratingelectricityandmanagingtheflood-proneriver.However,onelongreservoirdoesofferimproved,year-roundnavigation,aswellaswaterforindustryandagriculture.Any domestic use of the reservoir’s water will require proper treatment.
Figure 1.34: The completed Three Gorges Dam
1.8 Flooding – causes and controlFlooding occurs when the amount of water moving down a river exceeds the capacity of the river’s channel. The excess water overflows the banks and spills out across the flood plain. Flooding is a hazard that can cause great damage to the environment and people.
Causes
Rivers usually flood as a result of a combination of causes. This combination can involve both natural (physical) and human factors. In many cases, natural flooding is made worse by people and their activities.
Most flooding is related to spells of very heavy rainfall. The critical factor is how quickly this rainfall reaches the river from where it falls on surrounding land and mountains. The shorter the lag time (see Figure 1.8 on page 6) and therefore the faster it does so, the greater the chances of flooding.
Make a list of the disadvantages of the ThreeGorgesDamproject.

27
Ch
apte
r 1:
Riv
er e
nviro
nmen
ts
FACTOR
Physical Impact
Weather Intense rainfall greater than the infiltration capacity of the ground.Prolonged rainfall leading to saturation of the ground.Rapid snow melt as temperatures suddenly rise above freezing
Rock Impermeable rocks limiting percolation and encouraging rapid surface run off or overland flow
Soil Low infiltration rate in certain soils, e.g. clays
Relief Steep slopes causing fast run off
Drainagedensity
High drainage density means many tributary streams carry the rainwater quickly to the main river
Vegetation Low density vegetation absorbs little water and does not seriously impede run off
Human
Deforestation Cuttingdowntreesreducesinterceptionandspeedsuprunoff
Urbanisation Concreteandtarmacsurfacestogetherwithdrainsmeanquickerdelivery of rainwater to the river
Agriculture The risk of flooding increased by leaving the soil bare, overgrazing, monoculture and ploughing down rather than across slopes
Climatechange
Increasing temperatures, partly due to the burning of fossil fuels, cause more melting of ice sheets and glaciers, as well as more rainfall and more frequent storms
Table 1.3: Factors causing flooding
Table 1.3 lists some of the factors that reduce the lag time and therefore increase the chances of flooding.
Flooding can also result from persistent rain over a relatively long period of time. Gradually, the water table (level of water underground) rises and the soil becomes saturated. Downward infiltration ceases and water simply accumulates in shallow depressions and on low-lying land.
Figure 1.35: Floods in Sheffield, June 2007
WhichofthefactorsinTable1.3arelikelyto have the greatest effect on lag times? It would help if you were to look back to page6aboutthestormhydrograph.

28
Ch
apte
r 1:
Riv
er e
nviro
nmen
ts
In June 2007, the city of Sheffield in the UK received 269 mm of rain. The average total rainfall for that month is normally 67 mm. Sixty percent of that June rainfall fell in just three days. The fact that this rainfall fell on an impermeable urban surface located in a hollow at the foot of the steep-sided Pennine Hills greatly increased the seriousness of the flooding when the River Don burst its banks (Figure 1.35). Summer floods are relatively uncommon in the UK, but those that do occur seem to have a greater impact. Notable examples include the floods at Lynmouth, Devon (August, 1952) and Boscastle, Cornwall (August, 2004).
Consequences of floods
Figure 1.36 shows some of the more common impacts of flooding. River floods can certainly cause a lot of damage. As with all natural hazards, there are both immediate and long-term effects. The immediate effects of a flood on people include loss of life, destruction of property and crops, homelessness, the disruption of transport and communications and the loss of water supply and sewage disposal services.
landslides
soil erosion soil contaminationby sewage
destruction of settlements
Effects onenvironment
loss of wildlifehabitats
vegetationdestroyed
death and injury
damage toproperty
disruptionto transport
diseaseand stress
crops andanimals lost
contamination ofwater supply and loss
of services, e.g. gas insuranceclaims
Effects onpeople
loss ofbelongings
Figure 1.36: The effects of flooding on the environment and people
The difference between these three floods is that the Sheffield flood resulted from several days of persistently heavy rainfall. The Lynmouth and Boscastle floods resulted from much more intense rainfall occurring over an upland area in a shorter time.

29
Ch
apte
r 1:
Riv
er e
nviro
nmen
ts
In the longer term, there is the cost of replacing what has been lost and damaged. One particular challenge is removing the huge amounts of silt deposited by the floodwaters as they go down. In HICs the risks may be covered by insurance. In the case of the Sheffield flood in 2007, the estimated repair bill was £30 million. Two-thirds of this was needed for repairing damaged roads. Repairing some 1200 damaged homes cost over £3 million. The sums involved in fixing up the damage caused by this localised flood are nothing like the estimated costs of the great Mississippi flood in the same year. The cost of repairs here amounted to around $150 billion.
The poor in LICs, however, may lose everything in floods. With cropland ruined and animals lost, widespread famine can result. Stagnant floodwater polluted by human excrement can also become a serious health hazard. It is in these conditions that diseases like typhoid and cholera thrive. The need for emergency food and health aid in these circumstances becomes urgent. The best hope of recovery lies in the help provided by international aid organisations.
Control
Flood control and flood management can involve three different types of action (Figure 1.37).
Construction − This is the building of hard-engineering structures such as dams, flood embankments (raised artificial banks), sluice gates and relief channels (spillways). Basically these structures either hold back or help to safely dispose of flood water. These structures are generally expensive to build.
Adjustment or mitigation − There is an increasing trend towards flood control schemes that try to avoid or minimise potential flood damage. In other words, it requires working with nature rather than against it. This is sometimes referred as the soft-engineering approach to flood control. For example, it might involve
afforestation
reservoir
damflood basin
sluice gates
flood relief channel
wetland
channel straightening
limit of flooding
flood embankments (levées)
Figure 1.37: Some forms of flood management
SuggestreasonswhyfloodsinHICsareoftenmorecostlythanthoseinLICs.
It is important that you are clear about:
• thedifferencebetweenhardengineering and soft engineering
• whysoftengineeringismoreenvironmentally friendly.

30
Ch
apte
r 1:
Riv
er e
nviro
nmen
ts
restoring a river to its natural state or preserving marshes and wetlands on flood plains to act as valuable temporary stores of floodwater (like sponges). Other actions include stricter planning controls to ensure that there is little building on the flood plain. People in flood-risk areas should be encouraged to take out flood insurance. Putting in place better flood warning systems would help; so too would publicising what to do in an emergency.
Prediction − Prediction of river floods (their extent and depth) is important to flood control. Knowing how high, or wide a river can flood, helps people to decide, for example, how high river embankments need to be built. It also helps to avoid building houses, factories and services in areas of where there is a high risk of flooding.
The problem with prediction is that floods vary. Small floods are likely to occur fairly regularly – say, once every five years. Large floods may be expected less frequently – possibly once every 50 years. Perhaps once every 1000 years there will be truly exceptional flood of a huge scale. The question for river managers is to decide for which level of flood they should provide protection. This is known as risk assessment. Protecting against the regular five-year flood is going to be relatively cheap and easy. However, is it worth investing huge sums of money to provide protection against the hugely damaging ‘once-in-a-1000-years flood’? In many cases, river managers will take a middle course and aim to be able to deal with the medium threats of the 50 to 100-year floods. Clearly, where the risk is under assessed, protection is likely to prove inadequate.
Case study: Flood management in Bangladesh
EightypercentofBangladeshand90%ofitsover100millionpeoplelivelessthanonemetreabovesea-levelonthefloodplainsanddeltaofthreeverylargerivers−theGanges,BrahmaputraandMeghna(Figure1.38).Bangladeshistheworld’smostflood-affectedcountry.FloodmanagementinthisLICisliterally a matter of life or death. Major causes of the annual flooding include
Kathmandu
Lhasa
Delhi
Dhaka
B a y o f B e n g a lI N D I A
B H U T A N
A S S A M
T I B E T
C H I N A
B A N G L A D E S H
M YA N M A R
Tsangpo
Bramaputra
Ganges
Padma
Meghna
Jamuna
NE
PA
L
HI M
A L A Y A S
0 300 km
N
Figure 1.38: Catchment area of the rivers of Bangladesh
How might improved weather forecasting help the prediction of floods?

31
Ch
apte
r 1:
Riv
er e
nviro
nmen
ts
the monsoon climate with its heavy summer rainfall and tropical storms with the tidal surges that they cause. Melting Himalayan snow in summer and deforestation in Nepal are two other flood risk factors.
TheBangladeshiFloodActionPlan(FAP)fundedbytheWorldBankbeganin1990 and involves:
● building up embankments to protect the main cities, towns, roads andfarmland(Figure1.39)
● dredging channels that have been silted up so that they hold more floodwater
● straightening river channels to prevent erosion of banks or meanders
● constructing dams upstream to control flood waters before they reach the delta
● allowing controlled release of floodwater from river channels via spillways that have been constructed to allow the controlled release of flooding waters
● building huge reservoirs to hold some of the floodwater
● improving flood forecasting and public warning transmission systems
● building emergency shelters on areas of slightly higher ground.
TheFAPinvolvesamixofhard-andsoft-engineeringaction,butmoreoftheformer.Itisalong-termprojectandwillcontinuetorequiremorefunds than the Bangladeshi government can afford. Achieving effective flood management there is being made more challenging by two developments:
● the threat of global warming – it only needs a slight rise in sea level in the Bay of Bengal and much of Bangladesh will be flooded by the sea. Bangladesh badly needs to improve its coastal defences. On top of that, any rise in sea level will make it even more difficult for Bangladesh to get rid of its floodwater
● the three rivers of the Bangladesh’s delta area all flow for considerable distances through neighbouring India(Figure1.38).Relationsbetween Bangladesh and India are not always good. India could help Bangladesh by improving control of the floodwaters of these rivers before they reach Bangladesh. Equally India could pass the floodwaters on at an even faster rate and increase even more the flood risks in Bangladesh.
Figure 1.39: Mud embankments being built by hand
In your own words, suggest a definition for the term ‘ flood management’.
32
Ch
apte
r 1:
Riv
er e
nviro
nmen
ts
End of chapter checkout
Now you have read the chapter, you should know:
how water moves between the land, sea ✓and air in the hydrological cyclethe main features of a drainage basin✓how to interpret what a hydrograph shows✓what a river regime is, and the factors ✓affecting ithow running water affects the ✓development of landforms through the processes of erosion, transport and depositionhow valleys and their distinctive features ✓are formed the importance of water in our everyday ✓livesthe reasons for the rising demand for ✓waterwhy there are areas of water shortage and ✓water surplusthe reasons why water quality varies✓the main sources of water pollution✓how water is treated and delivered to ✓consumersthe causes of flooding✓how the risk of flooding is controlled✓
Make sure you understand these key terms:
Abstraction: the taking of water from rivers, lakes and from below the watertable.Base flow: the usual level of a river.Channel network: the pattern of linked streams and rivers within a drainage basin.Dam: a large structure, usually of concrete, sometimes earth, built across a river to hold back alargebodyofwater(reservoir)forhumanuse.Discharge: the quantity of water flowing in a river channel at a particular location and time.Erosion: the wearing away and removal of material by a moving force, such as running water.Deposition: the dropping of material that was being carried by a moving force, such as running water.Flood plain: the flat land lying either side of a river which periodically floods.Hydrograph: a graph showing the discharge of a river over a given period of time.Hydrological cycle: the global movement of water between the air, land and sea.Interlocking spur: a series of ridges projecting out on alternate sides of a valley and around which a river winds.Levee: a raised bank of material deposited by a river during periods of flooding.Mass movement: the movement of weathered material down a slope due to the force of gravity.Meander: a winding curve in a river’s course.
Oxbow:ahorseshoe-shapedlakeoncepartofameandering river, but now cut off from it.Pollution: the presence of chemicals, dirt or other substances which have harmful or poisonous effects on aspects of the environment, such as rivers and the air.Reservoir: an area where water is collected and stored for human use.River regime: the seasonal variations in the discharge of a river.Stores: features, such as lakes, rivers and aquifers, that receive, hold and release water. Stormflow: the increase in stream velocity caused by a period of intense rainfall.Stream velocity: the speed at which water is flowing in a river channel at a given location and time.Transfers: the movement of water between stores in the hydrological cycle.Transport: the movement of a river’s load.Waterfall: where a river’s water falls vertically, as where a band of hard rock runs across the river channel.Watershed: the boundary between neighbouring drainage basins.Weathering: the breakdown and decay of rock by natural processes, without the involvement of any moving force.See the Glossary in the ActiveBook for more definitions
1 Drawasimplifiedlabelleddiagramofthehydrologicalcycle.2 a) Whatisthedifferencebetweena‘store’anda‘flow’? b) Namethethreemainstoresofthehydrologicalcycle. c) Namesixdifferenttypesofflow.3 a) Nametwoinputsandtwooutputsofthedrainagebasincycle. b) Whatis:
● a watershed •a confluence?4 Explain how each of the following affects the drainage network:
● rock type •land use.5 a) Whatismeantbytheterm‘lagtime’? b) Describehowlagtimeisaffectedbyeachoffollowingfactors:
● slope •temperature● precipitation •vegetation.
6 ReferringtoFigures1.16and1.17,comparetheregimeoftheGangeswith that of the Thames.
7 a) Whatisthedifferencebetween‘weathering’and‘massmovement’? b) Describethefourmainwaysthatriverstransportload.8 a) Howdoesariverchangewhenitleavesanuplandarea? b) Whyisdepositiongreateralongthelowlandsectionofariver?9 a) WhatprocessesareresponsiblefortheformationofaV-shapedvalley? b) Describethreeotherlandformsproducedbyriversinuplandareas.10 Drawasimplified,labelleddiagramtoshowhowmeandersandox-bows
are formed.11 Compareestuariesanddeltasintermsofthewaytheyareformed.
12 a) UsingFigure1.19,drawasketchmapoftheRiverTayestuaryeastofeasting 20.
b) Onyoursketchmap,showandlabelfourfeaturescommonlyfoundina river estuary.
c) Whataretheadvantagesanddisadvantagesofthisestuaryforshipping?13 a) Whatarethefivemainusesoffreshwater? b) Whatarethemainsourcesoffreshwater?14 Why has the demand for water increased so much over the last 100 years?15 Why is water quality so important?16 Give four other causes of river pollution17 Explain how a) industry and b) agriculture pollute water.18 Drawalabelleddiagramtoshowthestagesinmanagingthesupplyof
clean water.19 a) Makeatwo-columnlistofthebenefitsandcostsoftheThreeGorges
DamprojectinChina. b) Whichofthetwocolumnsdoyouthinkismoreimportant?
Give your reasons. 20 a) Identifyfourphysicalfactorsthathelpcauseflooding. b) Explainhowdeforestationandurbanisationalsocauseflooding.21 Give examples of a)theshort-termandb)thelong-termconsequences
of flooding.22 a) Whatismeantbytheterm‘floodadjustment’? b) Whatisthedifferencebetween‘soft’and‘hard’engineeringinthe
management of floods?
Try testing yourself with these questions:
Checklists
Questions