Embed Size (px)
Citation preview

Public Opinion Quarterly, Vol. 73, No. 4, Winter 2009, pp. 679–703
THE NATURE OF POLITICAL IDEOLOGY IN THECONTEMPORARY ELECTORATE
SHAWN TREIERD. SUNSHINE HILLYGUS
Abstract Given the increasingly polarized nature of American poli-tics, renewed attention has been focused on the ideological nature of themass public. Using Bayesian Item Response Theory (IRT), we examinethe contemporary contours of policy attitudes as they relate to ideo-logical identity and we consider the implications for the way scholarsconceptualize, measure, and use political ideology in empirical research.Although political rhetoric today is clearly organized by a single ideolog-ical dimension, we find that the belief systems of the mass public remainmultidimensional, with many in the electorate holding liberal preferenceson one dimension and conservative preferences on another. These cross-pressured individuals tend to self-identify as moderate (or say “Don’tKnow”) in response to the standard liberal-conservative scale, therebyjeopardizing the validity of this commonly used measure. Our analysisfurther shows that failing to account for the multidimensional natureof ideological preferences can produce inaccurate predictions about thevoting behavior of the American public.
There appears to be a consensus among scholars and political observers thatU.S. political elites have grown more polarized in recent decades. Democratsand Republicans in Congress more consistently oppose each other on legis-lation (McCarty, Poole, and Rosenthal 2006), the party platforms are moreideologically extreme (Layman 1999), and issue activists are more committedto one political party or the other (Stone 1991). In contemporary American
SHAWN TREIER is with the University of Minnesota, 1414 Social Sciences Building, 267 19th Ave S,Minneapolis, MN 55455, USA. D. SUNSHINE HILLYGUS is with Duke University, 409 Perkins Library,Box 90204, Durham, NC 27708-0204, USA. The authors would like to thank Chris Federico, PaulGoren, Dean Lacy, Andrew Martin, Caroline Tolbert, Claudine Gay, Dan Carpenter, Kevin Quinn,Eric Schickler, the participants of the University of Minnesota American Politics Pro-seminar,three anonymous reviewers, and editor Jamie Druckman for helpful feedback and suggestions.Address correspondence to D. Sunshine Hillygus; e-mail: [email protected].
doi:10.1093/poq/nfp067 Advance Access publication December 4, 2009C© The Author 2009. Published by Oxford University Press on behalf of the American Association for Public Opinion Research.All rights reserved. For permissions, please e-mail: [email protected]

680 Treier and Hillygus
politics, Republican politicians consistently line up on the conservative side ofan issue while Democratic politicians consistently line up on the liberal side,across different policy domains. With just the liberal or conservative label, then,we can quite accurately predict a politician’s stance on policy issues as dis-parate as taxes, health care, or abortion. Put another way, the belief systems ofpolitical elites in the United States today are captured with a single dimensionof ideology.
Can the policy preferences of the American public be similarly characterized?Although this question has been the subject of considerable research over theyears (e.g., Marcus, Tabb, and Sullivan 1974; Conover and Feldman 1984;Jacoby 1991), it takes on a new prominence given the recent polarization debate.Some scholars have argued that the sharpening of policy differences betweenpolitical elites in recent decades has increased ideological identification andpolarization in the public as well (Abramowitz and Saunders 1998). In contrast,others argue that the majority of the public remain moderate on most policyissues even as elected representatives have grown further apart (Dimaggio,Evans, and Bryson 1996; Fiorina 2004). Morris Fiorina concludes that thegreat mass of American people “are for the most part moderate in their viewsand tolerant in their manner. . . it is not voters who have polarized, but thecandidates they are asked to choose between” (Fiorina 2004, pp. 8, 49).
Given the increasing salience of political ideology in American politics,it seems important to examine how ideology is conceptualized by the publicrelative to how it is operationalized and measured by researchers. Both sides ofthe polarization debate seem to assume that the ideological labels people use area meaningful representation of their public policy preferences—an assumptiononce challenged by early public opinion research that concluded the publicwas incapable of ideological thinking (Converse 1964). The generalizationsthat scholars make about the behavior, attitudes, or thinking of the Americanelectorate could be wholly inaccurate if the liberal-conservative continuum sooften used in empirical analysis is an inadequate measure of policy preferences.
In this article, we examine the contemporary contours of policy attitudes asthey relate to ideological identity. And we consider the implications for theway scholars conceptualize, measure, and use political ideology in theoriesand models of political behavior. Although political rhetoric today is clearlyorganized by a single ideological dimension, we find that the belief systemsof the mass public are multidimensional. Using Bayesian Item Response The-ory (IRT), a methodological approach with unique advantages over previousestimates of ideological preferences, we show that many in the electorate holdliberal preferences on one dimension and conservative preferences on another.These cross-pressured individuals tend to self-identify as moderate (or say“Don’t Know”) in response to the standard liberal-conservative scale, raisingquestions about the validity of this commonly used measure and underminingcharacterizations of the American public as either policy centrist or ideologi-cally innocent.

The Nature of Political Ideology 681
1972 1976 1980 1984 1988 1992 1996 2000
0%
5%
10%
15%
20%
25%
30%
35%
40%
Liberal SlightlyLiberal Moderate Don’t
KnowSlightlyConservative Conservative
Figure 1. Political Ideology, American National Election Study CumulativeFile.
Measuring Ideology
In characterizing the ideological preferences of the American public, scholarstypically rely on a survey question asking respondents to place themselves ona liberal-conservative continuum. The question is typically of the followingsort: “When it comes to politics, do you usually think of yourself as extremelyliberal, liberal, slightly liberal, moderate or middle of the road, slightly con-servative, conservative, extremely conservative, or haven’t you thought muchabout this?”1
As Fiorina (2004) and others have pointed out, only a small percentageof Americans consider themselves to be extreme ideologues, either liberal orconservative. As shown in figure 1 the plurality of Americans characterizethemselves as ideologically moderate or say “Don’t Know.”2 Just as Ameri-cans like to consider themselves “middle class,” individuals like to think ofthemselves as ideologically moderate. The trend line does suggest that Amer-icans today are better able to place themselves (as evidenced by the decline
1. This is the standard question asked since 1972 in the National Election Study (and oftenreplicated in other surveys).2. The “extreme” categories are collapsed with the respective conservative and liberal categories.In 2000, for instance, 2 percent of respondents called themselves “extremely liberal” and 3 percent“extremely conservative.”

682 Treier and Hillygus
in DK responses), but we also see a corresponding increase in the percentageidentifying as moderate.
Does this imply that the public is necessarily centrist in their policy prefer-ences? Or is this a reflection of the “ideological innocence” of the electorate?In other words, what exactly do the ideological labels mean? Classic publicopinion research treated the high levels of DK and moderate responses as ev-idence that the public lacked the political sophistication to think ideologically(Converse 1964). This perspective was bolstered by research showing dis-connects between self-identified ideology and policy preferences (Robinsonand Fleishman 1988), response instability in ideology questions across time(Kerlinger 1984), and sensitivity to question wording (Schuman and Presser1981). Levitin and Miller (1979, p. 768) concluded that “when people describethemselves as having an ideological position, they also seem to be sayingsomething about their positions on the parties quite apart from their issue orpolicy stands.” Others found that ideological self-placement was rooted in sym-bolic considerations, group affiliations, and parental socialization rather thanpolitical issues (Conover and Feldman 1981).
In contrast, recent research concludes that the polarization of the broaderpolitical environment has helped to clarify the meaning of ideological labelsfor the general public (Levine, Carmines, and Huckfeldt 1997; Abramowitzand Saunders 1998). When political elites are more ideologically consistent,politics becomes packaged on an ideological basis (Hinich and Munger 1997).Thus, as candidates have polarized and have campaigned on explicitly ide-ological rhetoric, ideological labels have become increasingly salient for thevoters, thereby allowing individuals to better sort themselves into the appro-priate ideological category (Levendusky 2009). George W. Bush, for instance,campaigned on a message of “compassionate conservatism” in 2000, and al-though Al Gore did not label himself a liberal, the media frequently did, andhe clearly associated himself with the “liberal” New Deal groups like laborunions and civil rights organizations. Not surprisingly, then, analysis of the2000 electorate finds that “citizens were able to place candidates and partiesquite accurately along the liberal-conservative continuum. In fact, they werenot confined to the most knowledgeable strata, as has been the case in mostprior election years” (Jacoby 2004, p. 118). Thus, as Knight (1999, p. 62)explains: “while a generation ago direct self-labeling tended to be dismissed(e.g., Free and Cantril 1967), direct measures of liberal-conservatism are nowthe dominant means of assessing individual ideology in political science.”
Yet, even as the public might be more aware of what it means to be aconservative or liberal, it does not mean that the liberal-conservative scale ad-equately captures their policy preferences. The standard ideology survey ques-tion assumes that individuals can be placed on a single (liberal-conservative)dimension but, as the political world has polarized, there is also increasingdifferentiation between social and economic issues (Shafer and Claggett 1995;Inglehart 1997; Layman and Carsey 2002; Carmines and Ensley 2004). And
The Nature of Political Ideology 683
the distinctiveness of these two dimensions of ideology might have conse-quences for our ability to interpret responses to the standard ideology question(Kerlinger 1984).
If ideological preferences are multidimensional, it means that responses to theunidimensional ideology question, especially the moderate and DK categories,likely capture not only those who are centrist but also those who are cross-pressured between policy domains. For someone with a liberal position onone policy dimension and a conservative one on another, the “liberal” and“conservative” labels are simply inadequate descriptors of political beliefs. Assuch, when asked their political ideology on a one-dimensional scale, theseindividuals should be more likely to say DK or to select the middle category.Research on attitudinal ambivalence has shown that individuals who are tornbetween competing considerations are more likely to skip the survey questionor to select the middling category (Alvarez and Brehm 1995). We expect asimilar pattern for the ideologically cross-pressured.3 On the other hand, evenif we conceptually recognize the existence of multiple dimensions, a singledimension will remain adequate if ideology is able to predict preferences acrossa variety of different issue domains, as appears to be the case for political elites(McCarty, Poole, and Rosenthal 2006).
In the analysis that follows, we examine the extent to which the one-dimensional ideology question captures the policy preferences of the Americanpublic in today’s polarized environment by examining the contours of policyattitudes as they relate to ideological identification. We then scrutinize any dis-connects between policy preferences and ideological identification to determineif they are the result of inadequacies of the survey respondents or inadequaciesof the survey question (Achen 1975).
Data and Methods
To evaluate the relationship between policy attitudes and ideological identity,we estimate latent measures of economic and social policy preferences usingBayesian item response theory (IRT). The Bayesian IRT model offers a numberof methodological advantages to alternative methods, such as an additive scaleof issues (Heath, Evans, and Martin 1994; Abramowitz and Saunders 1998) orfactor analysis (Layman and Carsey 2002; Ansolabehere, Rodden, and Snyder2008). An additive scale, although easy to compute, assumes that every issuecontributes equally to the underlying preference dimension. The IRT measure,like factor analysis, does not require such an assumption. For instance, if socialpreferences are more strongly related to abortion attitudes than to environmentalpolicy attitudes, this difference will be captured in the IRT discriminationparameters. But in contrast to conventional factor analysis, the IRT measure
3. Using the 1984 NES, William Jacoby similarly finds that attitudinal consistency is related toideological identification (Jacoby 1991).

684 Treier and Hillygus
does not assume a multivariate normal distribution for all observed variables.When this is not an appropriate approximation (e.g., dichotomous or ordinalvariables), conventional factor analysis can produce biased preference estimates(Kaplan 2004).4 The IRT model directly models the appropriate distributionof the observed indicators, whether nominal, binary, ordinal, or continuous (orany mixture of types).
Finally, with the Bayesian IRT model, the latent measures (or factor scores)are estimated directly and simultaneously with the discrimination parameters—rather than as postestimation by-products of the covariance structure, as is thecase with conventional factor analysis. Consequently, these traits are subjectto inference just like any other model parameter, so we can calculate theuncertainty estimates for the latent measures. It is a simple fact that all latentconcepts are necessarily measured with error, but alternative methods requirethe assumption that the resulting estimate is the “true” value. In contrast, we canquantify if we do a better or worse job of estimating someone’s placement onthe ideological dimensions. And we can then take into account this uncertaintywhen we use these latent measures as independent variables in subsequentempirical models.
In estimating our latent policy dimensions, we rely on 23 questions from the2000 American National Election Study (survey details and question wordingreported in the appendix). Although these questions do not exhaust the universeof policies that might be related to an individual’s general belief system, theyoffer a wide range of politically relevant issues. Five of the issue questionshad a split sample design, in which respondents received either a “scale” or“branching” question format, so each respondent was asked just 18 differentpolicy questions. Because the ideology questions are split between a branchingand scale format in the preelection survey, this survey also offers the opportunityto evaluate different approaches to measuring ideological identification.
We model individual issue responses as a function of the unobserved prefer-ence dimension via an ordinal item-response model (Treier and Jackman 2008).Given the large number of parameters in the model and the difficulty in esti-mating the parameters jointly using classical methods of maximum likelihood,we work in a Bayesian setting, using Markov Chain Monte Carlo (MCMC)methods to explore the joint posterior density of the model parameters (fora survey of these methods and their applicability to researchers see Jackman(2000, 2004); Gill (2008)). We implement this MCMC scheme using Win-BUGS (Lunn et al. 2000).5 We use diffuse normal priors for the discriminationparameters with mean zero and variance 1,000 and standard normal priors for
4. Alternative approaches are available (e.g., factor analysis on polychoric correlation matrix) butthese too have limitations and it is more common for researchers to simply ignore this assumption.5. We let the algorithm run for 100,000 iterations as burn-in, moving away from the start valuessuch that subsequent iterations represent samples from the joint posterior density. Estimates andinferences are based on 500,000 iterations, thinned by 100, in order to produce 5,000 approximatelyindependent draws from the posterior density.

The Nature of Political Ideology 685
the preferences. The cutpoints are parameterized as the sum of parameters de-fined as in Treier and Jackman (2008, p. 215) and are assigned priors whichensure the ordinality of the cutpoints.
One attractive feature of the Bayesian approach is that it simplifies treatmentof missing data, which are quite high in the measures used—both becauseof the question wording experiments and because of item nonresponse. Forinstance, for individual issue questions we find that as many as 14 percent ofrespondents refused to answer or gave a DK response. In total, just 42 percentof respondents answered all issue questions that were asked of them. With aBayesian approach, an individual’s latent ideology scores are estimated withthe data available for that individual, and those estimates are simply less precisefor those with less data. Critically, that uncertainty can then be accounted forin subsequent statistical models. In contrast, classical factor analysis wouldrequire a correction to the “swiss cheese” data structure, by either collapsingthe different question formats, using listwise deletion, or in some way imputingdata to fill in the holes.
Estimation of the IRT model requires a number of restrictions for identifi-cation. For a one-dimensional model, the location and scale are established bynormalizing the mean to zero and the variance to one. For more than one dimen-sion, similar to a confirmatory factor analysis, the parameters can be identifiedwith appropriate restrictions on the discrimination parameters. At minimum,this requires identifying a representative item for each dimension, for whichthe discrimination parameter is set equal to 1, and restricting at least one ofthese items to load only on that dimension (for details, see Aguilar and West2000). To allow for a more complex and realistic latent measure, we imposeadditional restrictions, as discussed below, and conduct robustness checks toensure the restrictions do not unduly impact the results.
Dimensions of Ideology
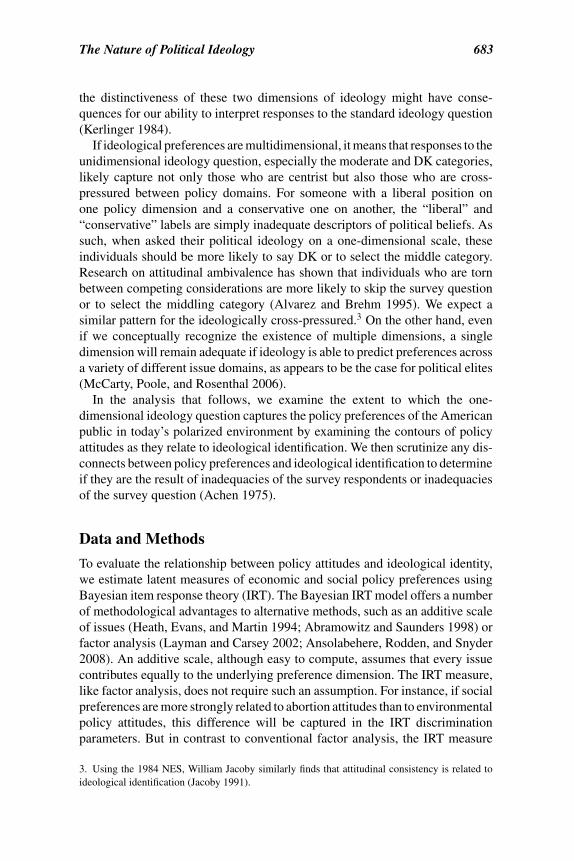
Is one dimension of ideology sufficient to capture the policy preferences ofthe American public? We compare alternative estimations of latent ideology intable 1. Reported are the estimated discrimination parameters, which tap theextent to which each issue explains variation in the latent scores. If a policyitem does not help us distinguish among respondents with different preferenceson each dimension, the discrimination parameter will be indistinguishable fromzero. The wide variation we see in the size of the discrimination parametershighlights the advantage of the IRT measure over a simple additive scale, whichwould have assumed that all issues loaded equally on the liberal-conservativecontinuum.
Starting with the unidimensional measure reported in the first column, wesee that the individual social issues do not load as highly on the latent scalecompared to the economic issues. We are hesitant to conclude that this means
686 Treier and Hillygus
Table 1. Discrimination Parameters for One and Two-Dimensional Models
Independent Correlated
1D Economic Social Economic Social
Aid to poor spending 1.49 1.89 −0.24 1.80 0.00Government services (branching) 1.59 1.67 0.00 1.70 0.00Guaranteed jobs (branching) 1.33 1.60 −0.18 1.53 0.00Health insurance (branching) 1.23 1.37 −0.10 1.36 0.00Public school spending 1.28 1.24 0.26 1.27 0.00Welfare spending 1.06 1.15 0.01 1.17 0.00Guaranteed jobs (scale) 0.99 1.13 −0.09 1.12 0.00Social security spending 0.88 1.10 −0.31 1.03 0.00Government services (scale) 1.49 1.00 0.00 1.00 0.00Health insurance (scale) 0.93 0.91 0.08 0.92 0.00Tax cut from surplus 0.40 0.25 0.50 0.29 0.00Affirmative action 0.92 0.94 0.12 0.91 0.11Environment (scale) 1.13 0.99 0.44 0.87 0.41Gun control 0.97 0.85 0.44 0.73 0.41Environment (branching) 0.92 0.81 0.37 0.72 0.35Death penalty 0.46 0.42 0.19 0.38 0.15Abortion, partial-birth 0.44 0.21 0.76 0.00 0.72Abortion, parental consent 0.39 0.09 1.12 0.00 0.96Abortion 0.45 0.00 1.00 0.00 1.00Women’s role (scale) 0.65 0.41 1.06 0.00 1.09Women’s role (branching) 0.43 0.11 1.29 0.00 1.14Gays in military 0.69 0.45 1.58 0.00 1.52Gay adoption 0.85 0.77 2.43 0.00 2.51DIC 65,842.6 63,839.2 64,010.7Correlation 0.30
that social issues are necessarily “less important,” however. For one, sincewe included more economic issue questions than social issue questions, it isnot terribly surprising that our underlying latent dimension is more economic-based. More importantly, the fact that the social issues all load rather poorlyon a single dimension offers an initial indication that these issues might forma distinct dimension. Certainly, scholars have long argued that political issuesfall along at least two different dimensions (Shafer and Claggett 1995).6
6. Others have identified additional dimensions on foreign policy and race (Carmines and Stimson1989). As a robustness check, we estimated a third dimension defined in reference to affirmativeaction attitudes (reported in online appendix on POQ website). This dimension had some oddcharacteristics—small and even unexpectedly negative loadings on some issues—likely reflectingthe small number of questions available. And the largest loadings for this dimension (e.g., welfarespending) had even larger loadings on other dimensions, indicating they were more closely relatedto another dimension. More importantly for our purposes, the structure of the economic and social

The Nature of Political Ideology 687
Confirming this expectation, we find that two dimensions of ideology (mid-dle columns in table) better summarize the public’s policy preferences, asevidenced by the improvement in the Bayesian deviance information criterion(DIC), the goodness of fit measure. The smaller the value of DIC, the better themodel. We also see that the items which loaded weakly on the one-dimensionalmodel are the strongest items on the second (social) dimension.7
This two-dimensional model was estimated with the loosest restrictionspossible—an unconstrained model where all but two indicators were allowed toload on either dimension.8 The economic dimension is defined by the questionconcerning government spending and services (scale format), while the itemon abortion is associated exclusively with the social dimension. Although thisspecification makes clear that a two-dimensional model is preferable to a onedimensional one, it seems unrealistic to assume that the economic and socialdimensions are orthogonal. To relax this assumption, allowing preferences onthese two dimensions to be correlated, we have to implement additional restric-tions. To estimate these correlated dimensions, we restrict many of the items toload on only one dimension or the other. Those items that did not clearly loadbetter on one dimension or the other in the independent models were allowedto load on both dimensions.9 The resulting discrimination parameters are re-ported in the final columns of the table.10 In addition to providing a clearerstructure which identifies these dimensions as economic and social preferences,these preferences are now allowed to correlate, which they do at a moderatelevel of 0.30. Reassuringly, we find the individual discrimination parameterslook nearly identical with either specification. In the remainder of the analy-sis, we rely on this correlated two-dimensional latent measure to evaluate theself-reported measures of ideology.11
dimensions are unchanged by the inclusion of a third dimension. The correlation between economicdimensions with and without the third dimension is 0.979 (0.954 for social dimensions).7. Indeed, the respondents’ preferences in the 1D model match well with the economic preferencesin the 2D model (0.962 correlation), but less so with social preferences (0.580).8. An alternative identifying restriction is to fix individual respondents on the latent dimension. Weobtain similar results when normalizing by fixing the positions of three respondents: one extremelyliberal on both dimensions [−3, −3], one extremely conservative on both [−3, −3], and onerespondent extreme on both, but cross-pressured [−3, −3]. The resulting latent scores correlatewith those reported at .995 on the economic dimension and .995 on the social dimension.9. As a robustness check, we have also estimated a model where every item loaded only on onedimension, with nearly identical results. The resulting latent scores correlate with those reportedat .995 on the economic dimension and .993 on the social dimension.10. We find no evidence that the estimates do not converge. For each set of estimates, 5.5 percentor less of the parameters fail Geweke’s diagnostic, an amount, under standard levels of statisticalsignificance, one would expect to randomly occur if all of the parameters converged to the stationarydistribution.11. A comparison of an additive scale created using the issue items available for each respondentfinds a correlation of .82 for the economic dimension and .67 on the social dimension. Thelower correlation for the social dimension no doubt reflects the greater variability found in thediscrimination parameters, again affirming the advantages of the IRT model. Unfortunately, we

688 Treier and Hillygus
ExtremelLiberaly Liberal
SlightlyLiberal Moderate
SlightlyConservative Conservative
ExtremelyConservative Don’t Know
ExtremelLiberaly Liberal
SlightlyLiberal Moderate
SlightlyConservative Conservative
ExtremelyConservative Don’t Know
−1
−2
−3
Eco
nom
ic P
refe
renc
es
−0.92
−0.47−0.31
−0.06
0.410.62
0.95
−0.26
−1.32
−0.89−0.64
−0.12
0.30.57
1.08
0.32
3
2
1
0
−1
−2
−3
Soc
ial P
refe
renc
es
3
2
1
0
Figure 2. Latent Policy Preferences by Self-Reported Ideology.
Comparing Ideology Measures
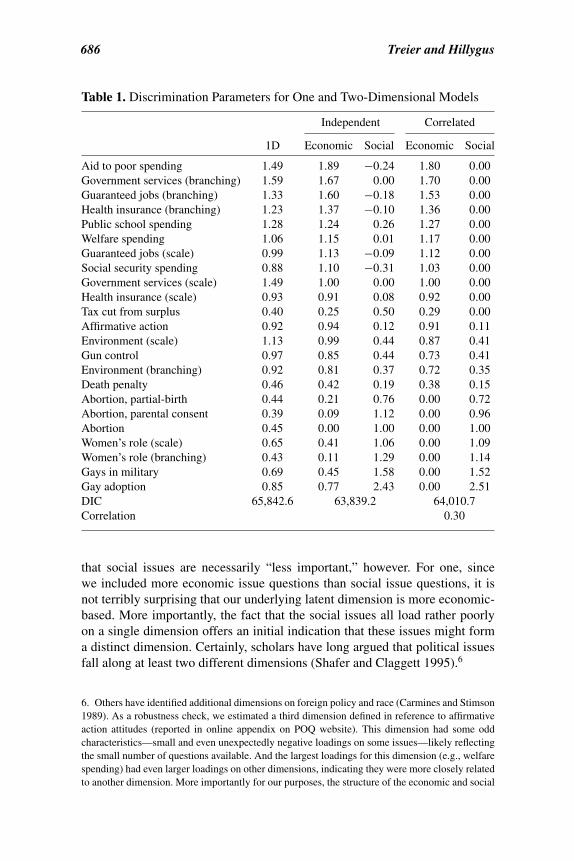
We start by separately comparing each latent dimension to the ideologicalself-placement scale in the postelection survey. In figure 2, we graph the cor-responding box plot of estimated latent scores for each response category.12
The figure shows a clear relationship between policy attitudes and ideological
cannot create a directly comparable estimate using factor analysis given the pattern of missing dataand the discrete nature of some of the variables.12. In a box plot graph, the box indicates the interquartile range (marking the lower quartile,median, and upperquartile), the whiskers show the range of the data (1.5 times the interquartilerange), and circles indicate outliers.

The Nature of Political Ideology 689
self-placement—with self-identified liberals having more liberal policy pref-erences on social and economic issues than self-identified conservatives andvice-versa. At the same time, the graph highlights the considerable variabil-ity in the policy preferences of each group, especially among self-identifiedmoderates and those answering “don’t know.” Indeed, the interquartile range(the box) of the moderate respondents overlaps the median value of all butthe extreme ideologues, offering the first indication that the moderate label, inparticular, covers a wide range of policy attitudes.
The box plot graphs offer other interesting comparisons as well. First, relativeto self-identified liberals (of any intensity), self-identified conservatives in thesample have more diverse policy preferences on both dimensions, as evidencedby the longer whiskers. This no doubt reflects the negative connotations associ-ated with the liberal label that has been prevalent in American politics in recentdecades. Differences in the social desirability of the ideological labels meanthat more people are willing to identify as “conservative” even though theydon’t necessarily hold the policy preferences associated with the label (Miller1992). Comparing across dimensions also finds that self-identified liberals andconservatives are more polarized (i.e. further from 0) on the social dimensionthan on the economic dimension.
Second, we see that the intervals between categories are not equal, as isassumed by the 7-point self-placement scale. In particular, there is a muchlarger gap in the median between those who call themselves “extremely” liberal(conservative), and those who call themselves liberal (conservative) relative toother gaps on the scale. In contrast to the ideological self-placement measure—in which ideological labels can mean different things to different people—our latent measure of policy preferences places all respondents on the sameunderlying policy scale and provides finer distinctions between individuals.
Finally, we see that those who say “don’t know” have a preference distri-bution quite similar to that of self-identified moderates. Self-reported ideologyquestions often have rather high levels of DK responses, leaving scholars un-sure how to handle the missing data problem. The similarities we see here offersome empirical justification to simply recoding DK to be moderate (rather thanomitting them from the analysis), as is common in some research. To be clear,though, the reason the two groups look so similar is that self-identified mod-erates, like the don’t knows, have an equally diverse set of policy preferences.Undoubtedly, both the DK and moderate responses are selected for a variety ofreasons, only some of which reflect centrism (for self-identified moderates) oruncertainty (for DK).
The latent measures offer a benchmark for evaluating the various mea-sures of ideology available in the 2000 American National Election Study.Comparing the correlations between each of the ideology questions and thelatent measures, shown in table 2, finds that the postelection scale measureoutperforms the other two. It is perhaps not surprising that a postelection mea-sure outperforms a preelection measure since people might be better able to

690 Treier and Hillygus
Table 2. Comparison of Latent Measures and Self-reported Ideology
Latent economic Latent socialCorrelation Correlation
Preelection branching ideology .425 .490Preelection scale ideology .478 .523Postelection scale ideology .486 .547
NOTE.—Polyserial correlations are reported.
select an appropriate ideological label because of campaign information. Butwe also find that the preelection scale outperforms the preelection branchingquestion. This result offers some challenge to previous research that concludedthat branching measures were preferable to scale measures (Aldrich et al. 1982),but is consistent with other analysis of the 2000 ANES data (Aldrich, Griffin,and McKay 2002). For the remainder of the analysis evaluating ideologicalidentification, we rely on this standard postelection 7-point scale.
Turning to a comparison of the individual-level relationships between thesocial and economic dimensions, we plot in figure 3 each respondent’s so-cial and economic scores for self-reported conservatives, liberals, moderates,and don’t knows.13 For those who call themselves liberal or conservative, wesee that there is a clear relationship between the latent social and economicdimensions, with respondents clustered in the corresponding conservative orliberal quadrants of the graphs. Thus, the more conservative an individual’spreferences on social issues, the more conservative we expect her to be oneconomic issues, offering evidence of ideological constraint among this subsetof the electorate.
In contrast, there is a much weaker relationship between economic and socialissue preferences for moderates and DK respondents. For these respondents wesee a diffuse cloud of data points and a smaller Beta coefficient.14 This in-dicates that individuals who self-identify as moderates are not simply neutralor moderate across political issues, but are often cross-pressured between theeconomic and social dimension (located in quadrants 2 and 4). Some 44 percentof moderates and 47 percent of DK respondents are in these cross-pressuredquadrants. If we define someone as holding “centrist” policy positions if theyfall within the middle tercile of both the economic and social latent dimen-sions, we find that just 17 percent of self-identified moderates have centrist
13. The end categories of the post-election 7-point scale are collapsed so liberals and conservativesinclude the “extreme” ideologues. Not shown are the “slightly” categories; not surprisingly, theobserved relationships for this group fall in between that of ideologues and moderates.14. The reported Betas are the regression coefficients for the economic dimension regressed ontothe social dimension.

The Nature of Political Ideology 691
Soc
ial D
imen
sion
8.4%10.9%
65.3% 15.3%
−3 −2 −1 1 2 3
−3
−2
−1
12
3
Liberalβ̂ = 0.37
24.9%20.7%
31.6% 22.8%
−3 −2 −1 1 2 3
−3
−2
−1
12
3
Moderateβ̂ = 0.21
Economic Dimension
Soc
ial D
imen
sion
62.1%15.3%
8.9% 13.7%
−3 −2 −1 1 2 3
−3
−2
−1
12
3
Conservativeβ̂ = 0.32
Economic Dimension
26.1%34.7%
27.1% 12.1%
−3 −2 −1 1 2 3
−3
−2
−1
12
3
Don’t Knowβ̂ = 0.21
Figure 3. Economic versus Cultural Dimension of Ideology by Self-ReportedIdeology. Regression coefficients and percent of observations reported for eachcategory.
preferences.15 Even expanding the definition of centrist to include respondentswith preferences in the 25th to 75th percentile of both dimensions, we still findthat only 35 percent of self-identified moderates hold centrist positions on bothpolicy dimensions.
We also find slight asymmetries between liberal and conservative identi-fiers that again seem to reflect differences in the social desirability of the two
15. Using this same threshold, we find that 59 percent are cross-pressured, either centrist on onedimension and extreme on the other or extreme on both in opposing directions, another 8 percentare misclassified conservatives, and 15 percent are misclassified liberals.

692 Treier and Hillygus
labels. Self-identified liberals have a stronger relationship between the eco-nomic and social dimensions on average than do the self-identified con-servatives. And slightly more conservatives fall outside their correspondingquadrant (38 percent compared to 35 percent). This pattern is consistent acrossthe various thresholds for the latent dimensions16, even as the majority of self-identified liberals and conservatives hold policy preferences consistent withtheir ideological labels across both dimensions. Very few liberals or conser-vatives are completely misclassified, holding opposing preferences on bothdimensions—fewer than 9 percent based on the quadrant classification andfewer than 3 percent based on the tercile classification.
In sum, this descriptive analysis indicates that, even in today’s polarized envi-ronment, the commonly asked survey question about ideological self-placementis inadequate for capturing the complex belief systems of a sizable portion ofthe American public. As political commentator Jim Hightower puts it: “Mostof us are mavericks, political mutts—each one of us a heady and sometimes hotmix of liberalisms, conservatisms and radicalisms” (Hightower 1997, p. 235).These political mutts often identify as political moderates, making it difficultto interpret the standard measure of ideology.
Predicting Use of Ideological Labels
The descriptive analysis above suggests that self-identified moderates are madeup of at least two very different kinds of people—policy centrists and theideologically cross-pressured. The key alternative perspective, however, is thatthe observed variation in economic and social preferences simply reflects alack of political sophistication. To account for this possibility, we estimate alogit model with the appropriate controls predicting an individual’s decision toselect the Moderate, Ideologue, or DK categories. To avoid arbitrary thresholds,we measure cross-pressured preferences as the product of the economic andsocial dimensions (multiplied by −1 so that values range from least to mostcross-pressured), so that the measure captures the ideological distance betweendimensions. We include in the model a measure of political knowledge toaccount for the possibility that moderate identification simply reflects politicalignorance, as hypothesized by Converse (1964).17 We also control for thepotential symbolic aspects of ideological labels with a strength of partisanshipmeasure (partisan versus independent) and the socialization and group identityaspects of ideological labels with demographic controls for race, gender, andage. Finally, we control for policy extremism on the individual economic andsocial dimensions.
16. For instance, 10 percent of self-identified liberals have preferences in the conservative tercileon at least one dimension, while 12 percent of conservatives have preferences in the liberal tercileon at least one dimension.17. Following Bartels (1996), we use the interviewer assessment of political knowledge.

The Nature of Political Ideology 693
The model results are estimated simultaneously with the IRT measures totake into account the measurement error involved in the estimation of ourlatent measures.18 Thus, if we have a lot of uncertainty in our estimate of theeconomic or social preferences of an individual—perhaps because of skippedquestions or a random response pattern—that uncertainty is carried over intothe subsequent model estimates. Simply including the latent measure withoutaccounting for the uncertainty in the estimate of that measure—the approachtypically used with factor scores from a traditional factor analysis—could resultin biased coefficient estimates. In this respect, our approach offers additionalreassurance that we are controlling for political knowledge by accounting forthe uncertainty in the latent measures (since some individuals are measuredwith more error than others).
The findings are reported in table 3. Reported are the coefficient estimatesand the 90 percent highest posterior density (HPD) intervals. This offers agauge of “significance” since we can say there is a 90 percent probability thatthe coefficient lies within the interval.19 Looking first at some of our politicalcontrols, we see that the decision to identify as a political moderate is relatedto many of the characteristics hypothesized in previous research. Partisans areless likely than independents to identify as moderates, and the more politicallyknowledgeable are less likely than the politically ignorant to call themselvesmoderate (and more likely to call themselves moderate than to say “Don’tKnow”). Even with all of these controls, though, being cross-pressured hasa sizable and significant effect on use of the moderate label. There is a 93percent probability that the cross-pressure coefficient is greater than zero forthe Moderate versus Ideologue comparison.20
To illustrate the substantive impact of policy cross-pressures, we graph infigure 4 a contour plot of predicted probabilities to show the variation in theprobability of identifying as a moderate across various levels of economic andsocial preferences. We see that those most cross-pressured (the darker areasin the image) have a higher elevation or probability of calling themselvesmoderate.21 Individuals who are the least cross-pressured (most ideologicallyextreme on both dimensions) have just a 10 percent chance of calling themselvesideological moderate, compared to a 25 percent chance among those with
18. The simultaneous estimation is implemented by imposing a standard multinomial logit modelfor self-placement as an ideologue, moderate, or DK alongside the measurement model (withparameters θ ), assuming vague normal priors on the logit coefficients (labeled γ ). The MCMCchain then updates the estimates of γ , given the previous estimates of θ , and θ is updated given theprevious estimates of γ .19. By contrast, with standard (frequentist) confidence intervals, we know only that 90 percent ofthe time the interval contains the true value; there is no indication of how likely a set of values are.20. There is an 89 percent probability that the coefficient is greater than zero for the DK v.Ideologue comparison.21. Estimates are made holding variables at their mean category or mode for indicator variables.

694 Treier and Hillygus
Tabl
e3.
Pred
ictin
gId
eolo
gica
lSel
f-Pl
acem
ent
All
resp
onde
nts
Kno
wle
dgea
ble
resp
onde
nts
Mod
erat
eve
rsus
Don
’tK
now
Mod
erat
eve
rsus
Mod
erat
eve
rsus
Don
’tK
now
Don
’tK
now
Ideo
logu
eve
rsus
Ideo
logu
eD
on’t
Kno
wId
eolo
gue
vers
usId
eolo
gue
vers
usM
oder
ate
Inte
rcep
t1.
292.
09−0
.81
0.88
−0.8
51.
73[0
.61,
2.01
][1
.27,
2.89
][−
1.63
,0.0
9][0
.12,
1.63
][−
1.88
,0.2
7][0
.64,
2.93
]A
ge0.
0074
0.01
7−0
.009
0.00
60.
019
−0.0
13[−
0.00
04,0
.015
][0
.009
,0.0
26]
[−0.
018,
−0.0
003]
[−0.
002,
0.01
5][0
.008
,0.0
3][−
0.02
4,0.
001]
Fem
ale
−0.1
40.
17−0
.31
−0.0
80.
34−0
.42
[−0.
38,0
.10]
[−0.
12,0
.45]
[−0.
63,0
.005
][−
0.36
,0.1
9][−
0.03
,0.7
0][−
0.80
,−0.
027]
Non
whi
te0.
0015
0.92
−0.9
00.
180.
94−0
.76
[−0.
34,0
.40]
[0.5
6,1.
28]
[−1.
31,−
0.48
][−
0.24
,0.5
8][0
.49,
1.39
][−
1.25
,−0.
25]
Sout
h−0
.11
0.28
−0.3
9−0
.15
0.48
−0.6
3[−
0.36
,0.1
4][−
0.01
,0.5
7][−
0.71
,−0.
055]
[−0.
46,0
.13]
[0.1
2,0.
85]
[−1.
02,−
0.23
]In
com
e−0
.017
−0.1
10.
09−0
.023
−0.2
20.
19[−
0.05
,0.0
17]
[−0.
15,−
0.05
][0
.03,
0.14
][−
0.06
,0.0
16]
[−0.
29,−
0.15
][0
.12,
0.27
]Pa
rtis
an−0
.88
−0.5
7−0
.30
−0.9
4−0
.49
−0.4
4[−
1.11
,−0.
61]
[−0.
87,−
0.29
][−
0.61
,0.0
3][−
1.22
,−0.
68]
[−0.
86,−
0.10
][−
0.86
,−0.
04]
Polit
ical
know
ledg
e−0
.17
−1.0
20.
85[−
0.29
,−0.
05]
[−1.
18,−
0.87
][0
.67,
1.01
]E
cono
mic
extr
emis
m−0
.81
−0.2
1−0
.60
−1.0
0−0
.29
−0.7
1[−
1.20
,−0.
44]
[−0.
61,0
.20]
[−1.
11,−
0.10
][−
1.41
,−0.
53]
[−0.
81,0
.19]
[−1.
29,−
0.08
]So
cial
extr
emis
m−0
.60
−0.0
6−0
.54
−0.6
2−0
.44
−0.1
8[−
1.02
,−0.
22]
[−0.
42,0
.32]
[−1.
00,−
0.03
][−
1.05
,−0.
16]
[−0.
95,0
.08]
[−0.
77,0
.44]
Cro
ss-p
ress
ure
0.23
0.16
0.07
0.19
0.26
−0.0
71[−
0.03
,0.4
9][−
0.05
,0.3
6][−
0.22
,0.3
8][−
0.01
,0.5
0][−
0.02
,0.5
7][−
0.45
,0.3
1]N
1,29
81,
008
Cor
rect
lypr
edic
ted
0.61
80.
645
[0.6
05,0
.632
][0
.630
,0.6
22]
Nai
ve(b
ym
ode)
0.55
60.
626
Prop
ortio
nal
0.11
10.
031
Red
uctio
nof
erro
r[0
.087
,0.1
36]
[0.0
063,
0.05
7]
NO
TE.—
Ent
ries
are
coef
ficie
nts,
90%
Hig
hest
Post
erio
rD
ensi
ty(H
PD)
inte
rval
sin
brac
kets
.

The Nature of Political Ideology 695
−1.5 −1.0 −0.5 0.0 0.5 1.0 1.5
−1.5
−1.0
−0.5
00
0.5
1.0
1.5
Economic Preferences
Soc
ial P
refe
renc
es
0.15
0.15
0.2
0.2
0.25
0.25
0.3
0.3
0.3
0.3
0.35
0.35
0.4
0.4
0.45
0.5
0.55
0.6
Liberal Conservative
Libe
ral
Con
serv
ativ
e
level curves are probabilitiesShading code for "Cross−Pressure"
Least Most
−3 −2 −1 0 1 2 3
Figure 4. Predicted Probability of Identifying as a Moderate.
the greatest ideological distance between their economic and social policypreferences (97.5th percentile of cross-pressures measure).22
As an additional robustness check, we have estimated the model only forthe politically knowledgeable respondents (rather than simply controllingfor them in the models), and find nearly identical results. Thus, even accountingfor symbolic considerations, political knowledge, and policy centrism, individ-uals with divergent economic and social preferences are more likely to callthemselves moderate than to use a liberal or conservative label. This findingoffers an important corrective to recent characterizations of the American pub-lic as being either centrist or polarized. The reality is that the belief systems ofthe mass public are more complex—and the label of ideological moderate sooften used to describe the American public represents a diverse set of policyattitudes.
Implications
The finding that the moderate label masks differences between policy centristsand cross-pressured respondents has consequences for our theories and models
22. Examining changes in the predicted probabilities across varying levels of values for all threevariables still finds that the individuals are most likely to identify as a moderate when they arecentrist on both dimensions or when they are cross-pressured between them.

696 Treier and Hillygus
of political behavior. Ideologically moderate voters, after all, are often at theheart of theories of electoral democracy. The classic median voter theorem, forinstance, predicts that moderates are the pivotal voters in the election, inducingpoliticians to advocate centrist public policies (Downs 1957). Moderates arealso considered the all-important swing voters willing to change candidatesupport across or within elections and, as such, hold the balance of power innational elections (Converse 1964). Following the 2006 midterm election, forexample, one analyst concluded: “the outcome of this election—and others inour recent history—was determined by the shifting sentiments of Independentsand moderates.”23 There is a clear tendency for scholars and journalists to treatpolitical moderates as a homogeneous group, painting broad strokes about theirattitudes and behavior. Yet, our analysis documents important heterogeneity inthe policy preferences of moderates that could well influence conclusions abouttheir voting behavior.
We evaluate this possibility empirically by comparing predictions across votechoice models that either include or exclude the latent ideology scores, whilecontrolling for ideological self-placement.24 As we see in figure 5, we can getwidely different predictions about the behavior of self-identified moderates. Thegraph plots the estimated error in individual predictions if we treat moderatesas homogeneous in their policy preferences. Across different combinationsof economic and social preferences, we find that an individual’s predictedprobability of voting for Bush can be off by as much as 38 percentage points.In contrast, predictions are off by no more than 7 percentage points for liberals(not statistically significant) and 13 percentage points for conservatives (rarelychanging predicted candidate choice). Consequently, while the standard self-placement scale may be adequate in summarizing the preferences of liberals andconservatives and predicting their political behavior, it performs quite poorlyfor self-identified moderates.
Beyond the example above, the complex contours of policy attitudes thatwe have identified may have a variety of consequences for studies of electoraldynamics. A more complete understanding of the structure and meaning ofideological identification could well change our expectations and conclusionsabout split ticket voting, political engagement, and campaign effects. More-over, recognizing the distinction between policy centrists and the ideologicallycross-pressured might affect our basic theories about candidate behavior, sincecentrists and cross-pressured respondents may be responsive to very differentcampaign strategies (Hillygus and Shields 2008).
23. Andrew Kohut, “The Real Message of the Midterms,” Pew Center Report November 14, 2006.24. The logit model is again estimated simultaneously with IRT measures and includes partyidentification, age, gender, race, income, and an indicator for the South. Predicted probabilitiesare calculated holding all other variables at their means or modes. The full set of coefficients areavailable in an online appendix on the POQ website. The results do not change when the liberalconservative scale is replaced by dummy variables.

The Nature of Political Ideology 697
−1.5 −1.0 −0.5 0.0 0.5 1.0
−0.3
−0.2
−0.1
0.0
0.1
0.2
0.3
−0.3
−0.2
−0.1
0.0
0.1
0.2
0.3
0.4
Economic Policy Preferences
Diff
eren
ce in
Pre
dict
ed P
roba
bilit
y
Social
25%Median75%
−1.5 −1.0 −0.5 0.0 0.5 1.0
Social Policy Preferences
Diff
eren
ce in
Pre
dict
ed P
roba
bilit
y
Economic
25%Median75%
Figure 5. Error in the Predicted Probability of a Bush Vote.
Discussion
Given the current polarized nature of American politics, renewed attention hasbeen focused on the ideological preferences of the mass public. Yet, the waywe conceptualize and measure those preferences shapes our conclusions abouttheir distribution and influence.
Our analysis documents the multidimensional nature of policy preferences inthe American electorate, and finds a noteworthy number in the public are liberalon one dimension and conservative on another. Because these cross-pressuredindividuals tend to call themselves moderate (or say DK), it undermines inter-pretation of the standard 7-point ideological identification scale so often usedin political research. Thus, even as scholars find that ideological labels are moremeaningful than ever before, those labels are accurate representations of policypreferences only for those self-identifying as a liberal or conservative.
We are by no means the first to acknowledge that ideological self-placementis a flawed measure because of mismatches between ideological identificationand policy preferences. But in contrast to early research, we cannot attribute thedisconnect between self-reported ideology and issue attitudes to the lack of po-litical knowledge alone. Rather, many people are coherent along the economicand social dimension separately, but are simply cross-pressured between them.
Our results show that failing to account for the multidimensional nature ofideological preferences can produce inaccurate predictions of voting behavior

698 Treier and Hillygus
for the plurality of Americans who do not call themselves liberal or conserva-tive. As such, we recommend that future research use distinct measures of socialand economic preferences in empirical models of mass behavior. Since the stan-dard approach to measuring ideology has been to ask about identification alonga unidimensional scale, it would be particularly fruitful for scholars to explorethe potential for including direct measures of preferences across multiple ideo-logical dimensions as an alternative to creating issue-based measures used here(see Hooghe, Marks, and Wilson 2002 for example with European elites). Untila set of valid and reliable survey questions are identified, researchers shouldinclude a large and diverse set of policy items on their survey questionnairesso that issue-based scales can be created.
To be sure, our findings do not imply that the ideological self-placementmeasure should never be used. Scholars have long noted the symbolic im-portance of liberal and conservative labels (Stimson 2004), and our resultssuggest that these labels are meaningful representations of policy preferencesfor self-identified liberals and conservatives. However, researchers should atleast operationalize ideological self-placement as a series of dummy variablesin their empirical models since the measure cannot be assumed to be an ordinalscale with political moderates in the middle. And even then, this approach can-not distinguish between so-called moderates who are centrist and those who arecross-pressured, making it inadequate for any theory or model that is dependenton a measure of policy centrism.
Beyond these practical implications, these findings are relevant to the on-going polarization debate. On one side are those who say that political moder-ates have either followed political elites to the ideological extremes or, frustratedby the polarized environment, have dropped out of the political process alto-gether (Abramowitz and Saunders 1998, 2005; Layman and Carsey 2002). Onthe other side are those who contend that the majority of Americans have re-mained ideologically centrist even as political elites have grown more polarized(Dimaggio, Evans, and Bryson 1996; Fiorina 2004). It turns out that neitherportrait of the American moderate is entirely accurate. Our findings make clearthat the American public is not as ideologically extreme as often portrayed, butnor are they truly centrist. And the heterogeneous political complexion of theAmerican public has consequences for the way we measure political ideologyand the way we use it in our theories and models of political behavior.
Appendix
2000 AMERICAN NATIONAL ELECTION STUDY
The 2000 ANES was conducted by the Center for Political Studies of theInstitute for Social Research. The preelection survey was conducted fromSeptember 5 to November 6, and the postelection re-interview ran from

The Nature of Political Ideology 699
November 8 to December 18. The study population was all U.S. citizens ofvoting age living in the forty-eight contiguous states. The sampling design wasa dual frame sample that included both a traditional area probability samplingusing face-to-face (FTF) interviews (1,006 pre respondents) as well as a RDDstratified equal probability sample interviewed by telephone (801 prerespon-dents). The response rates, calculated as the ratio of completed interviews tothe total number of potential respondents, were 64.8 percent for FTF and 57.2percent for phone for preelection and 57.2 percent for FTF and 85.8 percentfor phone for postelection. More details about the methodology are availableat http://www.electionstudies.org/studypages/2000prepost/2000prepost.htm.
QUESTION WORDING
All variables were recoded to run from liberal to conservative. Question wordingfor model controls are available in an online appendix on the POQ website.
Ideological self-placement measures: Liberal-Conservative Scale(V001368/V000440/VCF0803) [FTF]: “Where would you place yourself onthis scale, or haven’t you thought much about this? Scale: (1) extremely liberal,(2) liberal, (3) slightly liberal, (4) moderate; middle of the road, (5) slightlyconservative, (6) conservative, (7) extremely conservative.” [phone]: “Whenit comes to politics, do you usually think of yourself as extremely liberal,liberal, slightly liberal, moderate or middle of the road, slightly conservative,conservative, extremely conservative, or haven’t you thought much aboutthis?”; Liberal-Conservative Branching Measure (V000446) (FTF and phone):“When it comes to politics, do you usually think of yourself as a liberal, aconservative, a moderate, or haven’t you thought much about this? If you hadto choose, would you consider yourself a liberal or a conservative? Wouldyou call yourself a strong liberal or a not very strong liberal? Would you callyourself a strong conservative or a not very strong conservative?”
Issue questions: V000748: “Do you think gay or lesbian couples, in otherwords, homosexual couples, should be legally permitted to adopt children?”;V000545: [FTF] “Where would you place yourself on this scale, or haven’tyou thought much about this? (1–7 scale) 1 govt should provide many fewerservices, 7 govt should provide many more services”; V000549: [phone]“Which is closer to the way you feel or haven’t you thought much about this?Should the government reduce/increase services and spending a great deal or(reduce/increase services and spending) only some.”; V000609: [FTF] “Wherewould you place yourself on this scale, or haven’t you thought much aboutthis? 1–7 scale, 1 govt insurance plan, 7 private insurance plan”; V000610:[phone] “Which is closer to the way you feel or haven’t you thought muchabout this? do you feel strongly or not strongly that there should be a gov-ernment insurance plan?/do you feel strongly or not strongly that individuals

700 Treier and Hillygus
should pay through private insurance plan?”; V000615: [FTF] “Where wouldyou place yourself on this scale, or haven’t you thought much about this? 1–7scale: 1. govt should see to jobs and standard of living 7. govt should let eachperson get ahead on own.”; V000619: [phone] “Which is closer to the wayyou feel or haven’t you thought much about this? Do you feel strongly that thegovernment should see to it that every person has a job and a good standardof living, or not so strongly? Do you feel strongly that the government shouldjust let each person get ahead on their own, or not so strongly?”; V000674a:[standard version] “Some people think that if a company has a history of dis-criminating against blacks when making hiring decisions, then they should berequired to have an affirmative action program that gives blacks preference inhiring. What do you think? Should companies that have discriminated againstblacks have to have an affirmative action program? [EXPERIMENTAL VER-SION] Some people think that if a company has a history of discriminatingagainst blacks when making hiring decisions, then they should be required tohave an affirmative action program that gives blacks preference in hiring. Whatdo you think? Should companies that have discriminated against blacks haveto have an affirmative action program or should companies not have to havean affirmative action program? [BOTH VERSIONS] Do you feel strongly ornot strongly (that they should not have to have affirmative action)?”; V000676:“Should federal spending on welfare programs be increased, decreased, or keptabout the same?”; V000680: “Should federal spending on aid to poor peoplebe increased, decreased, or kept about the same?”; V000681: “Should federalspending on social security be increased, decreased, or kept about the same?”;V000683: “Should federal spending on public schools be increased, decreased,or kept about the same?”; V000690: “Some people have proposed that most ofthe expected federal budget surplus should be used to cut taxes. Do you approveor disapprove of this proposal? Do you approve of this proposal strongly ornot strongly? Do you disapprove of this proposal strongly or not strongly?”;V000694: [FTF] “There has been some discussion about abortion during recentyears. Which one of the opinions on this page best agrees with your view? Youcan just tell me the number of the opinion you choose. [PHONE] There hasbeen some discussion about abortion during recent years. I am going to readyou a short list of opinions. Please tell me which one of the opinions best agreeswith your view? You can just tell me the number of the opinion you choose.options: (1) by law, abortion should never be permitted. (2) the law should per-mit abortion only in case of rape, incest or when the woman’s life is in danger.(3) the law should permit abortion for reasons other than rape, incest, or dangerto the woman’s life, but only after the need for the abortion has been clearlyestablished. (4) by law, a woman should always be able to obtain an abortion asa matter of personal choice.”; V000702: “Would you favor or oppose a law inyour state that would require a teenage girl under age 18 to receive her parent’spermission before she could obtain an abortion? Strongly or not strongly?”;V000705: “There has been discussion recently about a proposed law to ban

The Nature of Political Ideology 701
certain types of late-term abortions, sometimes called partial birth abortions.Do you favor or oppose a law that would make these types of abortions illegal?Do you strongly or not strongly favor/oppose a law that would that would makethese types of abortions illegal?; V000727: “Do you think homosexuals shouldbe allowed to serve in the United States Armed Forces or don’t you think so?Do you feel strongly or not strongly that homosexuals should be allowed toserve? Do you feel strongly or not strongly that homosexuals should not beallowed to serve?”; V000731: “Do you think the federal government shouldmake it more difficult for people to buy a gun than it is now, make it easierfor people to buy a gun, or keep these rules about the same as they are now?A lot easier/more difficult or somewhat easier/more difficult?”; V000752: “Doyou favor or oppose the death penalty for persons convicted of murder? (Doyou favor/oppose the death penalty for persons convicted of murder) stronglyor not strongly?”; V000755: [FTF standard] “Where would you place yourselfon this scale, or haven’t you thought much about this? [FTF experimental]where would you place yourself on this scale? 1–7 scale: 1. women and menshould have equal roles, 7. a woman’s place is in the home.”; V000759: [phoneversion 1] “Which is closer to the way you feel, or haven’t you thought muchabout this? [phone version 2] which is closer to the way you feel? [both phoneversions] Do you feel strongly or not strongly that men and women should haveequal roles? Do you feel strongly or not strongly that a woman’s place is inthe home?”; V000771: [FTF] “Where would you place yourself on this scale,or haven’t you thought much about this? 1–7 scale: 1. tougher regulations onbusiness needed to protect environment, 7. regulations to protect environmentalready too much a burden on business.”; V000775: [Phone] “Which is closerto the way you feel, or haven’t you thought much about this? Do we need totoughen regulations to protect the environment a lot, or just somewhat? Areregulations to protect the environment way too much of a burden on businessor just somewhat of a burden?”
Supplementary Data
Supplementary data are available online at http://poq.oxfordjournals.org/
References
Abramowitz, Alan I., and Kyle L. Saunders. 1998. “Ideological Realignment in the U.S. Electorate.”Journal of Politics 60(3):634–52.
Abramowitz, Alan, and Kyle Saunders. 2005. “Why Can’t We All Just Get Along? The Realityof a Polarized America.” The Forum: A Journal of Applied Research in Contemporary Politics3(2):1–24.
Achen, Christopher H. 1975. “Mass Political Attitudes and the Survey Response.” AmericanPolitical Science Review 69(4):1218–31.

702 Treier and Hillygus
Aguilar, Omar, and Mike West. 2000. “Bayesian Dynamic Factor Models and Portfolio Allocation.”Journal of Business & Economic Statistics 18(3):338–57.
Aldrich, John, John Griffin, and Amy McKay. 2002. “Apples and Oranges: Comparing Forum andFormat on the National Election Studies.” Duke University.
Aldrich, John, Richard G. Niemi, George Rabinowitz, and David W. Rohde. 1982. “The Measure-ment of Public Opinion about Public Policy: A Report on Some New Issue Question Formats.”American Journal of Political Science 26(2):391–414.
Alvarez, R. Michael, and John Brehm. 1995. “American Ambivalence towards Abortion Policy:Development of a Heteroskedastic Probit Model of Competing Values.” American Journal ofPolitical Science 39(4):1055–82.
Ansolabehere, Stephen, Jonathan Rodden, and James Snyder. 2008. “The Strength of Issues: UsingMultiple Measures to Gauge Preference Stability, Ideological Constraint, and Issue Voting.”American Political Science Review 102(2):215–32.
Bartels, Larry. 1996. “Uninformed Voters: Information Effects in Presidential Elections.” AmericanJournal of Political Science 40(1):194–230.
Carmines, Edward, and Michael Ensley. 2004. “Strengthening and Weakening Mass Partisanship:Issue Preferences and Partisan Attitudes in an Increasingly Polarized Party System.” MidwestPolitical Science Association, Chicago.
Carmines, Edward G., and James A. Stimson. 1989. Issue Evolution: Race and the Transformationof American Politics. Princeton, NJ: Princeton University Press.
Conover, Pamela Johnston, and Stanley Feldman. 1981. “The Origins and Meaning of Liberal/Conservative Self-Identifications.” American Journal of Political Science 25(4):617–45.
Conover, Pamela Johnston, and Stanley Feldman. 1984. “How People Organize the Political World:A Schematic Model.” American Journal of Political Science 28(1):95–126.
Converse, Philip E. 1964. “The Nature of Belief Systems in Mass Publics.” In Ideology andDiscontent, ed. David E. Apter. New York: The Free Press.
Dimaggio, Paul, John Evans, and Bethany Bryson. 1996. “Have Americans’ Social AttitudesBecome More Polarized?” American Journal of Sociology 102(3):690–755.
Downs, Anthony. 1957. An Economic Theory of Democracy. New York: Harper Collins.Fiorina, Morris. 2004. Culture War? The Myth of a Polarized America. New York: Pearson Long-
man.Free, Lloyd, and Hadley Cantril. 1967. The Political Beliefs of Americans: A Study of Public
Opinion. New Brunswick, NJ: Rutgers University Press.Gill, Jeff. 2008. Bayesian Methods. 2nd ed. New York: Chapman and Hall/CRC Press.Heath, Anthony, Geoffrey Evans, and Jean Martin. 1994. “The Measurement of Core Beliefs and
Value.” British Journal of Political Science 24(1):115–32.Hightower, Jim. 1997. There’s Nothing in the Middle of the Road but Yellow Stripes and Dead
Armadillos. New York: HarperCollins.Hillygus, D. Sunshine, and Todd Shields. 2008. The Persuadable Voter. Princeton, NJ: Princeton
University Press.Hinich, Melvin J., and Michael C. Munger. 1997. Analytical Politics. Cambridge: Cambridge
University Press.Hooghe, L., G. Marks, and C. J. Wilson. 2002. “Does Left/Right Structure Party Positions on
European Integration.” Comparative Political Studies 35(8):965–89.Inglehart, Ronald. 1997. Modernization and Postmodernization: Cultural, Economic, and Political
Change in 43 Societies. Princeton, NJ: Princeton University Press.Jackman, Simon. 2000. “Estimation and Inference via Bayesian Simulation: An Introduction to
Markov Chain Monte Carlo.” American Journal of Political Science 44(2):375–404.Jackman, Simon. 2004. “Bayesian Analysis for Political Research.” Annual Review of Political
Science 7:483–505.Jacoby, William. 1991. “Ideological Identification and Issue Attitudes.” American Journal of
Political Science 35(1):178–205.

The Nature of Political Ideology 703
Jacoby, William. 2004. “Ideology in the 2000 Elections: A Study in Ambivalence.” In Models ofVoting in Presidential Elections, eds. Herbert Weisberg, and Clyde Wilcox. Stanford: StanfordUniversity Press.
Kaplan, David. 2004. The Sage Handbook of Quantitative Methodology for the Social Sciences.Newbury Park, CA: Sage.
Kerlinger, Fred. 1984. Liberalism and Conservatism: The Nature and Structure of Social Attitudes.NJ: Hillsdale.
Knight, Kathleen. 1999. “Liberalism and Conservatism.” In Measures of Political Attitudes, eds.J. P. Robinson, L. S. Wrightsman, and P. R. Shaver. San Diego, CA: Academic.
Layman, Geoffrey. 1999. “Culture Wars in the American Party System: Religious and CulturalChange Among Partisan Activists Since 1972.” American Politics Research 27(1):89–121.
Layman, Geoffrey, and Tom Carsey. 2002. “Party Polarization and ‘Conflict Extension’ in theAmerican Electorate.” American Journal of Political Science 46(4):786–802.
Levendusky, Matt. 2009. The Partisan Sort: How Liberals Became Democrats and ConservativesBecame Republicans. University of Chicago Press.
Levine, Jeffrey, Edward Carmines, and Robert Huckfeldt. 1997. “The Rise of Ideology in thePost-New Deal Party System, 1972–1992.” American Politics Research 25(1):19–34.
Levitin, Teresa E., and Warren E. Miller. 1979. “Ideological Interpretations of Presidential Elec-tions.” American Political Science Review 73(3):751–71.
Lunn, David J., Andrew Thomas, Nicky Best, and David J. Spiegelhalter. 2000. “WinBUGS—ABayesian Modelling Framework: Concepts, Structure, and Extensibility.” Statistics and Com-puting 10(4):325–37.
Marcus, George E., David Tabb, and John L. Sullivan. 1974. “The Application of IndividualDifferences Scaling to the Measurement of Political Ideologies.” American Journal of PoliticalScience 18(2):405–20.
McCarty, Nolan, Keith Poole, and Howard Rosenthal. 2006. Polarized America: The Dance ofIdeology and Unequal Riches. MIT Press.
Miller, Alan S. 1992. “Are Self-Proclaimed Conservatives Really Conservative? Trends in Attitudesand Self-Identification among the Young.” Social Forces 71(1):195–210.
Robinson, John, and John Fleishman. 1988. “Ideological Identification: Trends and Interpretationsof the Liberal-Conservative Balance.” Public Opinion Quarterly 52(1):134–45.
Schuman, Howard, and Stanley Presser. 1981. Questions and Answers in Attitude Surveys. NewYork: Academic.
Shafer, Byron E., and William J. M. Claggett. 1995. The Two Majorities: The Issue Context ofAmerican Politics. Johns Hopkins University Press.
Stimson, James. 2004. Tides of Consent. New York: Cambridge.Stone, Walter. 1991. “On Party Switching among Presidential Activists: What do We Know?”
American Journal of Political Science 35(3):598–607.Treier, Shawn and Simon Jackman. 2008. “Democracy as a Latent Variable.” American Journal of
Political Science 52(1): 201–217.